Advances in Clinical and Experimental Medicine

Title abbreviation: Adv Clin Exp Med
JCR Impact Factor (IF) – 2.1
5-Year Impact Factor – 2.2
Scopus CiteScore – 3.4 (CiteScore Tracker 3.7)
Index Copernicus  – 161.11; MNiSW – 70 pts

ISSN 1899–5276 (print)
ISSN 2451-2680 (online)
Periodicity – monthly

Download original text (EN)

Advances in Clinical and Experimental Medicine

Ahead of print

doi: 10.17219/acem/166043

Publication type: original article

Language: English

License: Creative Commons Attribution 3.0 Unported (CC BY 3.0)

Download citation:

  • BIBTEX (JabRef, Mendeley)
  • RIS (Papers, Reference Manager, RefWorks, Zotero)

Cite as:


Cheng H, Huang W, Huang X, Miao W, Huang Y, Hu Y. The triglyceride glucose index predicts short-term mortality in non-diabetic patients with acute heart failure [published online as ahead of print on June 16, 2023]. Adv Clin Exp Med. 2024. doi:10.17219/acem/166043

The triglyceride glucose index predicts short-term mortality in non-diabetic patients with acute heart failure

Hongji Cheng1,2,D, Weijun Huang1,A, Xiaohui Huang1,B, Wang Miao1,C, Yuli Huang1,E, Yunzhao Hu1,F

1 Department of Cardiology, Shunde Hospital, Southern Medical University (The First People’s Hospital of Shunde), Foshan, China

2 Department of Cardiology, Panyu District He Xian Memorial Hospital, Guangzhou, China

Graphical abstract


Graphical abstracts

Abstract

Background. The triglyceride glucose index (TyG) has previously been considered a reliable indicator of insulin resistance (IR) and an independent prognostic predictor in heart failure (HF).

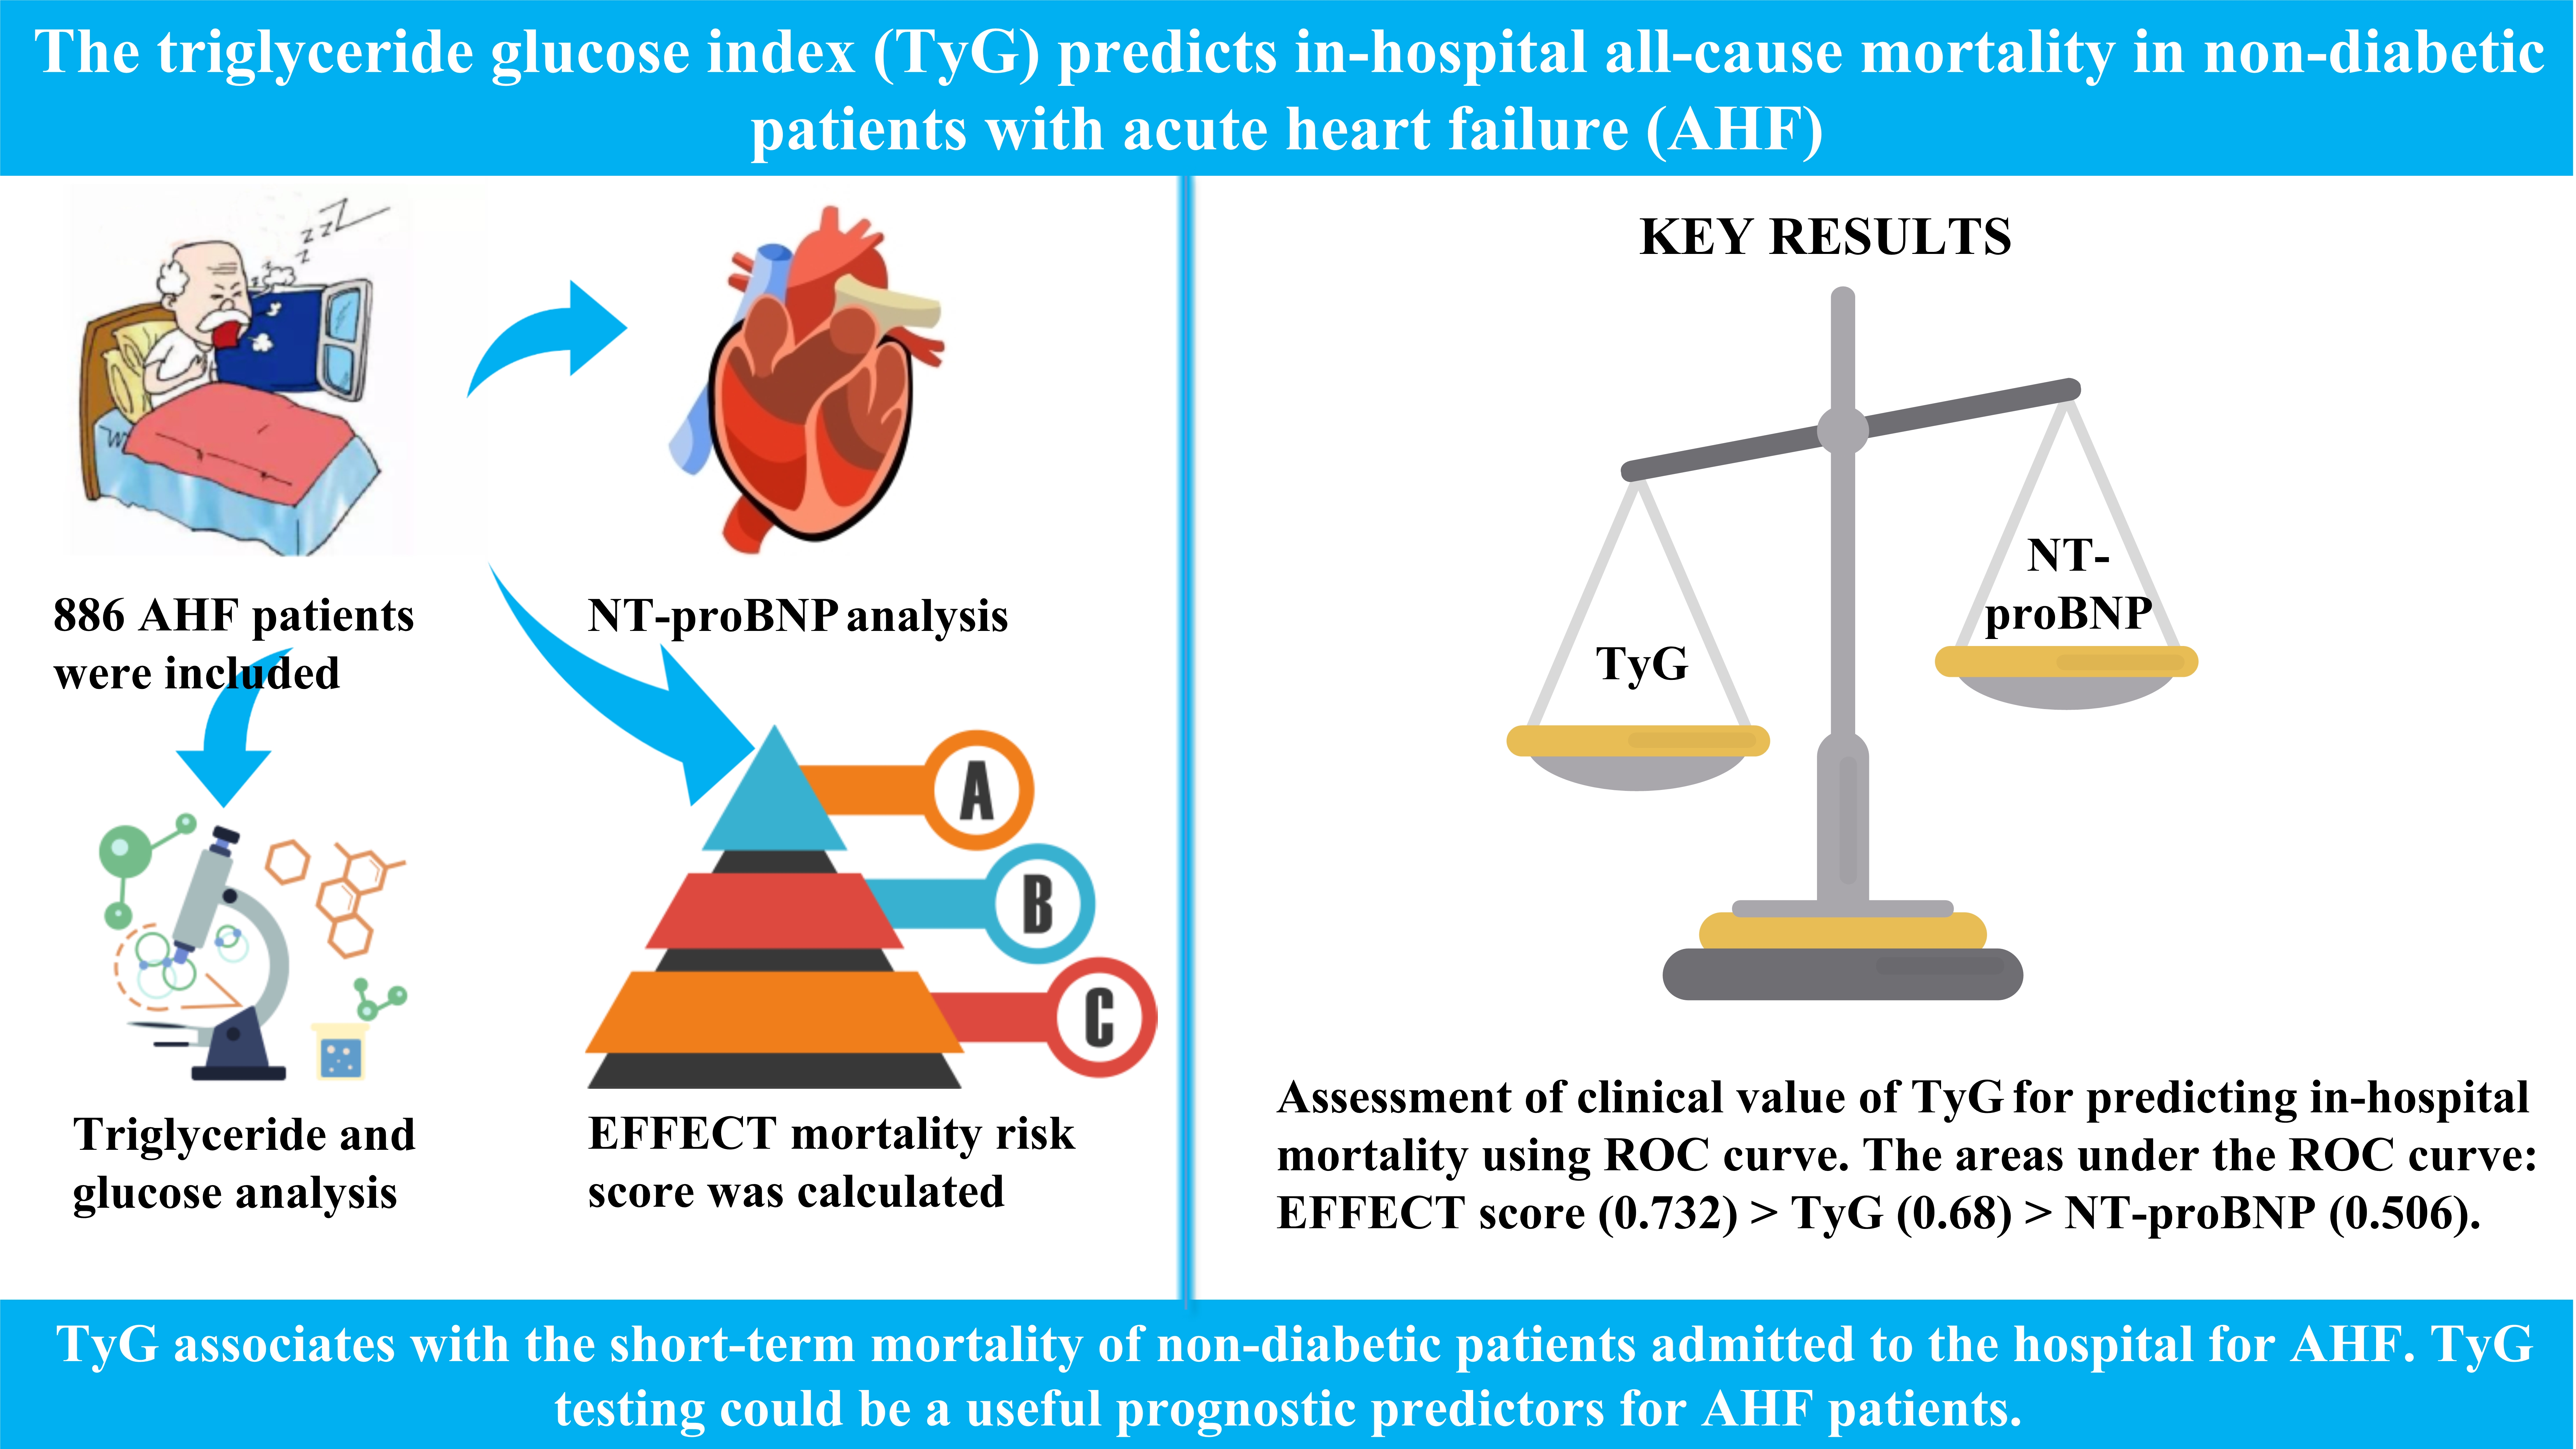
Objectives. To clarify the association between the TyG and short-term death in non-diabetic patients admitted for acute heart failure (AHF).

Materials and methods. We examined 886 out of 1620 consecutive AHF patients who were admitted to Shunde Hospital, Southern Medical University, Foshan, China, from June 1, 2014, to June 1, 2022. The median of the patients’ TyG values was used to divide them into 2 groups. The following formula was used to calculate the TyG: ln [fasting triglycerides (mg/dL) × fasting glucose (mg/dL)/2]. The data on all-cause mortality of AHF patients during their hospital stay were collected. The 30-day Enhanced Feedback for Effective Cardiac Treatment (EFFECT) death risk score was used to assess the risk of death.

Results. The TyG level was positively correlated with a poor AHF prognostic marker (N-terminal B-type natriuretic peptide (NT-proBNP)) (ρ = 0.207, p < 0.001) and negatively correlated with a protective marker (serum albumin) (ρ = −0.43, p < 0.001). Higher TyG values were associated with an elevated EFFECT score and hospital mortality (p < 0.001). According to multivariate logistic regression analysis, higher TyG levels raised the risk of death in hospital (odds ratio (OR) = 1.73; 95% confidence interval (95% CI): 1.03–3.27; p = 0.031) after adjusting for multiple variables, including age, EFFECT score and NT-proBNP. The TyG had a greater area under the receiver operating characteristic (ROC) curve (AUC: 0.688) for predicting hospital death compared to NT-proBNP (AUC: 0.506).

Conclusions. Our findings show that the TyG is associated with the short-term mortality rate of non-diabetic patients admitted to the hospital for AHF. The TyG testing could be a useful prognostic indicator for these patients.

Key words: acute heart failure, all-cause mortality, triglyceride glucose index, non-diabetics, prognostic value

Background

Acute heart failure (AHF) is a severe form of cardiovascular disease with a high mortality rate. Short-term mortality rates in clinical research patients vary from 12% to 18%.1, 2, 3, 4 To improve the effectiveness and safety of clinical decision-making, multivariate risk models using demographic information, visible symptoms and lab testing have been found to estimate the risk of AHF mortality.5, 6, 7, 8 Identifying AHF indicators for risk prediction and medical guidance may enhance AHF treatment overall.

It is recognized that insulin resistance (IR) and cardiac incidents in non-diabetics are associated.9 Heart failure (HF) can either trigger new-onset IR or worsen a pre-existing one.10, 11 It is generally believed that neurohormonal alterations, elevated oxygen consumption and fundamental muscular tissue alterations in HF may reduce the efficiency of insulin in promoting glucose uptake and utilization, so these deviations may be related to IR.12, 13, 14, 15 However, the relationship between IR and short-term prognosis has yet to be investigated in non-diabetic patients with AHF.

The triglyceride glucose index (TyG) has previously been considered a straightforward and dependable method for IR measurement.12, 16, 17 Numerous investigations have demonstrated that the TyG is more effective than the Homeostasis Model Assessment of IR (HOMA-IR) test.13, 14, 15 The incidence of hypertension (HTN), arterial atherosclerosis, cardiac arterial disease, and various cardiac disorders are all closely related to the TyG.18, 19, 20, 21, 22 Furthermore, the TyG is a trustworthy and practical indicator of a poor prognosis in individuals with cardiac illnesses.23, 24, 25

Objectives

We conducted a retrospective cohort study to ascertain the connection between the TyG and short-term prognosis in AHF patients without diabetes.

Materials and methods

Study design and participants

A total of 1620 consecutive AHF patients admitted to Shunde Hospital, Southern Medical University, Foshan, China, from June 1, 2014, to June 1, 2022, were considered for inclusion in the study. Acute heart failure was defined according to the 2021 European Society of Cardiology (ESC) Guidelines.26 A total of 734 of the 1620 patients were excluded because they met one or more exclusion criteria, such as: 1) diabetes; 2) acute coronary syndrome; 3) age <18 years; 4) lost to follow-up; and 5) lack of data upon admission. Thus, this investigation ultimately included 886 patients (Figure 1). The research was carried out in accordance with the Declaration of Helsinki and with the permission of Shunde Hospital, Southern Medical University (approval No. 20190906). All study participants were provided with information about the study and signed relevant consent forms.

Setting and variables

The electronic health record system was used to collect patient demographic data, health history, lab testing results, and echocardiographic metrics. In addition, we collected the medication status of patients upon admission, including vasoactive drugs (norepinephrine, phentolamine, dopamine, dobutamine, and nitroglycerin), angiotensin-converting enzyme inhibitors/angiotensin receptor antagonists (i.e., renin–angiotensin system inhibitors (RASIs)), β-blockers, statins, diuretics, and mineralocorticoid receptor antagonists (MRAs). Moreover, we collected compliance with recommended doses of RASIs, β-blockers and MRAs at discharge.

After overnight fasting (>8 h) at admission, the first sample of peripheral venous blood was drawn and measured in the lab. Hypertension was defined as systolic blood pressure (SBP) higher than 140 mm Hg and/or diastolic blood pressure (DBP) higher than 90 mm Hg, the use of any antihypertensive therapy, or previously diagnosed HTN.

N-terminal B-type natriuretic peptide (NT-proBNP), hemoglobin A1c (HbA1c), total cholesterol (TC), glucose, C-reactive protein (CRP), creatinine, blood urea nitrogen (BUN), serum sodium (Na), hemoglobin (Hb), triglycerides (TG), serum albumin, low-density lipoprotein cholesterol (LDL-C), alanine aminotransferase (ALT), aspartate transaminase (AST), serum bilirubin, lactate, high sensitivity cardiac troponin (hs-cTn), and gamma-glutamyl transpeptidase (GGT) were measured.

Data sources and measurements

Estimated glomerular filtration rate (eGFR) levels were calculated using the Chronic Kidney Disease Epidemiology Cooperation (CKD-EPI) algorithm.27 The Enhanced Feedback for Effective Cardiac Treatment (EFFECT) mortality risk score was used to calculate the risk of death. This risk prediction method is meant for patients who present with HF in a hospital setting, and it can stratify the risk within hours of hospital presentation. Risk scores are divided into 5 categories: extremely low risk (≤60), low risk (61–90), moderate risk (91–120), high risk (121–150), and very high risk (>150).8 The following formula was used to calculate the TyG: ln [fasting triglyceride (mg/dL) × fasting plasma glucose (mg/dL)/2].

Bias management

In order to avoid the potential of diabetes mellitus (DM) contributing to bias in the results, we routinely performed oral glucose tolerance tests (OGTTs) in patients with a predisposition to DM; OGTT results or a self-reported history of DM were used to identify DM.

Statistical analyses

The mean ± standard deviation (M ±SD) and median (Me) (interquartile range (IQR)) of continuous variables with normal and skewed distributions, respectively, were determined. Categorical variables were expressed using numbers.

According to the median of the TyG, patients were divided into 2 groups: D1: low-TyG group (TyG ≤ 9.44) and D2: high-TyG group (TyG > 9.44). Among the 2 groups, continuous variables were compared using analysis of variance (ANOVA) or the Kruskal–Wallis test. The χ2 test was used to compare categorical variables among the groups.

To evaluate the connections between the 2 variables, Spearman’s correlation coefficient (ρ) was used. To examine the link between the TyG and in-hospital mortality, variables were selected using the univariate analysis accompanied by multivariate logistic regression models. With a variance inflation factor cutoff of 10, the multicollinearity of multivariate models was examined. The adjusted variables were chosen in an “enter” fashion for the various multivariate models according to the single-factor analysis results and clinical parameters, including age, cardiogenic shock, atrial fibrillation (AF), use of vasoactive drugs, HF etiologies (including coronary heart disease (CHD), hypertensive heart disease, any cardiomyopathy, and any valvular heart disease), chronic obstructive pulmonary disease (COPD), HbAlc, NT-proBNP, and EFFECT score. Four multivariable regression models remained in the end: Model 1 – age; Model 2 – age adjustment in addition to the comorbidities of cardiogenic shock, AF, COPD, and the use of vasoactive drugs; Model 3 – adjustment for variables involved in Model 2 + HF etiologies, including CHD, hypertensive heart disease, any cardiomyopathy, and any valvular heart disease; Model 4 – adjustment for variables involved in Model 3 + HbA1c, EFFECT score, NT-proBNP, ALT, serum bilirubin, and hs-cTn. Finally, an additional model (Model 5) was constructed, adjusted for all the variables that differed between the groups, as shown in Table 1. Additionally, we calculated odds ratios (ORs) and 95% confidence intervals (95% CIs). A receiver operating characteristic (ROC) curve was drawn to show the predictive value of TyG on mortality. The area under the ROC curve (AUC) was determined through calculations.

All data were analyzed using IBM SPSS Statistics for Windows v. 26.0 (IBM Corp., Armonk, USA). A p-value <0.05 was used to indicate statistical significance.

Results

General characteristics of the patients

A total of 886 AHF candidate patients from an initial sample of 1620 were included in the research. Table 1 shows the participants’ baseline information after being divided into 2 groups according to the median of their TyG values. The high-TyG group patients were older, had lower serum albumin levels and higher EFFECT mortality risk scores (all p < 0.05). Furthermore, more patients in the high-TyG group suffered from cardiogenic shock and required vasoactive drugs (all p < 0.001). In addition, the high-TyG group patients had consistently higher hospital all-cause mortality rates (p < 0.001).

The mean age of all patients was 71 years, and 55.5% were male.

The ratios of patients with HTN, cardiogenic shock, CHD, COPD, cerebrovascular accident (CVA), and AF, as well as NT-proBNP, glucose, TC, TG, LDL-C, left ventricular end-diastolic diameter (LVEDD), left atrial diameter (LAD), ALT, and serum bilirubin were significantly higher in the high-TyG group compared to the low-TyG group (all p < 0.05) (Table 1).

Correlation between the TyG and major clinical indicators

The TyG level was found to be positively correlated with the EFFECT score and NT-proBNP, and negatively correlated with serum albumin (Table 2).

Short-term mortality risk scores for patients with elevated TyG levels

The EFFECT mortality risk scores of patients with high TyG levels were higher than those in the low-TyG group (Figure 2A). Higher TyG levels were correlated with higher EFFECT mortality risk scores (Figure 2B).

Association between the TyG and mortality risk

To further examine the predictive value of the TyG on in-hospital mortality, multi- and univariate logistic regression analyses were performed. In Model 1, after adjusting for age, in-hospital mortality was strongly correlated with high TyG when compared to low TyG (OR = 2.15; 95% CI: 1.47–3.16; p = 0.013). In Models 2 and 3, the association between in-hospital mortality and high TyG remained significant (Model 2: OR = 1.59; 95% CI: 1.18–2.24; p = 0.039; Model 3: OR = 1.89; 95% CI: 1.13–3.47; p = 0.023). A similar result was observed in Model 4 after additional adjustments for clinical factors that were found to be significantly connected with in-hospital mortality in a single-factor analysis (OR = 1.51; 95% CI: 1.06–3.21; p = 0.042). In Model 5, after adjusting for all variables that differed between the groups in Table 1 (p < 0.05), the TyG had no predictive value for in-hospital mortality (OR = 2.56; 95% CI: 1.87–4.17; p = 0.651) (Table 3).

The TyG has practical significance in predicting in-hospital all-cause mortality

The clinical value of the TyG for predicting in-hospital mortality of AHF patients was evaluated using ROC curve analysis. Even though the TyG value for predicting in-hospital mortality did not exceed that of the EFFECT mortality risk score, which included 10 conditions, this variable outperformed NT-proBNP (Figure 3).

Discussion

We initially proved a connection between the TyG and the risk of in-hospital all-cause mortality in non-diabetic AHF patients. Patients with increased TyG levels were found to be more likely to die in hospital. According to the findings, the TyG was an independent predictor of in-hospital mortality in AHF patients. Most importantly, this study suggests a simple but efficient approach for assessing IR in non-diabetic patients with AHF to enhance the risk stratification of in-hospital mortality rates.

Acute heart failure is a common and severe disease with high mortality and morbidity that is placing an increasing burden on the world’s public healthcare system.28 There is an urgent need for new biological markers, mechanisms and treatments for AHF. Previous research has demonstrated that IR is common in HF patients and accelerates the advancement of the disease.29

Insulin resistance is linked to heart disease risk in diverse demographics, as it changes substrate metabolic activity and leads to ineffective energy metabolism, inducing subcellular component abnormalities, promoting improper initiation of the sympathetic nervous system and the renin–angiotensin–aldosterone system, and touching off innate immune infiltration and phagocytosis.30 The HOMA-IR is a relatively comprehensive approach for evaluating IR.31 The TyG correlates strongly with HOMA-IR and the hyperinsulinemic–euglycemic clamp (HIEC), even outperforming HOMA-IR.20, 21

Significant recent clinical research has shown that the TyG is related to the prognosis in HF. According to a retrospective study, the TyG is associated with the prognosis of individuals with CHF and type 2 DM.32 Another study in 132 hospitalized patients with HF found the TyG to be a novel marker of myocardial injury and a useful risk prediction metric in HF.33 The findings of this study are similar. Nevertheless, the prognostic value of the TyG in the short-term prognosis of non-diabetic AHF patients is not fully appreciated. In this research, we examined the TyG and its relationship to in-hospital mortality rates in non-diabetic patients with AHF.

Currently, there is no established cutoff point for the TyG. To avoid the influence of setting the cutoff point based on the statistical analysis, the median was used as the cutoff point in this study and cases were divided into a high-TyG group and a low-TyG group. Our study found that the high-TyG group patients had lower serum albumin levels, as well as larger left atrial and left ventricle sizes. Moreover, the degree of the TyG was found to be positively correlated with a poor prognostic indicator of AHF (i.e., NT-proBNP), and it was negatively correlated with a protective indicator (i.e., serum albumin).34, 35 These relationships indicate that IR (as determined using the TyG) is a multifunctional indicator that mirrors acute and chronic pathophysiological circumstances, such as abnormal glucose uptake and utilization, nutrition, and cardiac function.

One of North America’s largest projects to assess and enhance cardiovascular care quality, the EFFECT study, involved 86 hospital corporate entities in the Ontario province, Canada.36 Based on this research, the EFFECT score was created to stratify the risk of mortality in patients with HF.8 In our study, it was demonstrated that patients with high TyG levels also had high EFFECT scores. In addition, the TyG was positively correlated with EFFECT score, and both of them had similar areas under the ROC curve for the prediction of in-hospital mortality. These findings suggest that IR reflected by the TyG has significant clinical value for predicting in-hospital mortality.

Furthermore, our study showed that high TyG levels were accompanied by higher in-hospital mortality rates. According to the multivariate logistic regression analysis, the TyG was an independent risk factor for hospital death. Moreover, when compared to NT-proBNP, an indicator highly apt for AHF patients,37 the TyG achieved a greater AUC for predicting hospital death, proving the clinical relevance of this indicator. To the best of our knowledge, this is the first study to demonstrate that the TyG can be utilized as a predictor of short-term mortality in AHF.

According to Park et al., the TyG is an independent predictor for the development of coronary artery calcification.38 Further studies have revealed that the TyG is more strongly linked to arterial stiffness and atherosclerosis than HOMA-IR.13, 18, 39 Two studies found that individuals with elevated TyG levels are more susceptible to developing hypertension.20, 40 Tang et al. observed that IR was prevalent in patients without DM and was linked to epicardial fat deposition and vulnerability to AF. Insulin resistance can cause AF by continuing to increase left atrial volume or by hampering left ventricular diastolic function.41 Zaigham et al. showed that an elevated TyG is a novel risk indicator of prospective COPD events in women in a cross-sectional investigation.42 According to these findings, it is more probable that high TyG levels are linked to CHD, AF, CVA, HTN, COPD, and other diseases. Our results are consistent with the conclusions of the above studies.

Our study found that patients with elevated TyG levels had low serum albumin and high ALT and serum bilirubin. A study by Biegus et al. showed that abnormal liver function tests (including serum bilirubin, AST, ALT, and albumin) are common in AHF patients,43 which is similar to our study. In addition, AHF patients with impaired liver function exhibited more severe clinical conditions on admission.44 This also partly explains why the high-TyG group of patients in our study had higher rates of cardiogenic shock and use of vasoactive drugs. Moreover, age as well as TC and LDL-C levels were higher in the high-TyG group. Therefore, in addition to affecting TyG levels, the above distinctions may result in a variety of poor outcomes in the 2 groups of patients. After controlling for all clinical factors, high TyG was found to be a significant predictive marker in AHF.

Limitations of the study

This study has several limitations. First, because of its retrospective study design, we were not able to continuously assess the TyG in individuals over the course of the study. Second, as this study has limitations inherent in single-center studies and small sample studies, we could not manage to avoid data bias, even after controlling for multiple confounders. Third, due to the scarcity of clinical data, distinctions in the prognosis of AHF between the TyG and other IR measurements, such as HOMA-IR and HIEC, were not investigated. Fourth, some indicators that are recognized to affect the prognosis of patients with HF, such as serum ferritin, have not been routinely measured in clinical practice. We were not able to obtain data on these variables because of the limitations of the study’s retrospective design. Therefore, it was also not possible for us to adjust for the effect of these variables on the conclusions of the study. Prospective cohort research is needed to confirm our results.

Conclusions

In summary, we discovered that the TyG is an independent predictor of short-term mortality in hospitalized AHF patients without diabetes. The TyG may be a hopeful prognostic indicator for AHF patients, given the ease and low price of IR testing.

Tables


Table 1. Baseline characteristics according to TyG group

Categories

Overall (n = 886)

D1 (lower TyG) (n = 443, TyG ≤ 9.44)

D2 (higher TyG) (n = 443, TyG > 9.44)

p-value

Age, Me (P25, P75) [years]

71.0 (58.0, 78.0)

68.0 (55.0, 78.0)

73.0 (61.5, 78.0)

0.003

Male sex, n (%)

492 (55.5)

244 (55.1)

248 (56)

0.787

Smoking, n (%)

292 (33.0)

151 (34.1)

141 (31.8)

0.475

Vital signs

SBP, Me (P25, P75) [mm Hg]

146.0 (123.0, 166.0)

145.0 (122.0, 165.0)

147.0 (124.0, 167.0)

0.507

DBP, Me (P25, P75) [mm Hg]

86.0 (75.2, 97.0)

87.0 (76.0, 96.5)

85.0 (75.0, 98.0)

0.629

HR, Me (P25, P75) [bmp]

96.0 (84.0, 113.8)

96.0 (87.0, 114.5)

96.0 (80.0, 112.0)

0.078

Cardiogenic shock, n (%)

70 (7.9)

20 (4.5)

50 (11.3)

<0.001

Heart failure etiology

CHD

518 (58.5)

257 (58)

261 (58.9)

0.785

Hypertensive heart disease

357 (40.3)

180 (40.6)

177 (40)

0.837

Any cardiomyopathy

193 (21.8)

93 (21)

100 (22.6)

0.569

Any valvular heart disease

245 (27.7)

111 (25.1)

134 (30.2)

0.084

Laboratory tests

Glucose, M ±SD [mmol/L,]

8.5 ±2.3

6.6 ±1.2

10.4 ±1.3

<0.001

eGFR, Me (P25, P75) [mL/min/1.73 m2]

94.0 (73.0, 108.0)

92.5 (73.2, 105.8)

95.4 (72.9, 109.8)

0.422

NT-proBNP, Me (P25, P75) [pg/mL]

1362 (734, 4924)

1089 (695, 4725)

1852 (857, 5017)

0.003

CRP, Me (P25, P75) [mg/L]

39.6 (18.8, 58.0)

40.7 (20.1, 48.0)

39.4 (15.4, 68.9)

0.518

Serum albumin, Me (P25, P75) [g/L]

35.0 (28.0, 39.0)

39.0 (37.0, 45.0)

28.0 (28.0, 32.0)

<0.001

TC, Me (P25, P75) [mmol/L]

3.5 (2.4, 4.1)

2.4 (1.9, 3.0)

4.1 (3.8, 4.2)

<0.001

TG, Me (P25, P75) [mmol/L]

1.8 (1.1, 4.4)

1.1 (0.8, 1.2)

4.5 (3.0, 5.5)

<0.001

LDL-C, M ±SD [mmol/L]

2.1 ±0.9

1.5 ±0.6

2.8 ±0.5

<0.001

BUN, Me (P25, P75) [mmol/L]

12.6 (5.9, 22.2)

12.7 (6.2, 21.5)

12.5 (4.8, 22.9)

0.38

Na, Me (P25, P75) [mmol/L]

138 (135, 141)

138 (135, 141)

138.4 (135.4, 141.0)

0.811

Hb, Me (P25, P75) [g/L]

95.5 (80.0, 117.0)

94.0 (83.0, 117.0)

97.0 (79.0, 117.0)

0.898

TyG, Me (P25, P75)

9.4 (8.7, 10.5)

8.7 (8.2, 8.9)

10.5 (10.0, 10.8)

<0.001

HbAlc, Me (P25, P75) [%]

5.4 (4.9, 6.0)

5.5 (4.8, 5.9)

5.4 (4.9, 6.0)

0.419

ALT, Me (P25, P75) [U/L]

23.1 (13.9, 34.5)

21.5 (13.1, 31.9)

28.6 (14.1, 38.9)

0.033

AST, Me (P25, P75) [U/L]

23.2 (17.3, 33.6)

22.6 (17.1, 35.4)

24.0 (17.5, 33.0)

0.568

Lactate, Me (P25, P75) [mmol/L]

0.9 (0.8, 1.1)

0.9 (0.8, 1.0)

0.9 (0.8, 1.1)

0.375

Serum bilirubin, Me (P25, P75) [μmol/L]

14.7 (6.1, 23.5)

12.8 (6.7, 22.1)

16.9 (4.8, 27.8)

0.037

hs-cTn, Me (P25, P75) [ng/mL]

20.42 (10.34, 39.53)

19.20 (10.80, 36.50)

21.65 (9.62, 43.83)

0.053

GGPT, Me (P25, P75) [U/L]

28.2 (22.5, 38.7)

27.9 (22.1, 40.7)

29.0 (23.7, 38.1)

0.416

Comorbidities

HTN, n (%)

585 (66.0)

266 (60)

319 (72)

<0.001

CHD, n (%)

651 (73.5)

301 (67.9)

350 (79)

<0.001

AF, n (%)

248 (28.0)

77 (17.4)

171 (38.6)

<0.001

CVA, n (%)

305 (34.4)

128 (28.9)

177 (40)

<0.001

COPD, n (%)

124 (14.0)

36 (8.1)

88 (19.9)

<0.001

Echocardiographic characteristics

LVEDD, Me (P25, P75) [mm]

60.0 (58.0, 63.0)

58.0 (55.0, 59.0)

63.0 (61.0, 65.0)

<0.001

LAD, Me (P25, P75) [mm]

48.0 (47.0, 50.8)

47.0 (44.0, 48.0)

51.0 (49.0, 53.0)

<0.001

LVEF, Me (P25, P75) [%]

44.0 (36.0, 50.0)

44.0 (36.0, 54.0)

44.0 (36.0, 48.0)

0.169

Drug therapy at admission

Vasoactive drugs, n (%)

552 (62.3)

222 (50.1)

330 (74.5)

<0.001

RASI, n (%)

685 (77.3)

339 (76.5)

346 (78.1)

0.574

β-blocker, n (%)

611 (69.0)

301 (67.9)

310 (70)

0.513

Statins, n (%)

548 (61.9)

278 (62.8)

270 (60.9)

0.58

Diuretics, n (%)

788 (88.9)

398 (89.8)

390 (88.0)

0.547

MRA, n (%)

354 (40.0)

173 (39.1)

181 (40.9)

0.431

Achieved recommended dose

MRA, n (%)

310 (35.0)

151 (34.1)

159 (35.9)

0.656

RASI, n (%)

334 (37.7)

171 (38.6)

163 (36.8)

0.425

β- blocker, n (%)

265 (29.9)

128 (28.9)

137 (30.9)

0.534

EFFECT mortality risk score

30-day

90.0 (63.0, 118.0)

63.0 (47.5, 75.0)

118.0 (100.0, 125.0)

<0.001

Events

In-hospital mortality, n (%)

81 (9.1)

25 (5.6)

56 (12.6)

<0.001

Values are presented as mean (standard deviation (SD)), n (percentages (%)), or median (Me) (interquartile range (IQR)). TyG – triglyceride glucose index; SBP – systolic blood pressure; DBP – diastolic blood pressure; HR – heart rate; eGFR – estimated glomerular filtration rate; NT-proBNP – N-terminal B-type natriuretic peptide; CRP – C-reactive protein; TC – total cholesterol; TG – triglyceride; LDL-C – low-density lipoprotein cholesterol; BUN – blood urea nitrogen; Na – sodium; Hb – hemoglobin; HbA1c – hemoglobin A1c; ALT – alanine aminotransferase; AST – aspartate transaminase; hs-cTn – high sensitivity cardiac troponin; GGPT – gamma-glutamyl transpeptidase; HTN – hypertension; CHD – coronary heart disease; AF – atrial fibrillation; CVA – cerebrovascular accident; COPD – chronic obstructive pulmonary disease; LVEDD – left ventricular end-diastolic diameter; LAD – left atrial diameter; LVEF – left ventricular ejection fraction; RASI – angiotensin-converting enzyme inhibitor/angiotensin receptor antagonist; MRA – mineralcorticoid recept antagonist; EFFECT – Enhanced Feedback for Effective Cardiac Treatment.
Table 2. Correlation between the degrees of TyG and major clinical indicators

Parameter

Serum albumin

NT-proBNP

CRP

LVEF

EFFECT score

ρ value

−0.43

0.207

−0.034

−0.014

0.514

p-value

<0.001

<0.001

0.309

0.671

<0.001

TyG – triglyceride glucose index; NT-proBNP – N-terminal B-type natriuretic peptide; CRP – C-reactive protein; LVEF – left ventricular ejection fraction; EFFECT – Enhanced Feedback for Effective Cardiac Treatment. The Spearman’s correlation coefficient (ρ) was used to assess the correlations between the TyG and the other variables.
Table 3. Correlation between the higher TyG and in-hospital mortality

Models

OR

95% CI

p-value

Unadjusted

2.42

1.48–3.95

<0.001

Model 1

2.15

1.47–3.16

0.013

Model 2

1.59

1.18–2.24

0.039

Model 3

1.89

1.13–3.47

0.023

Model 4

1.51

1.06–3.21

0.042

Model 5

2.56

1.87–4.17

0.651

OR – odds ratio; 95% CI – 95% confidence interval ; TyG – triglyceride glucose index; Model 1: adjusted for age; Model 2: adjusted for Model 1 + comorbidities of cardiogenic shock, atrial fibrillation (AF), chronic obstructive pulmonary disease (COPD), and use of vasoactive drugs; Model 3: adjusted for Model 2 + heart failure (HF) etiologies including coronary heart disease (CHD), hypertensive heart disease, any cardiomyopathy, and any valvular heart disease; Model 4: adjusted for Model 3 + hemoglobin A1c, 30-day Enhanced Feedback for Effective Cardiac Treatment (EFFECT) score, N-terminal B-type natriuretic peptide (NT-proBNP), alanine aminotransferase (ALT), serum bilirubin, and high sensitivity cardiac troponin; Model 5: adjusted for age, cardiogenic shock, NT-proBNP, serum albumin, total cholesterol, low-density lipoprotein cholesterol, serum bilirubin, ALT, comorbidities of hypertension, CHD, AF, cerebrovascular accident, COPD, and left ventricular end-diastolic diameter, left atrial diameter, EFFECT score, and use of vasoactive drugs.

Figures


Fig. 1. Flowchart of patient selection
Fig. 2. Triglyceride glucose index (TyG) and mortality risk score using the Enhanced Feedback for Effective Cardiac Treatment (EFFECT) score system to assess the 30-day mortality risk for patients with acute heart failure (AHF). The results are shown as box–whisker plots. The horizontal lines denote the 10th, 25th, 50th, 75th, and 90th percentiles. The differences between the 2 groups were compared using independent samples Mann–Whitney U testing. A. According to the median of the TyG, patients were divided into 2 groups: D1 (TyG ≤ 9.44) and D2 (TyG > 9.44). The mortality risk scores of the patients in D2 were higher than those of the D1 patients (D1 compared to D2, * p < 0.001); B. Based on TyG levels, participants were grouped into tertiles: tertile 1 (T1): TyG ≤ 8.81; tertile 2 (T2): TyG > 8.81 and ≤10.27; tertile 3 (T3): TyG ≥ 10.27. The mortality risk score increased with the TyG (compared with T1, * p < 0.001; T2 compared to T3, # p < 0.001)
Fig. 3. Assessment of the clinical value of triglyceride glucose index (TyG) for predicting in-hospital mortality using a receiver operating characteristic (ROC) curve. The TyG, Enhanced Feedback for Effective Cardiac Treatment (EFFECT) score and N-terminal B-type natriuretic peptide (NT-proBNP) yielded areas under the ROC curve (AUC) of 0.688 (95% confidence interval (95% CI): 0.631–0.745), 0.732 (95% CI: 0.674–0.789) and 0.506 (95% CI: 0.442–0.570), respectively

References (44)

  1. Naseem M, Alkassas A, Alaarag A. Tricuspid annular plane systolic excursion/pulmonary arterial systolic pressure ratio as a predictor of in-hospital mortality for acute heart failure. BMC Cardiovasc Disord. 2022;22(1):414. doi:10.1186/s12872-022-02857-6
  2. De Matteis G, Covino M, Burzo ML, et al. Clinical characteristics and predictors of in-hospital mortality among older patients with acute heart failure. J Clin Med. 2022;11(2):439. doi:10.3390/jcm11020439
  3. Kobayashi M, Douair A, Coiro S, et al. A combination of chest radiography and estimated plasma volume may predict in-hospital mortality in acute heart failure. Front Cardiovasc Med. 2022;8:752915. doi:10.3389/fcvm.2021.752915
  4. Kawata T, Ikeda A, Masuda H, Komatsu S. Association between albumin-bilirubin score at admission and in-hospital mortality in patients with acute heart failure. Int Heart J. 2021;62(4):829–836. doi:10.1536/ihj.21-080
  5. Gao L, Bian Y, Cao S, et al. Development and validation of a simple-to-use nomogram for predicting in-hospital mortality in patients with acute heart failure undergoing continuous renal replacement therapy. Front Med. 2021;8:678252. doi:10.3389/fmed.2021.678252
  6. Shiraishi Y, Kohsaka S, Abe T, et al. Validation of the Get With The Guideline–Heart Failure risk score in Japanese patients and the potential improvement of its discrimination ability by the inclusion of B-type natriuretic peptide level. Am Heart J. 2016;171(1):33–39. doi:10.1016/j.ahj.2015.10.008
  7. Alba AC, Agoritsas T, Jankowski M, et al. Risk prediction models for mortality in ambulatory patients with heart failure: A systematic review. Circ Heart Failure. 2013;6(5):881–889. doi:10.1161/CIRCHEARTFAILURE.112.000043
  8. Lee DS, Austin PC, Rouleau JL, Liu PP, Naimark D, Tu JV. Predicting mortality among patients hospitalized for heart failure: Derivation and validation of a clinical model. JAMA. 2003;290(19):2581. doi:10.1001/jama.290.19.2581
  9. Banovic M, Vasiljevic-Pokrajcic Z, Vujisic-Tesic B, et al. Are de novo acute heart failure and acutely worsened chronic heart failure two subgroups of the same syndrome? Srp Arh Celok Lek. 2010;138(3–4):162–169. doi:10.2298/SARH1004162B
  10. Scherbakov N, Bauer M, Sandek A, et al. Insulin resistance in heart failure: Differences between patients with reduced and preserved left ventricular ejection fraction. Eur J Heart Fail. 2015;17(10):1015–1021. doi:10.1002/ejhf.317
  11. Fu F, Zhao K, Li J, et al. Direct evidence that myocardial insulin resistance following myocardial ischemia contributes to post-ischemic heart failure. Sci Rep. 2015;5(1):17927. doi:10.1038/srep17927
  12. Liao Y, Zhang R, Shi S, et al. Triglyceride-glucose index linked to all-cause mortality in critically ill patients: A cohort of 3026 patients. Cardiovasc Diabetol. 2022;21(1):128. doi:10.1186/s12933-022-01563-z
  13. Irace C, Carallo C, Scavelli FB, et al. Markers of insulin resistance and carotid atherosclerosis: A comparison of the homeostasis model assessment and triglyceride glucose index. Int J Clin Pract. 2013;67(7):665–672. doi:10.1111/ijcp.12124
  14. Guerrero-Romero F, Simental-Mendía LE, González-Ortiz M, et al. The product of triglycerides and glucose, a simple measure of insulin sensitivity: Comparison with the euglycemic-hyperinsulinemic clamp. J Clin Endocrinol Metab. 2010;95(7):3347–3351. doi:10.1210/jc.2010-0288
  15. Vasques ACJ, Novaes FS, De Oliveira MDS, et al. TyG index performs better than HOMA in a Brazilian population: A hyperglycemic clamp validated study. Diabetes Res Clin Pract. 2011;93(3):e98–e100. doi:10.1016/j.diabres.2011.05.030
  16. Unger G, Benozzi SF, Perruzza F, Pennacchiotti GL. Triglycerides and glucose index: A useful indicator of insulin resistance. Endocrinol Nutr. 2014;61(10):533–540. doi:10.1016/j.endonu.2014.06.009
  17. Du T, Yuan G, Zhang M, Zhou X, Sun X, Yu X. Clinical usefulness of lipid ratios, visceral adiposity indicators, and the triglycerides and glucose index as risk markers of insulin resistance. Cardiovasc Diabetol. 2014;13(1):146. doi:10.1186/s12933-014-0146-3
  18. Kim MK, Ahn CW, Kang S, Nam JS, Kim KR, Park JS. Relationship between the triglyceride glucose index and coronary artery calcification in Korean adults. Cardiovasc Diabetol. 2017;16(1):108. doi:10.1186/s12933-017-0589-4
  19. Li S, Guo B, Chen H, et al. The role of the triglyceride (triacylglycerol) glucose index in the development of cardiovascular events: A retrospective cohort analysis. Sci Rep. 2019;9(1):7320. doi:10.1038/s41598-019-43776-5
  20. Zheng R, Mao Y. Triglyceride and glucose (TyG) index as a predictor of incident hypertension: A 9-year longitudinal population-based study. Lipids Health Dis. 2017;16(1):175. doi:10.1186/s12944-017-0562-y
  21. Thai PV, Tien HA, Van Minh H, Valensi P. Triglyceride glucose index for the detection of asymptomatic coronary artery stenosis in patients with type 2 diabetes. Cardiovasc Diabetol. 2020;19(1):137. doi:10.1186/s12933-020-01108-2
  22. Sánchez-Íñigo L, Navarro-González D, Fernández-Montero A, Pastrana-Delgado J, Martínez JA. The TyG index may predict the development of cardiovascular events. Eur J Clin Invest. 2016;46(2):189–197. doi:10.1111/eci.12583
  23. Ma X, Dong L, Shao Q, et al. Triglyceride glucose index for predicting cardiovascular outcomes after percutaneous coronary intervention in patients with type 2 diabetes mellitus and acute coronary syndrome. Cardiovasc Diabetol. 2020;19(1):31. doi:10.1186/s12933-020-01006-7
  24. Wang L, Cong HL, Zhang JX, et al. Triglyceride-glucose index predicts adverse cardiovascular events in patients with diabetes and acute coronary syndrome. Cardiovasc Diabetol. 2020;19(1):80. doi:10.1186/s12933-020-01054-z
  25. Hu C, Zhang J, Liu J, et al. Discordance between the triglyceride glucose index and fasting plasma glucose or HbA1C in patients with acute coronary syndrome undergoing percutaneous coronary intervention predicts cardiovascular events: A cohort study from China. Cardiovasc Diabetol. 2020;19(1):116. doi:10.1186/s12933-020-01091-8
  26. McDonagh TA, Metra M, Adamo M, et al. 2021 ESC Guidelines for the diagnosis and treatment of acute and chronic heart failure. Eur Heart J. 2021;42(36):3599–3726. doi:10.1093/eurheartj/ehab368
  27. Levey AS, Stevens LA, Schmid CH, et al. A new equation to estimate glomerular filtration rate. Ann Intern Med. 2009;150(9):604. doi:10.7326/0003-4819-150-9-200905050-00006
  28. Rider I, Sorensen M, Brady WJ, et al. Disposition of acute decompensated heart failure from the emergency department: An evidence-based review. Am J Emerg Med. 2021;50:459–465. doi:10.1016/j.ajem.2021.08.070
  29. Witteles RM, Fowler MB. Insulin-resistant cardiomyopathy. J Am Coll Cardiol. 2008;51(2):93–102. doi:10.1016/j.jacc.2007.10.021
  30. Huang R, Wang Z, Chen J, et al. Prognostic value of triglyceride glucose (TyG) index in patients with acute decompensated heart failure. Cardiovasc Diabetol. 2022;21(1):88. doi:10.1186/s12933-022-01507-7
  31. Bonora E, Targher G, Alberiche M, et al. Homeostasis model assessment closely mirrors the glucose clamp technique in the assessment of insulin sensitivity: Studies in subjects with various degrees of glucose tolerance and insulin sensitivity. Diabetes Care. 2000;23(1):57–63. doi:10.2337/diacare.23.1.57
  32. Guo W, Zhao L, Mo F, et al. The prognostic value of the triglyceride glucose index in patients with chronic heart failure and type 2 diabetes: A retrospective cohort study. Diabetes Res Clin Pract. 2021;177:108786. doi:10.1016/j.diabres.2021.108786
  33. Yang S, Du Y, Liu Z, et al. Triglyceride–glucose index and extracellular volume fraction in patients with heart failure. Front Cardiovasc Med. 2021;8:704462. doi:10.3389/fcvm.2021.704462
  34. Lorlowhakarn K, Arayakarnkul S, Trongtorsak A, et al. Outcomes and predictors of one-year mortality in patients hospitalized with acute heart failure. Int J Cardiol Heart Vasc. 2022;43:101159. doi:10.1016/j.ijcha.2022.101159
  35. Çınar T, Hayıroğlu Mİ, Çiçek V, Orhan AL. A simple parameter for long-term mortality in acute heart failure patients: Serum albumin. Acta Cardiol. 2021;76(1):106. doi:10.1080/00015385.2019.1699280
  36. Tu JV, Donovan LR, Lee DS, et al. Effectiveness of public report cards for improving the quality of cardiac care: The EFFECT study. A randomized trial. JAMA. 2009;302(21):2330. doi:10.1001/jama.2009.1731
  37. Scrutinio D, Ammirati E, Guida P, et al. Clinical utility of N-terminal pro-B-type natriuretic peptide for risk stratification of patients with acute decompensated heart failure: Derivation and validation of the ADHF/NT-proBNP risk score. Int J Cardiol. 2013;168(3):2120–2126. doi:10.1016/j.ijcard.2013.01.005
  38. Park K, Ahn CW, Lee SB, et al. Elevated TyG index predicts progression of coronary artery calcification. Diabetes Care. 2019;42(8):1569–1573. doi:10.2337/dc18-1920
  39. Lee SB, Ahn CW, Lee BK, et al. Association between triglyceride glucose index and arterial stiffness in Korean adults. Cardiovasc Diabetol. 2018;17(1):41. doi:10.1186/s12933-018-0692-1
  40. Sánchez-Íñigo L, Navarro-González D, Pastrana-Delgado J, Fernández-Montero A, Martínez JA. Association of triglycerides and new lipid markers with the incidence of hypertension in a Spanish cohort. J Hypertens. 2016;34(7):1257–1265. doi:10.1097/HJH.0000000000000941
  41. Tang Q, Guo XG, Sun Q, Ma J. The pre-ablation triglyceride-glucose index predicts late recurrence of atrial fibrillation after radiofrequency ablation in non-diabetic adults. BMC Cardiovasc Disord. 2022;22(1):219. doi:10.1186/s12872-022-02657-y
  42. Zaigham S, Tanash H, Nilsson PM, Muhammad IF. Triglyceride-glucose index is a risk marker of incident COPD events in women. Int J Chron Obstruct Pulmon Dis. 2022;17:1393–1401. doi:10.2147/COPD.S360793
  43. Biegus J, Zymliński R, Sokolski M, et al. Liver function tests in patients with acute heart failure. Pol Arch Intern Med. 2012;122(10):471–479. doi:10.20452/pamw.1413
  44. Biegus J, Demissei B, Postmus D, et al. Hepatorenal dysfunction identifies high-risk patients with acute heart failure: Insights from the RELAX-AHF trial. ESC Heart Fail. 2019;6(6):1188–1198. doi:10.1002/ehf2.12477