Abstract
Background. Age and gender have been identified as significant factors contributing to the global rise in thyroid cancer (TC), with this disease predominantly affecting women. It is crucial to thoroughly investigate the trends of the disease over time to better understand its progression and potential risk factors.
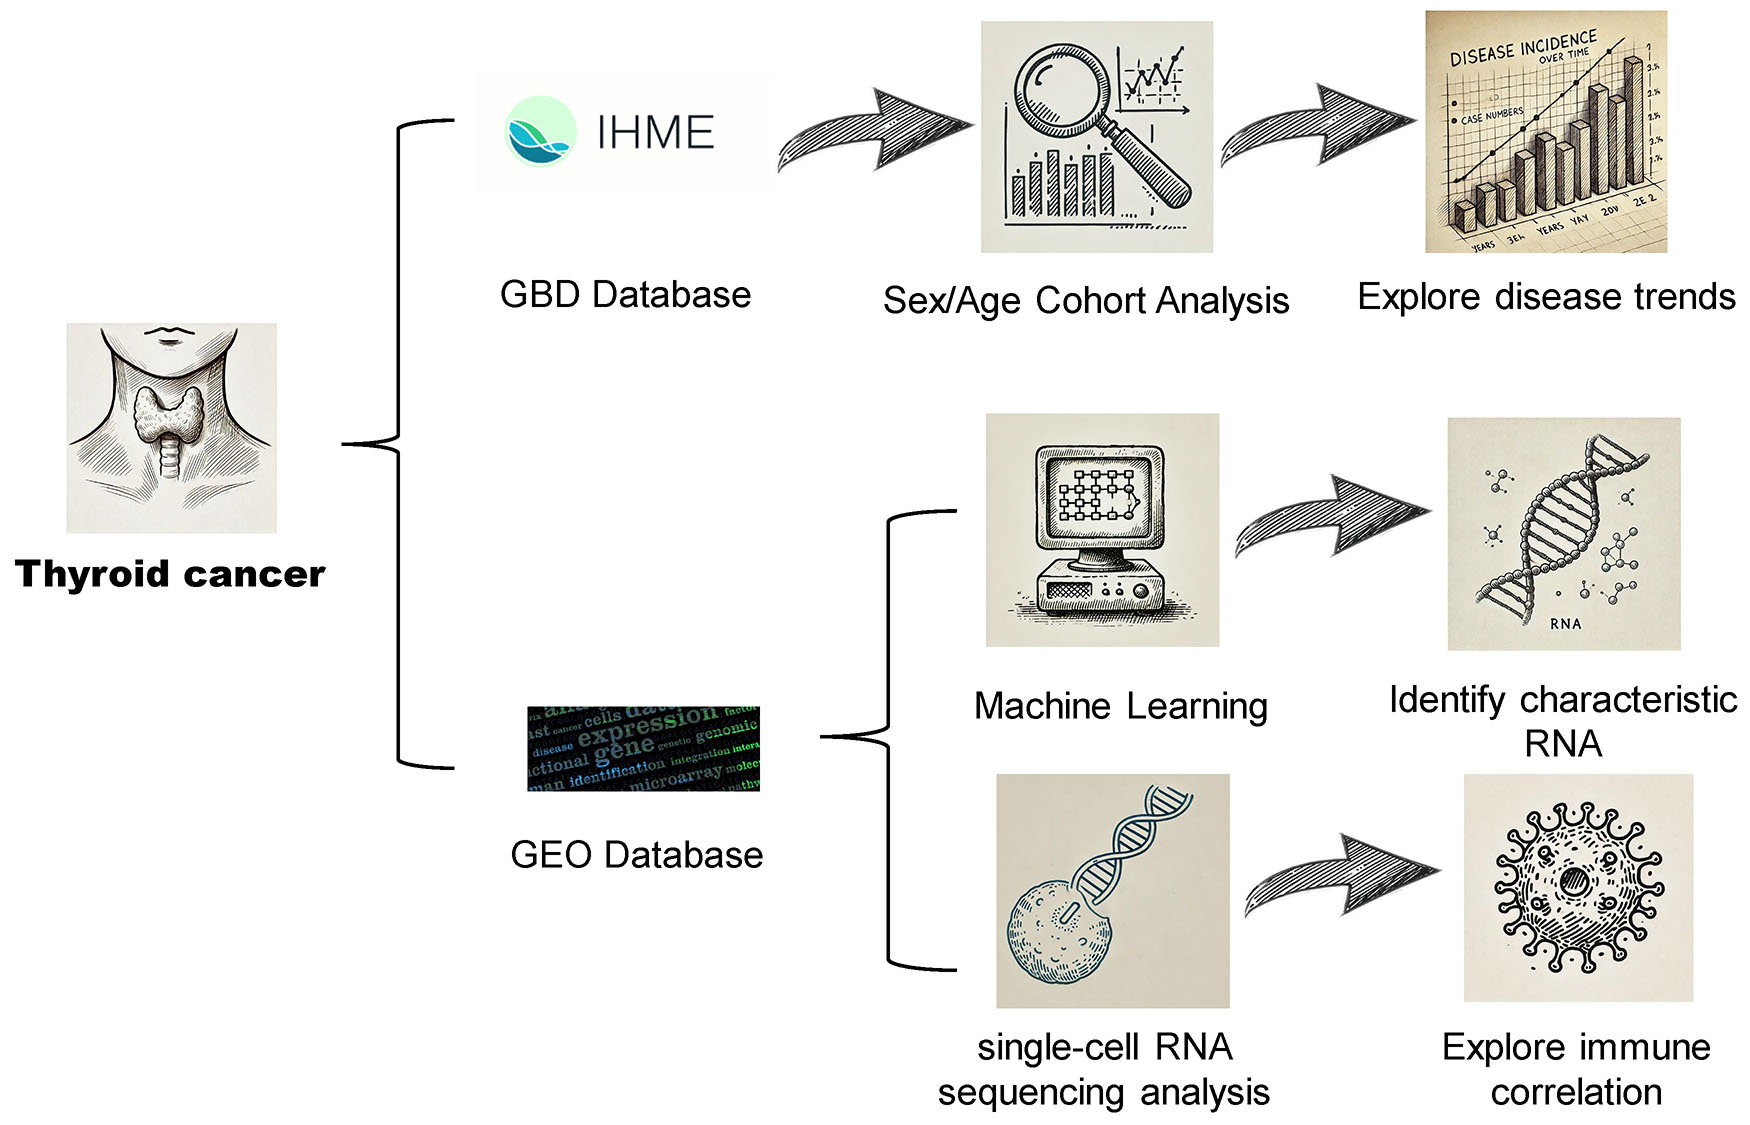
Objectives. This study analyzed the global incidence of TC using data from the Global Burden of Disease (GBD) database from 1990 to 2021. Additionally, we aimed to develop a high-performance diagnostic model using machine-learning algorithms and to explore the tumor microenvironment through single-cell sequencing.
Materials and methods. To analyze trends in incidence, age-period cohort models were applied, with a particular focus on birth cohort and period effects. Machine learning algorithms, including least absolute shrinkage and selection operator (LASSO) and Ridge regression, were used for gene feature selection. Subsequently, cross-validation was conducted to validate the diagnostic model. For deeper insights, single-cell RNA sequencing was conducted to analyze myeloid cell subpopulations within the tumor microenvironment.
Results. Age and period effects emerged as the primary drivers in our analysis of TC trends, particularly among women. Machine learning models, specifically LASSO and Ridge regression, demonstrated high predictive accuracy in diagnosing the disease. Additionally, single-cell RNA sequencing unveiled crucial interactions between myeloid cells and the tumor microenvironment.
Conclusions. This study provides a comprehensive analysis of TC trends and introduces a machine-learning-based diagnostic tool. Additionally, single-cell RNA sequencing offers novel insights into the tumor microenvironment, which may help shape future treatment strategies for TC.
Key words: machine learning, epidemiology, gene expression, tumor microenvironment, thyroid neoplasms
Background
Thyroid cancer (TC) is one of the few proliferative endocrine tumors, and its incidence has significantly increased over the several past decades. Several factors, including advancements in diagnostic techniques, heightened public awareness and changes in environmental exposures, are likely contributing to this rising trend.1, 2 With the global population aging and environmental factors evolving, the epidemiological characteristics of TC are continuously changing. Therefore, updated research and analyses are urgently needed. According to data from the World Health Organization (WHO), TC ranks as the 9th most common cancer globally. In 2020, approx. 586,000 new cases were reported, with nearly 90,000 deaths worldwide. Over the past decades, the incidence of thyroid cancer has been rising, particularly among women.
According to the American Cancer Society (ACS), women are 3 times more likely to develop TC than men. There are significant differences in TC incidence across different regions. For example, South Korea has the highest incidence, while rates are relatively low in Africa and South Asia. According to the International Agency for Research on Cancer (IARC), high-income countries generally have higher TC incidence rates compared to low- and middle-income countries.1, 2
Previous investigations indicate that age, sex and residential zone are the most influential factors correlating with TC prevalence. For instance, women have greater access to diagnosis compared to men. Moreover, the variations in incidence rates by geography are assumed to be indicative of greater exposure to risk factors within different regions. However, a systematic analysis based on long-term trends and the underlying mechanisms contributing to the increase in TC cases is still lacking.
The current study aims to conduct a comprehensive analysis of the differences in age-standardized incidence and prevalence rates of TC across countries from 1990 to 2021, utilizing data from the Global Burden of Disease (GBD) database.3, 4 We designed this study to explore a large dataset and identify novel trends otherwise hidden from prior analyses. Moreover, we aimed to develop a highly accurate TC diagnostic model using advanced machine learning approaches. This method not only enhances diagnostic precision but also provides a more reliable tool for clinical practice, ultimately improving patient outcomes.
Additionally, we used single-cell RNA sequencing to gain a more precise understanding of the cellular challenges within the tumor microenvironment.5, 6 The exciting component of this method is that we can identify intricate cellular communications and gene expression patterns which are critical in tumorigenesis and progression.
Objectives
The GBD database was used to examine global trends in TC incidence from 1990 to 2021. Additionally, this study aimed to develop a machine learning-based diagnostic model by identifying key genes and to investigate tumor–microenvironment interactions using single-cell sequencing, offering potential therapeutic insights.
Materials and methods
Patients
Study population
The study included patients diagnosed with TC, utilizing data obtained from publicly available datasets (e.g., GBD database, GSE27155, GSE111455, GSE196264, TCGA-THCA). The inclusion criteria encompassed confirmed cases of TC, with documented patient characteristics including age, sex, geographic location, and stage at diagnosis. Exclusion criteria included patients with missing clinical or demographic data. The datasets were thoroughly cleaned to eliminate inconsistencies or errors, ensuring high-quality data for analysis. Gene expression data were normalized to mitigate batch effects and technical variations across different datasets.
Specimen characteristics
Biological material
Gene expression data from TC patients were collected from the Gene Expression Omnibus (GEO) database and The Cancer Genome Atlas (TCGA). Control samples were also obtained from the same datasets and consisted of non-cancerous thyroid tissue from patients diagnosed with thyroid conditions.
Preservation and storage
Datasets used were publicly available and underwent quality control in their respective studies. Data were stored in compliance with open-source data-sharing standards.
Assay methods
Global Burden of Disease analysis
This study utilized the R programming language for data analysis, primarily leveraging packages such as ggplot2, dplyr, reshape2, readxl, and ggpubr. First, epidemiological data were imported using the read.csvfunction, with a focus on data from 2021. The dataset was categorized into 20 age groups, and the subset function was applied to extract data based on specific conditions, including age group, gender (male and female), geographic location (global), metrics (“rate” or “number”), and measurement type (“prevalence” or “incidence”).
Data cleaning was conducted using the gsub function, while order and factor were utilized for sorting and categorization to ensure the correct arrangement of variables. The ggplot2 package was employed to generate visualizations, including line charts for prevalence and incidence trends across different age groups and pyramid charts for case distribution. These visualizations were created using functions such as geom_line, geom_point, geom_ribbon, and geom_bar. Additionally, the ggarrange function from the ggpubr package was used to combine multiple graphs, facilitating easy comparison and effective presentation of results.
In this study, Joinpoint regression analysis and decomposition analysis were conducted on incidence and mortality data using R. Age-standardized incidence data from China and global sources were selected for analysis, and their corresponding standard errors (SE) were calculated. The data were then sorted by gender and year and exported as *csv files for regression analysis in Joinpoint software to identify trends in incidence changes. The annual percent change (AAPC) and segment-specific percent change (APC) were extracted from Joinpoint and formatted using R for further analysis and visualization.
In the decomposition analysis, demographic data were integrated to calculate the population proportions for different age groups in 1990 and 2021. Specific formulas were applied to decompose the total change and distinguish the contributions of age structure, total population growth, and epidemiological changes. Data processing and analysis primarily utilized R packages such as dplyr, tidyr, and ggplot2.
Study design
Case selection and time frame
The study was retrospective, utilizing data from 1990–2021 to analyze global trends in TC incidence using the GBD database. To enhance accuracy, the data were stratified by gender, age and geographical location.
Endpoints
The primary endpoints of this study included age-standardized incidence rates, prevalence and mortality rates of TC. The secondary endpoint focused on exploring gene expression differences within the tumor microenvironment using single-cell sequencing data.
Candidate variables
The variables initially considered in this study included age, sex, geographical region, and gene expression levels, as they are key factors influencing TC prognosis.
Sample size and power
A large dataset from the GBD, TCGA and GEO databases was used to ensure adequate statistical power. The study was designed to detect significant epidemiological trends and gene expression patterns, with a target power of 0.8 to detect medium effect sizes.
Statistical analyses
We processed the sample data using the following methods: TCGA for TC, including 100 normal tissue samples and 507 tumor samples, totaling 607 samples. GSE27155: Human thyroid adenomas, carcinomas and normals. Human samples of various thyroid carcinomas, adenomas and normals (99 samples). GSE111455: Array-based genome-wide transcriptome analysis of minimally invasive follicular thyroid carcinomas (3 samples). GSE196264: Gene profile of human medullary TC. Eight sporadic MTC patients were selected for the gene microarray analysis (17 samples). Joinpoint regression models were employed for trend analysis to assess changes in incidence and prevalence over time. The age-period-cohort (APC) model was also utilized to evaluate the influence of age, period and cohort on incidence trends. Differentially expressed genes (DEGs) identified by DESeq2 and limma were analyzed using differential gene expression analysis.
Differential gene expression analysis
Differential expression analysis was conducted using the limma package in R, designed for differential expression analysis of microarray and RNA-Seq data. We used normalized expression data from the TCGA dataset. To ensure robust statistical analysis, genes with 0 variance across samples were removed. A linear model was fitted using the lmFit function and a design matrix specifying control and treatment groups. Contrasts were defined to compare treatment and control groups, and Empirical Bayes method (eBayes) was used to compute adjusted t-statistics and log-odds for differential expression. Genes were considered significantly differentially expressed if the absolute log₂ fold change (|log₂FC|) exceeded 0.585 and the adjusted p-value, corrected for false discovery rate (FDR), was less than 0.05.7
Significant genes were further analyzed to visualize expression patterns. Heatmaps were generated using pheatmap in R to display the most significantly differentially expressed genes, applying hierarchical clustering to rows while keeping columns unclustered. Volcano plots were created using ggplot2 in R to illustrate the distribution of log₂ fold changes against the negative log of the adjusted p-value.
KEGG analysis
We conducted gene set enrichment analysis using the Kyoto Encyclopedia of Genes and Genomes database (KEGG, https://www.kegg.jp) to identify significant pathways associated with our gene list of interest. The analysis was performed using the clusterProfiler package in R (v. 4.4.1, a programming language and software environment for statistical computing and data visualization; R Foundation for Statistical Computing, Vienna, Austria). First, gene symbols were converted to Entrez Gene Identifier using the org.Hs.eg.db package. Duplicate entries were removed, and genes without corresponding Entrez IDs were excluded. The enrichKEGG function was used for KEGG pathway enrichment analysis, specifying “hsa” (human) as the organism. The significance threshold for pathway inclusion was set at a p-value of 0.05 and an adjusted p-value (q-value) of 1. Pathway descriptions were simplified by removing redundant species information. Results were filtered to include only pathways meeting the specified significance criteria and saved to a file named “KEGG.txt”. Visualization of the top 30 pathways was done using barplot and dotplot functions from the enrichplot package. Plots were colored based on adjusted p-values, using raw p-values if the threshold exceeded 0.05. All visualization results were saved in *pdf format for further analysis and presentation.
WGCNA analysis
Weighted gene co-expression network analysis (WGCNA) was performed using R to identify gene modules associated with clinical traits in the TCGA dataset. First, the expression data were normalized, and genes with low variance (standard deviation (SD) <1.5) were filtered out to ensure robustness. The soft-thresholding power was determined by scale-free topology criteria, selecting a power value X to achieve a scale-free topology fit index of at least 0.8. This power was used to construct an adjacency matrix, which was then transformed into a topological overlap matrix (TOM) to measure network interconnectedness. Gene modules were identified by dynamic tree cutting based on the TOM gene dendrogram, with a minimum module size of 60 genes. Module eigengenes were calculated and similar expression pattern modules were merged based on a height cut of 0.25 on the eigengene dendrogram. Pearson’s correlation analysis was used to assess the relationship between module eigengenes and clinical traits (e.g., control and treat), and significant modules were analyzed in depth. Gene significance (GS) and module membership (MM) metrics were calculated for each gene, and scatter plots were generated to visualize the relationship between GS and MM in key modules. All analyses were conducted using the WGCNA package in R, with results visualized through a series of dendrograms, heatmaps and scatter plots. Final module assignments and gene significance metrics were exported for further biological interpretation and validation.
Machine learning models
This study employed a comprehensive machine learning approach to develop and evaluate predictive models for classification tasks. Data were sourced from publicly available GEO datasets and preprocessed to ensure consistency between training and test sets. Key libraries used included randomForestSRC, glmnet, xgboost, and ComplexHeatmap for data processing, model training and visualization. Feature selection was performed using various machine learning algorithms to identify important variables. Model training utilized diverse algorithms, including random forest, least absolute shrinkage and selection operator (LASSO) regression and gradient boosting machine, with hyperparameter optimization to enhance performance. Training data were scaled and centered to standardize input features, ensuring robust model development.
Each model’s performance was assessed using cross-validation and evaluated based on the area under the curve (AUC) metric. The best-performing model was selected for further analysis and validated on an independent test dataset. Additionally, a logistic regression model was constructed to compare its performance with machine learning models. Results were visualized using heatmaps to display AUC values across different models and datasets, facilitating comparative analysis. The final model was saved to ensure reproducibility and future application. This rigorous approach ensured the development of robust predictive models with potential applications in bioinformatics and computational biology.
Single-cell sequencing
Single-cell RNA sequencing (scRNA-seq) data were obtained from publicly available datasets. We used the Matrix package (v. 1.7-2) in R to load the raw count matrix and the Seurat package (v.5.2.1) for further processing. Gene and barcode information were annotated onto the count matrix, creating a Seurat object for downstream analysis. The NormalizeData function was used to normalize the Seurat object, and high-variance features were identified using FindVariableFeatures. The data were then scaled using ScaleData and subjected to principal component analysis (PCA) with RunPCA. The first 10 principal components were used to construct a shared nearest neighbor graph (FindNeighbors) and identify cell clusters using the FindClusters function with a resolution of 0.1. For data visualization, t-distributed stochastic neighbor embedding (t-SNE) was applied using RunTSNE. Cluster-specific marker genes were identified using FindAllMarkers, with criteria set to include genes expressed in at least 10% of cells and a log fold change threshold of 0.1. The top 4 marker genes for each cluster were extracted and saved for further analysis. Cell type annotation was based on known marker genes for various cell types. A DotPlot was generated to visualize the expression of these marker genes across clusters. Annotations were manually added to the metadata of the Seurat object, updating cluster identities accordingly.
Cell–cell communication analysis
Cell–cell communication analysis was performed using the CellChat package (v. 1.5.0). A CellChat object was created from the Seurat object, and the CellChatDB.human database (https://github.com/sqjin/CellChat) was used to identify secreted signaling pathways. Overexpressed genes and ligand-receptor pairs were identified, and communication probabilities were computed using computeCommunProb. Interactions between different cell types and signaling pathways were visualized using various methods, including circle plots, chord diagrams and heatmaps.
Results
Epidemiological trends of thyroid cancer
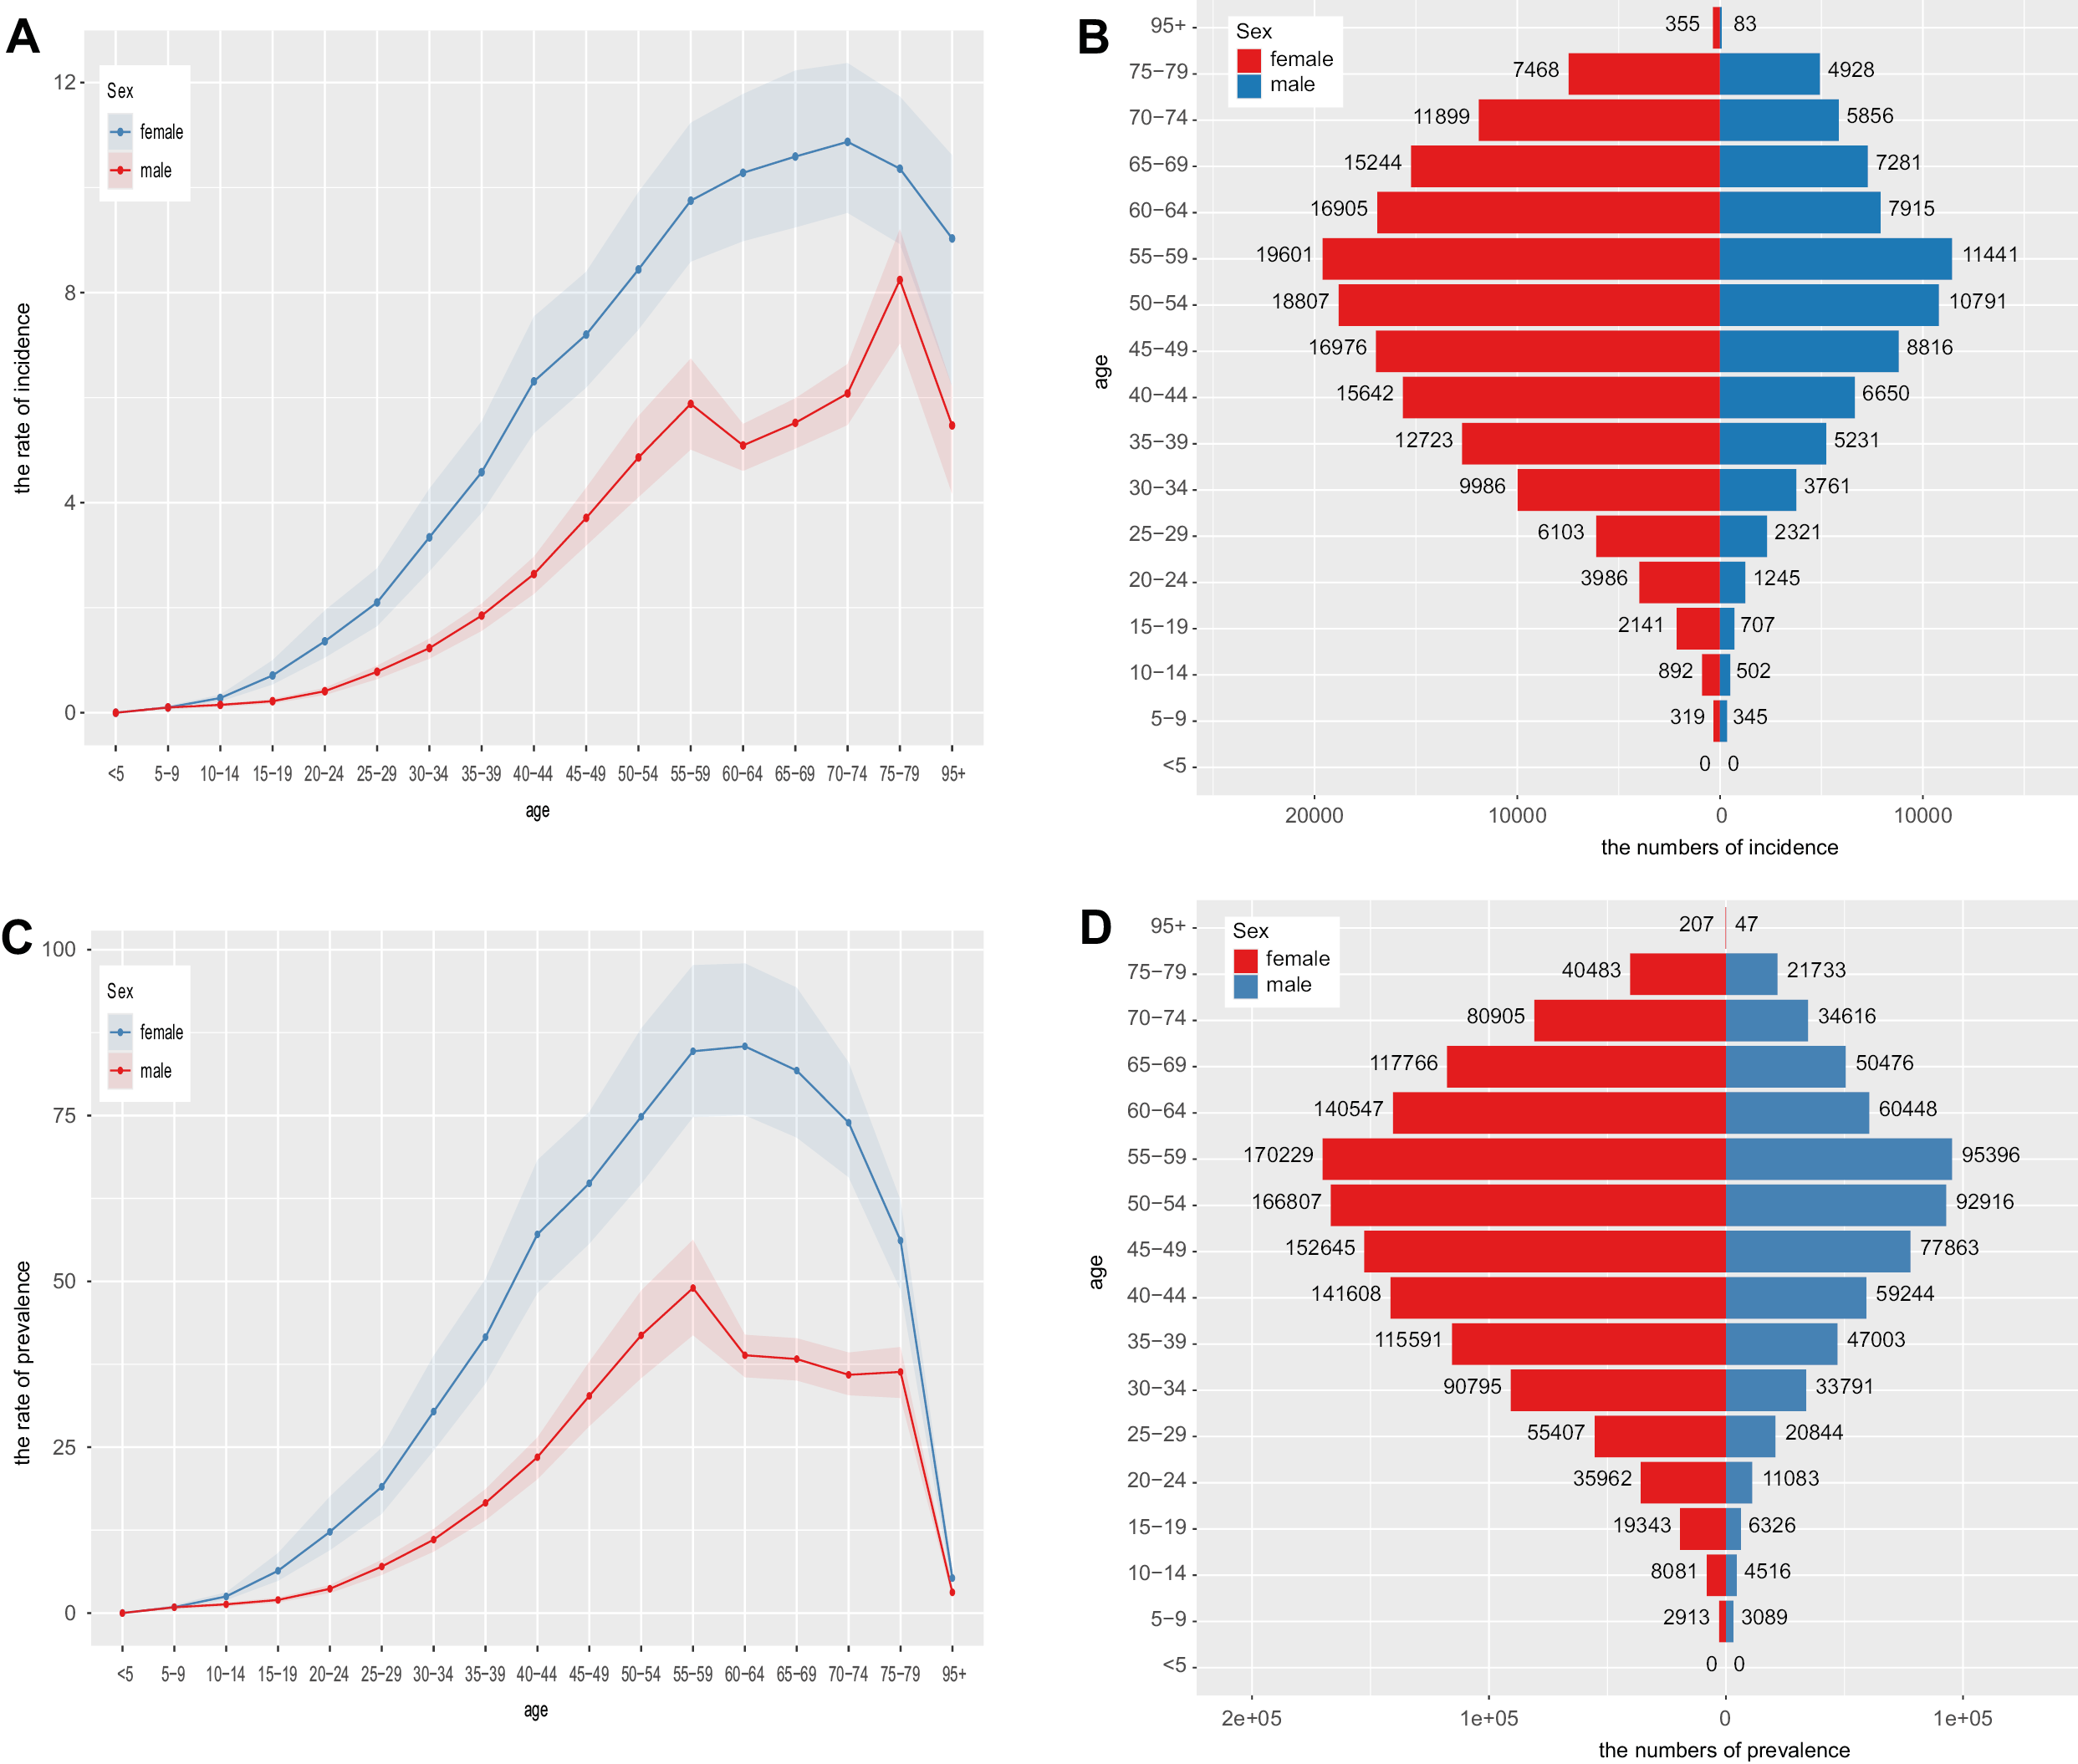
Incidence by age and gender revealed age-specific incidence rates for both men and women, with incidence increasing with age and peaking in middle age. Women exhibited a higher incidence rate than men (Figure 1A). The population pyramid illustrates the age and gender distribution, showing a balanced distribution in younger age groups and a higher proportion of women in older age groups (Figure 1B).
The age- and gender-adjusted incidence rates, as illustrated in Figure 1A, were further refined by incorporating specific factors such as risk factors and demographic variables, allowing for a more precise and contextualized analysis. The analysis confirms a higher incidence rate among women, with distinct peaks observed during middle age (Figure 1C). Additionally, the adjusted population pyramid illustrates the population distribution after incorporating these adjustments, highlighting demographic shifts and underscoring trends related to an aging population (Figure 1D).
Joinpoint analysis of the change of thyroid cancer incidence rate in the general population
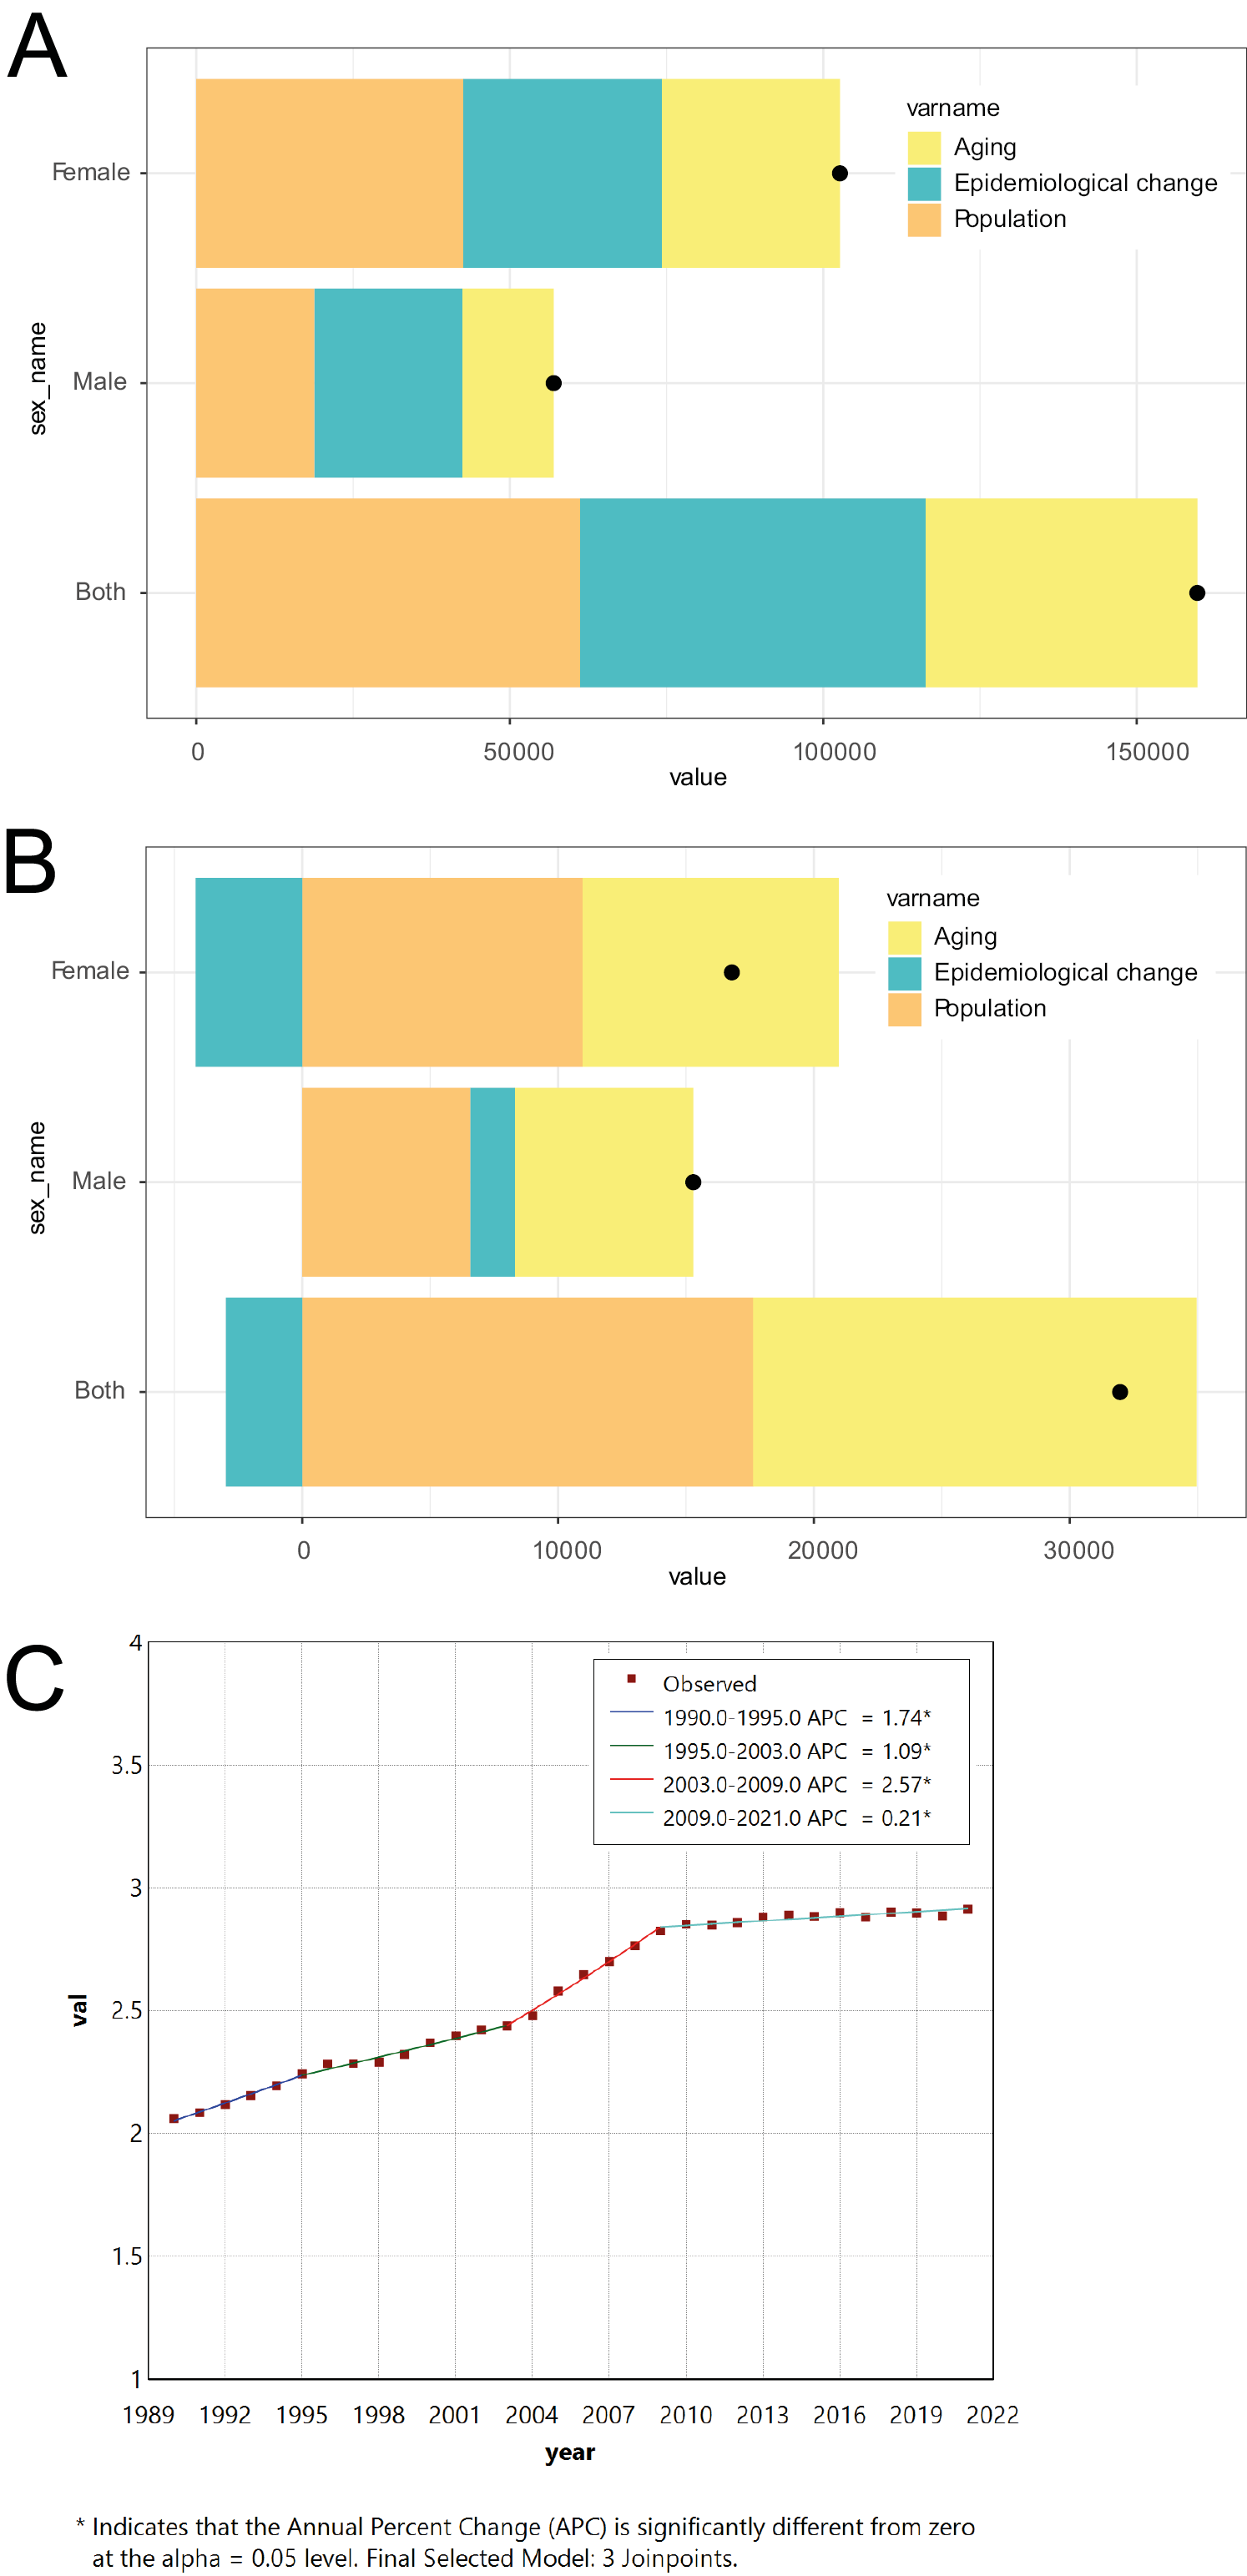
Figure 2 results show that Joinpoint analysis revealed significant changes in TC incidence rates at multiple time points for the overall population, females and males, with a more pronounced growth trend after the year 2000. Decomposition analysis indicates that the increase in incidence and mortality rates was primarily influenced by population aging, epidemiological changes and population growth. Among these factors, population aging and epidemiological changes have a more significant impact on women. Collectively, these factors contribute to the increasing burden of TC (Figure 2).
The clustering of gene expression across different samples
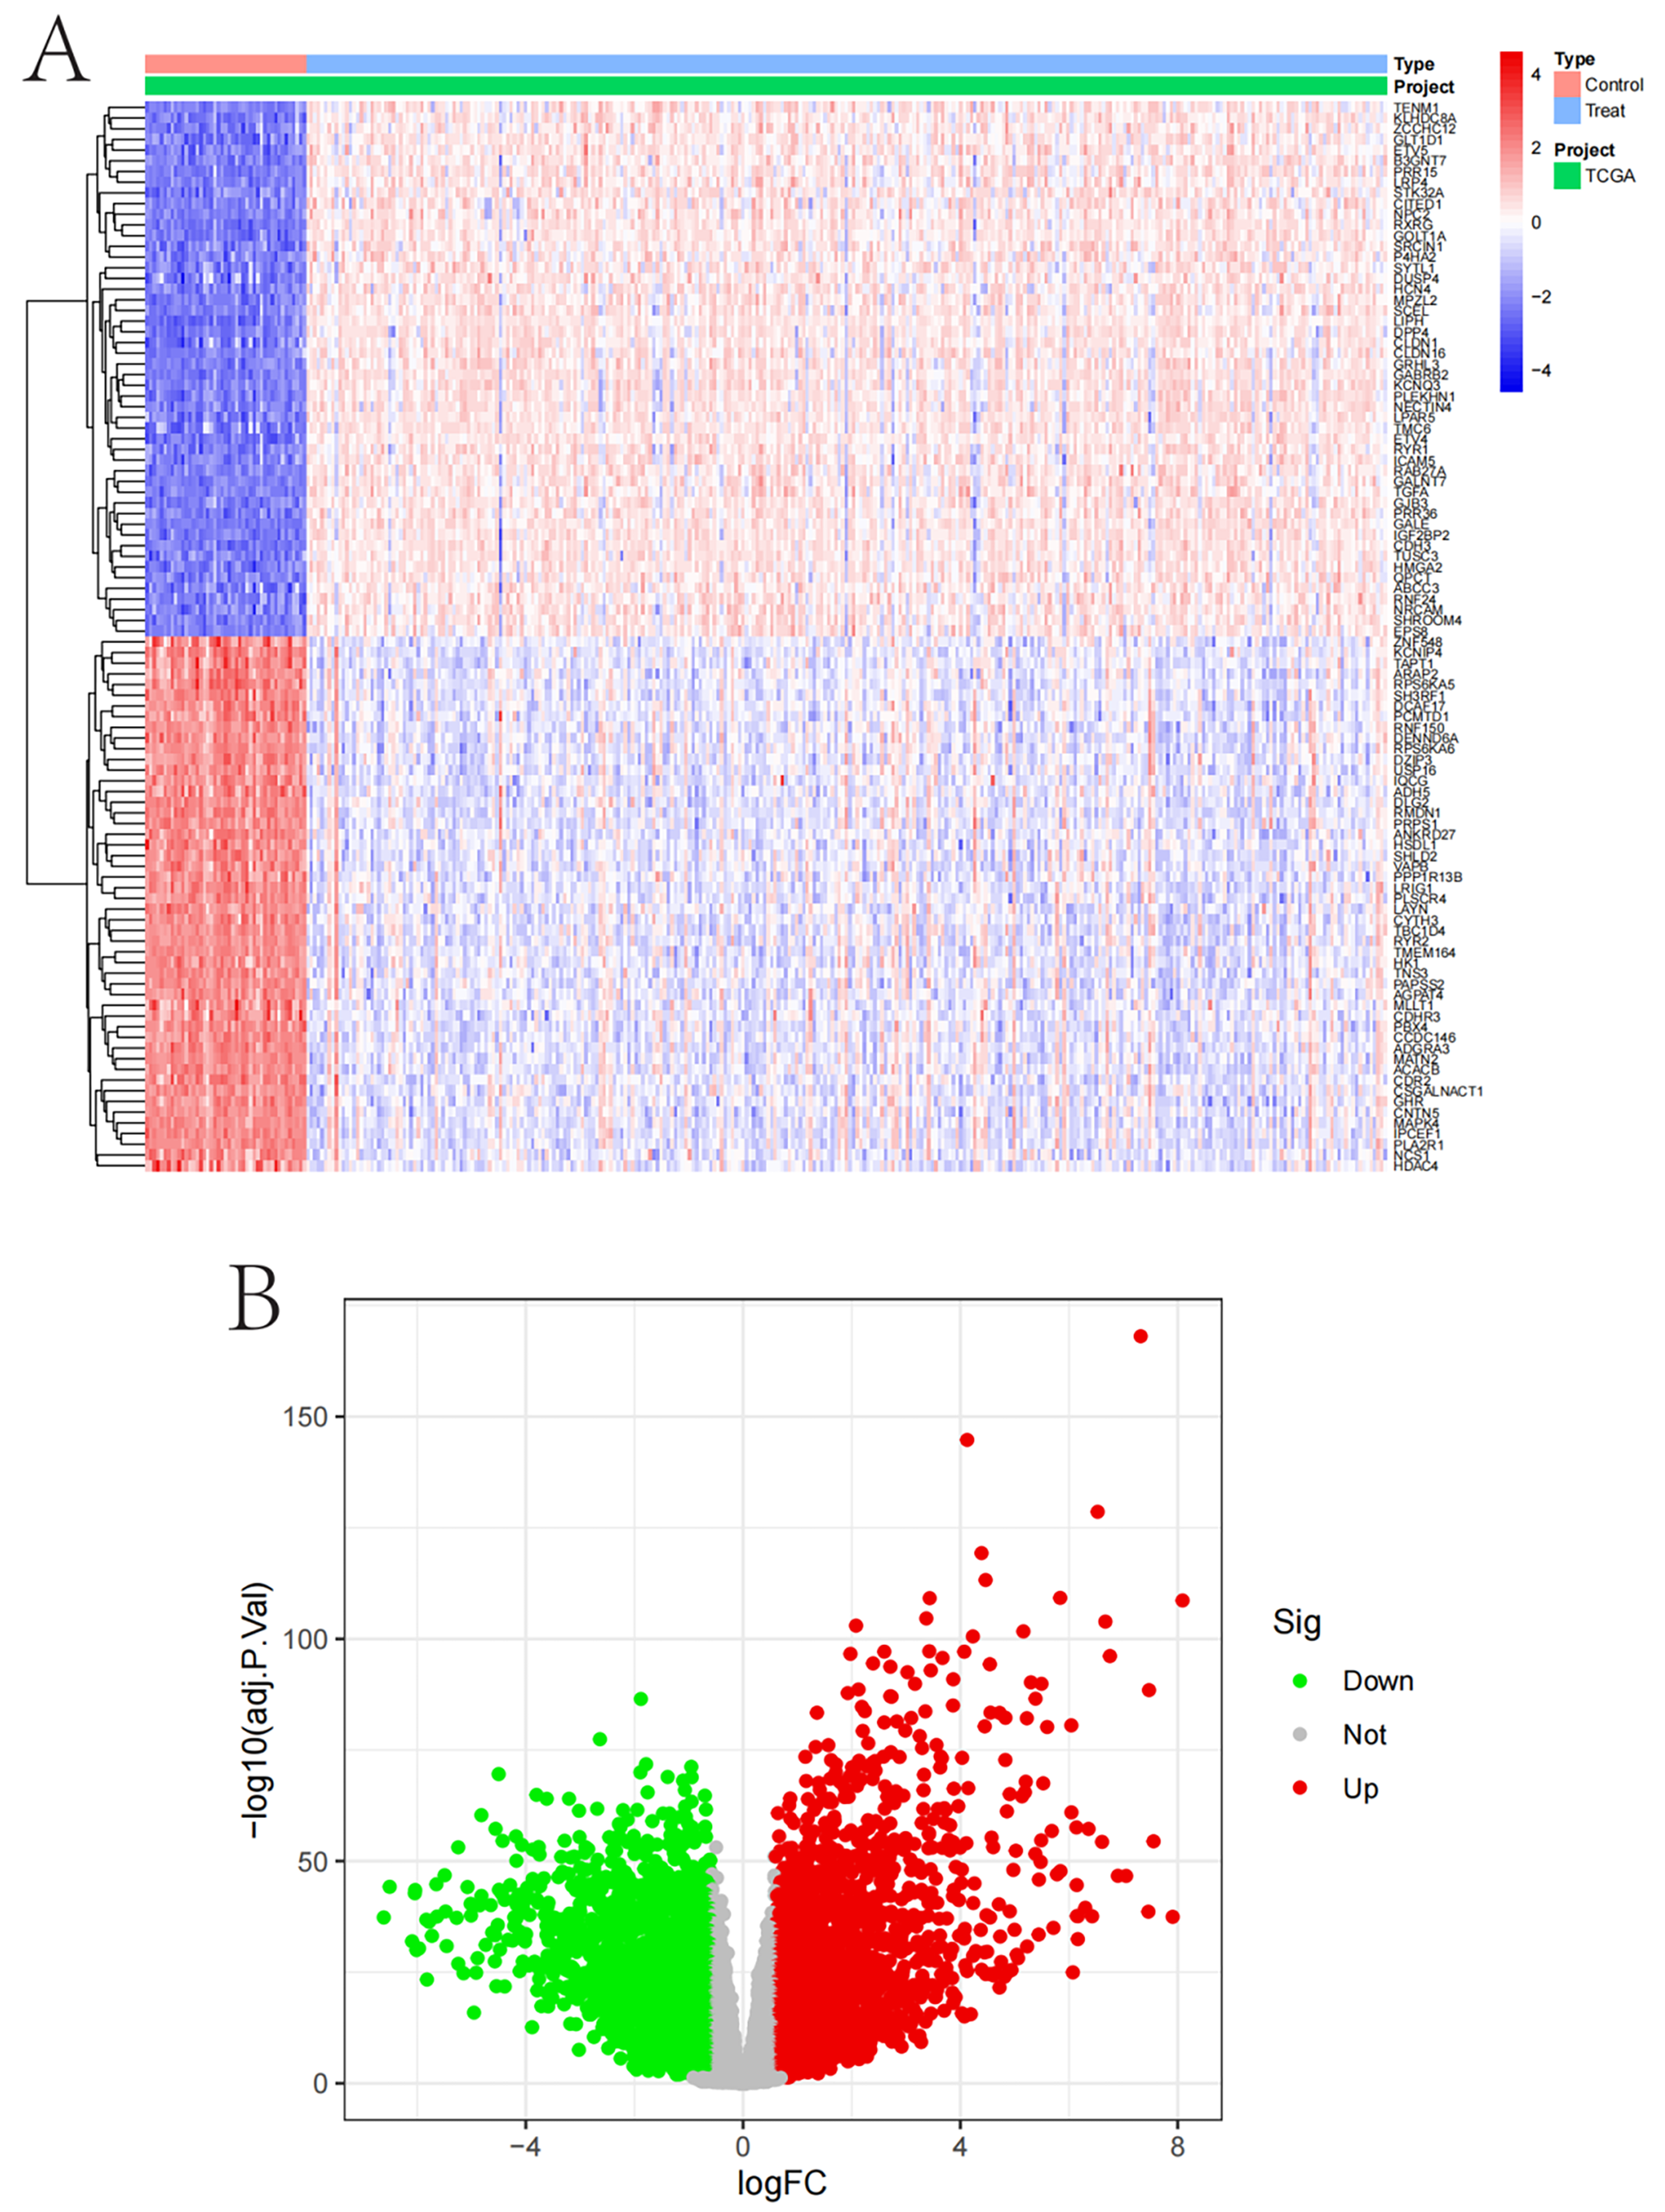
Figure 3A presents differential gene expression between the control and test groups, highlighting genes such as ETV4, LIPH and GABRR2, which exhibit higher expression (red) in the test group, while CDR2, HSDL1 and LRIG1 show lower expression (blue). Figure 3B visualizes the significance and magnitude of gene expression changes, where red dots indicate significantly upregulated genes and green dots represent significantly downregulated genes. The x-axis denotes the log fold change (logFC), while the y-axis represents the negative log of the adjusted p-value.
Weighted gene co-expression network analysis results
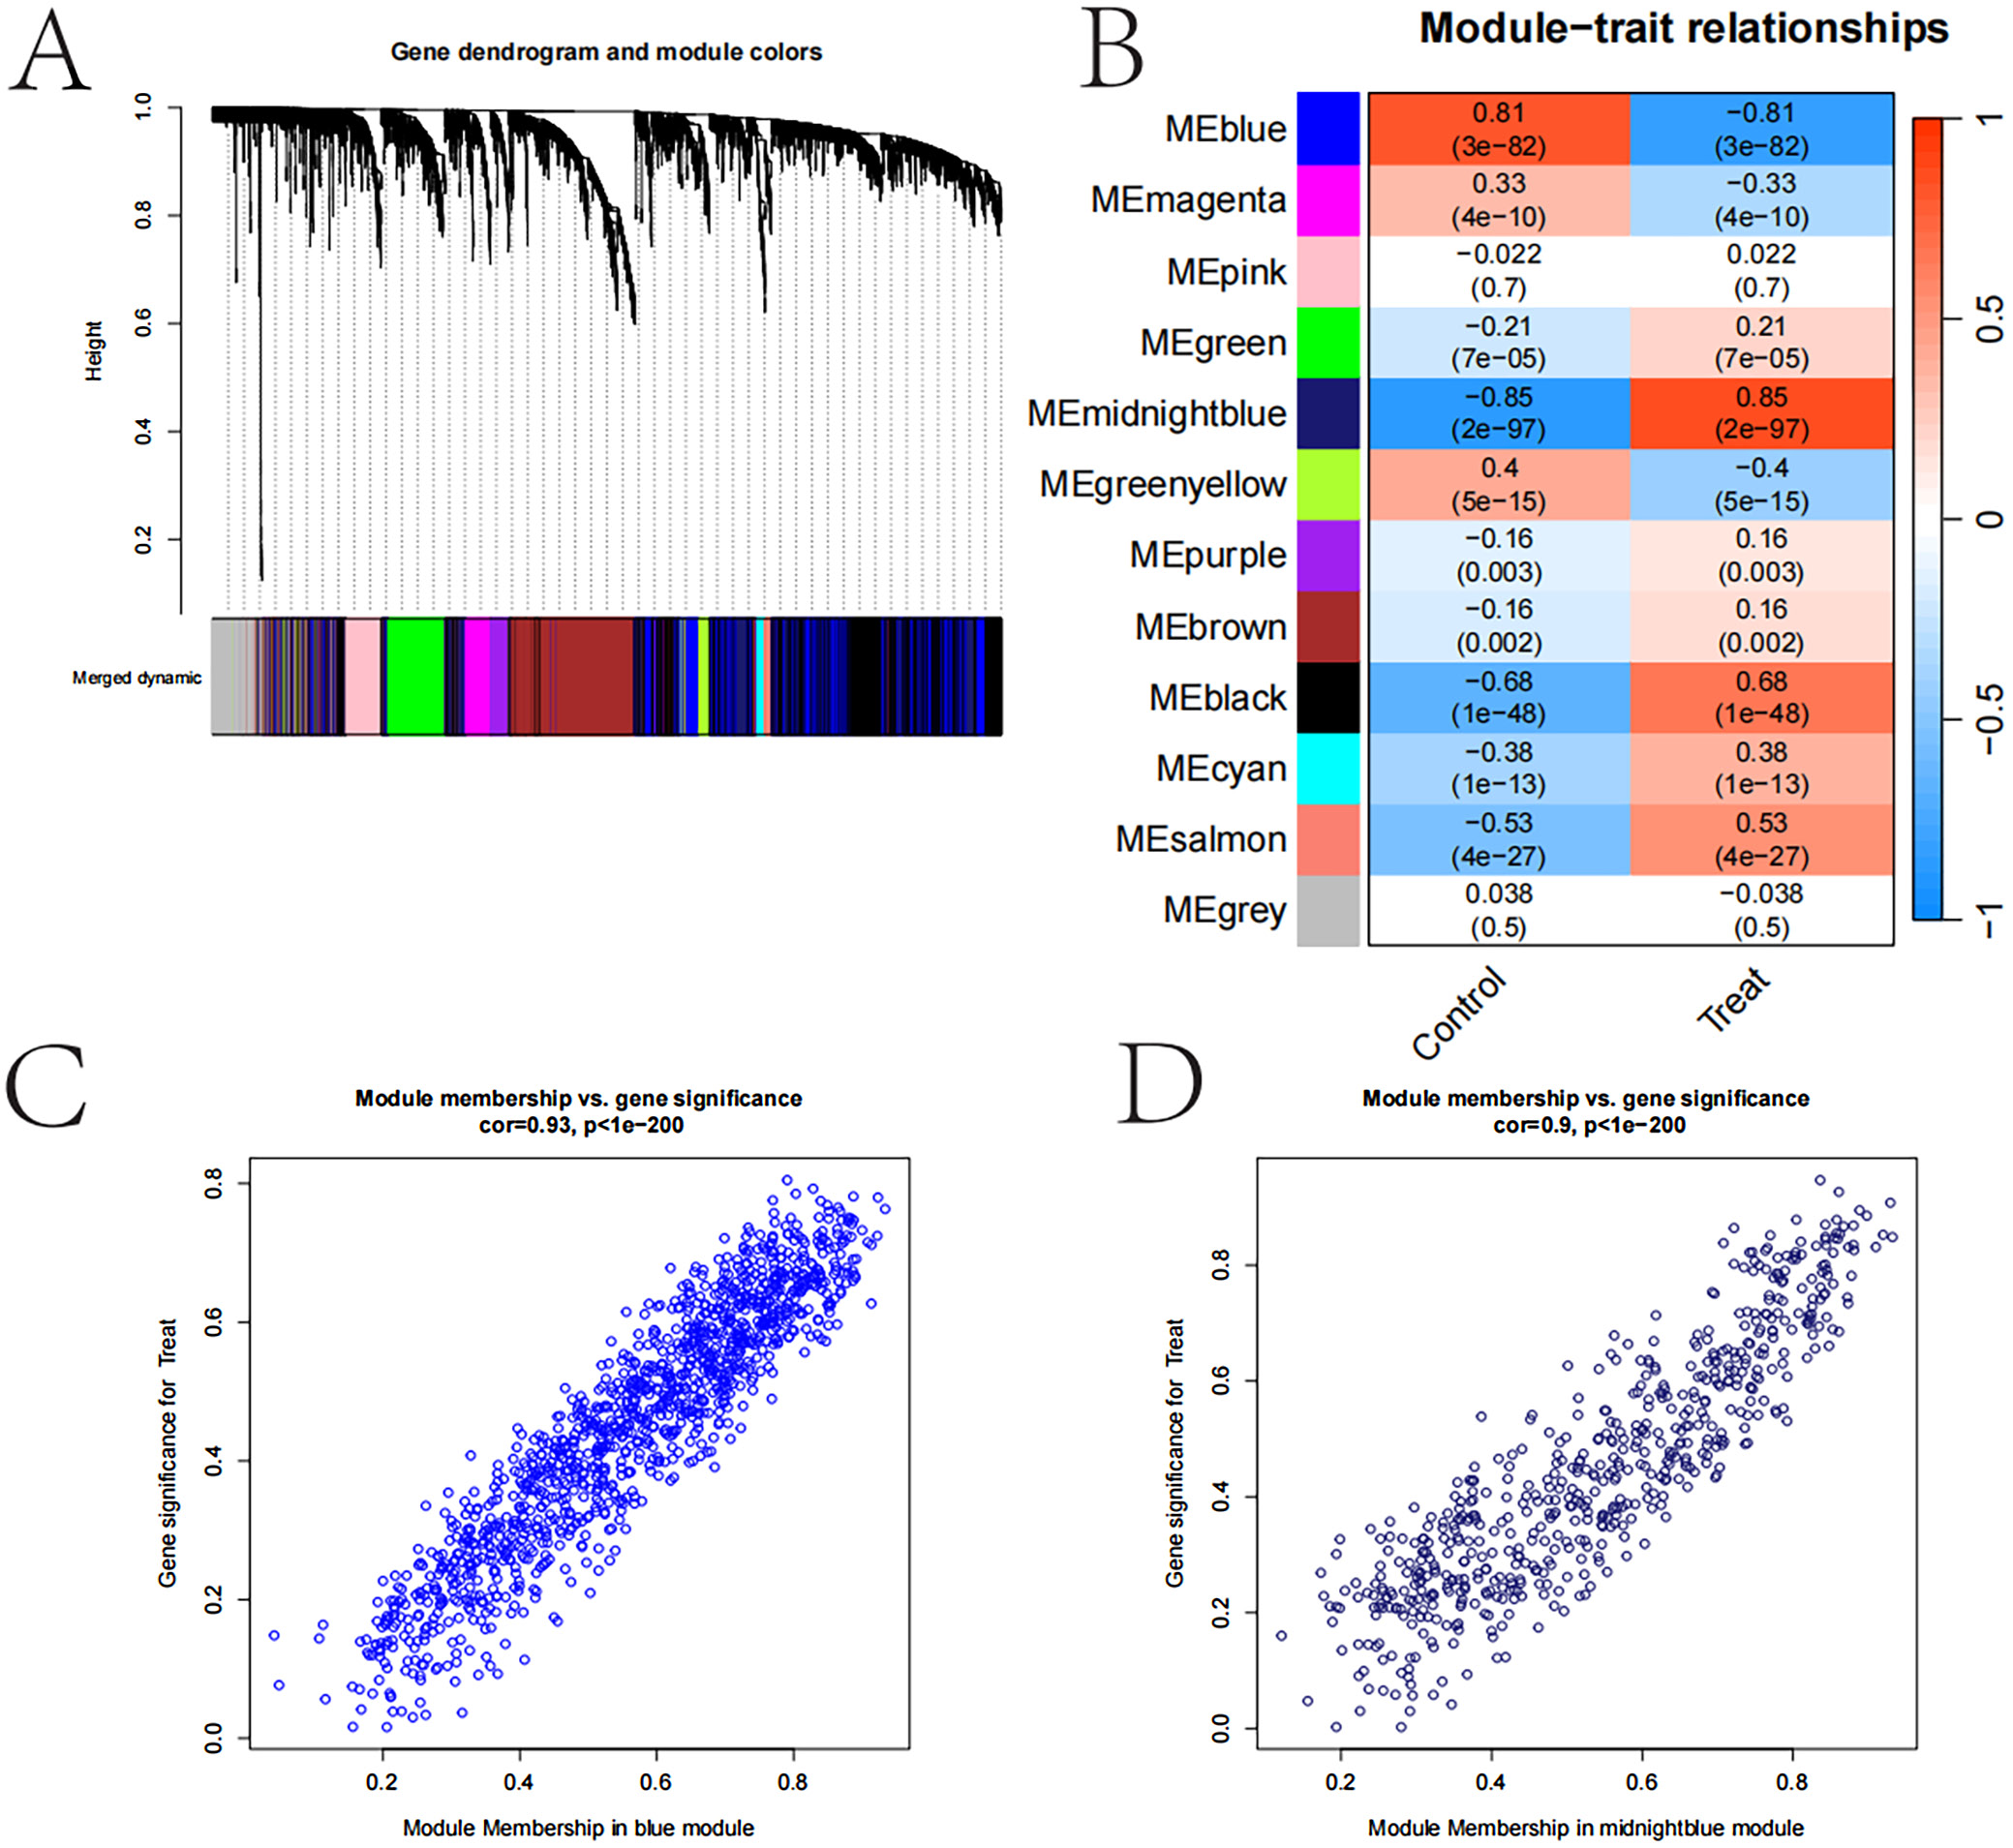
In Figure 4, the sample clustering tree and trait heatmap illustrate the distribution of samples under the “Control” and “Treat” traits, displaying distinct clustering patterns. The gene clustering tree, along with module colors, groups genes into multiple modules, each represented by a different color, highlighting gene co-expression patterns. The module-trait relationship heatmap reveals correlations between gene modules and clinical traits, with certain modules, such as MEblue and MEmagenta, showing strong positive correlations with the “Treat” trait. These findings suggest that these modules may play a crucial role in TC.
The gene significance bar plot illustrates the importance and significance of genes within each module, with error bars representing SEs. The scatter plot of module membership compared to gene significance further confirms the strong correlation between module membership and gene significance, particularly in the midnight blue and blue modules. These findings suggest that the gene modules identified through WGCNA may play critical roles in the development and progression of TC, offering valuable insights for further research and potential therapeutic target identification (Figure 4).
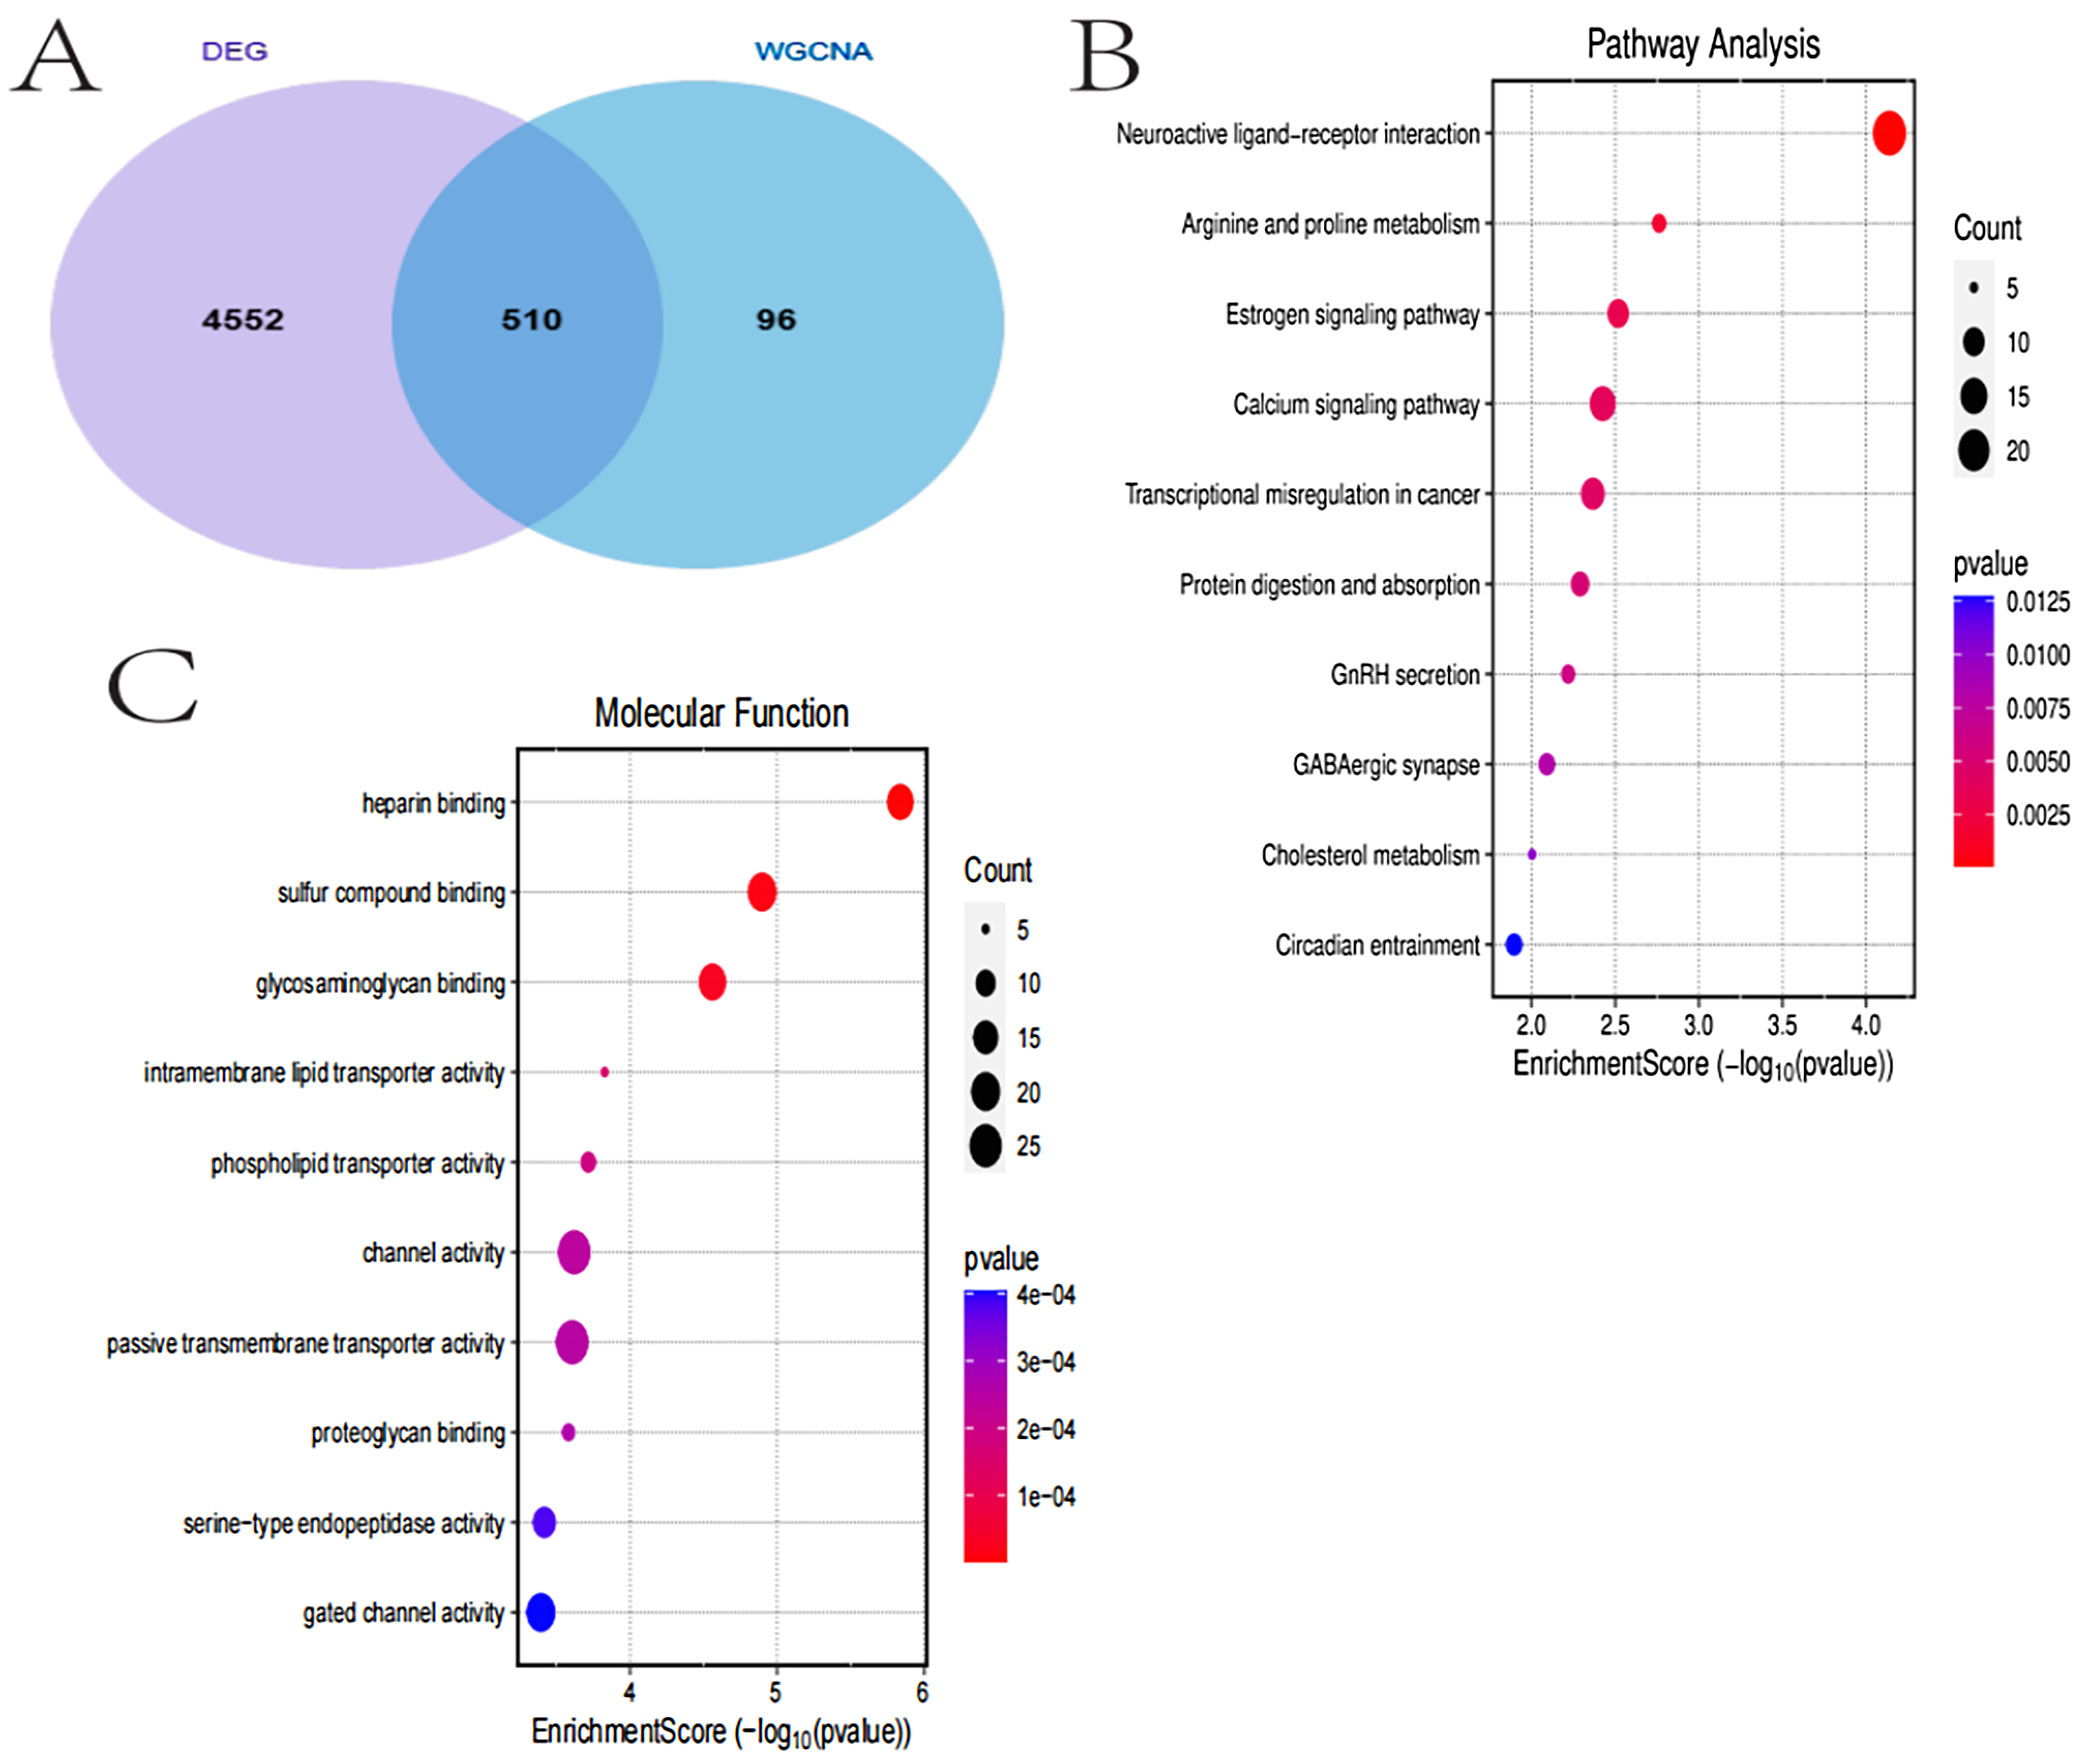
Differential expression gene and WGCNA module overlap and functional enrichment
The analysis results in Figure 5 indicate that 510 genes overlapped between DEGs and gene modules identified through WGCNA, suggesting that these genes may play critical roles in TC. Gene Ontology (GO) enrichment analysis revealed significant enrichment of these genes in biological processes such as cell proliferation, signal transduction and metabolic regulation. The gene-pathway network diagram illustrated the connections between key genes and multiple pathways, indicating their involvement in various biological processes. The pathway network diagram further highlighted the intricate interactions between pathways. Molecular function enrichment analysis reveals significant enrichment in functions such as ligand binding and enzyme activity, while pathway analysis underscores the importance of neuroligand-receptor interactions and metabolic pathways. These findings provide valuable insights into the molecular mechanisms of TC and may offer potential directions for developing therapeutic strategies (Figure 5).
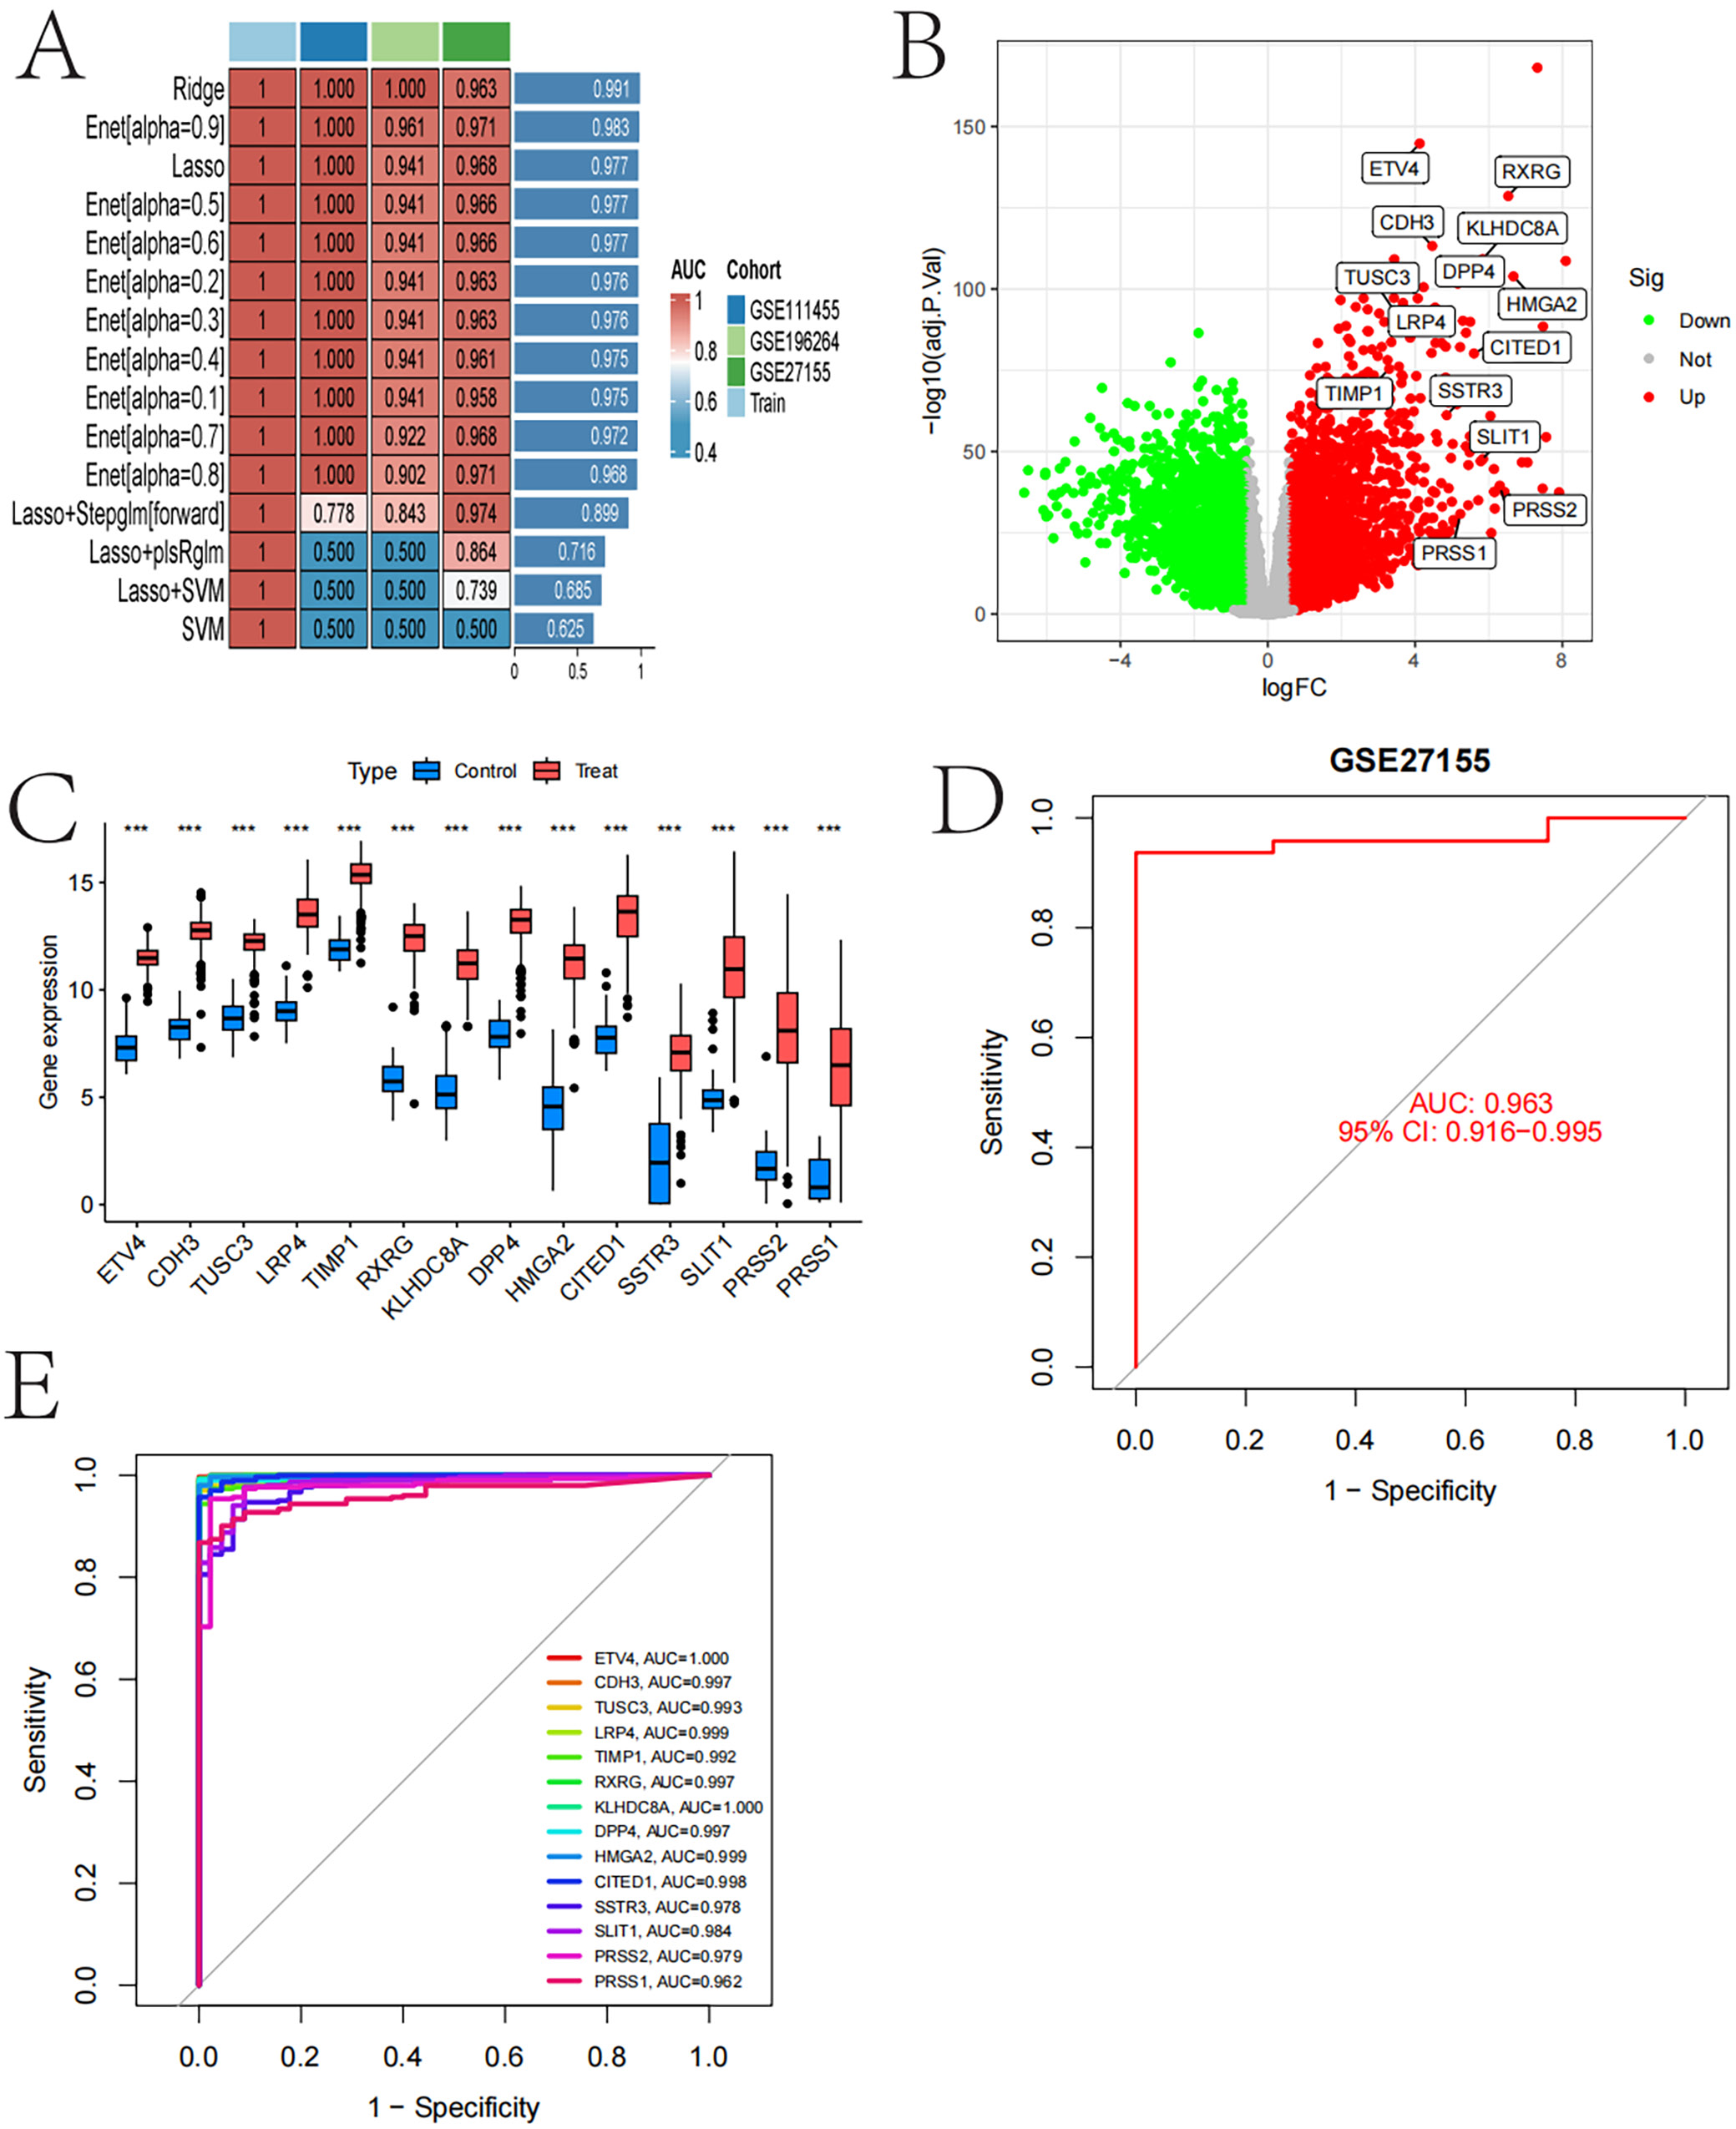
Model performance evaluation, gene expression difference and predictive ability analysis
Figure 6 results demonstrate the performance of various machine learning models across different datasets, using AUC values as evaluation metrics. The Ridge and LASSO models performed best on the GSE27155 dataset, achieving AUC values close to 1. The volcano plot highlights significantly upregulated and downregulated genes, including ETV4 and RXRG. Gene expression box plots showed significant differences in gene expression between control and experimental groups. The gene correlation matrix revealed strong correlations among multiple genes. The receiver operating characteristic (ROC) curve for the GSE27155 dataset indicates excellent model prediction performance, with an AUC of 0.963. Additionally, multiple genes exhibited high predictive potential as biomarkers, with ETV4 and KLHDC8A achieving perfect AUC scores of 1. These analyses suggest that the identified genes hold promise for TC diagnosis and prediction (Figure 6).
Thyroid cancer single cell RNA sequencing analysis
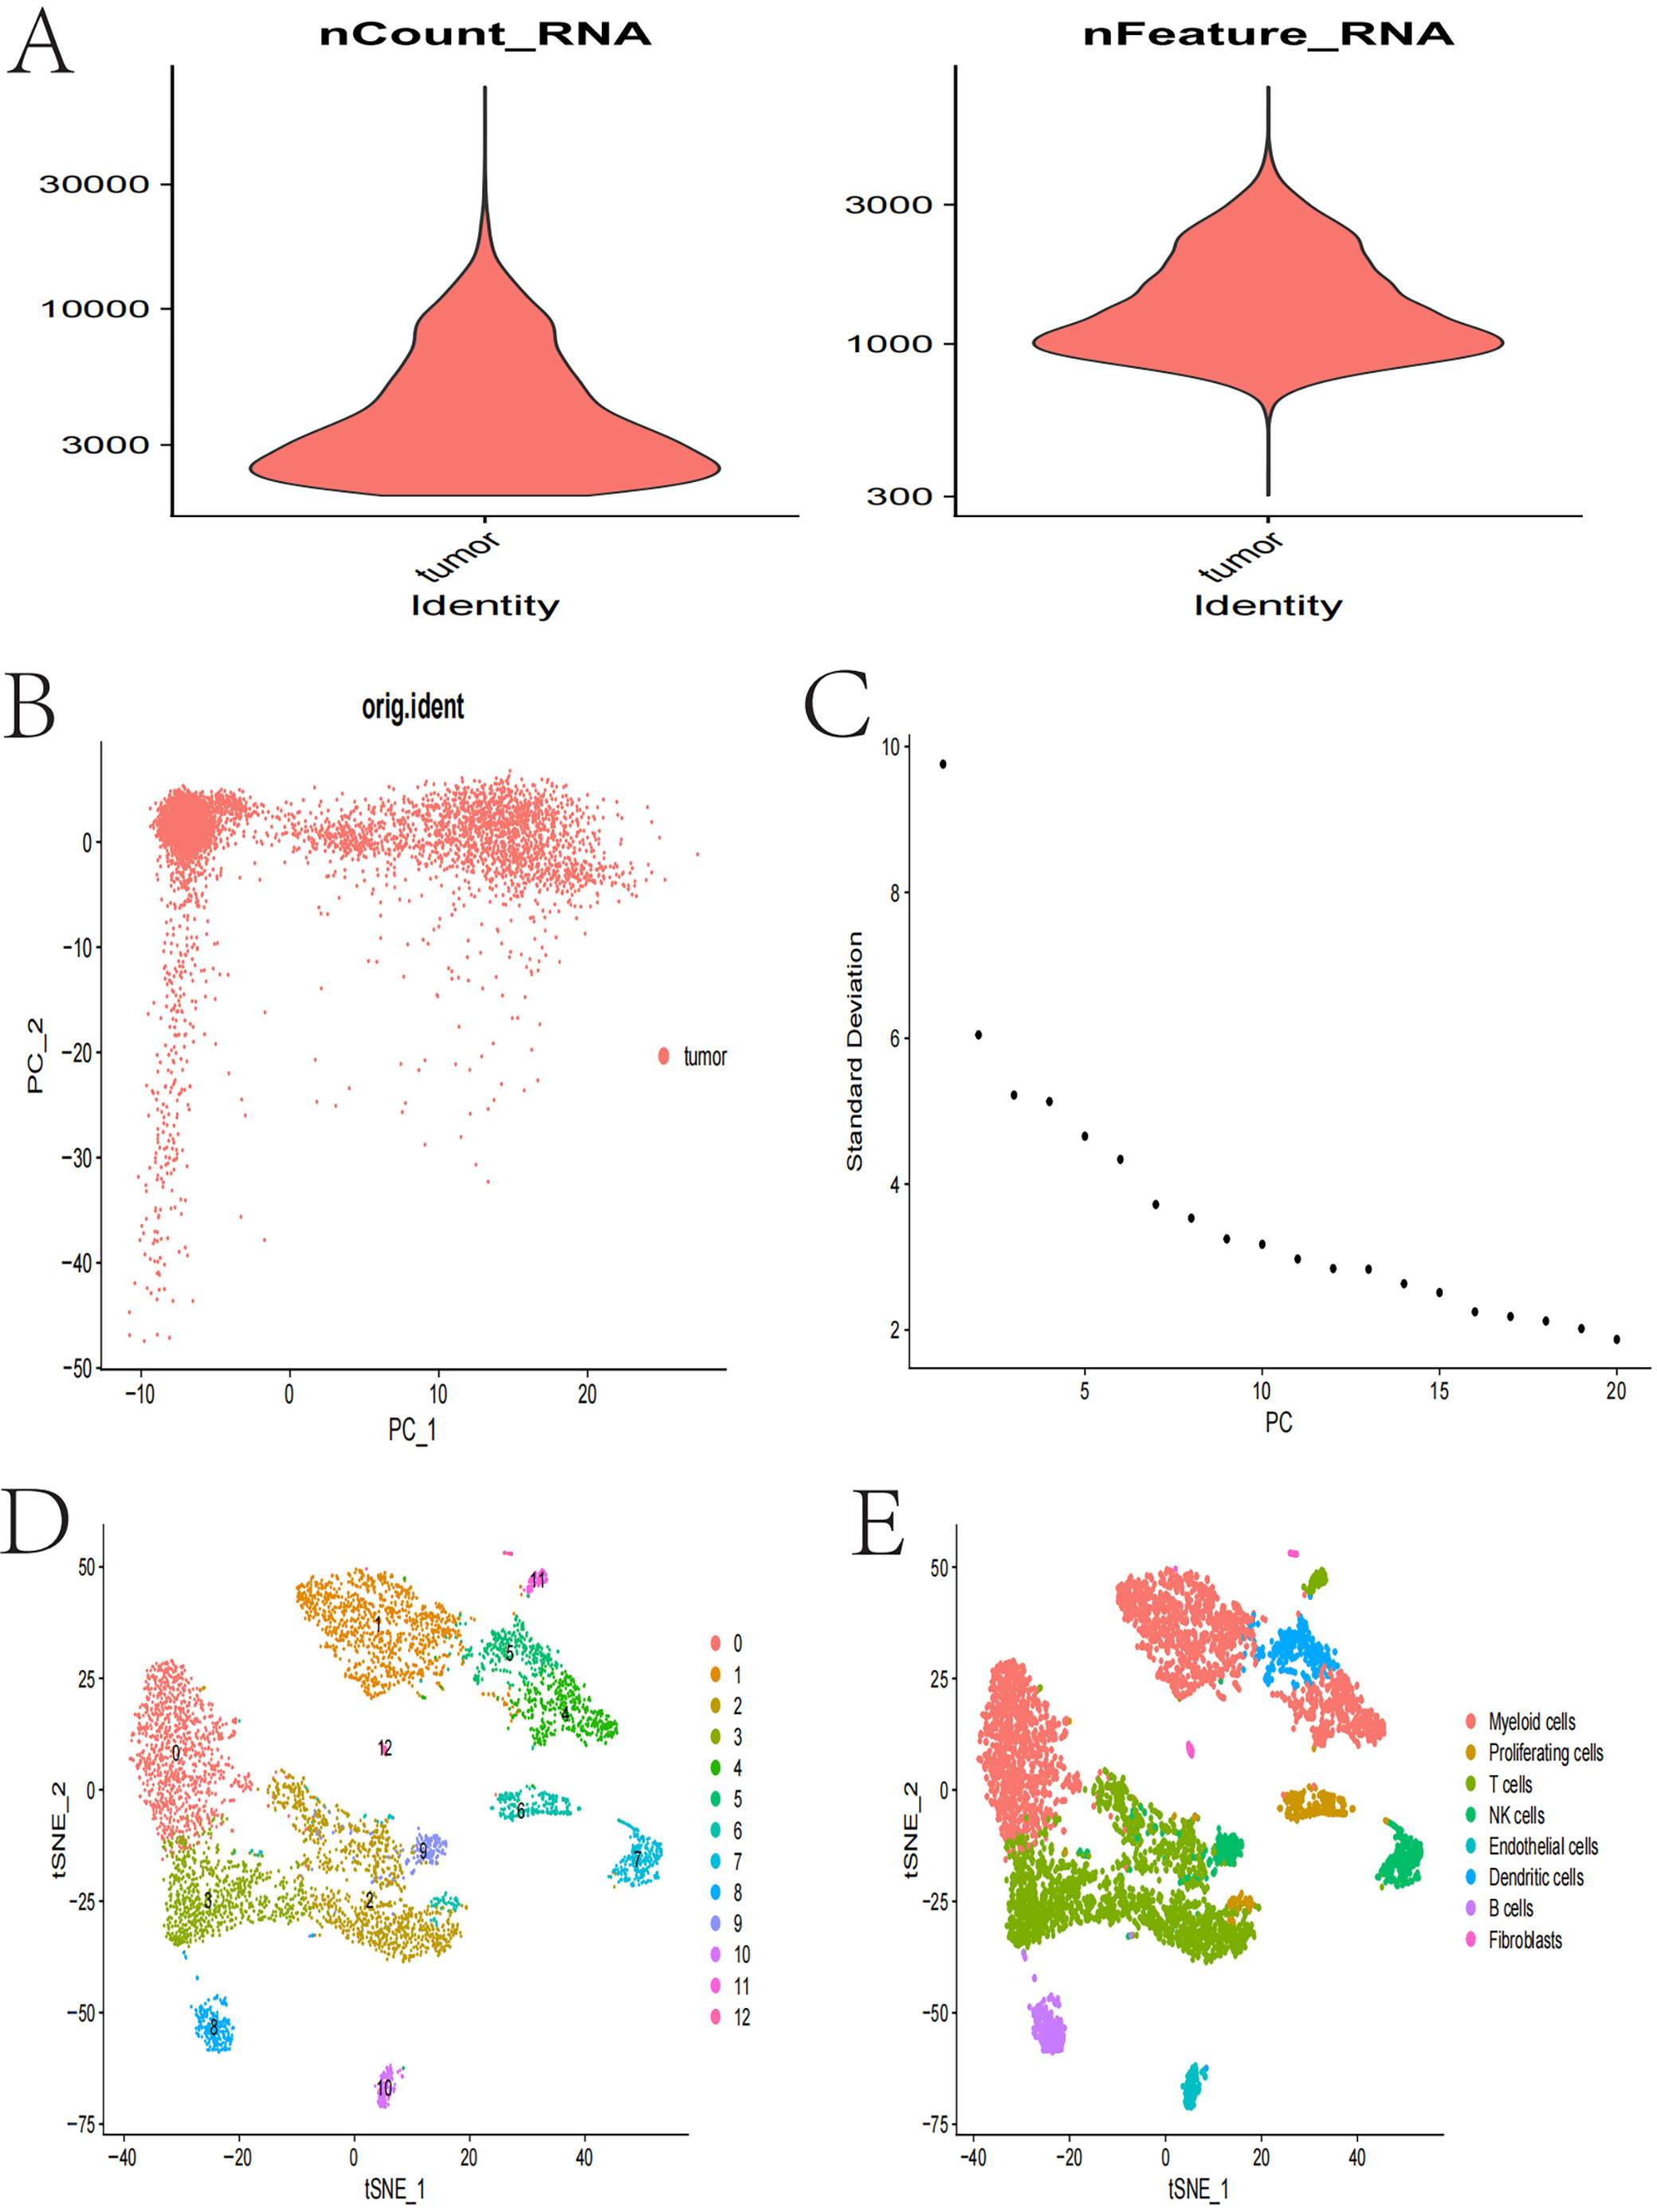
In Figure 7, violin plots illustrate the distribution of RNA counts and feature numbers in tumor samples, highlighting variability between samples and indicating diversity in gene expression across different cells. The PCA scatter plot visualizes sample distribution using PCA, with samples clustering along the first 2 principal components (PC1 and PC2), providing insights into the main sources of variation.
The variance explained plot displays the SD of each principal component, with the first few components explaining most of the data variance, providing a basis for principal component selection. The t-SNE clustering plot identifies multiple distinct cell populations through t-SNE analysis, revealing cellular diversity and potential subgroups. The t-SNE cell type plot further annotates and distinguishes different cell types based on t-SNE results, including myeloid cells, proliferating cells, T cells, natural killer (NK) cells, endothelial cells, dendritic cells, B cells, and fibroblasts. These analyses provide important information about cellular heterogeneity in TC, contributing to the understanding of its biological characteristics and potential therapeutic targets (Figure 7).
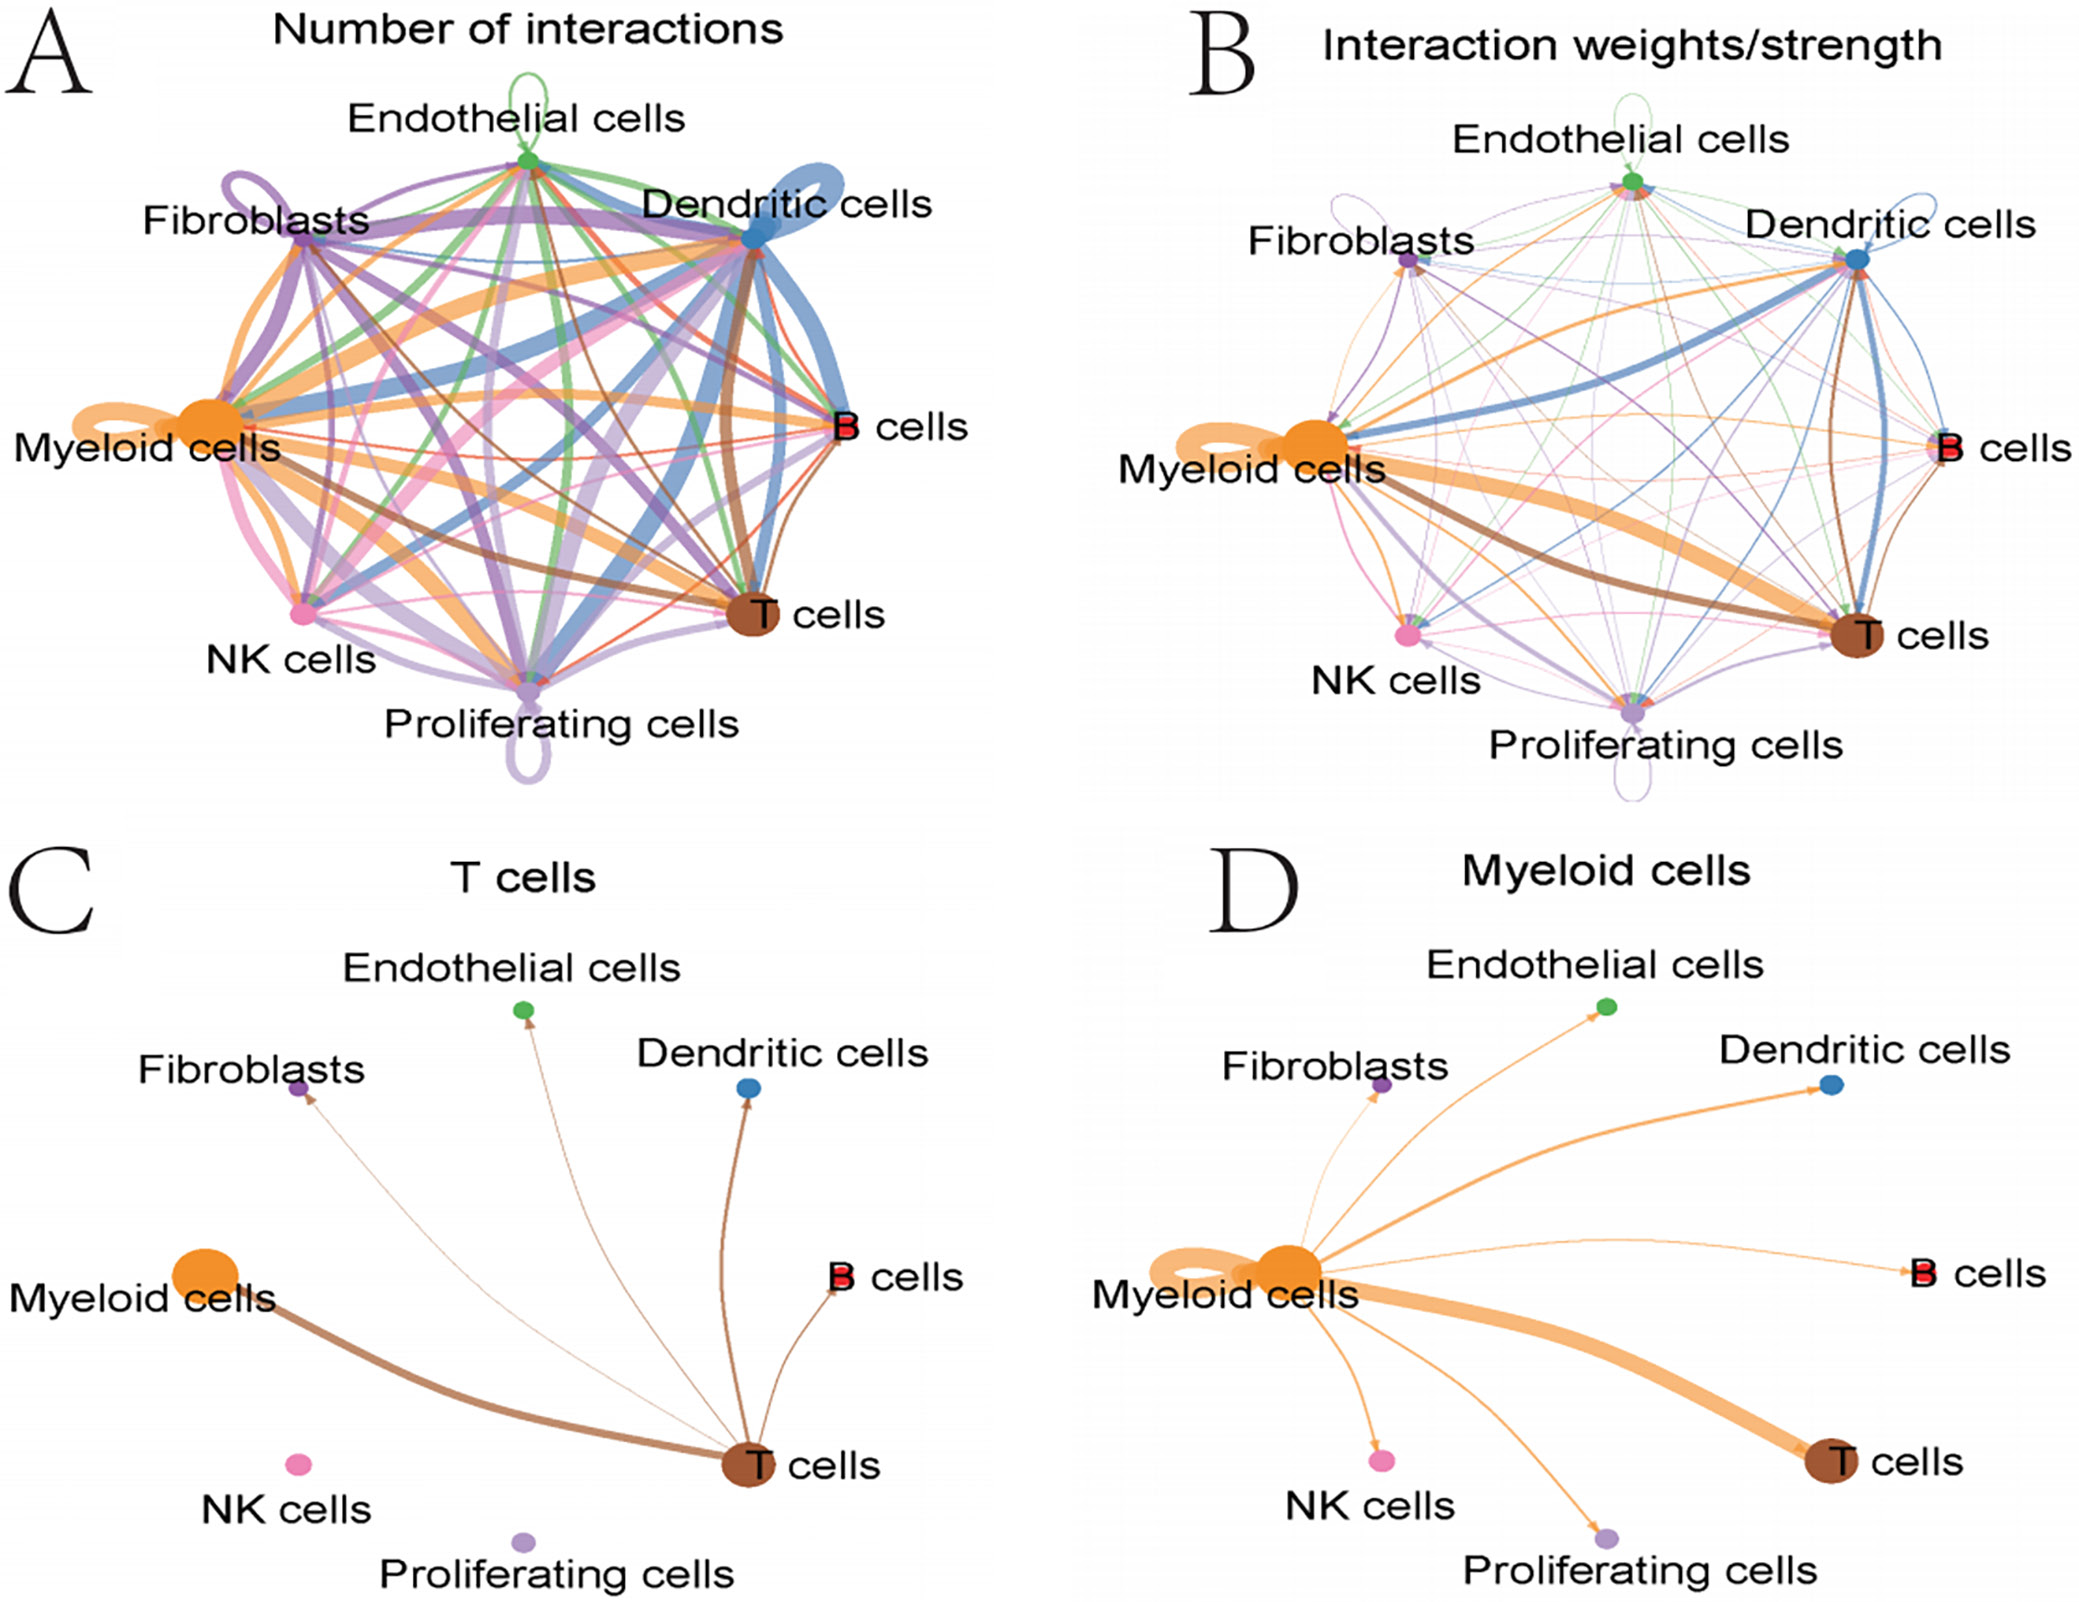
For network diagram of intercellular interaction quantity
Cell interaction network shows frequent interactions among myeloid cells, T, B, NK cells, endothelial cells, and fibroblasts. Notably, myeloid–NK cell interactions are particularly strong. T-cell network focuses on T cell interactions with myeloid and dendritic cells, crucial for immune responses. Myeloid cell network highlights extensive interactions with T-cells, dividing cells and endothelial cells, emphasizing their role in the tumor microenvironment. Macrophage migration inhibitory factor (MIF) signaling pathway primarily involves myeloid and T cells in the MIF signaling process. GALECTIN signaling pathway involves myeloid cells, endothelial cells and fibroblasts, with JAK-STAT as a central signaling pathway (Figure 8).
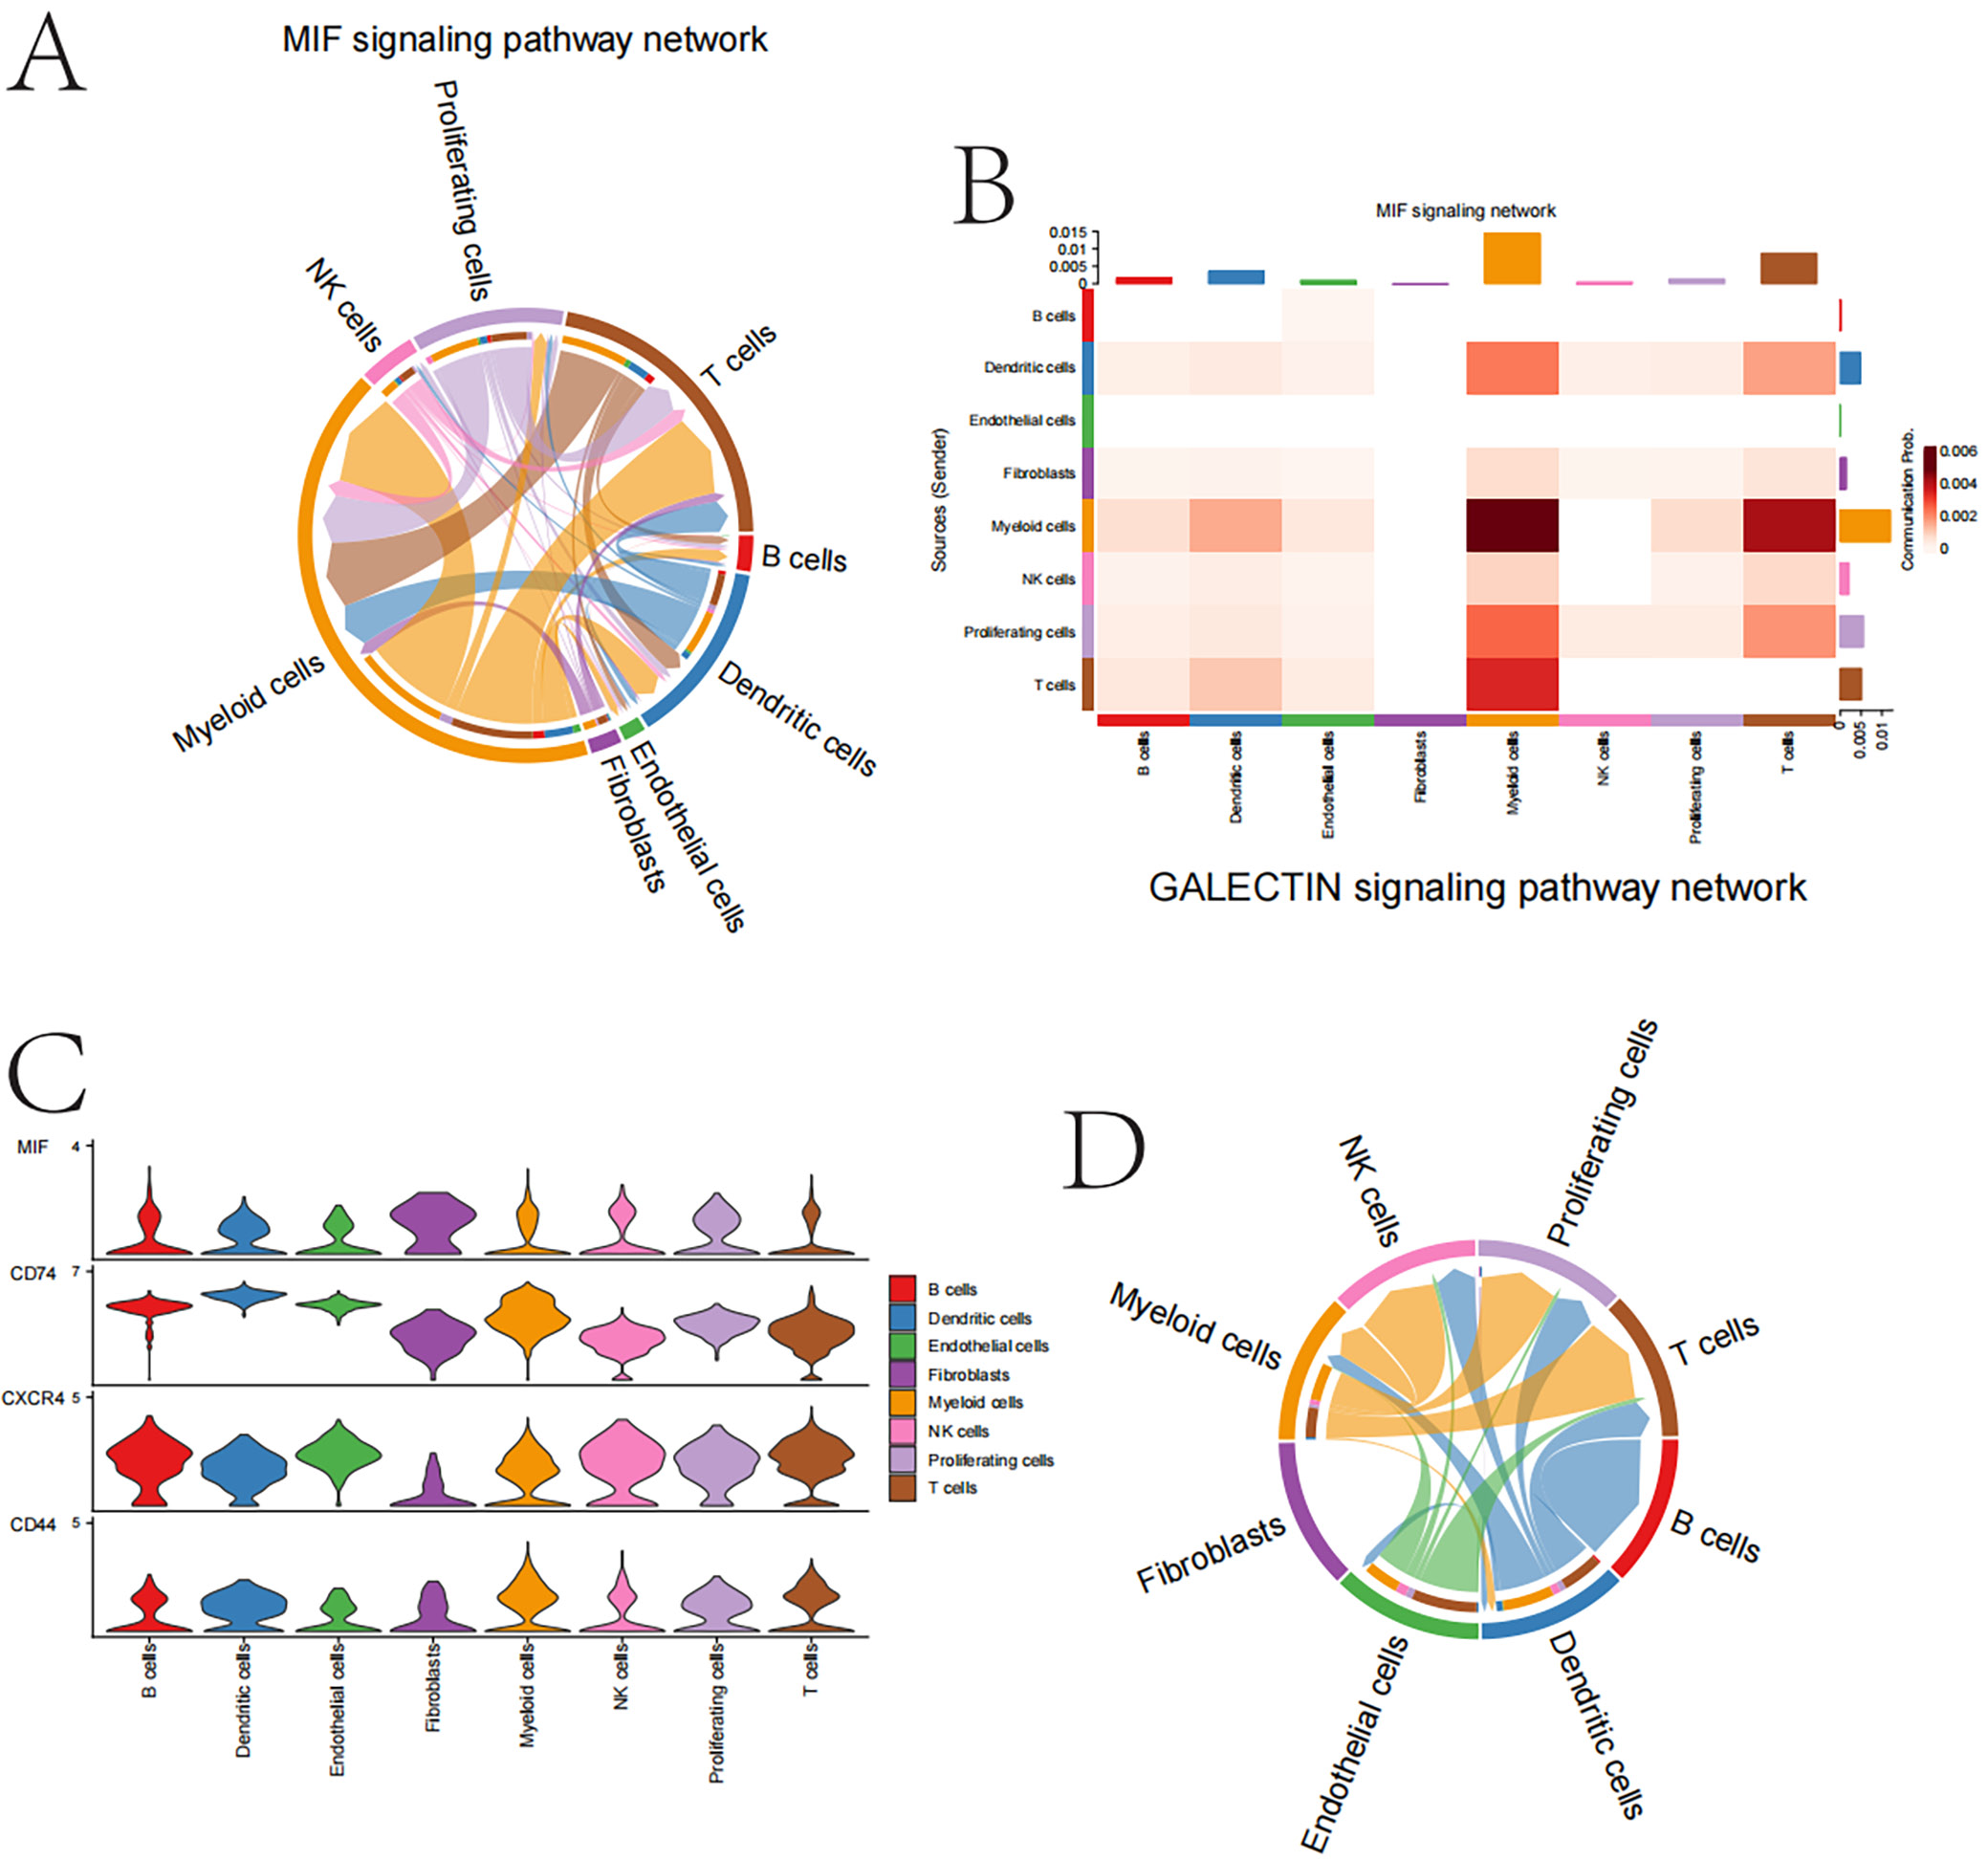
Analysis of cell–cell communication and gene expression in the MIF and GALECTIN signaling pathways
Among these interactions, the communication between myeloid cells and Treg/NKr is particularly important in the MIF signaling pathway, as it may play a pivotal role in explaining both immunological functions and the relevance to the tumor microenvironment. Among these well-known molecules, genes such as MIF and its receptor CD74 (along with CXCR4) are predominantly expressed by myeloid cells and T cells, suggesting their crucial roles in cell-type signaling and immune regulation.
The interaction between myeloid cells and endothelial cells in the GALECTIN signaling pathway emerges as a strong potential mediator of tumor progression, playing an unsuspected yet significant role in angiogenesis. Moreover, the interaction strength was highest between myeloid cells and fibroblasts, with gene expression patterns indicating that many of these cells are actively engaged in central signal transduction processes within this population. Data from the heatmap and violin plot further highlight the differential expression of genes within cell types involved in these pathways, providing insights into intercellular communication.
In summary, our findings reveal a complex interplay between the MIF and GALECTIN pathways in papillary TC cells, involving myeloid dendritic cells. This insight may have significant implications for understanding cancer biology and developing future therapeutic targets (Figure 9).
Discussion
Thyroid cancer is a heterogeneous disease with various subtypes, each exhibiting unique molecular characteristics and biological behaviors. As research progresses, more molecular drivers are being identified, playing key roles in the initiation and progression of TC. These drivers include gene mutations, gene fusions and changes in expression levels, affecting processes like cell signaling, cell cycle control and apoptosis. Myeloid cells play a crucial role in the tumor microenvironment, where they can be educated or activated by tumor cells to promote tumor development and immune evasion. The expression and function of inflammatory factors or immune-related molecules in myeloid cells may significantly impact the progression of TC. To further elucidate the complex interactions within the tumor microenvironment (TME), advanced technologies, such as single-cell RNA sequencing (scRNA-seq), have emerged as indispensable tools, enabling high-resolution profiling of cellular heterogeneity and intercellular communication. Single-cell RNA sequencing enables the analysis of cellular heterogeneity within the tumor microenvironment at the single-cell level, providing detailed gene expression profiles of various cell subpopulations. This technology facilitates the identification of specific cell types that interact with myeloid cells and their communication patterns through the MIF and GALECTIN signaling pathways.8, 9, 10
Macrophage migration inhibitory factor supports tumor growth and metastasis by enhancing myeloid cell activation and their adaptability to TME.11, 12, 13 The GALECTIN signaling pathway, along with other signaling mechanisms, has been identified as a critical contributor to tumorigenesis in various cancers. It primarily functions by disrupting cell–cell interactions and promoting immune evasion.
Our study highlights the crucial role of the GALECTIN pathway in mediating interactions between medullary cells, endothelial cells and fibroblasts. This finding is further supported by other studies, emphasizing its significance in tumor cell–stromal cell interactions. Members of the GALECTIN family specifically bind to carbohydrates, influencing cell adhesion and migration. This interaction plays a crucial role in tumor cell survival, particularly during migration through the basement membrane or the tumor extracellular matrix (ECM).15, 16, 17
Therapeutic agents that inhibit GALECTIN binding have the potential to reduce tumor cell adhesion and migration, thereby limiting metastasis. This strategy could be particularly effective in preventing tumor cells from interacting with the ECM and stromal cells. Combining GALECTIN inhibitors with other treatments, such as immunotherapy or chemotherapy, may enhance overall efficacy by simultaneously targeting multiple aspects of tumor progression and immune evasion.
In this study, leveraging machine learning approaches and demonstrating superior performance compared to several existing studies, we developed a diagnostic model for TC with a high degree of predictive accuracy. The Ridge and LASSO models achieved AUC values close to 1 on the GSE27155 dataset, indicating excellent performance in identifying gene features associated with TC. These results align with findings from other studies utilizing machine learning for cancer prediction, further validating the potential of machine learning in tumor diagnosis.
Limitations
The study has several limitations. First, it relies on publicly available datasets, which may not fully represent all geographic or demographic variations, potentially limiting the generalizability of the results. Second, the machine learning models, though validated, are based on a specific dataset and may require further validation across more diverse populations. Third, while single-cell RNA sequencing provides valuable insights, our analysis focuses primarily on myeloid cells, leaving other cell types underexplored. Lastly, the study does not account for potential changes in diagnostic techniques or environmental factors over the years, which may influence TC trends.
Conclusions
This study conducted a comprehensive analysis of global TC incidence and prevalence from 1990 to 2021, identifying multiple influencing factors and their interactions. Using the age-period-cohort model, we found that TC incidence significantly increases with age, particularly among women. Our findings suggest that population aging, epidemiological shifts and environmental factors collectively contribute to the rising burden of TC.
Data availability statement
The datasets supporting the findings of the current study are openly available in figshare at https://figshare.com/s/5cd186232b9ea779ee41.
Consent for publication
Not applicable.
Use of AI and AI-assisted technologies
Not applicable.