Abstract
Background. Clear cell renal cell carcinoma (ccRCC) is the most common subtype of renal cell carcinoma (RCC). Due to the lack of symptoms until advanced stages, early diagnosis of ccRCC is challenging. Therefore, the identification of novel secreted biomarkers for the early detection of ccRCC is urgently needed.
Objectives. This study aimed to identify novel secreted biomarkers for diagnosing ccRCC using bioinformatics and machine learning techniques based on transcriptomics data.
Material and methods. Differentially expressed genes (DEGs) in ccRCC compared to normal kidney tissues were identified using 3 transcriptomics datasets (GSE53757, GSE40435 and GSE11151) from the Gene Expression Omnibus (GEO). Potential secreted biomarkers were examined within these common DEGs using a list of human secretome proteins from The Human Protein Atlas. The recursive feature elimination (RFE) technique was used to determine the optimal number of features for building classification machine learning models. The expression levels and clinical associations of candidate biomarkers identified with RFE were validated using transcriptomics data from The Cancer Genome Atlas (TCGA). Classification models were then developed based on the expression levels of these candidate biomarkers. The performance of the models was evaluated based on accuracy, evaluation metrics, confusion matrices, and ROC-AUC (receiver operating characteristic-area under the ROC curve) curves.
Results. We identified 44 DEGs that encode potential secreted proteins from 274 common DEGs found across all datasets. Among these, insulin-like growth factor binding protein 3 (IGFBP3) and lectin, galactoside-binding, soluble, 1 (LGALS1) were selected for further analysis using the RFE technique. Both IGFBP3 and LGALS1 showed significant upregulation in ccRCC tissues compared to normal tissues in the GEO and TCGA datasets. The results of the survival analysis indicated that patients with higher expression levels of these genes exhibited shorter overall and disease-free survival times (OS and DFS). Decision tree and random forest models based on IGFBP3 and LGALS1 levels achieved an accuracy of 98.04% and an AUC of 0.98.
Conclusions. This study identified IGFBP3 and LGALS1 as promising novel secreted biomarkers for ccRCC diagnosis.
Key words: TCGA, GEO, machine learning, clear cell renal cell carcinoma, bioinformatics
Background
Renal cell carcinoma (RCC) represents the most common type of kidney cancer, accounting for approx. 90% of all cases.1 Globally, RCC is the 14th most commonly diagnosed malignancy, with over 400,000 new cases reported annually.2 Smoking, alcohol consumption, obesity, and high blood pressure are associated risk factors for RCC.3 Renal cell carcinoma is often asymptomatic in its early stages, with 60% of cases being discovered incidentally during imaging studies for unrelated conditions. When symptomatic, patients may present with a triad of flank pain, hematuria and an abdominal mass, although this classic presentation is relatively uncommon. Systemic symptoms, including fever, weight loss and paraneoplastic syndromes, may result from advanced disease.4, 5 The treatment of RCC has undergone significant evolution over the past few decades. Surgical resection is the standard of care for patients with localized RCC, while targeted therapies and immunotherapy have been promising treatment options for advanced and metastatic RCC.6, 7
There are 3 common pathological RCC subtypes, including clear cell RCC (ccRCC), which makes up 70–80% of cases; papillary RCC, which comprises 10–15%; and chromophobe RCC, which accounts for 5%.8 Clear cell RCC is the primary cause of death in kidney cancer patients due to its asymptomatic nature in the early stages and resistance to chemotherapy and radiotherapy.9 Early detection of ccRCC is challenging, relying on a combination of imaging techniques and histological examination. Therefore, identifying novel secreted biomarkers is crucial for its effective diagnosis.
Transcriptomics data, encompassing the complete set of all RNAs transcribed by specific tissues or cells, are widely used to identify novel biomarkers and promising drug targets in many diseases, including cancers.10 Public transcriptomics databases such as The Cancer Genome Atlas (TCGA)11, 12 and the Gene Expression Omnibus (GEO)13, 14 have become invaluable resources for researchers in this field. A combination of bioinformatics and machine learning approaches to analyze public transcriptomics data has emerged as a pivotal approach to cancer research, offering unprecedented opportunities to identify novel biomarkers and potential drug targets for various cancers,15, 16 such as colorectal cancer,17 pancreatic cancer18 and breast cancer.19 However, our latest review found no reports identifying potential secreted biomarkers for ccRCC using bioinformatics and machine learning approaches on public transcriptomics datasets.
In this study, bioinformatics and machine learning analysis were used to identify novel secreted biomarkers for ccRCC diagnosis using transcriptomics datasets from the GEO and TCGA databases. Differentially expressed genes (DEGs) were identified by comparing ccRCC tissues with normal kidney tissues, and potentially secreted proteins among the common DEGs were further analyzed. The optimal number of features for building machine learning models was determined using the recursive feature elimination (RFE) technique. Subsequently, classification models were developed based on the expression levels of candidate-secreted biomarkers. Finally, the expression levels and clinical associations of these candidate biomarkers were validated using additional transcriptomic data from the TCGA database.
Objectives
This research aimed to discover novel secreted biomarkers for diagnosing ccRCC by integrating bioinformatics and machine learning techniques with public transcriptomics data.
Materials and methods
Transcriptomics datasets
Three microarray datasets of ccRCC and normal kidney tissues, including GSE11151, GSE40435 and GSE53757, were obtained from the GEO database (https://www.ncbi.nlm.nih.gov/geo). The datasets GSE11151 and GSE53757 were generated using the Affymetrix Human Genome U133 Plus 2.0 Array platform (Thermo Fisher Scientific, Waltham, USA), which was utilized for transcriptional profiling, while GSE40435 was based on the Illumina HumanHT-12 V4.0 expression BeadChip platform (Illumina Inc., San Diego, USA).
Differentially expressed gene analysis
The DEGs were identified by comparing ccRCC and normal kidney tissues using the GEO2R (https://www.ncbi.nlm.nih.gov/geo/geo2r) with an adjusted p < 0.05 and absolute log fold-changes ≥1.0 as criteria. GEO2R is a web-based tool provided by the Gene Expression Omnibus (GEO) for analyzing gene expression data. It allows researchers to compare 2 or more groups of samples to identify differentially expressed genes. Data visualization was performed using a volcano plot in RStudio (https://rstudio.com). Additionally, Venn diagrams (http://bioinformatics.psb.ugent.be/webtools/Venn) were generated to display common DEGs across the 3 transcriptomics datasets.
Gene expression analysis
Gene expression analysis was conducted on the GSE40435 dataset retrieved from the GEO database using the GEOquery package in R (R Foundation for Statistical Computing, Vienna, Austria).20 Expression data were transformed using a base-2 logarithmic scale to normalize the distribution.
Identification of potential secreted biomarkers in common DEGs
Potential secreted biomarkers in ccRCC were identified based on overlapping genes between common DEGs and a list of 1,665 secreted proteins from The Human Protein Atlas (https://www.proteinatlas.org).21, 22
Feature selection
The recursive feature elimination, based on the random forest classifier, was employed to select the minimal set of genes needed to create classification models. The feature-selection process was conducted using the scikit-learn library (https://scikit-learn.org/stable/modules/generated/sklearn.feature_selection.RFE.html). Feature subsets of sizes 44, 20, 10, 5, 3, 2, and 1 were used for training and evaluation. The performance of the random forest classifier for each gene subset was assessed using several evaluation metrics, including accuracy, precision, recall, and F1-score.
Machine learning for classification
Seven supervised machine learning algorithms, including decision trees, random forests, logistic regression, K-nearest neighbors, Gaussian naive Bayes (GNB), support vector machines, and multilayer perceptrons (MLPs), were used to develop classification models based on the selected potential secreted DEGs. The Python scikit-learn library (https://scikit-learn.org) was used to implement these algorithms. The transcriptomics data were split into training and test sets. The training set was used to develop models with 7 machine learning algorithms, and their performance was evaluated on the test set. GridSearchCV (https://scikit-learn.org/1.5/modules/generated/sklearn.model_selection.GridSearchCV.html) was employed to optimize hyperparameters for each model. The classification performance of each model was assessed using accuracy, precision, recall, F1-score, confusion matrix, and receiver operating characteristic (ROC) curves.
Validation of biomarkers gene expression and clinical association
The expression levels of potential biomarkers in ccRCC and normal kidney tissue were validated using the TCGA dataset, which includes 523 ccRCC samples and 100 normal kidney samples, employing Gene Expression Profiling Interactive Analysis (GEPIA) (http://gepia.cancer-pku.cn).23, 24 Additionally, the correlation between the expression levels of potential biomarkers and the survival of ccRCC patients was analyzed using GEPIA.
Statistical analyses
In the GEPIA, the significant difference between the 2 groups was compared using Student’s t-test. The correlation between gene expression and both overall survival (OS) and disease-free survival (DFS) in ccRCC patients was evaluated using Kaplan–Meier analysis, accompanied by a log-rank test and hazard ratio (HR) calculation. Statistical significance was considered to be p < 0.05. In the box plots, the central line represents the median value of the data. The boxes extended from the 1st quartile (Q1) to the 3rd quartile (Q3), representing the interquartile range (IQR). The whiskers extended to the most extreme data points within 1.5 times the IQR from Q1 and Q3. Data points beyond this range were considered outliers.
Results
Identification of common DEGs in ccRCC
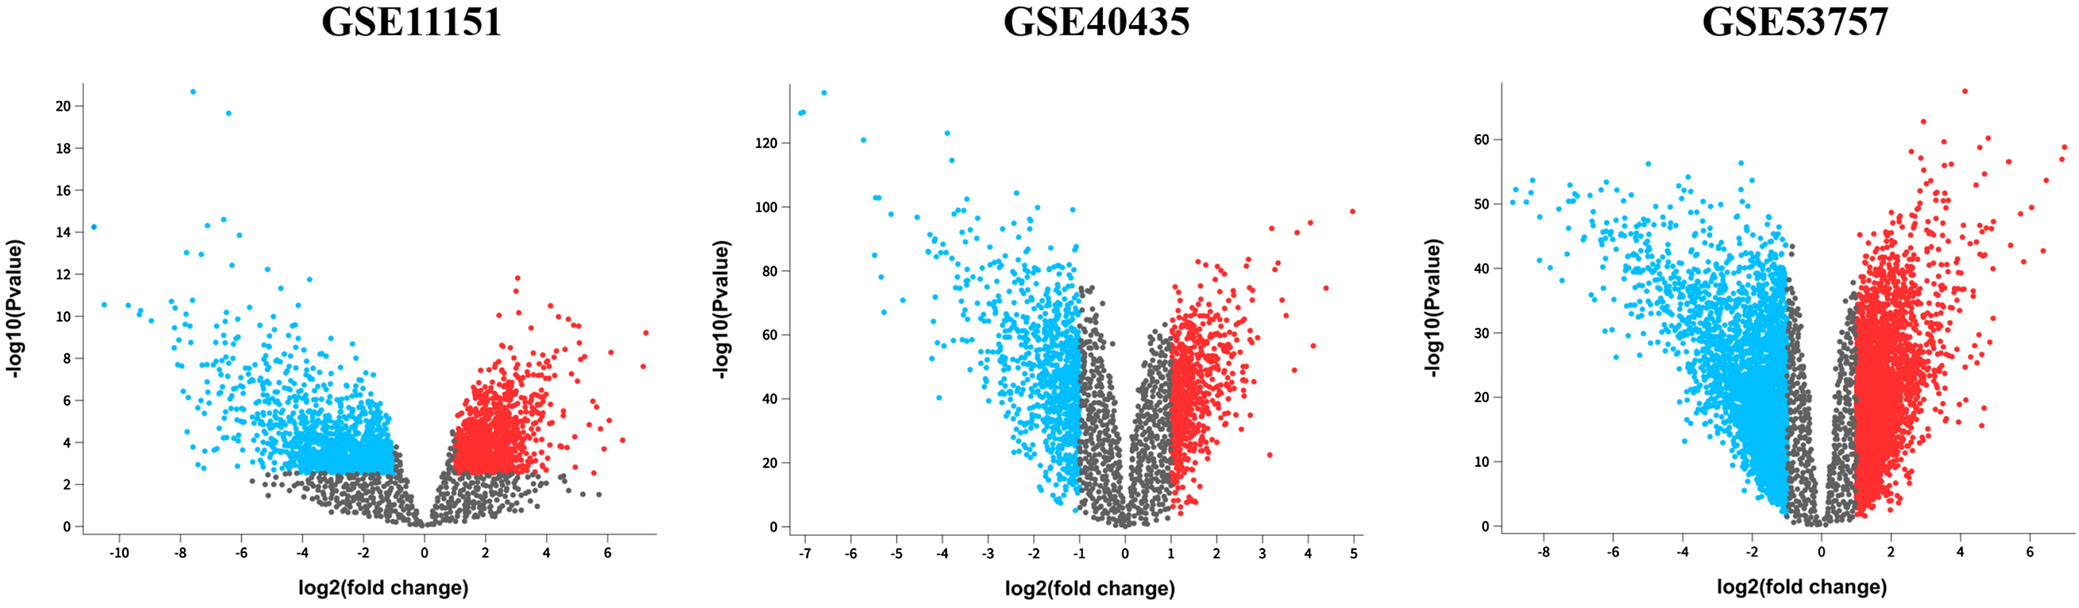
Differentially expressed genes were identified by comparing ccRCC and normal kidney tissues from 3 GEO datasets: GSE53757, GSE40435 and GSE11151. The selection criteria were an adjusted p < 0.05 and an absolute log fold change >1.0. Based on these criteria, 2,917 DEGs were identified in GSE11151, 1,521 in GSE40435 and 6,665 in GSE53757. Specifically, GSE11151 had 1,180 upregulated and 1,737 downregulated genes; GSE40435 had 680 upregulated and 841 downregulated genes; and GSE53757 had 3,124 upregulated and 3,541 downregulated genes (Figure 1, Table 1).
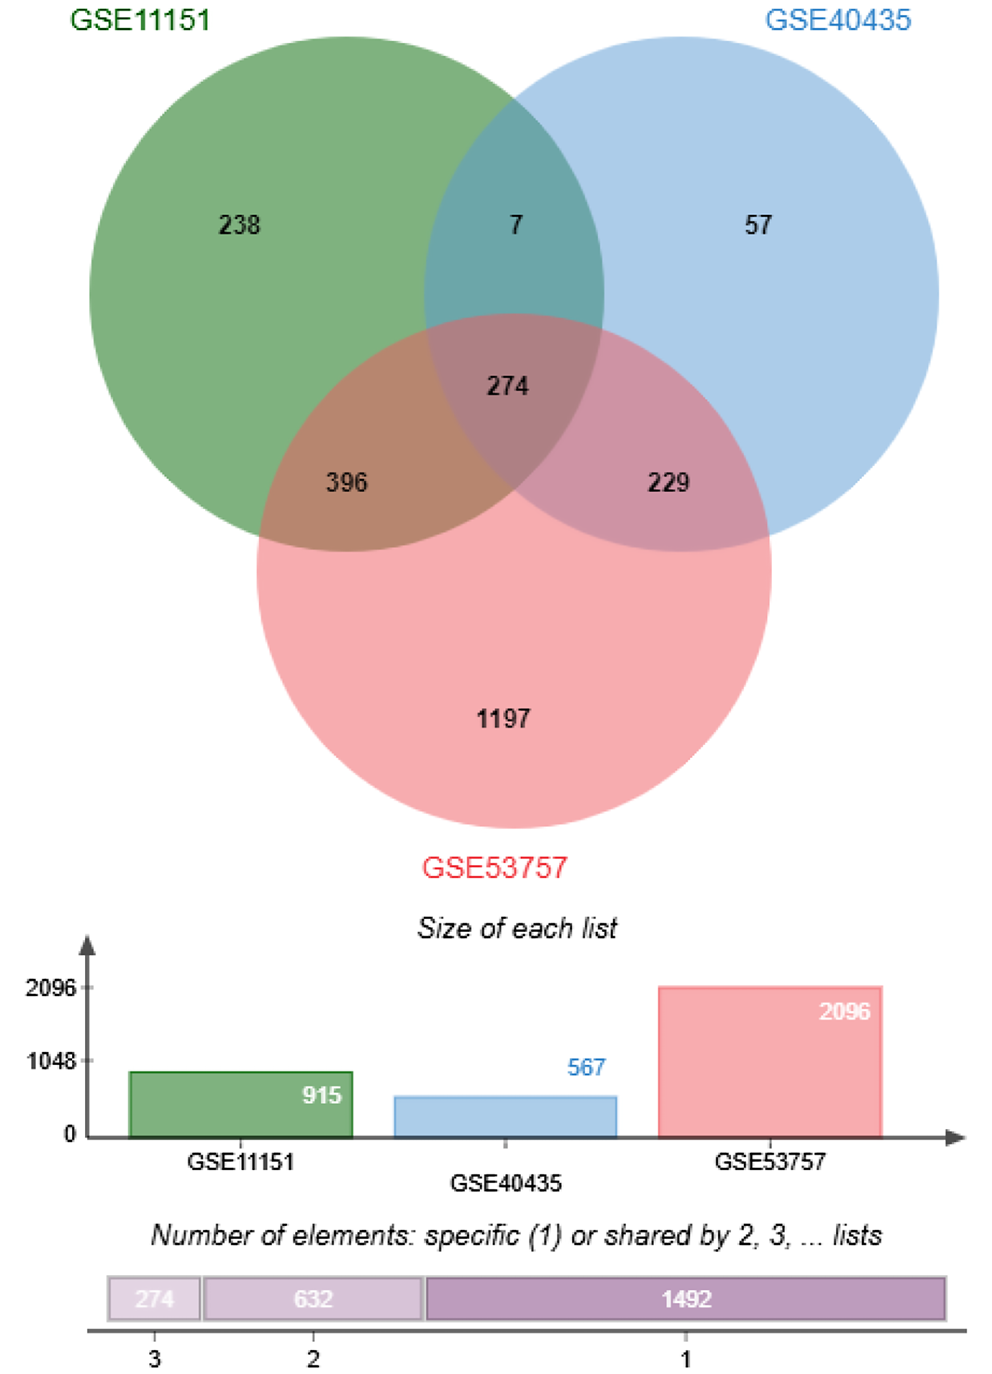
We further identified the common DEGs using a Venn diagram (Figure 2). There were 274 common DEGs across all 3 datasets (GSE11151, GSE40435 and GSE53757). This identification of common DEGs could potentially help to identifying potential candidate biomarkers for ccRCC.
Identification of potential secreted DEGs in ccRCC
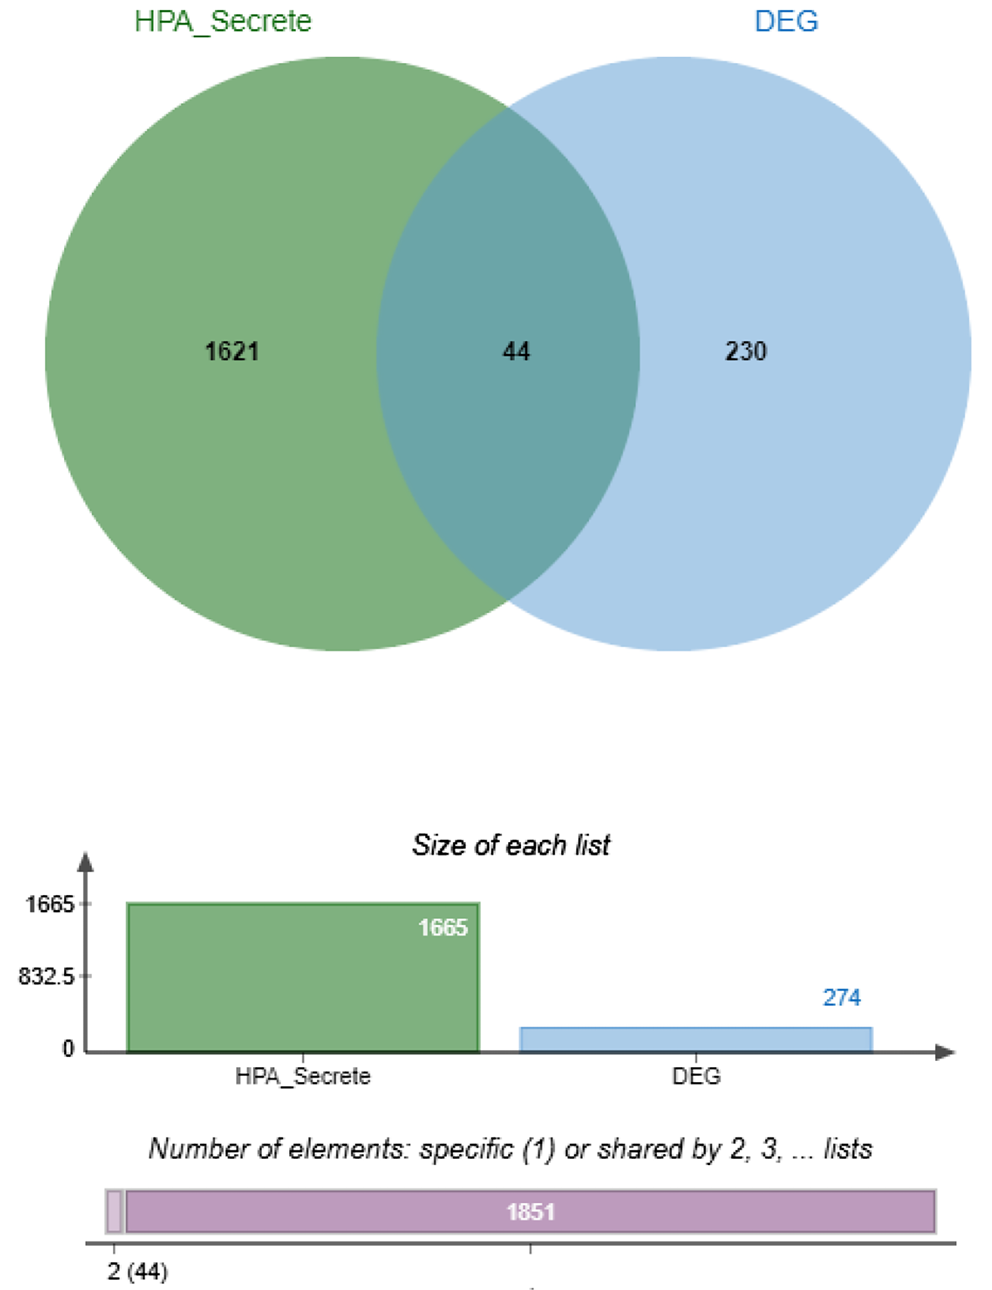
The list of human secretome proteins from The Human Protein Atlas, which includes 1,665 human-secreted proteins, was used to identify which DEGs potentially encode secreted proteins. A Venn diagram was used to determine the secreted proteins among the 274 common DEGs (Figure 3). We identified 44 DEGs that potentially encode secreted proteins, including ADM, ANGPT2, ANGPTL4, ANXA1, ANXA2, APOC1, C1QA, C1QC, C3, CCL20, CD14, CHSY1, COL4A1, CTHRC1, CXCL10, CXCL9, EMILIN2, GNLY, GZMA, GZMH, IGFBP3, INHBB, ISG15, LAMA4, LAMC1, LGALS1, LOX, LY86, LY96, LYZ, NPTX2, OLFML2B, PLA2G7, PTHLH, RNASE6, RNASET2, SPARC, SRGN, STC2, TIMP1, TNFAIP6, VASH1, VEGFA, and VWF. The overlap of the DEGs with the secretome database indicates that these 44 genes are strong candidates for secreted biomarkers for ccRCC.
Feature selection
The 44 DEGs that potentially encode secreted proteins in ccRCC were subjected to feature selection using the RFE technique based on the RandomForestClassifier. Various numbers of gene sets (1, 2, 3, 5, 10, 20, and 44 genes) were selected during the feature selection process. The RFE results indicated that sets of 3 and 5 genes resulted in the greatest accuracy (97.5%) (Table 2). However, we were able to achieve an accuracy of 96.3% using only 2 genes, namely insulin-like growth factor binding protein 3 (IGFBP3) and lectin, galactoside-binding, soluble, 1 (LGALS1), which we used to construct classification models.
The expression of IGFBP3 and LGALS1 in ccRCC patients based on the GEO dataset
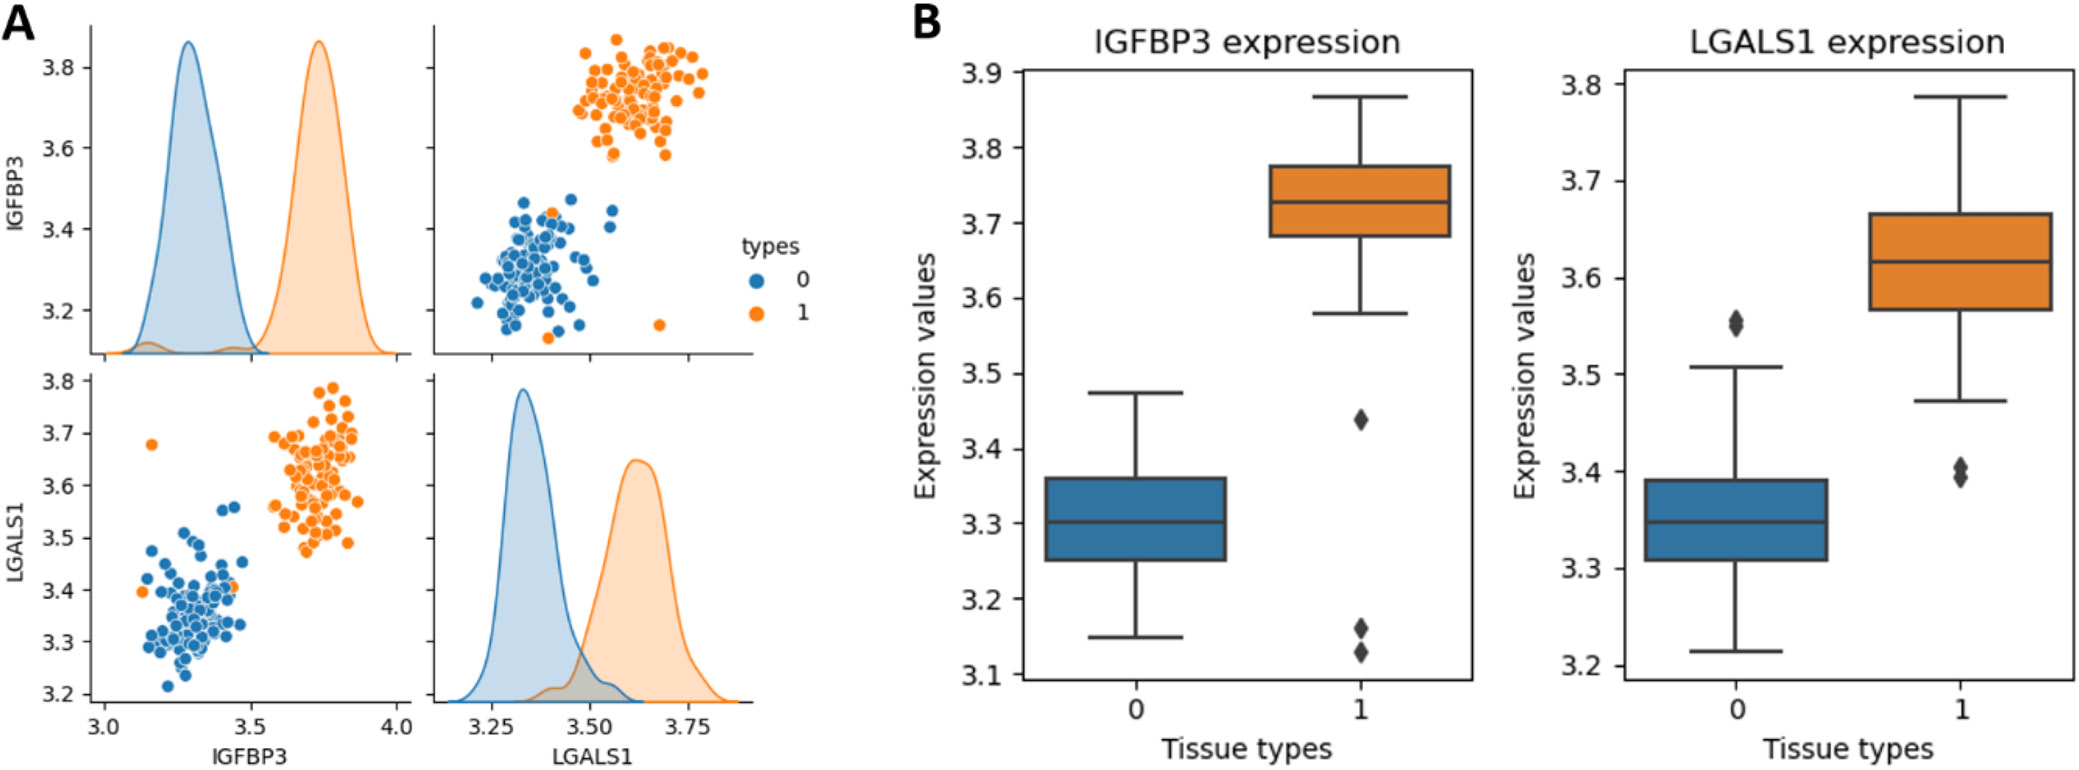
The expression levels of IGFBP3 and LGALS1 were measured in adjacent non-tumor renal tissues and ccRCC tissues using the GSE40435 dataset. The pair plot revealed distinct clustering by tissue type, indicating a potential correlation between the expression levels of these genes and tissue classification (Figure 4A). Additionally, the box plot showed that both IGFBP3 and LGALS1 expression levels were significantly elevated in ccRCC tissues compared to adjacent non-tumor renal tissues (Figure 4B). These findings suggested that IGFBP3 and LGALS1 may serve as potential biomarkers for distinguishing ccRCC tissues from adjacent non-tumor renal tissues.
The performance of the classification model based on the expression levels of IGFBP3 and LGALS1
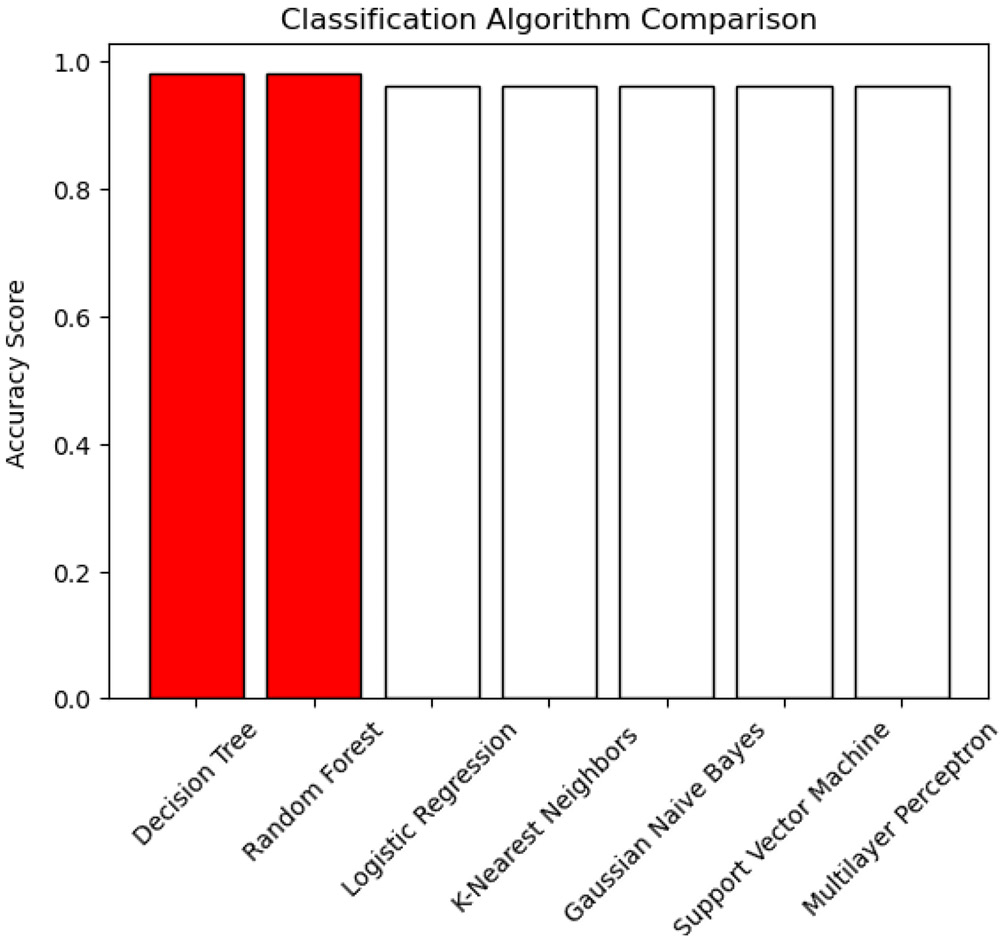
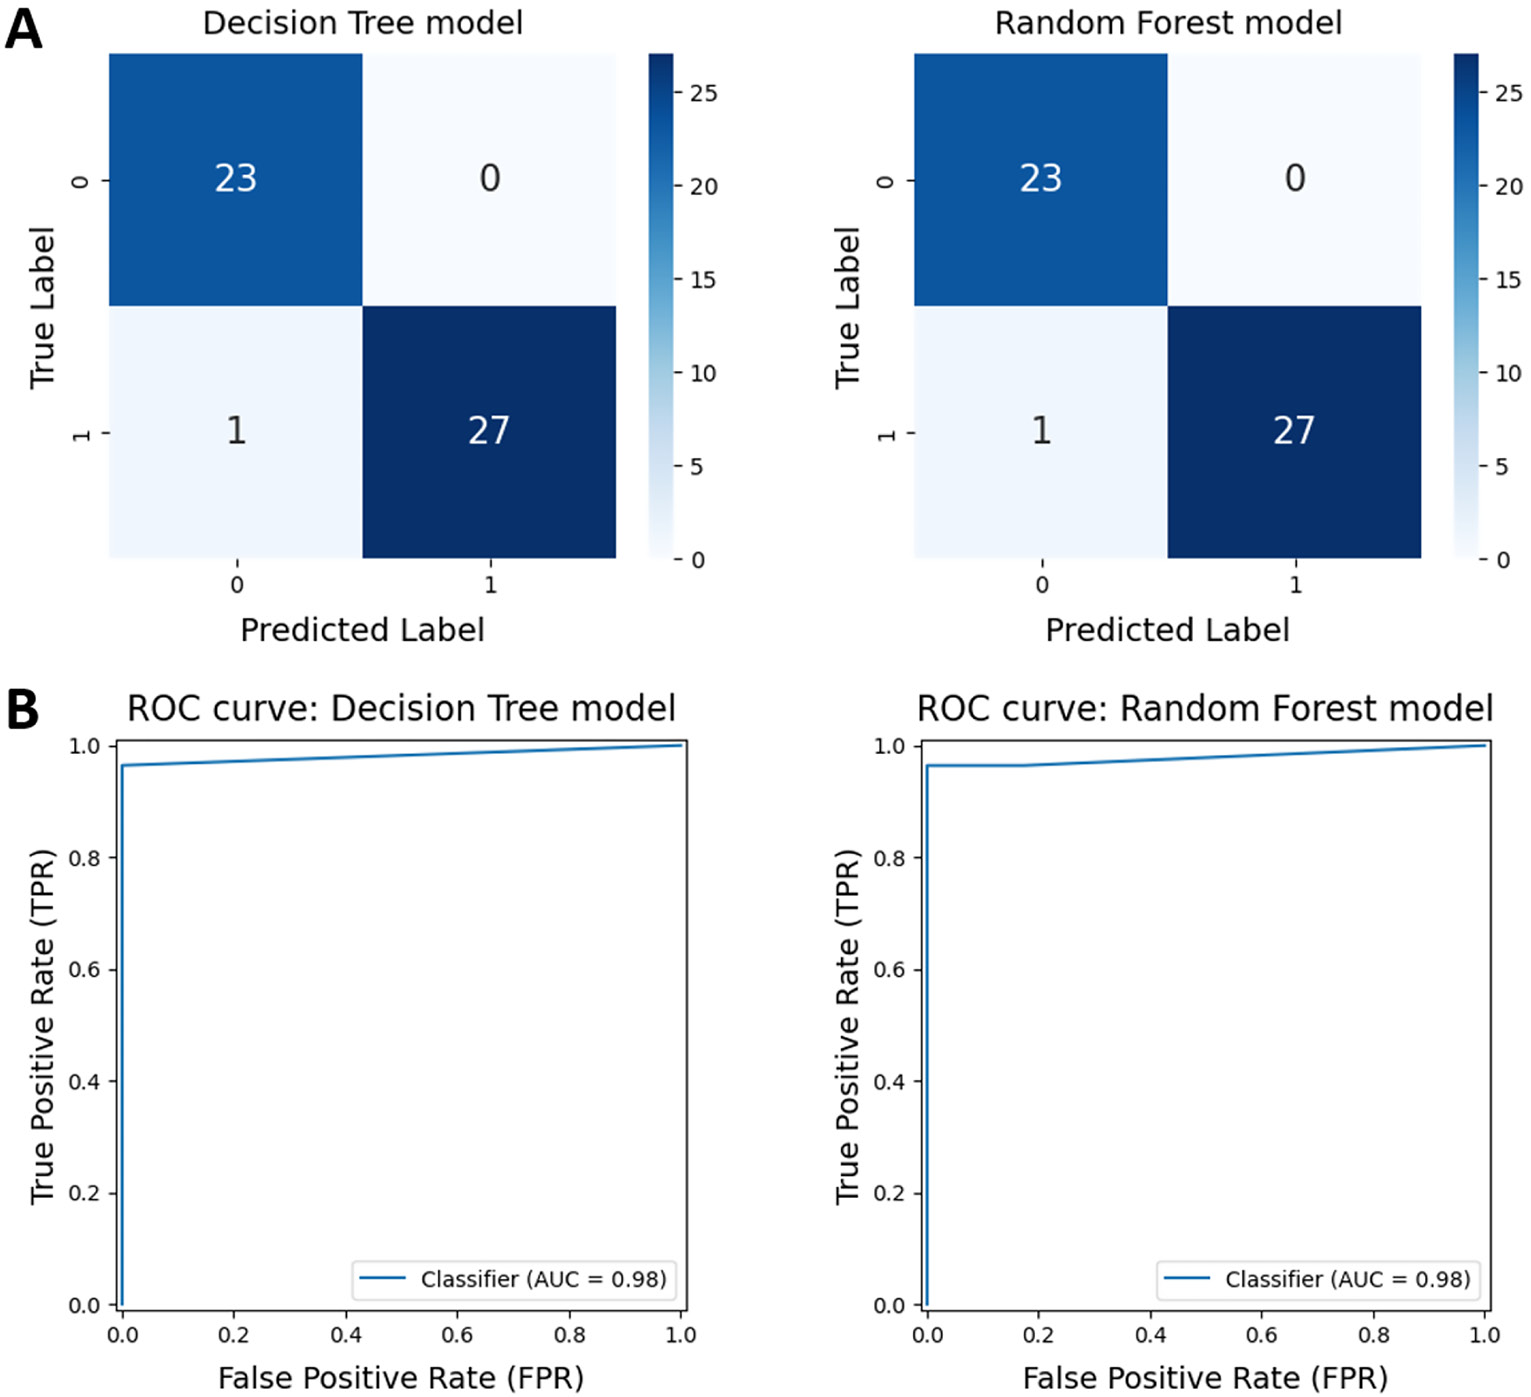
We evaluated the perfo rmance of 7 supervised machine learning algorithms, including Decision Trees, Random Forests, Logistic Regression, K-nearest Neighbors, Gaussian Naive Bayes, Support Vector Machines, and Multilayer Perceptrons, using the expression levels of IGFBP3 and LGALS1. All algorithms demonstrated high accuracy, ranging from 96% to 98%. The Decision Tree and Random Forest models achieved the highest accuracy scores (Figure 5). Consequently, these 2 models were selected for further optimization using GridSearchCV. After optimization, both models exhibited high performance, with an accuracy of 98.04% and an area under the ROC curve (AUC) of 0.98 (Table 3, Figure 6).
Validation of potential secreted biomarkers expression and clinical association based on the TCGA dataset
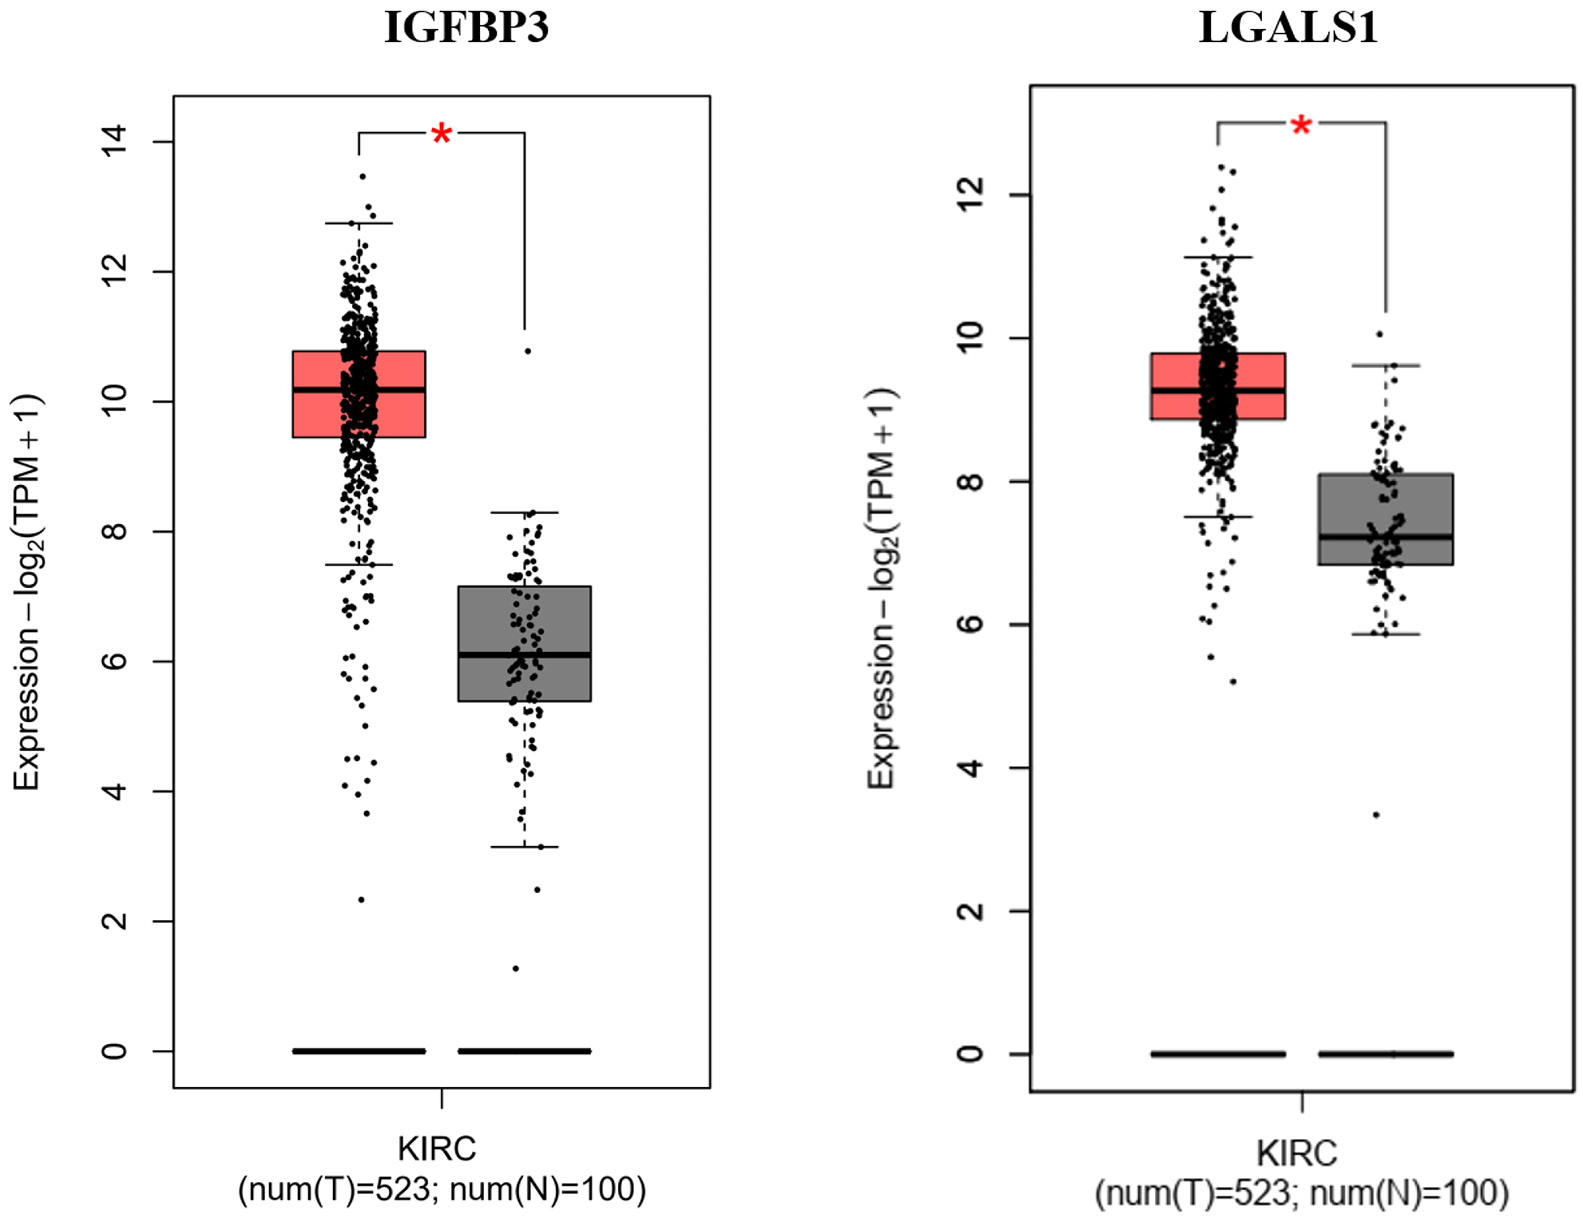
The expression levels of IGFBP3 and LGALS1 were confirmed using the TCGA dataset using the GEPIA online tool. Both IGFBP3 and LGALS1 were differentially expressed in kidney renal clear cell carcinoma (KIRC) samples, showing significantly higher expression compared to normal kidney tissue (Figure 7).
The results of the survival analysis based on the TCGA dataset indicated that high IGFBP3 expression levels were associated with significantly reduced OS and DFS in ccRCC patients. Similarly, we found that high expression of LGALS1 correlated with a trend of decreased OS and significantly affected DFS in ccRCC patients (Figure 8A,B).
Discussion
Our bioinformatics analyses of 3 ccRCC datasets from the GEO identified 274 common DEGs. We then used the list of secreted proteins from the Human Protein Atlas to identify 44 potential secreted biomarkers for ccRCC.
The RFE technique, based on the RandomForestClassifier, highlighted a smaller subset of 2 genes that provided high classification accuracy, including IGFBP3 and LGALS1. Decision Tree and Random Forest models based on the expression levels of IGFBP3 and LGALS1 demonstrated particularly high classification accuracy, underscoring their potential in diagnosing ccRCC patients.
Currently, several potential secreted biomarkers for diagnosing ccRCC have been identified. Carbonic anhydrase IX (CA9) is considered one of the promising biomarkers for ccRCC. Serum levels of CA9 were significantly higher in ccRCC patients than in those with non-CCRCC and benign tumours.25 A similar finding was reported in 2018, in which plasma CA9 was evaluated in patients with ccRCC compared with patients with benign tumors and healthy controls.26 However, the diagnostic performance of secreted CA9 in ccRCC remains unclear. Yang et al. identified 3 potential serum biomarkers for ccRCC using matrix-assisted laser desorption/ionization time-of-flight mass spectrometry. These biomarkers demonstrated a mean sensitivity of 88.38% and a mean specificity of 91.67%.27 In 2017, Raf kinase inhibitor protein and phosphor Raf kinase inhibitor were also identified as potential urinary biomarkers for ccRCC using a proteomics technique with an AUC of 0.93.28 In addition, Bao et al. identified hub genes associated with ccRCC from GEO dataset (GSE47352). They found that hub genes could distinguish ccRCC from paired normal tissue with an AUC ranging from 0.517 to 0.945.29 Compared to the performance of currently established biomarkers for ccRCC diagnosis, the present study used a combination of bioinformatics and machine learning algorithms based on the expression levels of IGFBP3 and LGALS1 to achieve a notably higher diagnostic accuracy of 98.04% and an AUC of 0.98. Our results demonstrated the value of machine learning in achieving higher accuracy and consistency, which could lead to improved early detection and patient outcomes.
Transcriptomic data from the GEO and TCGA databases revealed high expression levels of IGFBP3 and LGALS1 in ccRCC tissue compared to normal kidney tissue. In addition, high expression of these genes was associated with shorter OS and DFS in ccRCC patients, underscoring their potential utility as diagnostic markers and prognostic indicators.
In cancer cells, IGFBP3 regulates cell proliferation and apoptosis through both IGF-dependent and independent mechanisms. IGFBP3 depletion suppresses glioma cell growth by inducing DNA damage and apoptosis. Furthermore, suppression of IGFBP3 markedly increased the survival of brain-tumor-bearing mice.30 Suppression of the IGFBP3-AKT/STAT3/MAPK-Snail signaling pathway by cyclovirobuxine resulted in a reduction of cell viability, proliferation, angiogenesis, migration, and invasion in ccRCC cells.31 Overexpression of IGFBP3 has been reported in several cancers, including breast cancer and nasopharyngeal carcinoma.32, 33 IGFBP3 expression is associated with adverse outcomes such as metastasis, poor responses to chemoradiotherapy and decreased survival rates in cancer patients33, 34, 35 Moreover, serum IGFBP3 is an independent prognostic risk factor in esophageal squamous cell carcinoma and esophagogastric junction adenocarcinoma.36, 37 Overexpression of IGFBP3 has also been reported in ccRCC. A study by Braczkowski et al. demonstrated IGFBP3 overexpression in ccRCC compared to adjacent non-cancerous kidney tissues using a quantitative reverse transcription polymerase chain reaction (RT-qPCR) assay.38 The distribution of IGFBP3 genotypes was significantly associated with the histological grade and clinical stage of ccRCC patients.39 This information suggests that IGFBP3 could serve as a diagnostic and prognostic biomarker for ccRCC.
LGALS1, also known as galectin-1, is involved in various processes associated with cancer development and progression, including tumor transformation, cell cycle regulation, apoptosis, adhesion, migration, and inflammation.40, 41 Huang et al. reported that the suppression of LGALS1 led to reduced cell invasion, clonogenic ability, epithelial–mesenchymal transition, and angiogenesis in renal cancer cell lines by upregulating C-X-C chemokine receptor type 4 through nuclear factor kappa B (NF-κB) activation.42 Similarly, a report from 2014 highlighted that LGALS1 plays a critical role in promoting the migration and invasion of ccRCC cells by activating the hypoxia-inducible factors/mammalian target of rapamycin signaling pathway.43 Overexpression of LGALS1 is correlated with tumor aggressiveness, including growth, cell migration, invasion, metastasis, and poor prognosis in several cancers such as hepatocellular carcinoma (HCC), upper urinary urothelial carcinoma, ovarian cancer, and squamous cervical cancer.44, 45, 46, 47, 48 The potential of LGALS1 as a serum biomarker has also been demonstrated in several cancers. Elevated plasma levels of galectin-1 have been found in pancreatic cancer,49 classical Hodgkin lymphoma50 and serous ovarian carcinoma. High serum levels of galectin-1 are associated with metastasis in epithelial ovarian cancer51 and colorectal cancer.52 In ccRCC, LGALS1 expression was significantly associated with higher clinical grade and stage53 and favorable outcomes from anti-PD1 treatment.54 These results indicate the potential of using LGALS1 as a prognostic marker and therapeutic target in ccRCC patients.
The results of our integrated bioinformatics and machine learning analysis indicate that IGFBP3 and LGALS1 are promising potential secreted biomarkers for the diagnosis of ccRCC.
Limitations
It is important to acknowledge the limitations of this study. The findings were derived from publicly available datasets from the GEO and the TCGA databases. The selection of these datasets may introduce potential biases, as they may not fully represent the broader patient population. Furthermore, the generalizability of our results may be constrained by variations in sample collection, processing methods and demographic factors across different studies. Accordingly, further research is planned to validate these findings in independent cohorts using serum or urine of ccRCC patients compared to healthy controls, with the objective of ensuring robustness and applicability to clinical settings.
Conclusions
The use of bioinformatics and machine learning enabled the identification of IGFBP3 and LGALS1 as potential secreted biomarkers for ccRCC. The classification models based on IGFBP3 and LGALS1 demonstrated the capacity to effectively differentiate ccRCC patients from healthy controls. Furthermore, the expression levels of IGFBP3 and LGALS1 were found to be useful not only for the diagnosis of ccRCC but also as prognostic biomarkers to predict patient outcomes.
Supplementary data
The Supplementary materials are available at https://doi.org/10.6084/m9.figshare.27154224.v1. The package includes the following files:
Supplementary File 1. DEG analysis from GEO database (GSE11151, GSE40435 and GSE53757).
Data availability
The datasets generated and/or analyzed during the current study are available from the corresponding author on reasonable request.
Consent for publication
Not applicable.