


Abstract
Background. Hepatocellular carcinoma (HCC) is a common tumor of the digestive system. Cell death is an essential process in normal tissue that consists of 3 classical pathways: apoptosis, necrosis and autophagy.
Objectives. To perform a comprehensive analysis of the impact of cell death on liver cancer.
Materials and methods. The Kyoto Encyclopedia of Genes and Genomes (KEGG) database and the Cancer Genome Atlas (TCGA) datasets were used to analyze the relationships between mutations in cell death-related genes and clinical variables of HCC. Then, we applied the DESeq2 package to identify aberrantly expressed genes in HCC and their related biological functions through a Pearson correlation analysis. Finally, a cell death-related signature of HCC was constructed using the single-factor Cox regression.
Results. We identified the genes involved in apoptosis, necrosis and autophagy, of which TP53 and SPTA1 had the highest frequency of mutations. The results revealed that cell death-related tumor mutational burden (TMB) was significant for the pathologic stage and had a strong relationship with the prognosis. Moreover, 53 cell death-related genes that are differentially expressed in HCC were screened, and 3 of them were correlated with HCC prognosis. Harvey rat sarcoma viral oncogene homolog (HRAS) affected the infiltration of immune cells and was closely correlated with ferroptosis. Peptidylprolyl isomerase A (PPIA) played a significant role in mitochondrial pathways. At last, we constructed a cell death-related signature of HCC using 10 prognosis-related genes and a nomogram based on 3 variables (expression, group and stage).
Conclusions. This study provided a comprehensive analysis of cell death-related genes in HCC based on multi-omics data, identified the contribution of each variable to clinical outcome and predicted the survival probability of HCC patients more directly.
Key words: apoptosis, necrosis, autophagy, liver hepatocellular carcinoma, multi-omics
Background
Hepatocellular carcinoma (HCC) is a malignant tumor of the digestive system, which ranks first in cancer incidence and mortality around the world.1, 2 Although the overall survival of patients with HCC has increased due to improved surgery, chemotherapy options and targeted therapy, a few HCC patients still experience distant metastasis leading to a poor prognosis.3 However, the molecular mechanisms of HCC are not fully understood; thus, it is urgent to explore key factors and new biomarkers in the progression and prognosis of HCC.
Cell death is an essential process in the development of normal tissue, consisting of 3 classical pathways: apoptosis, necrosis and autophagy.4, 5 Apoptosis is a process in which cells cease to grow and divide. It is also called programmed cell death or cell suicide. Apoptosis can be initiated by intracellular sensors activating the intrinsic pathway or damaged receptors in the extrinsic pathway. It is characterized by nuclear fragmentation, membrane blebbing and chromosomal condensation.6, 7, 8 Autophagy is a cellular stress-mediated mechanism that promotes the degradation of cellular macromolecules to protect or kill stressed cells.9 Necrosis, unlike the 2 previous pathways, is an uncontrolled form of cell death, where the cell is damaged by sudden external injury (hypoxia, chemicals, heat, etc.).10 The dysregulation of the above 3 cell death-related pathways can play a significant role in the initiation and development of a tumor.11
The central role of genetic abnormalities is highlighted in the process of cancer metabolism described in recent studies.12, 13, 14 An increased mutation rate is a well-characterized feature of human cancers that contributes to the loss of function, including somatic mutations, copy number variations, genomic rearrangements, etc. In this study, we focused on the genetic and transcriptomic characteristics of cell death in HCC using bioinformatics analysis, along with their relationship with clinical variables, the immune response and prognosis. At last, we constructed a cell death-related signature and prognostic nomogram of HCC that could be regarded as a reference for clinical treatment.
Objectives
Multi-omics data were used to study the impact of 3 cell death-related pathways on HCC.
Materials and methods
Data collection
The pathways related to cell death, including apoptosis, necrosis and autophagy, were accessed using the Kyoto Encyclopedia of Genes and Genomes (KEGG) database. We downloaded the RNA sequencing, copy number variants, mutation variants, expression data, and clinical data of patients with HCC from the Cancer Genome Atlas (TCGA) datasets. Gene expression levels were analyzed using transcripts per million (TPM) reads. The clinical data obtained included age, sex, clinical stages, TNM stage, survival status, and survival time.
Somatic mutations
and copy number variations
Genes with mutation samples greater than 5 were selected for prognostic analysis to ensure a sufficient sample size. The Kaplan–Meier log rank tests were performed to evaluate whether the gene mutations affected the overall survival of HCC patients.
To further explore the impact of cell death-related gene mutations on HCC patients, we calculated the tumor mutation burden (TMB) and the fraction genome altered (FGA) of each sample according to gene mutation information. The calculation of FGA is based on copy number variation (CNV) segment data. The main calculation method used the number of bases in segments with a log2R > 0.2 divided by the number of bases in all segments. The FGA included the fraction genome gain (FGG) and the fraction genome loss (FGL). Next, we evaluated the associations of FGG and FGL with the prognosis and clinical characteristics of HCC.
Gene expression analysis
In order to determine cell death-related genes that affect the development and progression of HCC, we applied the DESeq2 package, a method for differential analysis of count data using shrinkage estimation for dispersions and fold changes to improve stability and interpretability of estimates and to perform the differentially expressed analysis. We used a false discovery rate (FDR) <0.05 and a log2 (fold change) >1 as the screening criteria. To explore the associations between cell death-related genes and prognosis in HCC, we used the median value of gene expression as the cutoff value and divided the dataset into 2 groups. The genes identified as HCC-specific for subsequent analysis were meaningful in the differential expression and prognostic analyses.
Functional analysis
To gain further understanding of the additional influence that cell death-related genes have on HCC, we evaluated the scores of 24 immune cells in HCC samples using the gene set variation analysis (GSVA) algorithm. The Pearson’s correlation analysis was further performed to observe the relationships between cell death-related genes and the infiltration of immune cells. At the same time, we also observed whether there was a co-expression correlation between the abovementioned genes and ferroptosis-related genes. Since cell death is generally considered to be an effect of the mitochondria, we downloaded mitochondrial-related pathway information from MitoCarta3.0 (https://www.broadinstitute.org/files/shared/metabolism/mitocarta/human.mitocarta3.0.html) and analyzed whether the above genes had an impact on mitochondrial-related pathways using the gene set enrichment analysis (GSEA) algorithm.
Construction of a cell death-related signature for HCC
First, a single-factor Cox regression with cell death-related genes was performed in order to screen genes that affect the prognosis of HCC. Furthermore, because of the collinearity between the genes, we used the least absolute shrinkage and selection operator (LASSO) to screen independent genes. A signature related to cell death was constructed by combining clinical parameters of HCC-related cases.
Statistical analyses
Statistical analysis and visualization of data were performed using R software (v. 4.1.2; R Foundation for Statistical Computing, Vienna, Austria). Measurement data were expressed as mean (standard deviation (SD)). If the data met a normal distribution, we used t-tests to assess the differences between groups and analysis of variance (ANOVA) to assess the differences between multiple groups. If the data did not conform to a normal distribution, then the differences between the 2 groups were estimated using the Wilcoxon rank-sum test, and the differences between multiple groups were assessed using the Kruskal–Wallis test. A value of p < 0.05 was considered statistically significant.
Results
Cell-death gene set
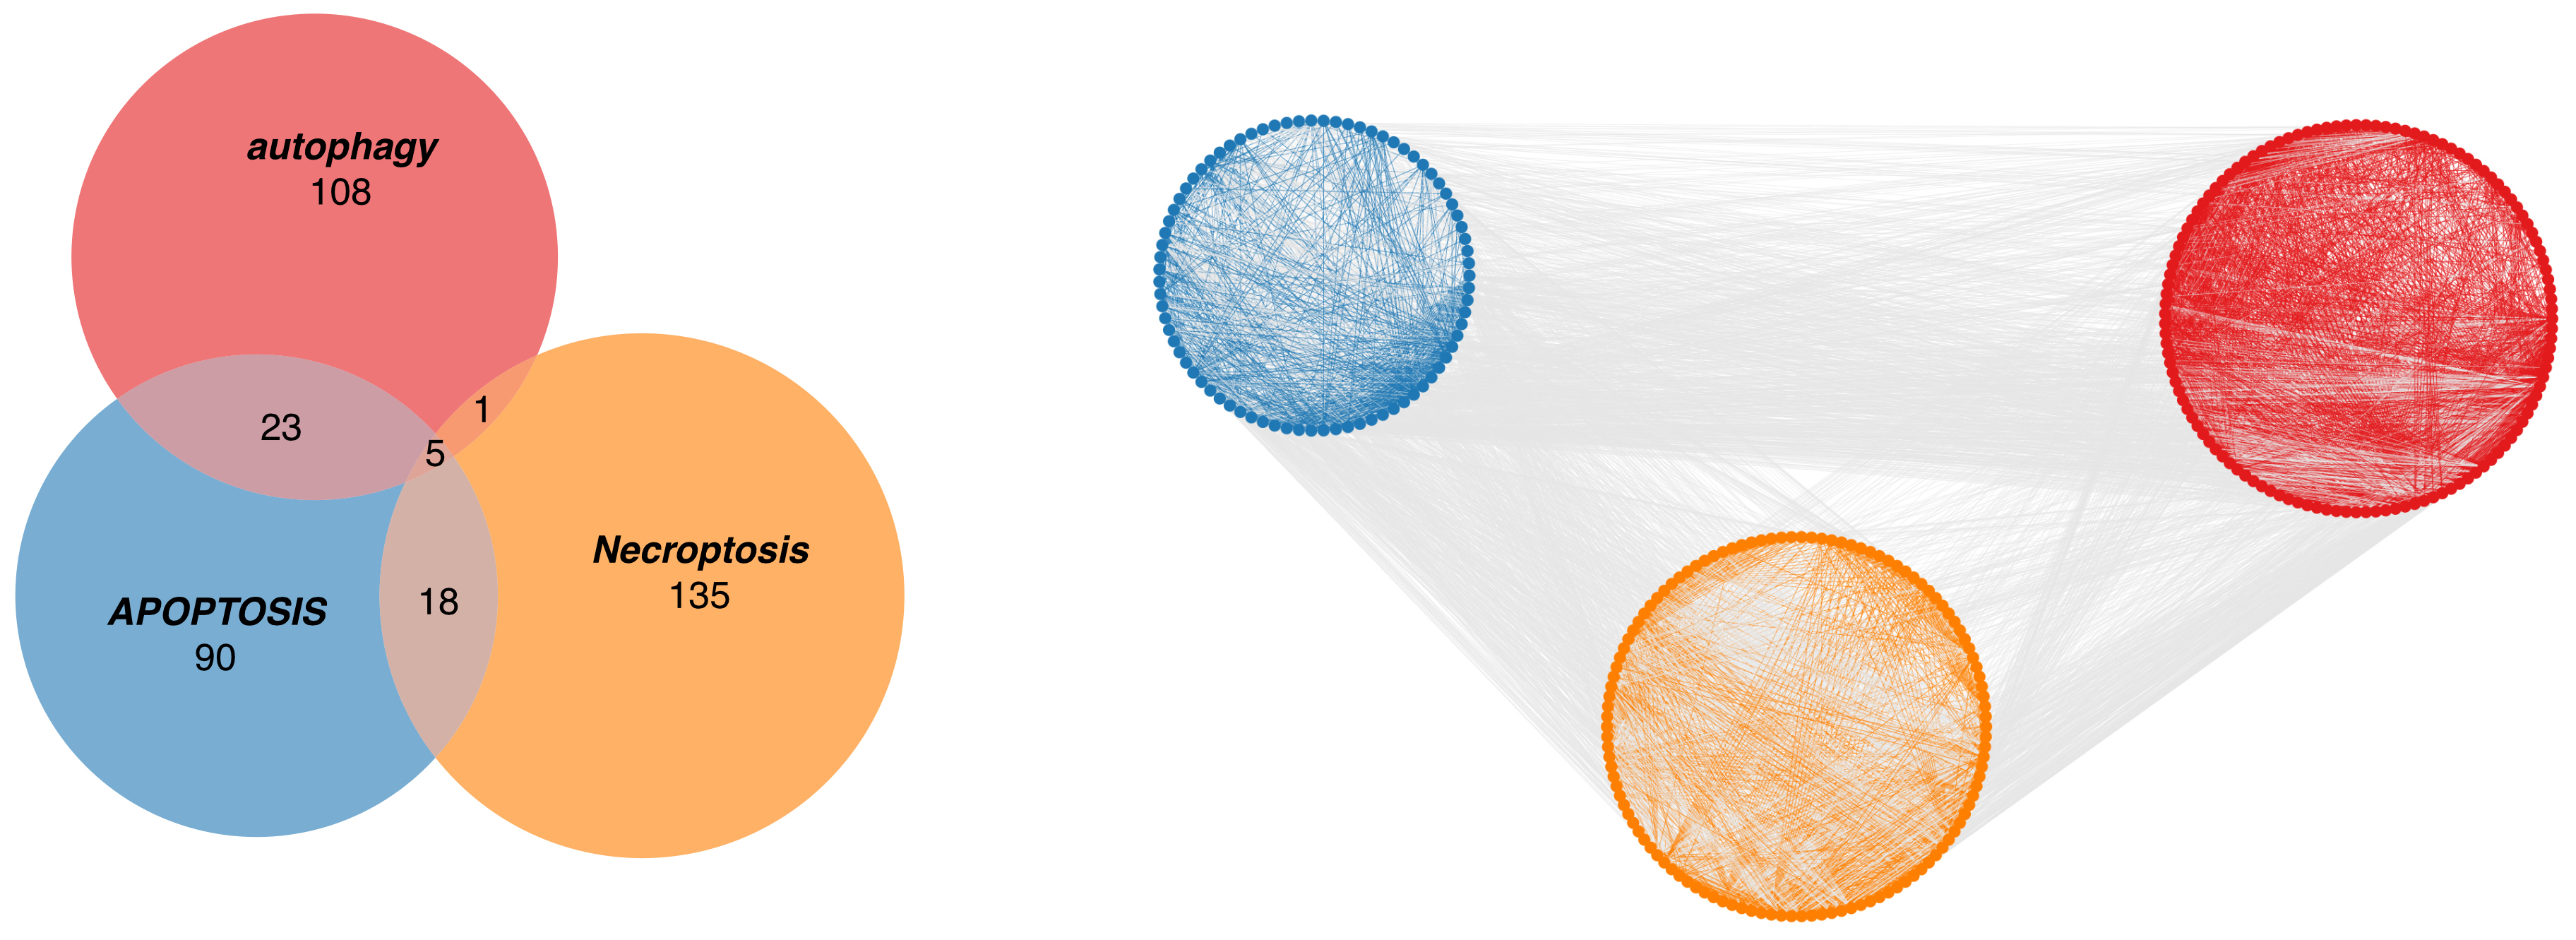
From the KEGG database, we identified 137 autophagy-related genes, 136 apoptosis-related genes and 159 necrosis-related genes. Five genes had functions in all 3 pathways (B-cell lymphoma-2 (BCL2), CASP8 and FADD-like apoptosis regulator (CFLAR), mitogen-activated protein kinase (MAPK) 10, MAPK8, and MAPK9; Figure 1). In addition, 23 genes were involved in autophagy and apoptosis, 18 genes in apoptosis and necroptosis, and 1 gene in autography and necroptosis. To further explore the interactive relationships among genes from the 3 cell death-related pathways, the Search Tool for the Retrieval of Interacting Genes/Proteins (STRING) database (https://cn.string-db.org) was used to confirm interactions between the genes instead of them being mutually independent (Figure 1). Using a network diagram of protein interactions we discovered that the relationships between the 3 forms of cell death indicate strong interactions between the genes involved in the 3 types of cell death. Therefore, those 3 types may jointly affect the occurrence and development of HCC.
Genetic mutations
of cell death-related genes
After screening, it was found that 81 autophagy-related genes, 97 apoptosis-related genes and 89 necroptosis-related genes were mutated in HCC (Figure 2A). Tumor protein 53 (TP53) had the highest mutation frequency in 32% of patients, and the 2nd most frequent mutation occurred in spectrin alpha erythrocytic 1 (SPTA1) at 8% (Figure 2B). However, the mutation frequencies of all the other genes were less than 5%. The 2 most frequently mutated genes (TP53 and SPTA1) were apoptosis-related, indicating that the functions of apoptosis-related genes in HCC may indeed be related to gene mutations. In order to further explore the associations among mutated genes, we performed a co-occurrence analysis. In this analysis, only protein tyrosine phosphatase non-receptor type 13 (PTPN13) and inositol 1,4,5-trisphosphate receptor type 3 (ITPR3) were found to have a co-occurrence relationship, both of which are apoptosis-related genes (Figure 2C).
Moreover, after a survival analysis of mutated genes, the mutation of 6 genes was correlated with the prognosis of HCC, consisting of 4 apoptosis-related genes, 1 necroptosis-related gene and 1 autophagy-related gene (Figure 2D). Among the 6 mutated genes associated with prognosis, the mutations in apoptosis-related genes and autophagy genes (colony stimulating factor 2 receptor subunit beta (CSF2RB), mitogen-activated protein kinase 2 (MAP2K2), DAB2 interacting protein (DAB2IP), mechanistic target of rapamycin kinase (MTOR), and TP53) led to a decreased survival time in patients, while the mutation in the necrosis gene (phospholipase A2 group IVA (PLA2G4A)) led to an increased survival time (Figure 2E). In order to observe the relationship between the 3 cell death pathway gene mutations and HCC as a whole, we further aggregated the gene mutations for prognostic analysis. The results were consistent with the prognosis of previous analyses, finding that gene mutations in the apoptotic pathway led to a decreased patient survival and gene mutations in the necrosis pathway led to an increased patient survival (Table 1).
We calculated the association of TMB with cell death in HCC to analyze the relationship between TMB and clinical parameters. Patients with a high cell death rate related to TMB have a shorter survival time, indicating that mutations in the 3 pathways make the tumor more difficult to control (Figure 3A). Moreover, the results revealed that the cell death-related TMB was significantly associated with gender (p < 0.001) with male patients having higher TMB than females (Figure 3B and Table 2).
Copy number variations
of cell death-related genes
After the CNV analysis, we found apoptosis-related genes to have the most changes (Figure 3D). Moreover, we found higher FGA, FGG and FGL values to be significant for an unfavorable prognosis in HCC (p = 0.008, p = 0.007 and p = 0.002, respectively, Figure 3C). In addition, the associations between copy number variations and clinical characteristics were explored and the results showed distinct correlations. Grade 4 HCC had the highest values of FGA, FGG and FGL (p < 0.005, Figure 3E and Table 3). The more severe the HCC, the higher the number of CNV and the shorter the survival time. This is consistent with our finding that high scores in FGA, FGG and FGL lead to a poor prognosis in HCC. Additionally, radiation therapy also causes changes in FGG. A low FGG was shown in genomes not exposed to radiation therapy (Figure 3F).
Transcriptomes of cell death-related genes
Based on RNA-sequencing (RNA-seq) data of HCC, we identified 53 cell death-related genes that were differentially expressed in HCC compared to normal tissues, including 31 apoptosis-related genes, 15 necroptosis-related genes and 7 autophagy-related genes (Figure 4A). Most of these differentially expressed genes were upregulated in HCC (Figure 4B). Furthermore, there were 18 cell death-related genes with significant effects on the prognosis of HCC, and no gene was found to have protective factors (Figure 4C). Through differential expression and prognostic analysis, we found that the effects of cell death-related genes on tumors were consistent, that is, high gene expression leads to tumorigenesis and poor survival rates. We conducted a cross analysis on the above differentially expressed genes and prognosis-related genes. It was found that 3 of the genes, namely peptidylprolyl isomerase A (PPIA), Harvey rat sarcoma viral oncogene homolog (HRAS) and baculoviral IAP repeat containing 5 (BIRC5), were not only differentially expressed in HCC, but also affected the overall survival of HCC patients, which belong to the necroptosis, apoptosis and autophagy pathways, respectively (Figure 4D).
With the infiltration scores of 24 immune cells calculated by the GSVA algorithm, the correlations between the above 3 genes and immune infiltration were investigated to characterize the immunologic landscape. Through correlation analysis, we can evaluate whether there is a correlation between the expression of these 3 genes and the immune cell score. If the correlation coefficient is high, the gene may affect immune cells. The results showed that HRAS affected the infiltration of immune cells (Figure 4E), thus, it may play a significant role in the progression and prognosis of HCC by affecting the death of immune cells. Since ferroptosis is an emerging way of cell death, we analyzed the relationships between the expressions of the above 5 genes and iron death-related genes. Most genes had no association with the iron death-related genes; however, ribosomal protein L8 (RPL8) was co-expressed in most of them (Figure 4F).
Using the GSEA algorithm, the effects of the above 5 genes on mitochondria-related pathways were explored, and the PPIA, HRAS and BIRC5 genes were all significant. Among them, PPIA was closely correlated with 56 mitochondrial pathways (Figure 4G). The mitochondrial complex III pathway was influenced by the expressions of PPIA, HRAS and BIRC5 in HCC (Figure 4H).
Construction of cell death-related signature
We performed the Cox regression to identify the genes that affect the survival of HCC, using LASSO to screen out genes with collinearity (Figure 5A). As a result, a total of 10 genes (4 apoptosis genes, 4 necroptosis genes and 2 autophagy genes) could be used to construct a cell death-related signature for HCC. A prognostic analysis of the signature confirmed that the high expression groups are closely correlated with a worse survival (Figure 5B). Finally, a multi-factor Cox regression analysis on the cell death-related signature and clinical parameters of HCC was studied. We found that the cell death-related signature, age and T stage were the most significant for the prognosis of HCC (Table 4). Therefore, based on these 3 variables, a nomogram was constructed to indicate the contribution of each variable to the outcome and to predict the survival probability more directly (Figure 5C). In the final nomogram, it can be seen that when the cell death model had a high score, the stage was high and the patient survival was poor.
Discussion
Hepatocellular carcinoma is one of the most common and lethal tumors of the digestive system, leading to an unfavorable prognosis.15 Therefore, it is urgent to uncover tumor microenvironment variations resulting in the development of HCC. Cell death pathways are an essential process of maintaining the growth of an organism.16, 17 They mainly include apoptosis, necrosis and autophagy. Our study aimed to evaluate the dysregulation of the cell death program and the related gene signatures with the clinical characteristics of HCC. Furthermore, cell death-related signatures that could help predict the overall survival of HCC patients were built.
In this study, we identified genes related to apoptosis, necrosis and autophagy pathways in HCC and their interactions with each other. There were 5 genes seen in all 3 pathways, namely BCL2, CFLAR, MAPK10, MAPK8, and MAPK9. Thus, they might play significant roles in the development of HCC by acting on various cell death pathways. The BCL2 family are considered important regulators of apoptosis and have been implicated in the initiation and progression of liver cancer.18 The activation of autophagy may also be initiated by a reduction in BCL2 levels,19 which was validated in experiments on mice with colorectal cancer. The mitogen-activated protein kinase (MAPK) pathway was reported to be required for cell proliferation and survival, of which inhibition could contribute to cell cycle arrest and apoptosis, as well as autophagy-mediated cell death.20, 21, 22 For example, Zhang and Jiang showed that odd-skipped related transcription factor 1 (OSR1) affected HCC progression and induced apoptosis by inhibiting MAPK pathways.23 They also mentioned that SN38 could induce the activation of the MAPK pathway and promote autophagy, thereby reducing the chemoresistance of tumor cells.24
Hepatocellular carcinoma exhibited an elevated mutational burden compared to normal tissues.25 The sequence analysis of cell death-related coding genes in HCC helps to understand their potential roles in carcinogenesis.26 Thus, we studied somatic mutations of genes related to the 3 cell death pathways. Among them, TP53 presented the highest mutation frequency, with SPTA1 having the 2nd highest frequency. Besides, TP53 and SPTA1 were mutually exclusive with other genes, which explains the reason for the less frequent occurence of the mutations of other genes. The TP53 and SPTA1 were commonly associated with liver cancer and are considered early driver genes in malignant tumors.27, 28 A mutation in TP53 may cause a loss of function resulting in resistance to apoptosis, which is characterized by inhibited cell cycle arrest and invasiveness of liver cancer.29 In addition, TP53 mutations may contribute to the deregulation of the cell cycle and antitumor immunity, which could serve as potential biomarkers for predicting the response to immunotherapy.30 The SPTA1 mutations were significant predictors of shorter survival and shorter recurrence time in liver cancer patients.31 After performing a survival analysis on mutated genes, 6 genes correlated with the prognosis of HCC, with the most significant being CSF2RB, MAP2K2 and PLA2G4A. Although their relationships with the overall survival of HCC patients have not been studied, it could be the focus of further research.
Tumor mutation burden is the number of mutations that exist within a tumor32, 33; it has been identified as a potential predictor for therapy with immune checkpoint inhibitors. We calculated the TMB associated with cell death and analyzed its correlation with clinical parameters based on the cell death-related load. In regard to changes in the genome, there are also changes in the copy number of genes. We found that the CNVs of apoptosis-related genes were observed most often. Higher FGA, FGG and FGL values were all significant predictors of an unfavorable prognosis in HCC.
In this study, we further explored RNA-seq data in HCC patients for variations in cell death-related gene expression and their relationship with the prognosis. We identified 54 cell death-related genes that were differentially expressed in HCC compared to normal tissues, and 3 of the differentially expressed genes were correlated with the prognosis: PPIA, HRAS and BIRC5. A decrease in the nerve growth factor (NGF) level can affect the antiproliferative function of gastrin-releasing peptide receptor antagonists in liver cancer cells,34 resulting in poor overall survival. Glycogen phosphorylase, muscle associated (PYGM), charged multivesicular body protein 2B (CHMP2B), and caspase 9 (CASP9) may also be potential biomarkers for the diagnosis and prognosis of HCC that need to be further validated in future studies.
We explored specific functions that are under the influence of the above 5 genes in HCC. In immune infiltration, HRAS was investigated to affect the infiltration of mostly immune cells. The PYGM was shown to play a significant role in regulating T cell migration and proliferation by binding to a small GTPase in the RAS family.35 The BIRC5 is required for activation, trafficking and antitumor activity of CD8+T cells.36 Therefore, we speculated that HRAS and BIRC5 could be associated with the progression and prognosis of HCC by affecting the proliferation and death of immune cells. Iron is essential for most biological processes, and the regulation of ferroptosis is dependent on iron.37 Ferroptosis is also a form of programmed necrotic cell death.38 Since ferroptosis is an emerging form of necrosis, we also analyzed the relationships between the expression of the above 5 genes and ferroptosis-related genes. Most of the genes did not correlate with ferroptosis-related genes, except RPL8, which was of interest because of the influence RPL8 has on the expression of ferroptosis in the initiation and progression of HCC. The mitochondria are known to modulate Ca2+ signaling, and the massive accumulation of Ca2+ in the mitochondria can contribute to apoptosis.39, 40 Using the GSEA algorithm, the effects of the above 5 genes on mitochondria-related pathways were explored, and PPIA was found to closely correlate with 58 mitochondrial pathways. The interaction between p38 MAPK and CASP9 can regulate mitochondria-mediated apoptosis in liver carcinoma cells.41
Additionally, we constructed a cell death-related signature for HCC using 10 prognosis-related genes. Among these, the high-expression group was validated to be significant for worse survival. Age and stage are also correlated with the prognosis of HCC. Finally, a nomogram was built based on these 3 variables to more directly guide the contributions of each variable in the clinical outcomes and prediction of the survival in HCC patients.
Limitations
This study has some limitations. First, the present results were analyzed based on high-throughput sequencing data. Specific experiments are required for verification. Therefore, special attention should be paid to the follow-up research. Second, the genes of the 3 cell death methods studied are based on the classical genes studied in the past, and there is no way to analyze genes that may have similar mechanisms yet to be studied. Finally, because the TCGA database was used, its specific ethnicity can have an impact on cell death-related models. Therefore, it needs to be expanded to other races and ethnicities for verification.
Conclusions
In the present study, we focused on the genetic and transcriptomic characteristics of cell death in HCC, along with their relationships with clinical variables, prognosis and biological functions. Finally, we constructed a cell death-related signature and prognostic nomogram for HCC that could be considered a reference for clinical use.


