


Abstract
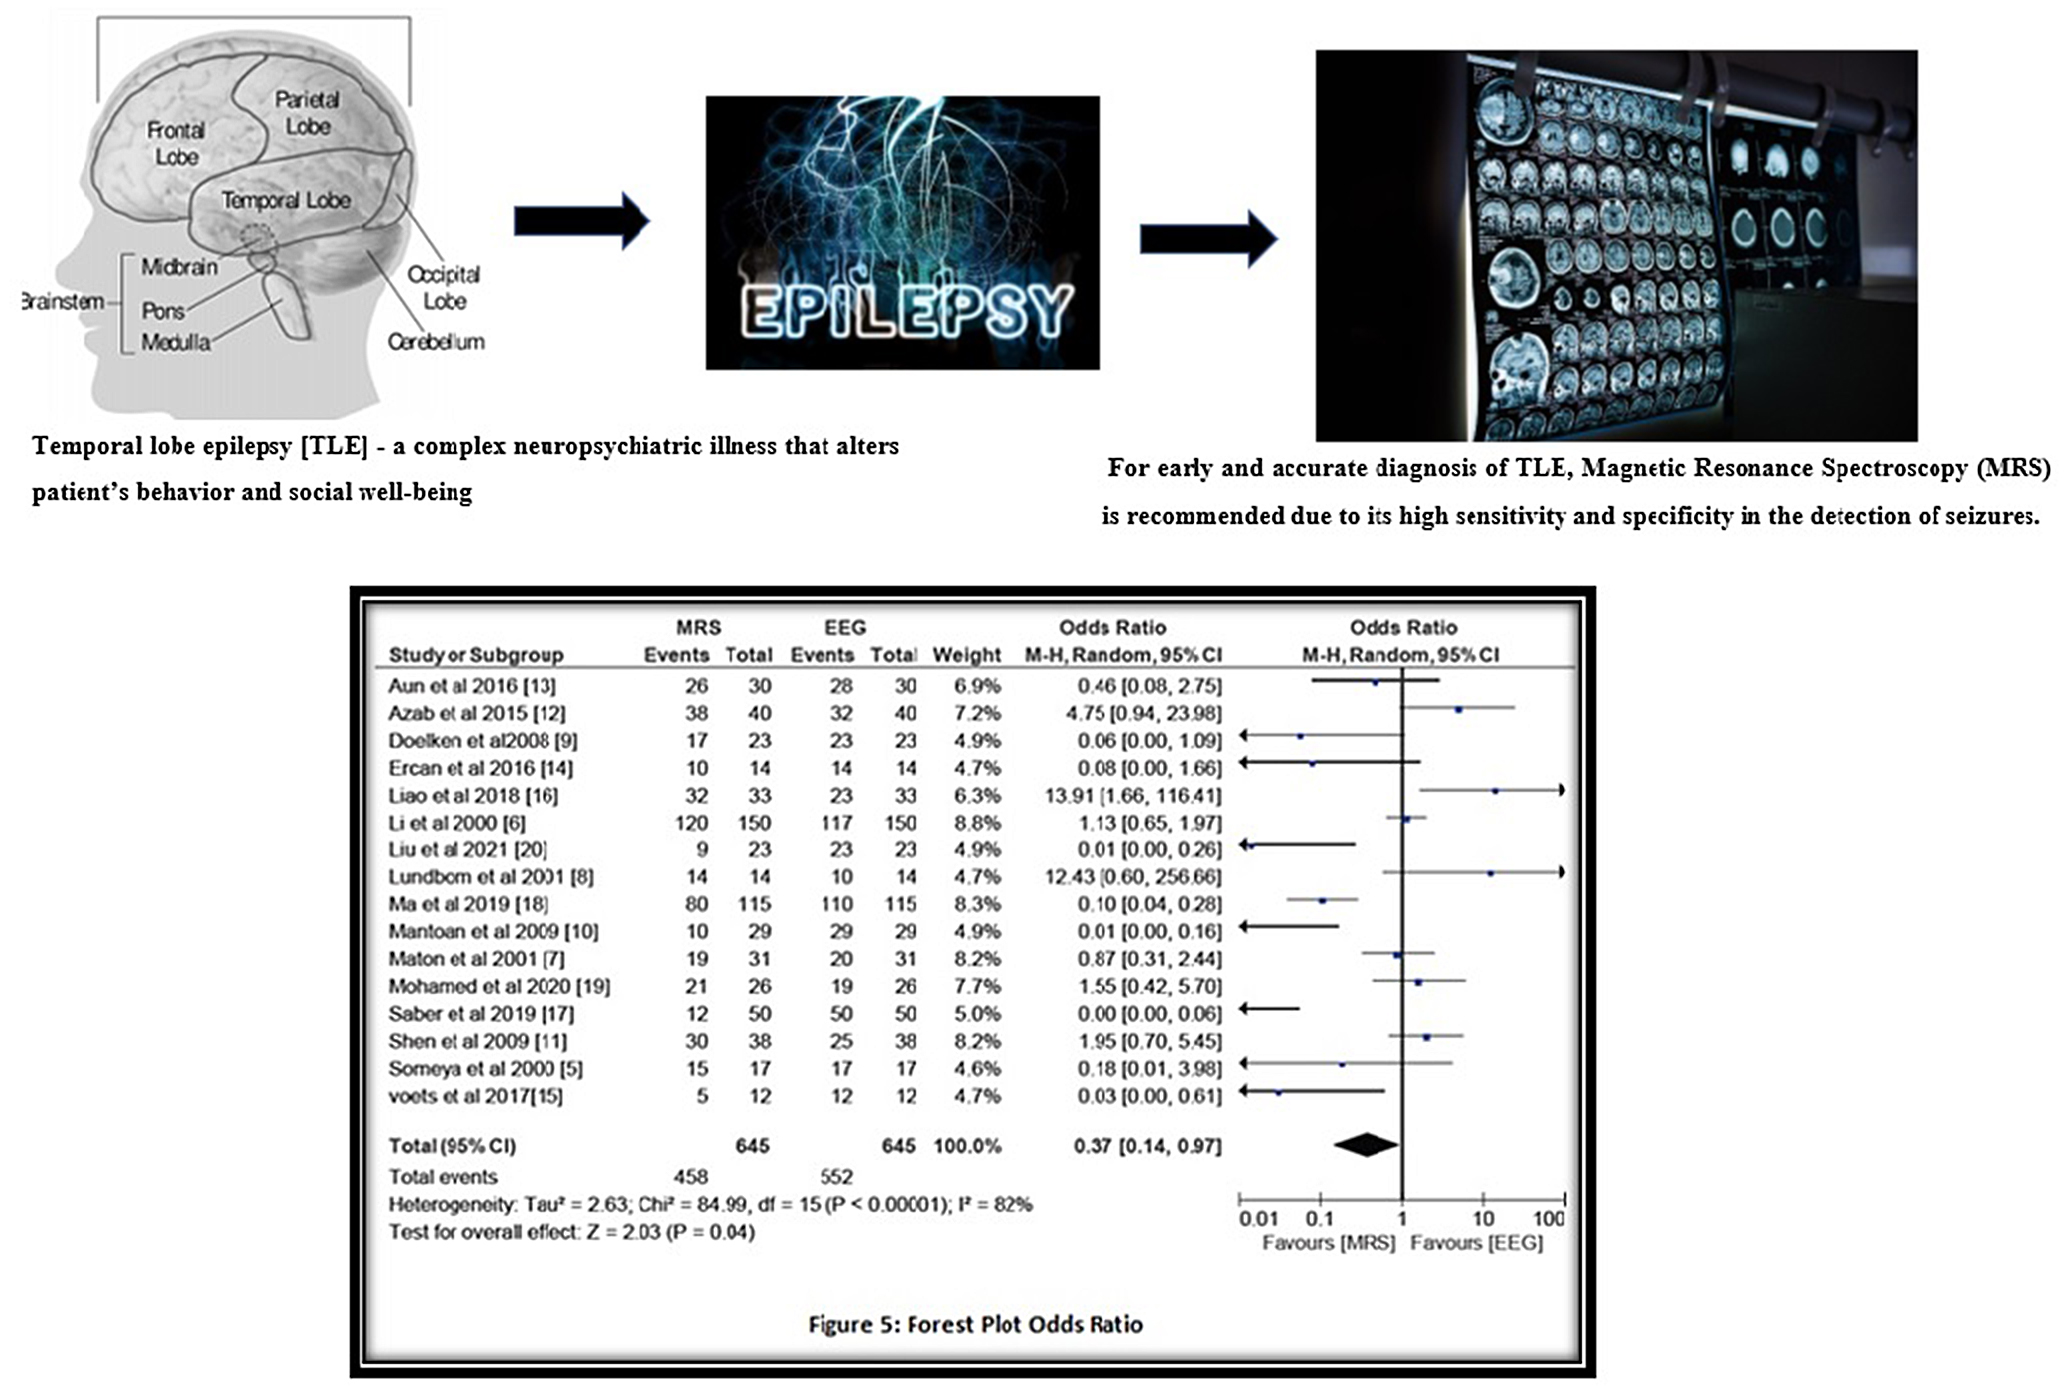
Background. Temporal lobe epilepsy (TLE) is a complex neuropsychiatric illness that alters patient’s behavior and social well-being. Early and accurate diagnosis of TLE is a key factor in its treatment. Currently, magnetic resonance spectroscopy (MRS) is recommended due to its high sensitivity and specificity in the detection of seizures. However, some studies have reported on its limited role in lesion detection.
Objectives. The present meta-analysis aims to analyze different studies thoroughly and investigate the role of MRS in the detection of TLE.
Materials and methods. A systematic literature review was conducted using Medline (via PubMed), Cinahl (via EBSCO), Scopus, and Web of Sciences databases for case-control, retrospective and prospective studies regarding the use of MRS in detecting TLE. Studies were included using the Population, Intervention, Comparison, Outcomes and Study (PICOS) criteria and relevant event data were extracted. The risk of publication bias was analyzed using the Begg and Mazumdar test. A risk of bias assessment was conducted using RevMan software. The Mantel–Haenszel method was used to calculate the sensitivity, pooled odds ratio (OR), and risk ratio (RR), also using RevMan software.
Results. A total of 16 studies published between 2000 and 2022 were included, which encompassed a total of 645 patients. We obtained a high sensitivity of 84.8%, which shows a high efficiency of MRS, and a pooled OR value of 0.37 (95% confidence interval (95% CI): 0.14–0.97) with a tau2 value of 2.63, χ2 value of 84.99, degrees of freedom (df) value of 15, I2 value of 82%, Z-value of 2.03, and p < 0.05. The pooled RR was 0.82 (95% CI: 0.69–0.97) with a tau2 value of 0.10, χ2 value of 122.11, df of 15, I2 value of 88%, Z-value of 2.25, and p < 0.05. These results were statistically significant for a low risk of publication bias.
Conclusions. The current meta-analysis highly recommends the use of MRS in the accurate detection of alterations seen in the brain in patients with TLE.
Key words: magnetic resonance spectroscopy (MRS), temporal lobe epilepsy (TLE), electroencephalography (EEG), magnetic resonance imaging (MRI)
Background
A seizure is defined as a sudden, uncontrolled electrical disturbance in the brain that can alter feelings, behavior, movements, and level of consciousness. According to the new 2017 International League Against Epilepsy (ILAE) Seizure Classification,1 a seizure originating in one hemisphere of the brain is classified as having a focal onset. If it appears simultaneously in both hemispheres, it is categorized as having a generalized onset. Two or more seizures within 24 h without an identifiable cause meet the criteria for epilepsy. Assuming that the patient is having epileptic seizures, the ILAE guidelines recommend the seizures be analyzed on 3 levels: level 1 – diagnosis of the seizure type; level 2 – diagnosis of epilepsy type (focal epilepsy, generalized epilepsy, or combined generalized and focal epilepsy); and level 3 – diagnosis of specific epilepsy syndromes. This new classification incorporates etiology of each stage and entails significant treatment implications.2
Temporal lobe epilepsy (TLE) is the most common form of localized or focal epilepsy, characterized by recurrent, unprovoked focal seizures originating in the temporal lobe of the brain. Due to this, patients have an altered sense of hearing, smell, taste, and touch, with a sudden sense of fear, panic, anxiety, confusion, and anger. Therefore, it is necessary to recognize this problem early, before it can spread. This condition can be caused by an infection in the brain, traumatic brain injury, meningitis, stroke, cerebral tumors, and febrile seizures, among other causes. It is treated with medications, diet control, electrical brain stimulators, and surgery in extreme cases.3
For its diagnosis, magnetic resonance imaging (MRI), positron emission tomography (PET), electroencephalography (EEG), and magnetic resonance spectroscopy (MRS) can be used. Clear imaging of suspected lesions is required for the accurate diagnosis and successful treatment of TLE. Among the various imaging techniques used for the detection of TLE, MRS is the most preferred technique owing to its high sensitivity (85–88%) and diagnostic accuracy. The MRS images can clearly demarcate the lateralization of TLE, mesial temporal sclerosis with hippocampal atrophy, and structural distortions. This technique can detect the dysfunction of neurons using the anatomic distribution of signals from metabolites like N-acetyl aspartate (NAA), creatine (Cr), phosphocreatine, and choline (Cho)-containing compounds. Among these, NAA is of major interest due to its neuronal distribution and the fact that any alteration or reduction in NAA signaling is indicative of TLE.4
Various studies have recommended its use in the detection of TLE – for example, papers by Someya et al.,5 Li et al.,6 Maton et al.,7 Lundbom et al.,8 and Doelken et al.9 These studies reported that MRS is effective in the identification of an epileptic zone in epilepsy patients and has a high diagnostic accuracy. Mantoan et al. reported that a reduction in NAA levels on the contralateral side acts as a marker for the identification of epileptogenicity in the contralateral mesial temporal structures.10 Similarly, Shen et al.11 and Azab et al.12 reported that MRS is very useful in the preoperative investigation of patients with TLE and can detect lateralization and bilateral abnormalities. Similarly, Aun et al. reported that MRS enables multiparametric mapping of TLE in less time and with a high sensitivity, and is a promising tool in evaluating patients with TLE.13 In a prospective study by Ercan et al.14 evaluating 14 patients, and a multimodal imaging study by Voets et al.15 evaluating 12 patients, MRS was reported to be the preferred tool for studying the lateralization of epileptogenic foci and evaluating patients preoperatively. Meanwhile, a study by Liao et al. reported that magnetic resonance (MR) fingerprinting is more sensitive and accurate compared to MRS in the detection of temporal lobe seizures.16 In contrast, Saber et al.17 and Ma et al.18 highly recommend the use of MRS in TLE. Essam-el-dein Mohamed et al. suggested its limited use and recommends the combination of pulsed arterial spin-labeling (PASL) MRI and proton magnetic resonance spectroscopy (1H-MRS) for the proper identification of epileptogenic zones in patients.19 Liu et al. conducted a retrospective study that highlights the diagnosing capacity of MRS and recommended it highly.20 Considering the contrasting data of MRS in the detection and localization of TLE, the current meta-analysis aimed to statistically analyze the literature and predict diagnostic accuracy of MRS.
Objectives
This study aimed to investigate the role of MRS in the detection of changes and abnormalities in the hippocampus and limbic system of patients with TLE.
Materials and methods
We followed the guidelines and normative recommendations by Preferred Reporting Items for Systematic Reviews and Meta-analyses (PRISMA; registration No. NU#/IRB/2020/1022).
Search strategy
This meta-analysis is based on an extensive search of the databases of Medline (via PubMed), Cinahl (via Ebsco), Scopus, and Web of Science between 2000 and 2022. The following keywords were used to search for relevant studies: “magnetic resonance spectroscopy”, “MRS”, “temporal lobe epilepsy”, “TLE”, “electroencephalography”, “EEG”, “magnetic resonance imaging”, and “MRI”. The included articles were selected using the PRISMA guidelines and randomly selected irrespective of the language, publication status, or type of study (prospective, retrospective, clinical trial). Demographic summary of the patients and event data of the included studies were collected and analyzed.5, 6, 7, 8, 9, 10, 11, 12, 13, 14, 15, 16, 17, 18, 19, 20 Two of the authors (JF and XZ) separately scanned relevant sources for related studies. Mainly full texts articles were collected; abstracts were used only if they provided sufficient information for the meta-analysis. Obsolete references were excluded and useful studies were included if they met the inclusion criteria. Event data from useful variables were collected by 2 researchers (LC and SL) independently.
Inclusion and exclusion criteria
The studies included reported on the use of MRS as an effective imaging method for patients with TLE. Studies were selected from the years 2000 to 2022. In the current study, only full-text data were included, while studies with insufficient data, studies reporting the use of other imaging methods, and studies published before 2000 were excluded.
Evaluation of the analytical standard
and source of heterogeneity
Two reviewers (JF and XZ) separately evaluated the methodological validity of the included studies and calculated the heterogeneity for the included studies, while author SL was responsible for resolving any type of disagreement between JF and XZ. To investigate the heterogeneity, a Cochran’s Q test and I2 index were calculated with RevMan software v. 5 (The Nordic Cochrane Center, The Cochrane Collaboration, Copenhagen, Denmark).21 The heterogeneity was investigated for the use of different study types (case-control, prospective and retrospective studies), age of patients, sex ratios, imaging instruments, and lab technicians’ performance.
Statistical analyses
For statistical analysis, a diagnostic odds ratio (OR) was calculated using the DerSimonian–Laird technique.22 To accomplish this, a 2×2 table was constructed using event data and the meta-analysis was performed using RevMan software. A pooled diagnostic OR with 95% confidence interval (95% CI) and a risk ratio (RR) with 95% CI was calculated using the Mantel–Haenszel test.23 Respective forest plots and the heterogeneity of the included studies (χ2 value, Q value, degrees of freedom (df) value, I2 value, and p-value) were evaluated with RevMan software. To assess the efficiency, MRI sensitivities were also analyzed. A risk of bias summary was also performed using the RevMan software, while a Deek’s funnel plot was created using MedCalc software v. 20.115 (MedCalc Software, Ostend, Belgium) to assess the risk of publication bias.24
Results
Literature search results
We found a total of 1128 studies through our electronic scans of different databases. Among these studies, 135 studies were excluded after reading their titles and abstracts, leaving 993 records to be screened. We excluded additional 743 studies because of improper study design and duplicity reasons. This left 250 studies for final screening. Out of the 250 studies, 209 studies were excluded because the did not fulfill the inclusion criteria, and thus 41 studies were eligible for further assessment. The key reasons for exclusion were inadequate evidence and comparison criteria inappropriate to create a 2×2 table for review. Finally, for this meta-analysis, 16 studies published between the years 2000 to 2022 fulfilled the inclusion criteria i.e., the use of MRS for the detection of TLE, as shown in Figure 1.
The included studies encompassed a total of 645 epileptic patients of different ages who were chosen randomly and scanned with MRS along with an EEG or MRI. The demographic details of the studies were included in this meta-analysis and are shown in Table 1. The details collected included the author of the study, publishing year, type of study, method of assessment, duration of the study, total sample size, age and gender of the patients, type of instruments used, total number of epileptic cases diagnosed, and total number of cases tested. Event data of these studies (including the number of total samples studied and epileptic cases diagnosed using MRS and EEG) were collected and a meta-analysis was performed.
Results
The risk of bias for the included studies was assessed as shown in Table 2. The risk of bias is summarized in Figure 2 and a risk of bias graph is shown as Figure 3.
The current meta-analysis had a low risk of publication bias, as apparent from the funnel plot (Figure 4) and results of the Egger’s and Begg and Mazumdar tests. The Egger’s regression test determines the degree of funnel plot asymmetry by measuring the intercept from the regression of the standard normal that deviates against the precision, while the Begg and Mazumdar rank correlation test explains the correlation between ranks of effect sizes and their variances. If p > 0.05, than the study has low risk of publication bias. The Begg’s test and Egger’s test values were considered significant and with low risk of publication bias if their p-value is greater than 0.05. Since we also achieved the p-values of Begg’s test and Egger’s test greater than 0.05 as p-value of 0.78 for the Begg’s test and 0.57 for the Egger’s test, respectively, this confirms that present study has low risk of publication bias.25
We obtained a sensitivity of 84.8%, which showed a high efficiency of MRI in detecting all the neurobiological changes that occur during TLE. The OR of the included studies was calculated using RevMan software and the Mantel–Haenszel test with random effects to assess the association between the exposure to MRS in epileptic patients and its outcome in the accurate detection of unilateral or bilateral epilepsy in comparison to the standard method of EEG. A forest plot of the ORs and heterogeneity of data is presented in Figure 5. We obtained a pooled OR value of 0.37 (95% CI: 0.14–0.97) with a tau2 value of 2.63, χ2 value of 84.99, degrees of freedom (df) value of 15, I2 value of 82%, Z-value of 2.03, and p < 0.05. The p-value less than 0.05 confirms the statistical significance of present meta-analysis and indicates the use of MRS for detection of temporal lobe epilepsy. From forest plot also it is evident that results are in favor of MRS for detection of TLE as compared to EEG (Figure 5).26 This proves that detecting epileptic regions is much more accurate with MRS compared to EEG, with the latter diagnosing spike or sharp waves in the tip or front part of the temporal lobe.
The RR of included studies was calculated using RevMan software and a respective forest plot is shown in Figure 6. The pooled RR was 0.82 (95% CI: 0.69–0.97) with a tau2 value of 0.10, χ2 value of 122.11, df value of 15, I2 value of 88%, Z-value of 2.25, and p < 0.05. The RR was less than 1, which indicates a low risk and suggests that the use of MRS in epilepsy detection is effective and safe.27 The heterogeneity value in our meta-analysis demonstrates the variations in study outcomes between the different studies selected for this meta-analysis; high heterogeneity shows that the chosen study results were random and different.28 In our meta-analysis results, we obtained high heterogeneity, which is confirmed by a high I2 index (above 80%) in both OR and RR. It shows the dispersion of effect sizes in this meta-analysis.29 The Z-value shows the significant weighted average effect and is considered statistically significant with a p < 0.05.30 The p-value shows the probability of obtaining a significant observed effect. We also obtained high Z-value (>2) in both OR and RR calculations with p < 0.05, showing the statistical significance of our results.
These values suggest that a random sampling of data using categorical study variables and determining epileptic regions using EEG and MRS are comparable. The I2 values above 80% suggest that broad heterogeneity was observed in the studies. A high sensitivity value of 84.8% indicates that the use of MRS for TLE detection is justified as it is highly sensitive and can detect even minor changes in the different regions of temporal lobe. P-value <0.05 means all these values are statistically significant and reflect a high diagnostic accuracy of MRS in the detection of TLE.
Discussion
Temporal lobe epilepsy is a disease of faulty neuronal resonators and is the most common focal epilepsy, responsible for chronic neurological issues like mental confusion, mood swings and altered sensation, among other things.31 It is caused by traumatic brain injuries, malformations in blood vessels of the brain, infections like encephalitis or meningitis, stroke, brain tumors, scarring (gliosis) in the hippocampus, or genetic syndromes.32, 33 Approximately 80% of TLE cases develop in or near the area of the hippocampus known as the mesial (“near the middle”), while neocortical or lateral TLE seizures start in the outer portion of the temporal lobe.34 In a study by Navidhamidi et al., it was reported that limbic seizures begin in the mesial temporal lobe, and the hippocampal region shows a wide range of changes and epilepsy-related abnormalities in patients with temporal lobe epileptic seizures.35 Epilepsy is one of the major reasons for paroxysmal alterations in the brain as it causes alterations in membrane excitability and leads to overstimulation of neurons.36 Garofalo et al.37 and Battaglia et al.38 discussed the neurobiological signs of epilepsy that help in the accurate detection of TLE. Ahmed et al. reported that epilepsy symptoms are caused by co-occurring psychiatric disorders and antiepileptic medicines are essential for diagnosis and treatment of this epileptic disorder.39 Tanaka et al. showed that disturbance in normal brain development during early life affects neuropsychiatric symptoms during later life and can be a reason for epilepsy.40 Similarly, Battaglia et al. suggested that fear conditioning has a deep impact on the functioning of the central nervous system and is involved in the cardiac vagal dynamics observed in the psychophysiology of fear.41, 42
Tanaka et al. reported that epilepsy along with neurodegenerative and immunological changes occur in temporal epileptic disorders and are responsible for the inflammation in these areas.43 The high sensitivity of MRI help to accurately identify the inflamed areas in TLE. Approximately 66% of seizure patients can be successfully treated with medications, while in cases of mesial TLE surgery is recommended.44 Borbély et al. evaluated the clinical impact of hybrid [18F]-FDG PET/MRI imaging on the detection of epilepsy in patients and reported its clinical significance.45
Zhao et al. mentioned in their review on TLE that it affects primarily cognitive functions related to memory, language and social judgment, so it is essential to detect its occurrence and cause timely and accurately since this condition affects the mental well-being of a patient and can disturb their social life.46 Therefore, for diagnostic purposes, various imaging techniques like MRI, positron emission tomography (PET), EEG, computed tomography (CT) scan, and MRS are generally used.47, 48 However, for the accurate diagnosis of the cause and type of TLE, MRS is almost universally recommended on account of its high sensitivity, specificity and diagnostic accuracy.
For instance, Cendes et al.,49 Lee et al.50 and Wood et al.51 reported that neuroimaging of epilepsy is the best way to diagnose TLE by detecting different effects epileptic seizures have on the temporal lobe. Similarly, Fan et al. reported that MRS is very useful in lateralizing and localizing the epileptogenic foci in TLE patients.52 In a radiology article by Gaillard et al., it was shown that images obtained in different phases of TLE can act as markers for its detection using MRS.53 However, some studies, like Hellström et al.54 and Carne et al.,55 reported that MRS is useful in detecting TLE in selected cases, but not universally.
In the present study, we investigated the role of different diagnostic methods thoroughly, and similarly to the studies supporting MRS, we obtained a significant pooled OR value of 0.37 (95% CI: 0.14–0.97) with p < 0.05, which indicates high efficiency of MRS in the detection of epileptic regions. The low pooled RR of 0.82 (95% CI: 0.69–0.97) with a p < 0.05 suggests that MRI is a low-risk imaging method for detection of temporal lobe epilepsy for patients of all age groups. On the basis of comparable determination rates of epileptic regions using MRS, similar to other neurodiagnostic techniques (EEG, MRI, etc.) and its high sensitivity, the use of MRS for detection of TLE is recommended.
Based on these statistically significant results and high sensitivity, specificity and diagnostic accuracy of this method, this meta-analysis strongly recommends the use of MRS in detecting the cause of TLE.
Limitations
A limitation of the present study is the diversity of MRS instruments used, and the fact that the tests were performed by different radiographers, which influences the risk of false negative results. Many studies failed to report comparable diagnosis capability of MRI, EEG and PET, so assessing the comparable accuracy affects the data up to some extent. Data from other relevant studies showing the diagnostic accuracy of MRS in comparison to other diagnostic imaging methods were also included to signify the efficacy of MRS more clearly. Detailed data on a patient’s case history and physical examination and pathological tests results can further increase the diagnostic accuracy rate of MRS in the prediction of TLE.
Conclusions
The focal or generalized onset of seizures can lead to TLE and altered behavior, sensations and social well-being. To restore mental fitness, it is essential to identify the root cause of the seizure in a timely and accurate manner. Generally, MRI, PET and EEG are common imaging techniques used for the diagnosis of alterations in the membrane excitability in the hippocampus or the limbic system of the brain, and in the identification of the type of TLE. Still, among these methods, the high accuracy of seizure detection, high sensitivity towards any electrical stimulation and high specificity for the precise identification of epileptic zones of MRS make its use highly recommended. It is an effective imaging method for detecting the cause of TLE, and is preferred over other methods as it allows the accurate detection of epileptic zones and clearly identifies epilepsy as unilateral or bilateral, with a focal or generalized onset. It is very useful as a scanning guide in epileptic surgeries and remarkably increases the effectiveness of treatment. We performed a meta-analysis of the related available literature on the use of MRS in detecting the cause of TLE. Based on the high sensitivity (84.8%) and high efficiency of MRS in detecting all neurobiological changes that occur during TLE, and the statistically significant heterogeneity of our results, we recommend the use of MRS in determination of TLE.


