Abstract
Background. The HS016 is an adalimumab biosimilar related to the immunoglobulin G1 (IgG1) antibody, with a similar amino acid sequence.
Objectives. To quantify the differences in the pharmacokinetic (PK) parameters of HS016 and adalimumab in healthy individuals and patients with ankylosing spondylitis (AS).
Materials and methods. The PK data for HS016 and adalimumab were obtained in a randomized, double-blind, phase 1 clinical study in Chinese healthy subjects after a single-dose subcutaneous administration (136 healthy subjects), and in a randomized, double-blind, phase 3 trial of AS patients who received subcutaneous injection of HS016 or adalimumab once every 2 weeks for 24 weeks (366 AS patients).
Results. The time course of HS016 and adalimumab was characterized by a one-compartment model with first-order absorption and elimination kinetics. Age, body weight, creatinine clearance (CLcr) and anti-drug antibody were covariates for the apparent clearance (CL/F); body weight and subject type were significant covariates for the apparent volume of distribution (V/F). The V/F and CL/F were estimated at 11.3 L and 0.0102 L/h. The ratios of the geometric least square (LS) means (HS016 compared to the adalimumab treatment group after multiple doses) in healthy subjects were 97.14 (87.70, 107.59) for the concentration-time curve from time zero to the last measurable concentration (AUC0–t) and 99.14 (90.03, 109.16) for the maximum serum drug concentration within a steady-state dosing interval (Cmax, ss); the ratios (90% confidence interval (90% CI)) in AS patients were 97.03 [84.10; 111.96] for the AUC within the steady-state dose intervals (AUC0–tau) and 99.62 [88.09; 112.68] for Cmax, ss.
Conclusions. The systemic exposure of HS016 was similar to that of adalimumab in healthy subjects and AS patients, demonstrating PK similarity.
Key words: HS016, adalimumab, population pharmacokinetics, biosimilar, patients with ankylosing spondylitis
Background
Humira® (adalimumab) is a human monoclonal immunoglobulin G1 (IgG1) antibody that targets tumor necrosis factor alpha (TNF-α). It has profoundly improved the therapy of inflammatory disease and has been approved in the treatment of ankylosing spondylitis (AS) and numerous other conditions, including rheumatoid arthritis and Crohn’s disease.1 Ankylosing spondylitis is considered to be one of the most common members of the spondyloarthritis (SpA) group of arthritic diseases,2 with a prevalence in China of approx. 0.22%,3 a rate comparable to that in Asian countries and Caucasians.4 The access of patients to therapy with, e.g., adalimumab for the treatment of chronic inflammatory disorders is often limited due to the economic burden.5 The introduction of biosimilars will lower the treatment costs for the much needed treatment.5 To obtain the marketing approval for a biosimilar drug, an assessment must be made of the risk/benefit ratio based on the equivalence studies and regulated clinical trials in accordance with the requirements of the regulatory authorities.6, 7, 8
The HS016 is an adalimumab biosimilar developed by Zhejiang Hisun Pharmaceutical Co., Ltd. (Taizhou, China). In order to be approved for market, the biosimilarity between HS016 and the reference drug must be demonstrated. Thus, a pharmacokinetic (PK) study with HS016 and adalimumab as the reference drug was conducted in healthy volunteers,9 and a phase 3 study aimed at evaluating a range of PK parameters and any safety issues was conducted in AS patients.10
Limited data can be used to accurately calculate PK parameters using population modeling, in contrast to the non-compartmental method. In addition, the inter-product and inter-individual variability (IIV) allows for the quantification and indentification of covariate factors, using the population method that may have an influence on the availability of the test drug.11 The PK similarity analyses using nonlinear mixed-effects models have already been performed for some other biosimilars.12, 13 Therefore, in the present study, the similarities in PK parameters between HS016 and adalimumab, both in healthy subjects and AS patients, were also assessed by a comparison of the predicted time-dependent drug serum concentrations, evaluated with a PK population model that used data from the 2 abovementioned clinical studies.
Objectives
The aim of this study was to incorporate data from previous studies in patients with AS and healthy male volunteers, with the aim of creating a PK population model of HS016 and adalimumab, and describing the PK similarity between HS016 and adalimumab, in order to understand the PK characteristics of these 2 drugs in a large Chinese population.
Materials and methods
Subjects
There were 2 studies included in this analysis. A brief description of the study designs is provided below and in Table 1.
First research (HS016-I), a phase 1 single-dose study, compared the HS016 with adalimumab in healthy Chinese men.
The second research (HS016-III) was a phase 3 multiple-dose study that compared HS016 with adalimumab in Chinese patients with AS. Patients were stratified according to their age (<40 years and ≥40 years) and C-reactive protein (CRP) concentration (<28.0 mg/L and ≥28.0 mg/L). The age range was 18–65 years and patients were diagnosed with AS according to the 1984 modified New York criteria.14
The ethics committees of participating hospitals approved the study protocols. The study was carried out in accordance with the Declaration of Helsinki. The informed consent was provided by all study participants before they underwent any procedures.
Sampling and bioanalytical methods
Samples of blood were collected from the subjects in order to determine the range of PK parameters and for the anti-drug antibody (ADA) analysis. The sampling data are described in Table 1.
A validated quantitative enzyme-linked immunosorbent immunoassay (ELISA) was employed to measure HS016 and adalimumab concentrations in human serum collected from healthy subjects and patients in the HS016-I and HS016-III studies. The lower limit of quantitation (LLOQ) for both drugs was 15.625 ng/mL. The validation showed that the results fell within standard accepted criteria.
Bridging electrochemiluminescence (Meso Scale Discovery, Rockville, USA) was used to detect anti-HS016 and adalimumab antibodies.
Population pharmacokinetic analysis
Software
NONMEM v. 7.3.0 software (ICON, Dublin, Ireland) was used to conduct population analyses of PK parameters and simulations,15 together with PsN tool kit (v. 4.6.2) (a process embedded in NONMEM instead of an independent software)16 and R v. 3.6.1 for Windows (R Foundation for Statistical Computing, Vienna, Austria). The NONMEM datasets were constructed using SAS v. 9.4 (SAS Institute, Cary, USA).
PK structural model
The PK parameters of adalimumab have been widely reported and based on published data,17, 18, 19 and a one-compartment model was used to evaluate the elimination rate of adalimumab in patients with hidradenitis suppurativa, rheumatoid arthritis (RA) and Crohn’s disease. Also, only 1 declining phase of the logarithmic serum concentration time course of adalimumab and its biosimilar was observed in healthy subjects.20 Therefore, this model was tested, which was fitted to the available data, and was parameterized according to the absorption rate constant (KA), the apparent volume of distribution (V/F) and the apparent clearance (CL/F) (ADVAN2, TRANS2), by employing a first order conditional estimation method that utilized an interaction (FOCE-I) fitting subroutine.
Statistical model
The IIV and the inter-occasion variability (IOV) of PK parameters of adalimumab and HS016 were determined using the exponential error model (Eq. 1):
(1)
where Pi,k is the individual PK value for the ith individual and kth occasion; Ptv is the population estimate; and ηPi and IOVPk were assumed to have normally distributed inter-individual and inter-occasion random variables, with zero mean and variance of ωP2 and πP2. Three occasions were defined: one for the time before the intended week 12, one for the time between the intended week 12 and week 14, and the other one for the time after the intended week 14.
The residual variability was determined using a combined additive and proportional model (Eq. 2):
(2)
where Cij is the jth observed drug concentration of an individual i; Ĉij is the jth model predicted concentration for an individual i; and εPij and εaij are the proportional and additive residual random errors for an individual i and a measurement j, presumed to have independent and identical normal distributions: ε ~ NID: Normally and Independently Distributed (0, σ2).
Covariate analysis
The following covariates were tested: age, sex, baseline body weight (BW) in kg, baseline body mass index (BMI) and surface area of the body, subject type (healthy subjects compared to AS patients), treatment (adalimumab compared to HS016), drinking or smoking habit, presence of ADA (a subject with at least 1 ADA-positive sample relative to baseline at any time after the initiation of treatment), baseline serum albumin, baseline alanine aminotransferase (ALT), baseline alkaline phosphatase (ALP), baseline aspartate aminotransferase (AST), baseline CRP, baseline erythrocyte sedimentation rate, baseline total bilirubin, baseline serum creatinine, baseline creatinine clearance (CLcr), and the presence of concomitant medication (salazosulfapyridine, celecoxib, diclofenac, meloxicam, and methotrexate).
After the completion of the structural model establishment, empirical Bayes estimates for inter-individual random effects could be determined. For the hierarchical models, changes in the minimum value of the objective function (OFV) were analyzed using a χ2 test in order to determine whether the data were statistically significant. The most significant covariate factor was retained in the model once for each iteration, and then the forward addition was repeated. Covariates were included if the OFV decrease was >3.84 (χ2, p < 0.05). All influential covariates were retained in the model and then a full covariate model was computed. The final model was established using the backward elimination method. After each iteration, a single covariate was deleted from the full covariate model to consider if it was necessary. If the OFV model increased by >6.63 (χ2, p < 0.01) after removing 1 covariate, that covariate was considered significantly influential.
The covariates that were continuous, were incorporated using a power function centered around the value of the median, thus (Eq. 3):
(3)
where Ptv is the typical value of the parameter with covariate value Cov; Ppop is the typical value of the PK parameter P; and θcov is the estimated exponent parameter of the continuous covariate.
Categorical variables were modeled as follows (Eq. 4):
(4)
where Ptv is the typical value of the parameter with covariate value cov; Ppop is the typical value of the PK parameter P; θcov is the estimated fraction parameter of the categorical covariate; and FLAG is either covariate value, appropriately.
Evaluation of the model
Three techniques were used to evaluate the interim and final models: (1) the examination of goodness-of-fit (GOF) diagnostic plots; (2) the visual predictive check; and (3) the bootstrap. A visual predictive check (VPC) was used to assess the predictability of the PK model; 1000 simulated duplicates of PK datasets were generated using model parameter estimates. Simulation predictions at 90% were compared to the actual data by superimposing it on various percentile intervals of simulated data (5%, 50% and 95%).
To assess the robustness of the PK population final model, 1000 bootstrap duplicates were built by random sampling of the original data. The parameters were estimated for each bootstrap duplicate and employed to determine the median and 95% confidence intervals (95% CIs). The median and 95% CIs for the bootstrap PK parameters were calculated as the 50th percentile, with a range of 2.5th to 97.5th of results from each duplicate. Subsequently, a comparison was made between the parameters derived from the original data and the model-derived bootstrap parameters.
Pharmacokinetic similarity assessment
The main PK endpoints were: the concentration-time curve (AUC) from time zero to area (AUC0–t); zero time to infinity (AUC0–∞); the maximum serum drug concentration (Cmax) after a single-dose in healthy men and AS patients; the AUC within the steady-state dose intervals (AUC0–tau); and the maximum serum drug concentration within a steady-state dosing interval (Cmax, ss) after multiple doses in AS patients. These values were calculated using the specific PK parameters of the 2 drugs estimated using the model.
To assess the similarity of PK parameters between HS016 and adalimumab, a statistical evaluation based on the average equivalence was employed. The simulated PK parameters (Cmax, AUC0–t and AUC0–∞; Cmax, ss and AUC0–tau) between subjects treated with HS016 and adalimumab were analyzed using the analysis of variance (ANOVA) with the natural log-transformed values of all PK parameters as dependent variables. The differences in natural log-transformed least square (LS) means between the treatments (HS016 and adalimumab) and associated 90% CIs were estimated. The back transformation revealed the ratio of the geometric LS means and related 90% CIs to the original parameters. The equivalence of PK between HS016 (test product) and adalimumab (reference product) were concluded when the 90% CIs of the ratios of the geometric means were entirely contained within 80% to 125%.7, 8
Results
Subjects
A total of 8659 HS016 and adalimumab serum concentrations from 502 subjects were included in the analyses, including 2352 concentrations from 136 healthy subjects (1165 concentrations from 68 subjects for HS016, 1187 concentrations from 68 subjects for adalimumab) and 6307 concentrations from 366 AS patients (4023 concentrations from 235 patients for HS016 and 2284 concentrations from 131 patients for adalimumab). The demographics of participants included in the PK population analysis at baseline, stratified according to the study and treatment method, are presented in Table 2. All of the covariates exhibited similar distributions for the 2 treatments in each study.
Serum concentrations
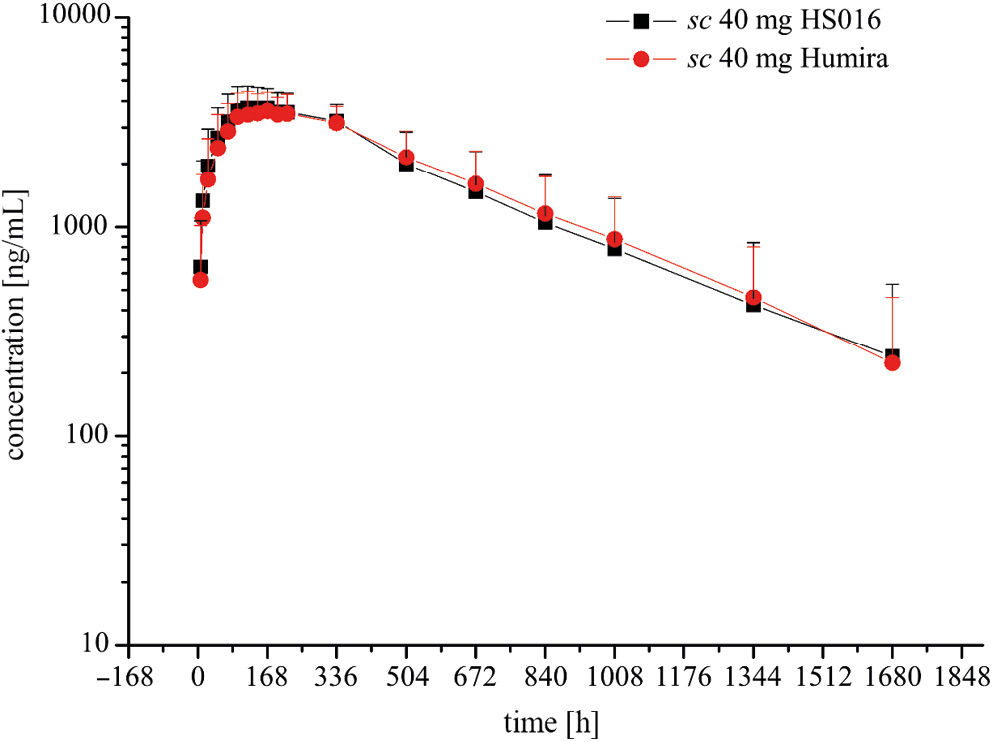
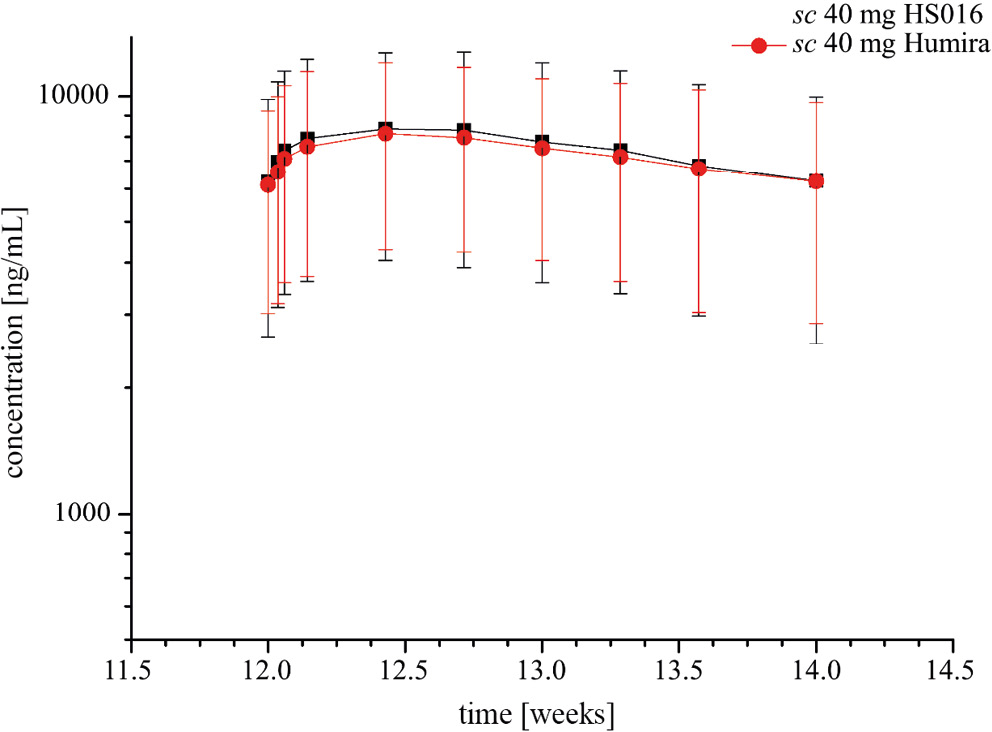
Figure 1 shows the mean serum concentrations of HS016 and adalimumab in the phase 1 study, following the administration of single 40 mg subcutaneous doses. Figure 2 shows the results from the phase 3 study of the mean serum HS016 and adalimumab concentrations at week 12, after the administration of 40 mg subcutaneous doses once every 2 weeks. After single and multiple doses, the PK profiles of HS016 and adalimumab were virtually identical. Only 1 declining phase of the logarithmic serum concentration time courses of adalimumab and its biosimilar HS016 were analyzed.
PK population modeling
The time courses of HS016 and adalimumab serum concentrations in healthy subjects and AS patients achieved the best fit when a one-compartment model was employed after the subcutaneous administration. The treatment (DRUG) was not identified as the significant covariate and BW, age, CLcr, and the presence of ADA were shown to be significant covariates for CL/F, BW and subject type as covariates for V/F, and the subject type as a statistically significant covariate for KA. An exponential term was used for IIV and IOV. A combined error model best explained the residual error.
The final population PK model was as follows (Eq. 5–7):
(5)
(6)
(7)
where θ represents the fixed-effect parameters, CL/F is clearance corrected for bioavailability, AGE is age, and i and k are the predicted value of kth plasma concentration of the ith patient. The AGE, BW and CLcr were continuous covariates, while categorical covariates included ADA (where ADA describes absent = 0 and present = 1) and TYPE (where healthy subjects = 0 and AS patients = 1). The η and IOV represent the IIV and IOV, respectively.
The estimated parameters derived from the final model and its validation are given in Table 3.
Evaluation of the model
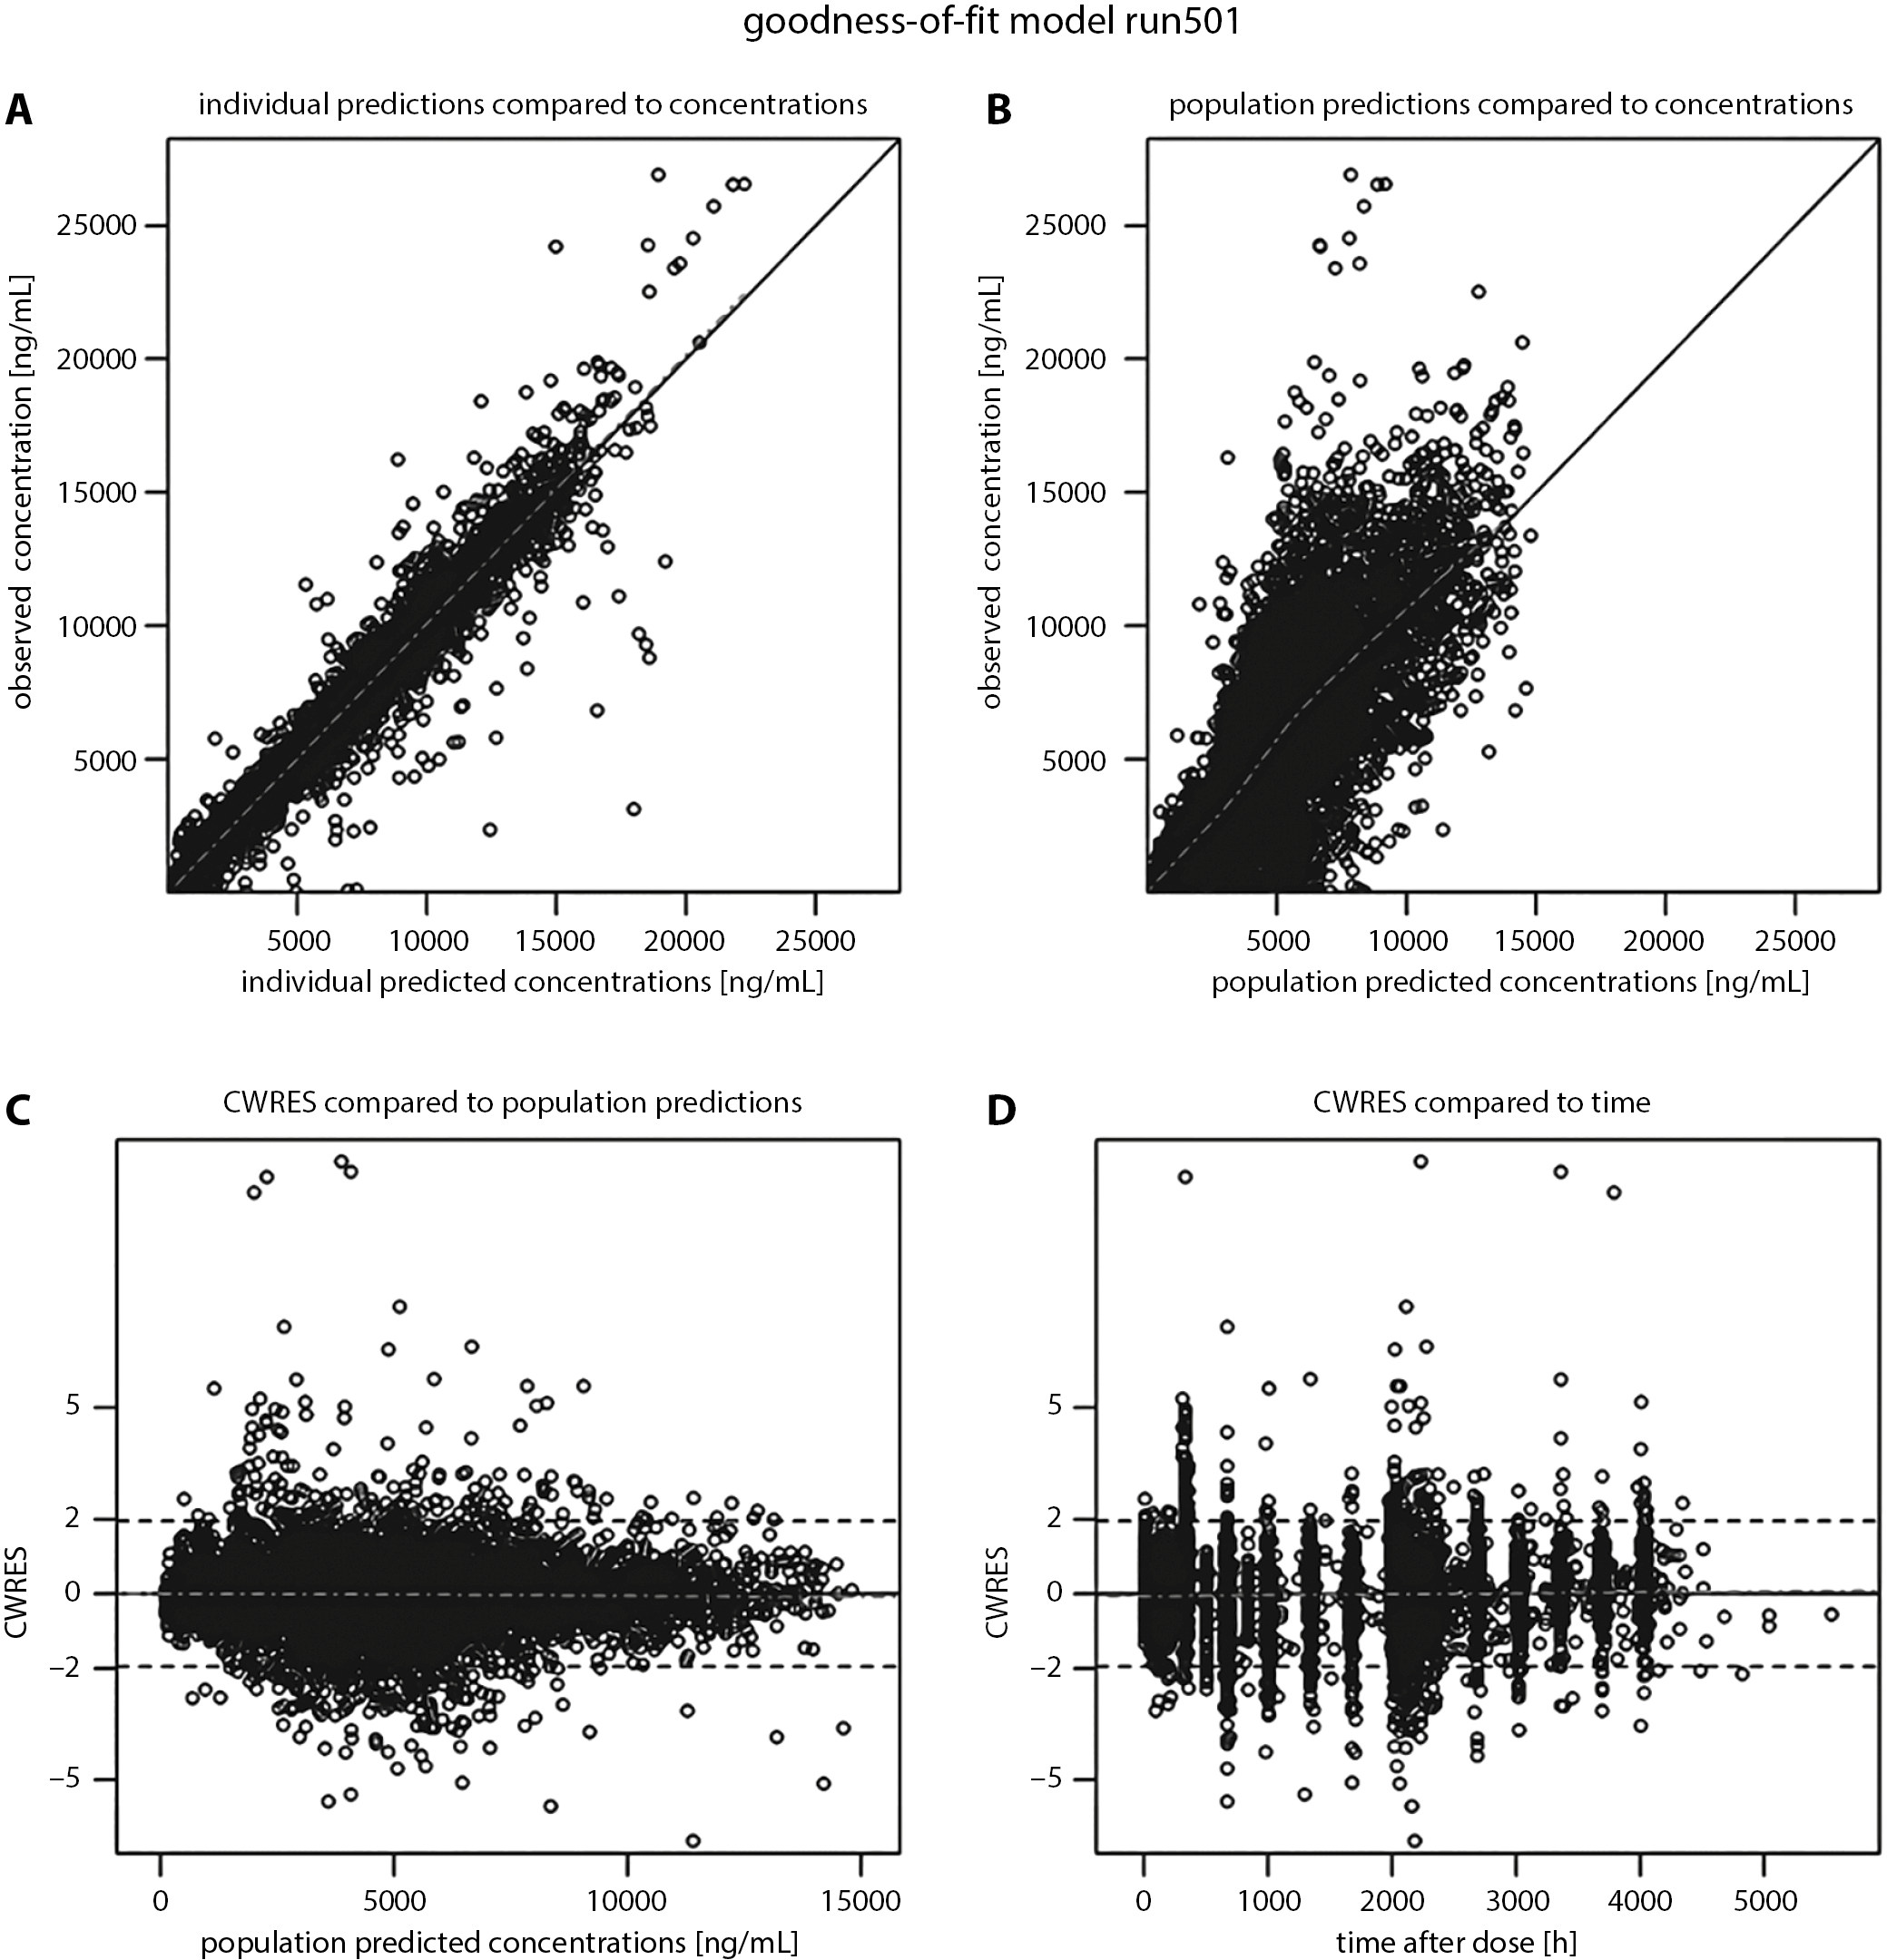
The GOF plots of the PK population final model are displayed in Figure 3. The plots exhibited good correlations between an individual prediction and the observation with lines of identity and trend line overlaid, and the individual predictions fitting the identity line well. This finding has proven the excellent predictive power of the model. The conditional weighted residual error had no misspecification of residuals related to population predictions (PRED) and time, was mostly distributed within ±5 and was well distributed along the zero-line relative to PRED.
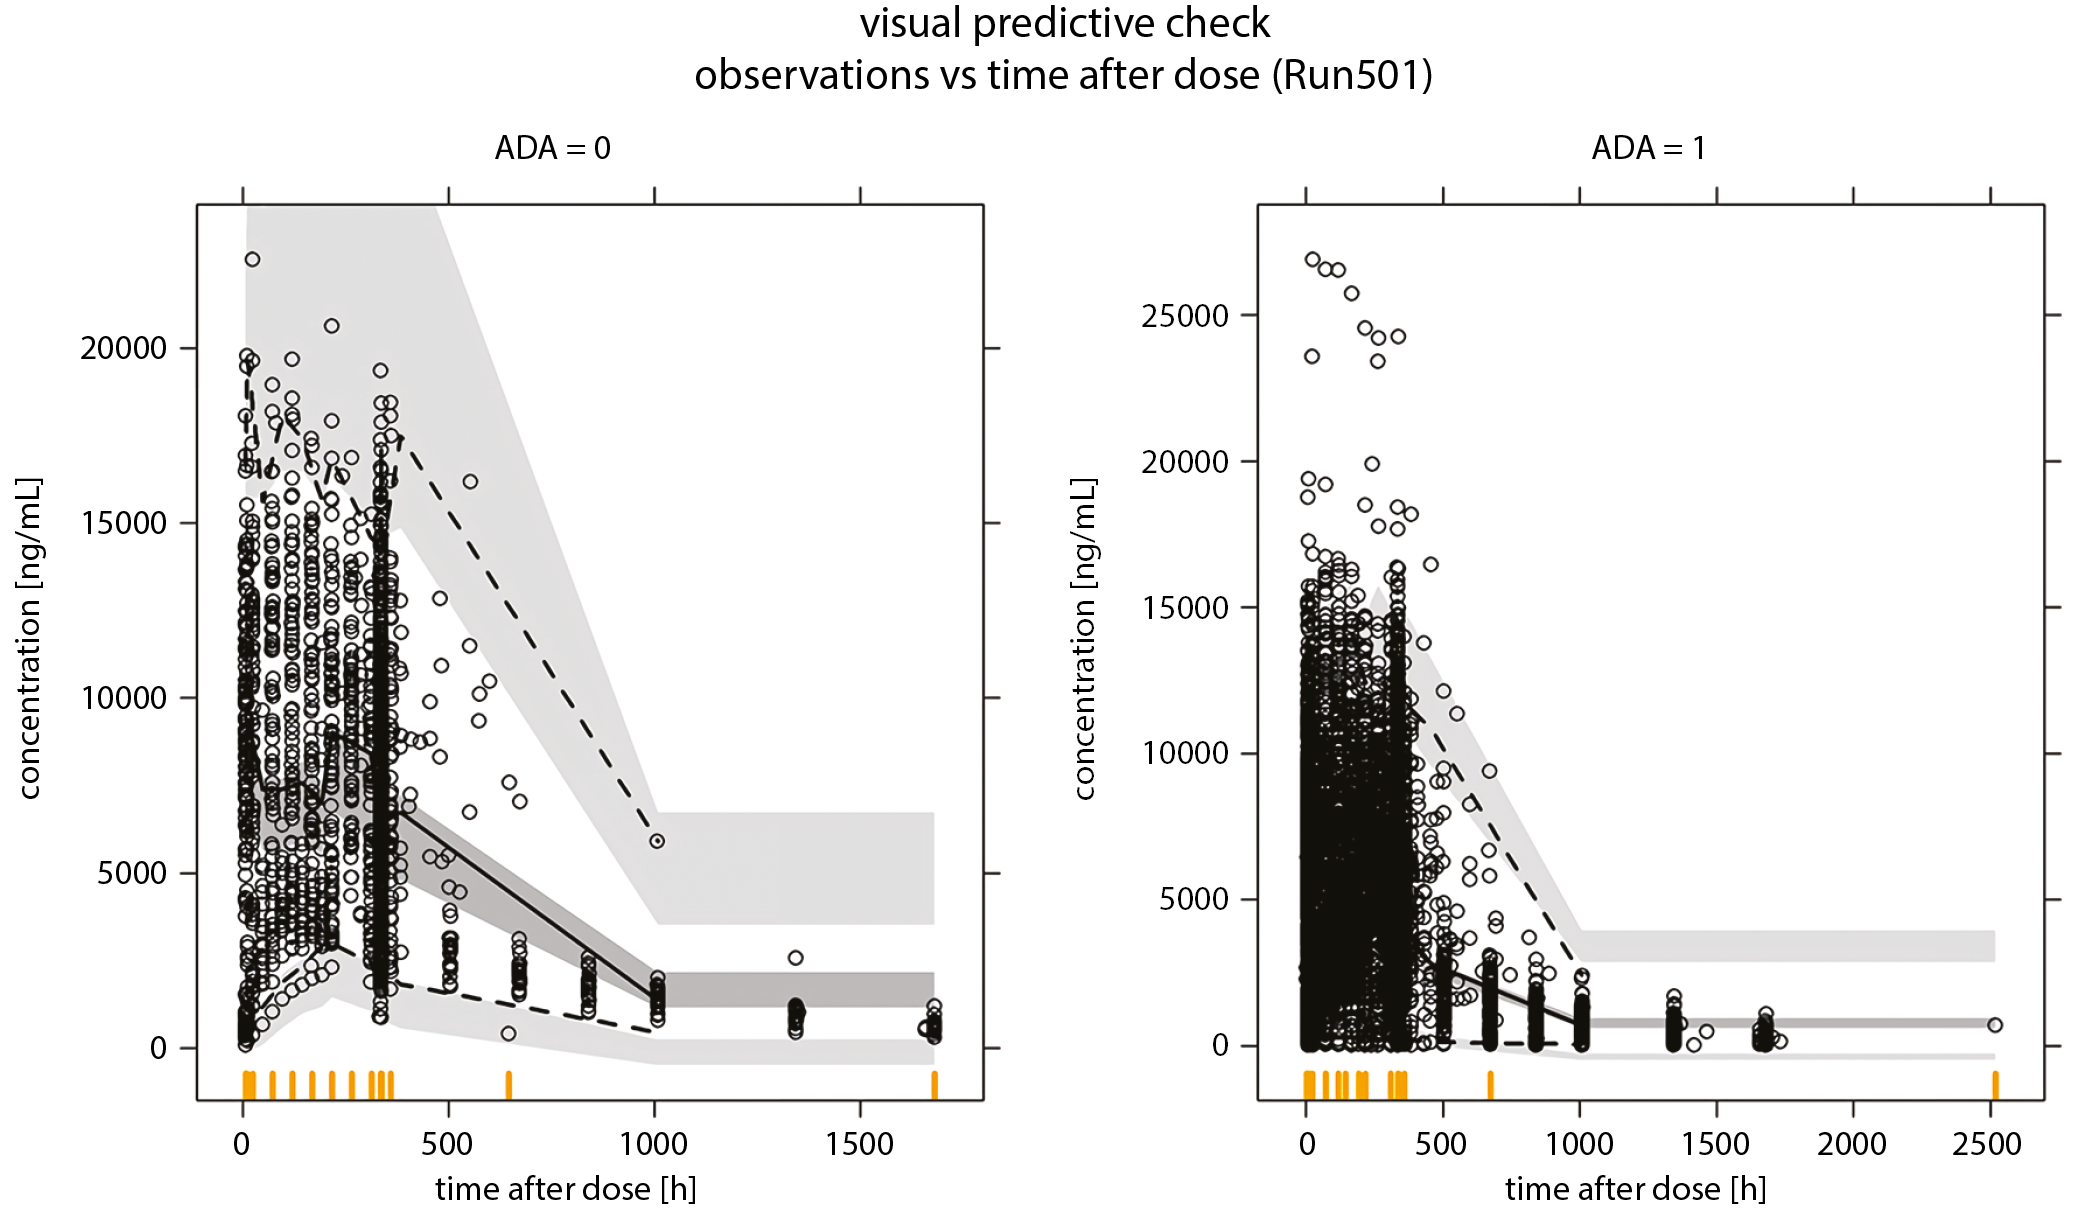
The VPC was used to determine the predictive accuracy of the final model (Figure 4). A total of 1000 simulated duplicates of the PK dataset were produced from the estimates derived from the final model. The model described the observed data well, and 50th percentiles of measured drug concentrations generally fell within the prediction of 90% CI, suggesting that the model produced a good description of the PK parameters of HS016 and adalimumab.
A total of 993 out of 1000 bootstrap duplicates successfully converged and the estimated PK parameter values based on the original data were found to be in a good agreement with the median values of PK parameters estimated using bootstrap duplicates (Table 3).
Pharmacokinetic assessment
The analyses of the main PK endpoints after single- and multiple-dose administrations by subject were evaluated to determine the PK similarity (Table 4, Table 5).
In healthy subjects, the ratios of the geometric LS means (the HS016 group compared to the adalimumab treatment group after a single-dose) were 90% CIs: 97.71 [89.26; 106.97] for AUC0–t, 97.14 [87.60; 107.71] for AUC0–∞ and 105.11 [98.14; 112.58] for Cmax. Virtually identical results were found when the PK parameters of HS016 and adalimumab at steady state (after multiple doses) were determined; the corresponding values were 97.14 [87.70; 107.59] for AUC0–tau and 99.14 [90.03; 109.16] for Cmax, ss. The limits for the abovementioned CIs of the ratios were within the 80–125% interval.
In AS patients, the ratios of the geometric LS means (the HS016 group compared to the adalimumab therapy group after a single-dose) were 90% CIs: 98.10 [86.24; 111.59] for AUC0–t, 97.08 [83.84; 112.41] for AUC0–∞ and 105.59 [98.12; 113.63] for Cmax. The corresponding values for the PK of HS016 and adalimumab at steady state were 97.03 [84.10; 111.96] for AUC0–tau and 99.62 [88.09; 112.68] for Cmax, ss. The limits for the abovementioned CIs of the ratios were within the 80–125% interval.
Discussion
The study investigated the PK parameters of the adalimumab biosimilar HS016 in a large number of Chinese AS patients, the serum concentrations and treatment cycles, in order to introduce PK methods that measured the drugs characteristics accurately. A total of 8659 HS016 and adalimumab serum concentrations from 502 subjects were included in the analyses, including 2352 from 136 healthy individuals and 6307 from 366 AS patients (4023 from 235 patients for HS016 and 2284 from 131 patients for adalimumab).
As a part of the biosimilarity assessment, we sought to detect possible differences between the PK parameters of the test and reference drugs. In the target patient population, full intensive sampling of concentration-time curves for all included patients was sometimes not available. However, the implementation of a non-compartmental method needs a powerful sample profile to evaluate the AUC using the trapezoidal method. In our study, the sample size required to detect the PK biosimilarity was decreased along with the exclusion of patients with sparse sampling. The PK similarity analysis using nonlinear mixed-effects models have already been performed for other biosimilars,12, 13 and a PK population approach has been previously used to assess adalimumab actions in patients with other indications.17, 18, 19
The PK population model developed to compare HS016 and adalimumab permitted us to employ insubstantial sampling and facilitated the quantitation of any potential changes in the PK parameters of the 2 treatment regimens. We demonstrated that the time course of HS016 was well-characterized by the developed model. In the present study, adalimumab and its biosimilar PK parameters were assessed in healthy subjects and AS patients after a single dose or multiple doses at steady-state concentrations, in accordance with the Food and Drug Administration (FDA) bioequivalence guidelines.8 Simultaneously, the large sample size increased our ability to detect any differences between the 2 investigated drugs.
The abovementioned one-compartment population PK model best described adalimumab and HS016 PK in healthy males and AS patients after one-dose or multiple-dosage regimens. The population estimates for CL/F (the absence of ADA) and V/F were 0.01 L/h and 11.3 L for AS patients, and they were comparable to patients with hidradenitis suppurativa (0.0278 L/h and 13.5 L), RA (0.013 L/h and 10.8 L) and Crohn’s disease (0.014 L/h and 7.8 L).17, 18, 19
The factors that had a significant effect on PK parameters for adalimumab in the model were BW, age, CLcr, presence of ADA on CL/F, BW, and subject type on V/F and KA. The covariate analysis revealed that CL/F increased in a patient who became ADA-positive for both HS016 and adalimumab. For both drugs, CL/F also increased with increasing BW, age and CLcr. Age, BW and the presence of ADA have also been previously reported to be significant factors for adalimumab.18, 19 In our study, the treatment (adalimumab compared to HS016) was not an important covariate, indicating that the PK parameters of both drugs were similar.
The ratios of the geometric LS means (HS016 compared to adalimumab) met the expectations for the statistical equivalence of AUC and Cmax after a single-dose, and at steady state. Thus, systemic exposure (AUC and Cmax) and the linked variability calculated using a PK population model revealed that the PK parameters of HS016 and adalimumab were similar. The geometric LS means of AUC and Cmax were also comparable to the results reported by the literature in healthy subjects.20
It is noteworthy that because of the complex nature of the PK population model, a number of limitations may restrict its validity. There may exist a potential bias in the simulated data that makes the predicted data different from the measured data. For example, the population model underpredicted PK profiles of HS016 and adalimumab, as shown by VPC (Figure 4). We compared the results with those obtained using traditional non-compartmental analysis in the phase 1 study (results not shown), the PK bioequivalence results from non-compartmental analysis and the model-based approach and showed their similarity, thereby demonstrating that our model-based approach can be used for the equivalence testing.
In addition, we have also explored the relationship between the exposure (AUC and Cmax) of HS016 or adalimumab at steady state and pharmacodynamic (PD) parameters (maximum decrease changes from baseline of CRP and erythrocyte sedimentation rate). It showed that the correlation between the PK and PD parameters was not different (p > 0.05), and that the trends were consistent between HS016 and adalimumab.
Limitations
The study has several limitations. All patient data came exclusively from Chinese participants and the trials had strict inclusion and exclusion criteria, which might not reflect real-world clinical conditions.
Conclusions
Systemic exposure (Cmax, AUC parameters) of HS016 and associated variability were similar to adalimumab in healthy male subjects and AS patients. The 90% CIs for all parameters fell within a range of 80–125% predefined bioequivalence interval.