Abstract
Background. Gastrointestinal (GI) cancers remain among the most lethal malignancies worldwide, highlighting the need for novel insights into modifiable risk factors. Blood-based metabolic biomarkers – routinely measured in clinical settings – may play a role in cancer etiology, but their causal impact remains unclear.
Objectives. This study aimed to explore the causal relationship between metabolic blood biomarkers and the risk of GI cancers using Mendelian randomization (MR).
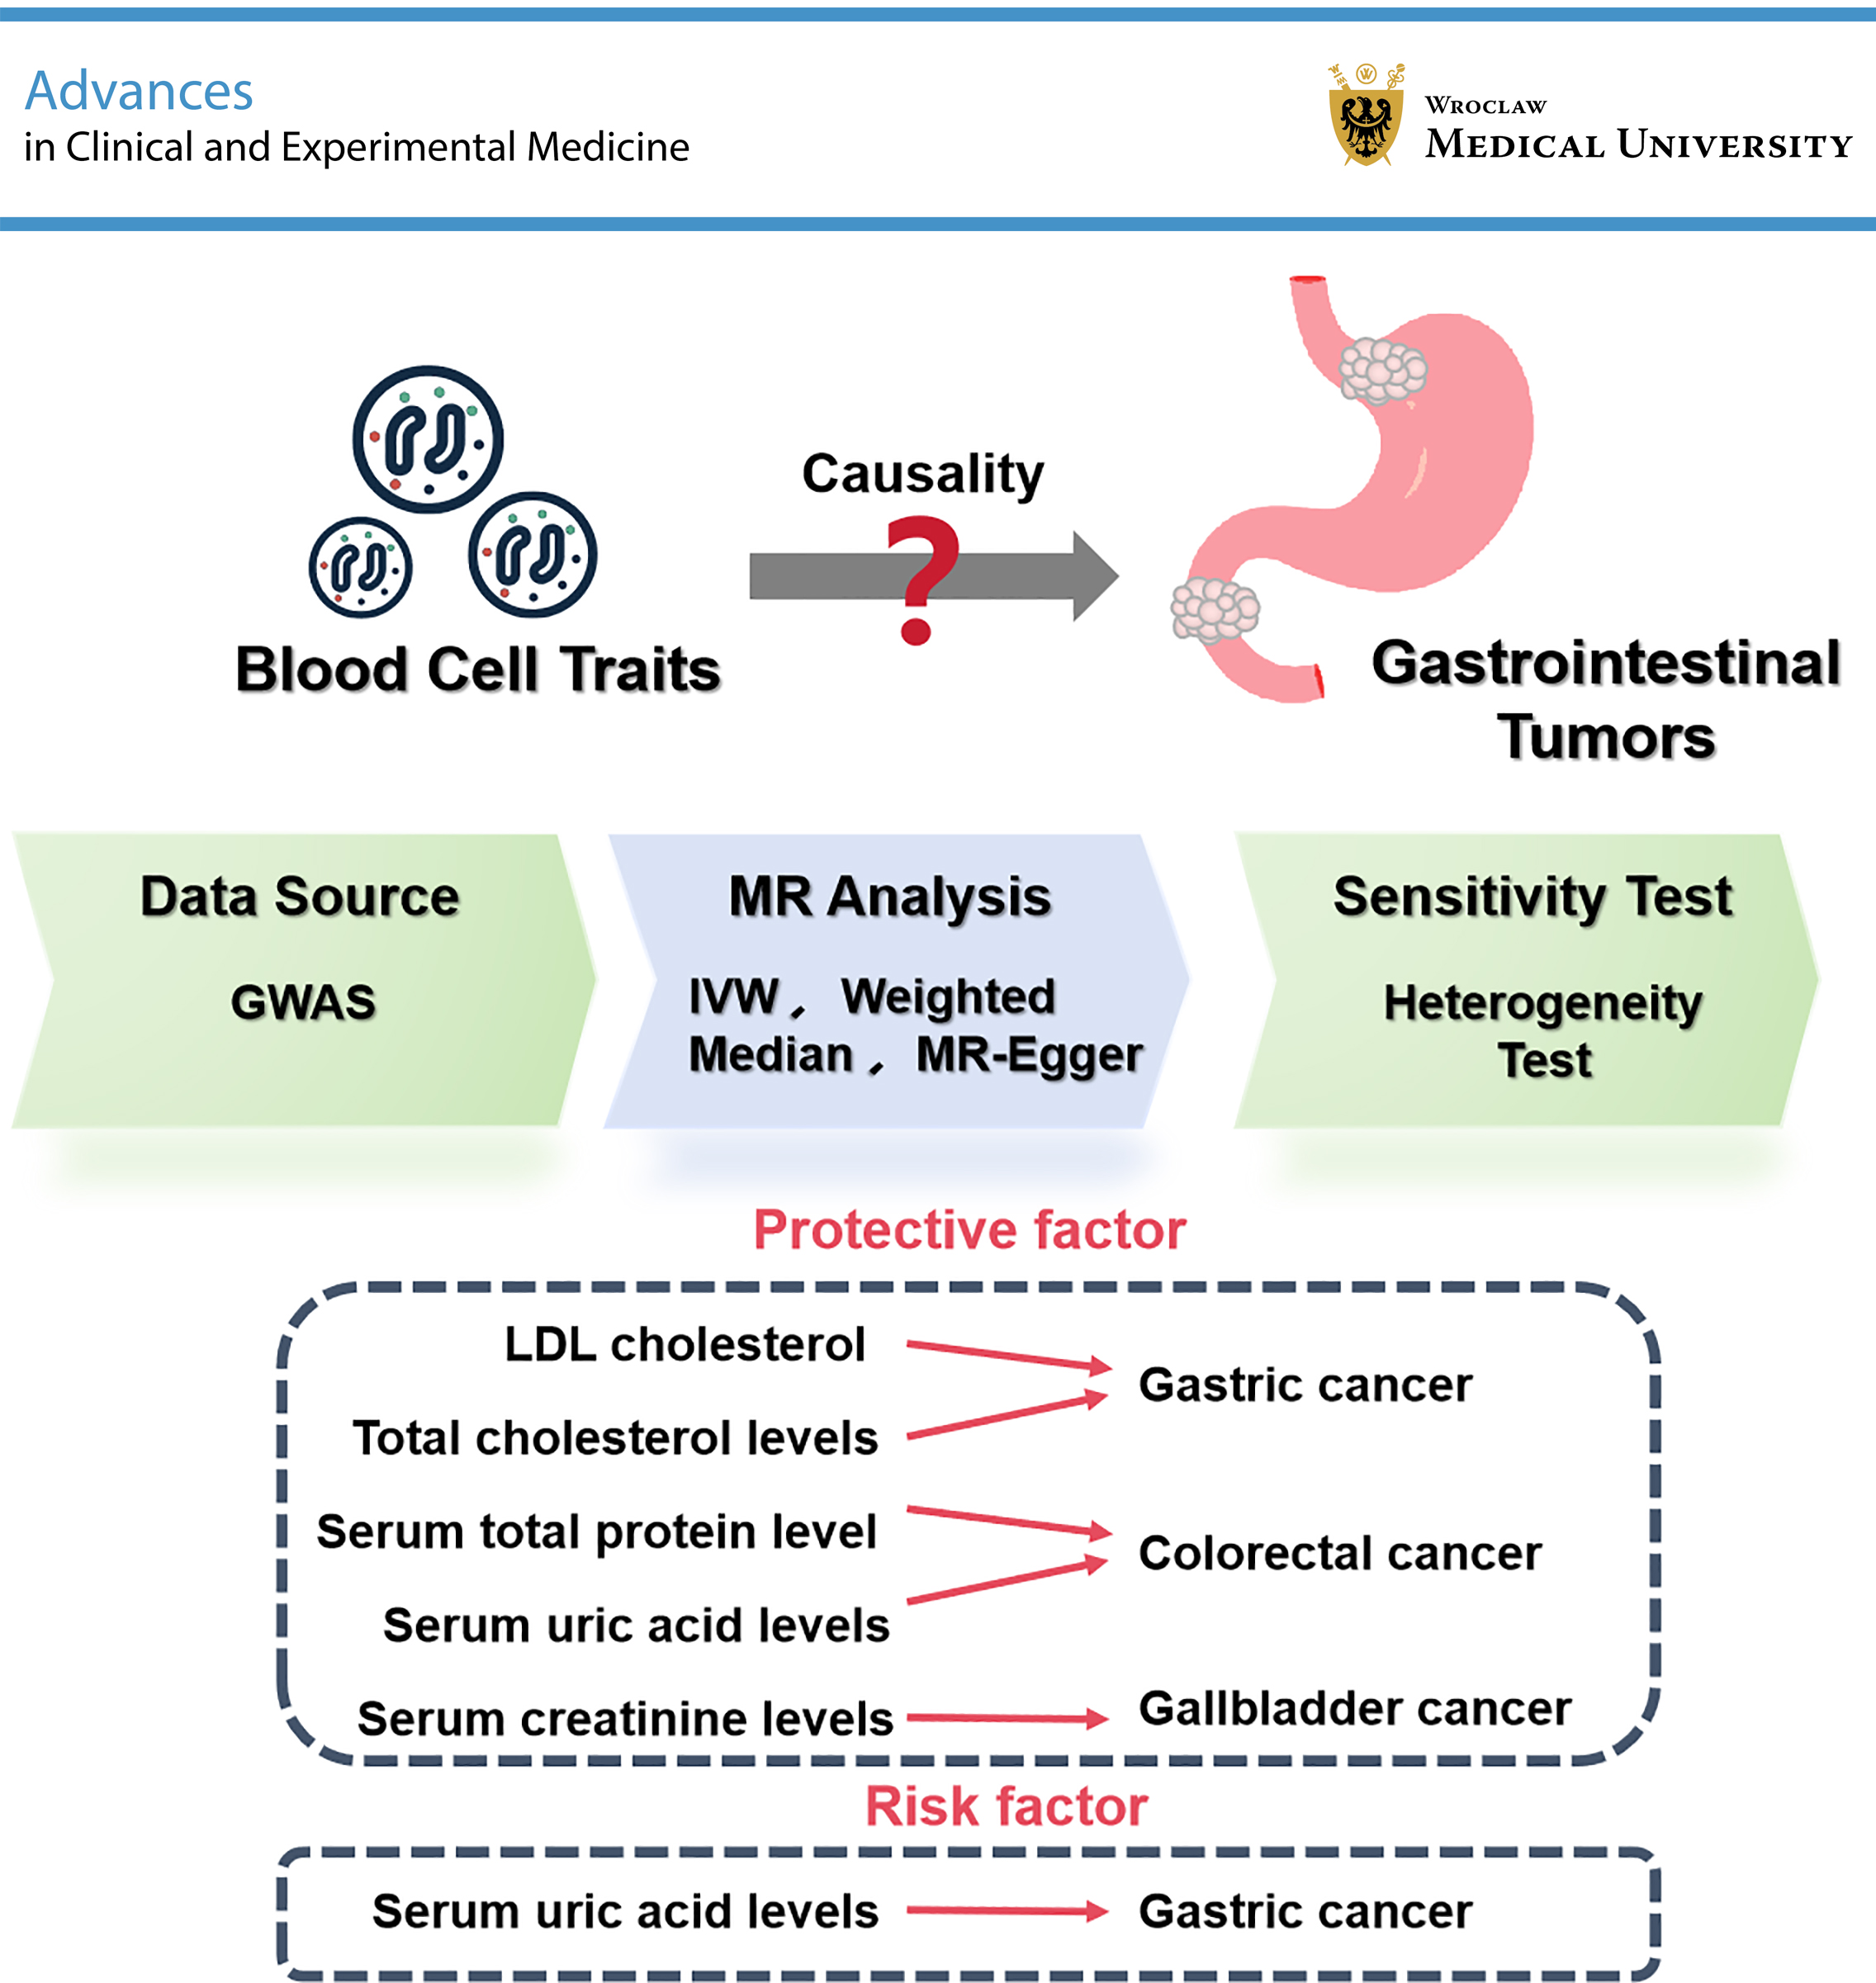
Materials and methods. We conducted an MR analysis using large-scale genome-wide association study (GWAS) data to evaluate the causal effects of metabolic blood traits (e.g., low-density lipoprotein (LDL) cholesterol, creatinine, uric acid, total protein, and total cholesterol) on the risk of 4 major GI cancers: gastric, colorectal, pancreatic, and gallbladder cancer. Statistical robustness was evaluated using the MR-PRESSO test and Cochran’s Q test.
Results. Mendelian randomization analysis revealed several significant associations. Low-density lipoprotein cholesterol was inversely associated with gastric cancer risk (odds ratio (OR) = 0.815, 95% confidence interval (95% CI): 0.703–0.946, p < 0.01), while total cholesterol also showed a protective effect (OR = 0.790, 95% CI: 0.693–0.900, p < 0.01). Serum creatinine levels were strongly associated with a reduced risk of gallbladder cancer (OR = 0.037, 95% CI: 0.005–0.287, p < 0.01). Higher serum total protein (OR = 0.855, 95% CI: 0.777–0.940, p < 0.01) and uric acid levels (OR = 0.855, 95% CI: 0.769–0.951, p < 0.01) were associated with a reduced risk of colorectal cancer (CRC). Serum uric acid levels were also associated with a reduced risk of gastric cancer (OR = 0.822, 95% CI: 0.719–0.941, p < 0.01), but with an increased risk of pancreatic cancer (OR = 1.246, 95% CI: 1.01–1.539, p = 0.040).
Conclusions. Our findings provide causal evidence linking common metabolic blood biomarkers to site-specific GI cancer risks. These results may inform biomarker-based risk stratification and preventive strategies in oncology and public health.
Key words: cancer risk, genetic variants, gastrointestinal cancer, Mendelian randomization, metabolic blood biomarkers
Background
Gastrointestinal (GI) cancers, including gastric, colorectal, pancreatic, and gallbladder cancers, are among the leading causes of cancer-related mortality worldwide.1, 2 According to recent global cancer statistics, gastric cancer ranks 5th in incidence and 4th in mortality, while colorectal cancer (CRC) ranks 3rd and 2nd, respectively.3 These cancers have complex etiologies involving genetic, environmental, and lifestyle factors.4, 5 Gastric cancer, for instance, is influenced by Helicobacter pylori infection, dietary factors, and genetic predisposition.6 Colorectal cancer risk is associated with lifestyle factors such as diet, smoking, and physical activity, as well as genetic susceptibility.7 Pancreatic cancer, known for its poor prognosis, is influenced by smoking, chronic pancreatitis, and diabetes.8 Gallbladder cancer is associated with gallstones, chronic inflammation, and certain infections.9 The multifaceted nature of these cancers necessitates comprehensive studies to better understand their risk factors and potential preventive measures.10 Despite advances in early detection and treatment, the overall prognosis of these cancers remains poor. Identifying modifiable risk factors is essential for developing effective prevention strategies.
Circulating blood-based biomarkers have attracted increasing attention in cancer epidemiology because of their accessibility, routine clinical use, and potential mechanistic relevance. Among them, platelets – traditionally known for their role in hemostasis – have also been shown to actively promote tumor progression by releasing cytokines and growth factors that facilitate angiogenesis, immune evasion, and metastasis, particularly in GI cancers.11 These findings highlight the biological importance of systemic blood components in cancer development. In addition to cellular elements such as platelets, metabolic blood biomarkers such as low-density lipoprotein (LDL) cholesterol and total cholesterol have been linked to membrane structure, cell signaling, and modulation of the tumor microenvironment (TME).12, 13, 14 Serum creatinine and total protein reflect renal function, muscle metabolism, and nutritional status – factors known to influence cancer progression and prognosis.15, 16, 17 Uric acid, while traditionally associated with gout and metabolic disorders, has demonstrated both antioxidant and pro-inflammatory effects that may affect cancer risk in a tissue-specific manner.18, 19 However, evidence from conventional observational studies remains inconclusive because of confounding and potential reverse causation.
In parallel, the causal role of these blood biomarkers in GI cancers has not been comprehensively investigated. Previous studies have often focused on individual biomarkers or single cancer types, limiting the generalizability and comparability of the results. The 4 cancers selected in this study – gastric, colorectal, pancreatic, and gallbladder cancer – are among the most common and lethal GI malignancies worldwide. They also represent distinct anatomical and biological subtypes, providing an opportunity to assess both shared and divergent metabolic risk factors. Furthermore, high-quality genome-wide association study (GWAS) data are available for these cancers, enabling robust Mendelian randomization (MR) analyses.
Mendelian randomization is a genetic epidemiological approach that uses genetic variants as instrumental variables (IVs) to estimate the causal effect of an exposure (e.g., biomarker levels) on disease outcomes.20, 21 Previous MR studies have provided valuable insights into the relationships between various risk factors and diseases, thereby informing clinical practice and public health strategies. For instance, MR has been used to investigate the causal effects of lipid levels, inflammatory markers, and other metabolic factors on cardiovascular disease (CVD), diabetes, and different cancer types.22, 23, 24
Objectives
The present study aims to evaluate the potential causal effects of 5 clinically relevant blood metabolic biomarkers – LDL cholesterol, total cholesterol, serum creatinine, serum total protein, and uric acid – on the risk of 4 major GI cancers using a 2-sample MR approach. By integrating genetic and epidemiological data, this study seeks to provide novel insights into the metabolic determinants of GI tumorigenesis and to inform future prevention and risk stratification strategies.
Materials and methods
Data source and study design
This study adopted a 2-sample MR design to assess the causal effects of metabolic blood biomarkers on GI cancer risk. Summary-level genetic association data for exposures (LDL cholesterol, total cholesterol, serum creatinine, serum total protein, and uric acid) and outcomes (gastric, colorectal, pancreatic, and gallbladder cancers) were obtained from large-scale GWASs available through the MRC IEU Open GWAS database (https://gwas.mrcieu.ac.uk).
All data were derived from previous studies that had received ethical approval and informed consent.
Selection of genetic instruments and quality control
For each biomarker, single nucleotide polymorphisms (SNPs) strongly associated with the exposure were selected as IVs at the genome-wide significance level (p < 5 × 10⁻⁸). To ensure instrument independence, we applied linkage disequilibrium (LD) clumping at r2 < 0.001 using a 10,000-kb window. When fewer SNPs met the strict threshold, a relaxed p-value threshold of 5 × 10⁻⁶ was used while retaining LD filtering. Palindromic SNPs with intermediate allele frequencies were excluded. To ensure instrument strength, F-statistics were calculated for each SNP, and variants with F < 10 were excluded to avoid weak instrument bias. Additionally, we reported the median and range of F-statistics for each biomarker to characterize the distributional strength of the instruments. These metrics are provided in Supplementary Table 1.
Outcome GWAS inclusion criteria
Summary-level genetic association data for both exposures and outcomes were obtained from the MRC IEU Open GWAS platform. All datasets included in this study were derived exclusively from individuals of European ancestry to minimize population stratification bias. The outcome datasets included large-scale GWASs for gastric cancer (n = 476,116), CRC (n = 470,002), pancreatic cancer (n = 476,245), and gallbladder cancer (n = 907), each comprising more than 24 million SNPs, except for gallbladder cancer, which included approx. 419,000 SNPs.
The selected exposures – LDL cholesterol, total cholesterol, serum total protein, serum creatinine, and serum uric acid – were chosen based on biological plausibility and prior literature and were each associated with more than 19 million SNPs in cohorts exceeding 340,000 individuals. All GWAS datasets underwent rigorous quality control procedures, including imputation to the Haplotype Reference Consortium (HRC) panel and adjustment for population structure. Detailed dataset identifiers, sample sizes, and SNP coverage are provided in Table 1.
Statistical analyses and pleiotropy testing
The estimation of causal effects between blood cell traits and GI tumors was performed using multiple MR methodologies, including inverse variance weighted (IVW), MR-Egger, weighted median, and simple mode methods. The MR-PRESSO (Mendelian Randomization Pleiotropy RESidual Sum and Outlier) test was employed to detect and adjust for horizontal pleiotropy by identifying and excluding statistical outliers from the analysis. Heterogeneity among the selected genetic instruments was evaluated using Cochran’s Q test, with p < 0.05 indicating the absence of significant heterogeneity.25 The presence of pleiotropy was assessed using the MR-Egger intercept test, wherein a nonsignificant p-value suggested no substantial pleiotropy among the IVs. The robustness and reliability of the causal estimates were evaluated using the leave-one-out approach, which entails sequential exclusion of each IV to determine its influence on the overall results. All analyses were performed in R v. 4.2.2 (R Foundation for Statistical Computing, Vienna, Austria) using the TwoSampleMR and MR-PRESSO packages.
Results
A summary of the key causal estimates is presented in Table 2.
Gastric cancer
Mendelian randomization analysis (Figure 1) revealed that genetically predicted LDL cholesterol levels were significantly associated with a decreased risk of gastric cancer (IVW odds ratio (OR) = 0.815, 95% confidence interval (95% CI): 0.703–0.946, p < 0.01). Similarly, total cholesterol also exhibited a protective effect (IVW OR = 0.790, 95% CI: 0.693–0.900, p < 0.01). Serum uric acid was inversely associated with gastric cancer risk (OR = 0.822, 95% CI: 0.719–0.941, p < 0.01). These associations were consistent across the MR-Egger and weighted median methods, although the MR-Egger estimates had wider CIs.
Colorectal cancer
Higher serum total protein levels were associated with a reduced risk of CRC (IVW OR = 0.855, 95% CI: 0.777–0.940, p < 0.01). Serum uric acid also showed a protective effect (OR = 0.855, 95% CI: 0.769–0.951, p < 0.01) (Figure 1). The robustness of these findings was supported by MR-Egger, weighted median, and MR-PRESSO sensitivity analyses.
Pancreatic cancer
Serum uric acid levels were positively associated with pancreatic cancer risk (IVW OR = 1.246, 95% CI: 1.010–1.539, p = 0.040), contrasting with their protective role in gastric and colorectal cancer (Supplementary Fig. 1). MR-Egger and weighted median estimates demonstrated consistent directionality, although statistical significance was attenuated (weighted median p = 0.061).
Gallbladder cancer
Serum creatinine was strongly associated with a decreased risk of gallbladder cancer (IVW OR = 0.037, 95% CI: 0.005–0.287, p < 0.01), with consistent results across the MR-Egger and weighted median methods (Figure 1).
Scatter plot visualization
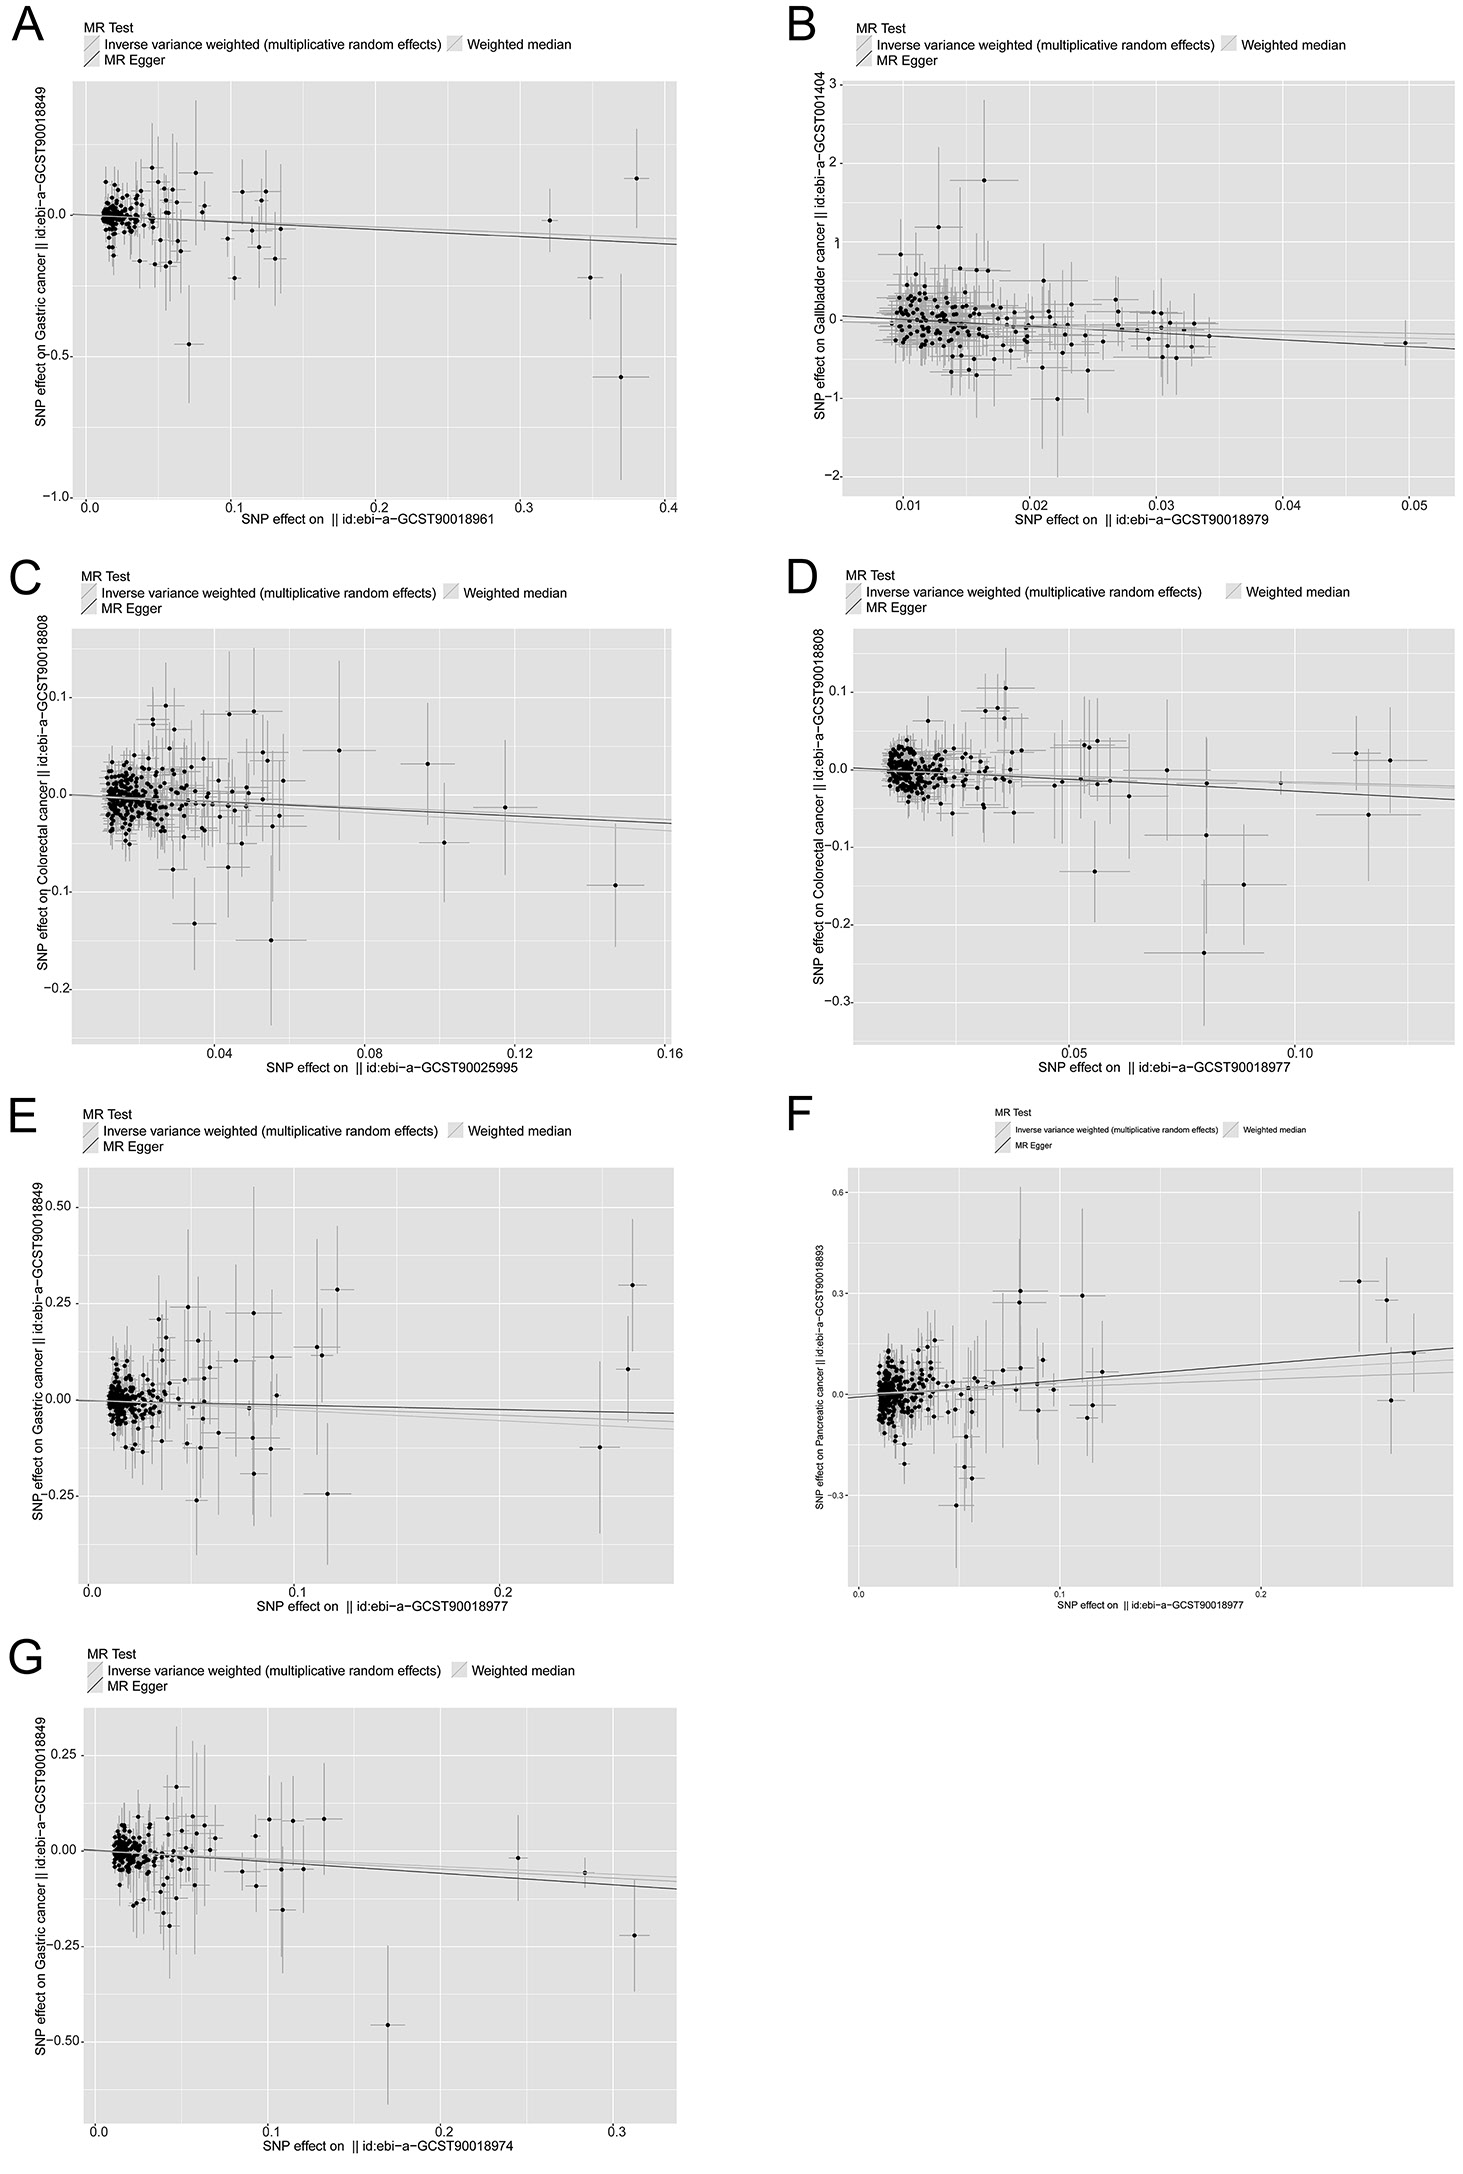
The MR scatter plots presented in Figure 2 visually support the causal estimates derived from statistical modeling. In Figure 2A,B, clear negative slopes are observed between LDL cholesterol and gastric cancer, and between serum creatinine and gallbladder cancer, respectively, indicating protective effects. Figure 2C,D shows similar inverse relationships for serum total protein and uric acid with CRC risk. In contrast, Figure 2F shows a positive slope between uric acid and pancreatic cancer, consistent with its observed risk-enhancing effect. The alignment of most SNPs along the IVW regression lines, with minimal outliers, suggests that the instrumental variables exert consistent directional effects with limited horizontal pleiotropy. These visual findings reinforce the robustness of the causal estimates obtained through MR methods.
Sensitivity and robustness
These estimates were consistent across the MR-Egger and weighted median methods, with no indication of directional pleiotropy (MR-Egger intercept p > 0.05 for all pairs). Heterogeneity testing using Cochran’s Q test showed no significant heterogeneity in most models (Q p-value > 0.05) (Table 3). MR-PRESSO analysis did not identify influential outlier SNPs, and leave-one-out analyses further supported the robustness of the results.
The F-statistics of the included instrumental variables were all above the conventional threshold (F > 10), confirming strong instrument strength. For example, in the HDL cholesterol–CRC model, 287 independent SNPs yielded F-statistics with a median of 33.86 (interquartile range (IQR): 26.72–61.65) and a range from 19.74 to 701.81 (Supplementary Table 1).
Discussion
Gastrointestinal cancers, including gastric, colorectal, pancreatic, and gallbladder cancers, are among the leading causes of cancer-related mortality worldwide.1 The etiology of these cancers is multifactorial, involving genetic predisposition, lifestyle factors, and environmental exposures.4 Despite advancements in cancer treatment, the prognosis of many GI cancers remains poor, underscoring the importance of identifying modifiable risk factors.26 This study employed MR to explore the causal relationships between blood cell traits and GI cancer risk, providing insights that could inform clinical practice and public health strategies.
The results of this study show that the protective effect of LDL cholesterol against gastric cancer, as indicated by the IVW method, may be attributed to its role in cellular processes. Low-density lipoprotein cholesterol is known to influence membrane fluidity and signaling pathways that may affect cell proliferation and apoptosis.12 Furthermore, it is involved in modulation of immune responses, which may contribute to tumor suppression.13 This finding is consistent with previous studies suggesting that certain lipid profiles may exert protective effects against specific cancers.14, 27
Serum creatinine levels showed a protective effect against gallbladder cancer. Creatinine, a breakdown product of creatine phosphate derived from muscle metabolism, has been linked to kidney function and overall metabolic health.15 Its protective role may be related to better metabolic control and lower levels of metabolic waste, thereby reducing chronic inflammation that could contribute to cancer development.28 This interpretation is supported by studies indicating that improved metabolic health may reduce cancer risk.29 Given the relatively small sample size of the gallbladder cancer cohort (n = 907), the statistical power to detect modest associations may be limited. Therefore, although the observed protective effect of serum creatinine is biologically plausible, further validation in larger datasets is warranted.
The association between serum total protein levels and a reduced risk of CRC may reflect the overall nutritional status and immune competence of individuals. Higher protein levels may enhance the body’s ability to repair DNA damage and maintain immune surveillance, which are crucial in preventing carcinogenesis.16 Similar mechanisms have been proposed in other studies linking nutritional status to cancer risk.17
Serum uric acid levels showed a dual role in cancer risk, acting as a protective factor in colorectal and gastric cancer, but as a risk factor in pancreatic cancer. This duality may stem from uric acid’s complex involvement in redox balance and inflammation. At moderate levels, uric acid may act as an antioxidant, whereas at elevated concentrations, it can promote oxidative stress and NLRP3 inflammasome activation – particularly in pancreatic tissues.18, 19, 30, 31 These microenvironmental mechanisms may help explain its divergent effects across different cancer types. Furthermore, the association between uric acid and pancreatic cancer might be partially mediated by obesity-related inflammatory pathways,32 which warrants further evaluation through multivariable MR (MVMR).
Total cholesterol levels showed a significant protective effect against gastric cancer. Cholesterol plays a role in cellular membrane integrity and signaling pathways, and its modulation may affect cancer cell behavior.33 The protective effect observed in this study aligns with previous findings suggesting that maintaining balanced cholesterol levels may contribute to cancer prevention.34
The observed associations between blood cell traits and GI cancers have significant implications for clinical practice. For instance, monitoring and potentially modifying lipid profiles, creatinine, total protein, and uric acid levels in patients could represent a strategy to mitigate cancer risk.35 The findings suggest that clinicians should consider the impact of these blood cell traits on cancer risk, especially in patients with a high predisposition to GI cancers.36 Among these associations, the strong inverse association observed between serum creatinine and gallbladder cancer highlights potential biological relevance. However, its clinical utility is limited by the low incidence of the disease and the lack of established screening strategies. Further studies are needed to confirm this association and explore its feasibility for individualized risk prediction.
Limitations of the study
Several limitations should be acknowledged. First, the scope of blood biomarkers analyzed was limited. Other potentially relevant variables such as inflammatory markers (e.g., C-reactive protein (CRP)), micronutrients (e.g., vitamin D), or liver enzymes (e.g., alanine transaminase (ALT) and aspartate transaminase (AST)) were not included because of data availability or the lack of strong genetic instruments. Second, we did not perform MVMR, which may help disentangle collinearity between closely related exposures such as LDL and total cholesterol. This should be prioritized in future studies. Third, our GWAS data were derived exclusively from individuals of European ancestry, which may limit generalizability to other ethnic groups. This is particularly relevant for cancers such as gastric and gallbladder cancer, which have higher incidence rates in Asian and South American populations. Trans-ethnic validation will be essential to establish broader applicability.
Additionally, we did not examine sex- or age-specific effects, nor did we stratify by cancer subtype (e.g., colon compared with rectal cancer), which may obscure biologically meaningful heterogeneity. Future work could incorporate stratified MR analyses to explore population-specific and tumor-specific metabolic pathways. Finally, functional validation using experimental models is needed to confirm the mechanistic pathways suggested by our findings.
While our findings suggest that certain metabolic blood biomarkers, such as LDL cholesterol and serum uric acid, may play protective roles in specific GI cancers, these biomarkers are also known risk factors for CVD, gout, and kidney dysfunction. Thus, it is essential to interpret our findings within a broader clinical context. We do not advocate artificial elevation of these biomarkers as a preventive strategy. Instead, the observed associations may reflect complex metabolic or immunological mechanisms that warrant further mechanistic investigation. Clinical interventions should always consider the balance between cancer risk and other disease burdens.
Conclusions
This study provides genetic evidence supporting causal links between selected blood metabolic traits and GI cancer risk. These results highlight new avenues for biomarker-guided screening and underscore the need for further mechanistic and translational research to translate these associations into actionable clinical tools.
Supplementary data
The supplementary materials are available at https://doi.org/10.5281/zenodo.15621795. The package contains the following files:
Supplementary Table 1. Instrumental variables for biomarkers in GI cancers.
Supplementary Fig. 1. The detailed results from the MR analysis for all identified markers and their associations with GI cancers.
Data Availability Statement
Data sharing does not apply to this article, as no new data were generated during the current study.
Consent of publication
Not applicable.
Use of AI and AI-assisted technologies
Not applicable.
.jpg)