


Abstract
Background. Breast cancer (BC) is a heterogeneous disease classified into 4 molecular subtypes, each with distinct molecular characteristics that influence treatment strategies, clinical outcomes and prognosis. These subtypes are associated with specific changes in cellular metabolism, which may play a crucial role in tumor development and progression.
Objectives. To identify distinctive serum metabolic biomarkers for each molecular BC subtype and to evaluate their associations with estrogen receptor (ER) and human epidermal growth factor 2 (HER2) receptor status, thereby refining molecular classification and informing personalized treatment strategies.
Materials and methods. The study utilized the proton nuclear magnetic resonance (1H NMR) metabolomics method to collect serum metabolic profiles from BC patients. Pattern recognition analysis was employed to analyze the metabolic data. Metabolic markers specific to each molecular subtype were selected, and Kyoto Encyclopedia of Genes and Genomes (KEGG) pathway enrichment analysis was employed to explore serum metabolic pathway heterogeneity.
Results. Distinct metabolic markers were identified for each molecular subtype, demonstrating strong discriminatory power. Additionally, we identified specific serum metabolites whose levels correlate with ER and HER2 expression profiles. The KEGG pathway analysis revealed significant heterogeneity in serum metabolic pathways across different subtypes.
Conclusions. This study demonstrates pronounced metabolic differences across BC subtypes that mirror their distinct molecular profiles and may underlie variations in therapeutic response. These metabolomic insights hold promise for refining tumor classification, improving diagnostic accuracy and guiding more personalized treatment strategies.
Key words: 1H NMR, breast cancer, molecular typing, metabolic markers
Introduction
Breast cancer (BC) is among the most common malignancies worldwide. According to the International Agency for Research on Cancer (IARC) of the World Health Organization (WHO), in 2022, BC became the most frequently diagnosed cancer globally – surpassing lung cancer – with 2.3 million new cases and nearly 665,000 deaths.1 Since the mid-2000s, the incidence of female BC has steadily increased by approx. 0.6% per year.2, 3
Breast cancer treatment has evolved dramatically over the past several decades and now encompasses a multimodal approach, including surgery combined with systemic therapies – chemotherapy, endocrine therapy and targeted agents – as well as radiotherapy. These integrated strategies have substantially improved patient survival; however, significant heterogeneity remains in treatment responses and long-term outcomes across different patient subgroups.4
Breast cancer is a heterogeneous disease classified into 4 main molecular subtypes based on the expression of estrogen receptor (ER), progesterone receptor (PR), human epidermal growth factor receptor 2 (HER2), and the proliferation marker Ki-67.5 Luminal A tumors are ER-positive, HER2-negative, have PR expression ≥20%, and Ki-67 ≤14%; luminal B tumors are also ER-positive but may be HER2-negative or -positive, with PR <20% or Ki-67 >14%; the HER2-enriched subtype is ER-negative, PR-negative and HER2-positive; and triple-negative BCs (TNBCs) lack ER, PR and HER2 expression. Clinical presentation, tumor biology and therapeutic responsiveness vary markedly across molecular subtypes,6 making subtype classification a cornerstone of treatment decision-making.7 Luminal A tumors – the most common subtype – exhibit robust responses to endocrine therapy but derive minimal benefit from chemotherapy,8 whereas luminal B cancers typically necessitate combined hormone therapy and cytotoxic chemotherapy to achieve optimal outcomes.9
HER2-positive/ER-negative tumors are often associated with aggressive, advanced disease and require targeted anti-HER2 therapies.10 Triple-negative BC, which accounts for roughly 20% of all BC, is typically more aggressive than other subtypes; it disproportionately affects younger patients, presents with poorly differentiated histology and advanced stage at diagnosis, and carries a high risk of local recurrence and distant metastasis, resulting in poorer outcomes and survival.11
The heterogeneous treatment responses across these molecular subtypes underscore the imperative for personalized therapeutic strategies. Surgical intervention is the primary therapy for early-stage disease, whereas systemic therapies are used in both adjuvant and neoadjuvant settings. Endocrine therapy continues to be the cornerstone for hormone receptor-positive BC, while HER2-targeted agents have revolutionized outcomes in HER2-positive disease, and emerging immunotherapies are showing enhanced efficacy in TNBC. Optimizing treatment approaches on the basis of each subtype is crucial for achieving the most favorable results for patients.
Metabolomics is the comprehensive characterization of small-molecule metabolites in cells, tissues, organs, and whole organisms that respond to intrinsic or extrinsic factors.12 Metabolomics, a powerful “omics” approach, has the potential to facilitate early disease detection and uncover novel therapeutic targets by profiling metabolites downstream of gene and protein activity.13 Beyond revealing biochemical alterations, it uniquely captures in vivo phenotypic changes that may be missed by genomic and proteomic analyses.
Recent metabolomic approaches have greatly improved our understanding of BC biology. TBK1-mediated metabolic processes in cancer cells have emerged as a hallmark of metabolic reprogramming, with each molecular subtype exhibiting a distinct metabolic signature.14 For example, an liquid chromatography–high-resolution mass spectrometry (LC-HRMS)-based plasma metabolomic study in BC patients revealed subtype-specific alterations in the porphyrin, chlorophyll and glycerophospholipid metabolic pathways.15 The use of metabolomics in BC has grown exponentially in recent years. These alterations in cellular metabolism have been characterized into several important pathways that are critical for BC initiation and progression.16 Enhanced aerobic glycolysis, the classic Warburg effect, is a consistent feature of aggressive BC subtypes. Metabolomic profiling has also uncovered distinctive alterations in amino acid turnover and fatty acid β-oxidation that map to specific molecular subtypes, highlighting their unique metabolic reprogramming.17
Objectives
Recent investigations have identified metabolic signatures that predict both treatment response and resistance. For instance, specific alterations in metabolic pathways have been linked to endocrine therapy resistance in hormone receptor-positive BC.18 Moreover, the combination of metabolomics with other omics data has provided new therapeutic targets and a better understanding of drug resistance.19 The metabolic features that underlie the different molecular subtypes of BC are still poorly understood, despite progress in BC treatment. We hypothesized that distinct molecular subtypes of BC have unique metabolic signatures detectable in the serum of patients and that these metabolic profiles correlate closely with the expression status of key receptors, ER and HER2. Moreover, the detection of these subtype-specific metabolic signatures may offer valuable information regarding BC biology and help guide individualized treatment initiatives.
This study aimed to reveal metabolic differences between BC patients and healthy controls and explore the biochemical pathways affected by different molecular subtypes of BC patients.
Materials and methods
Study population
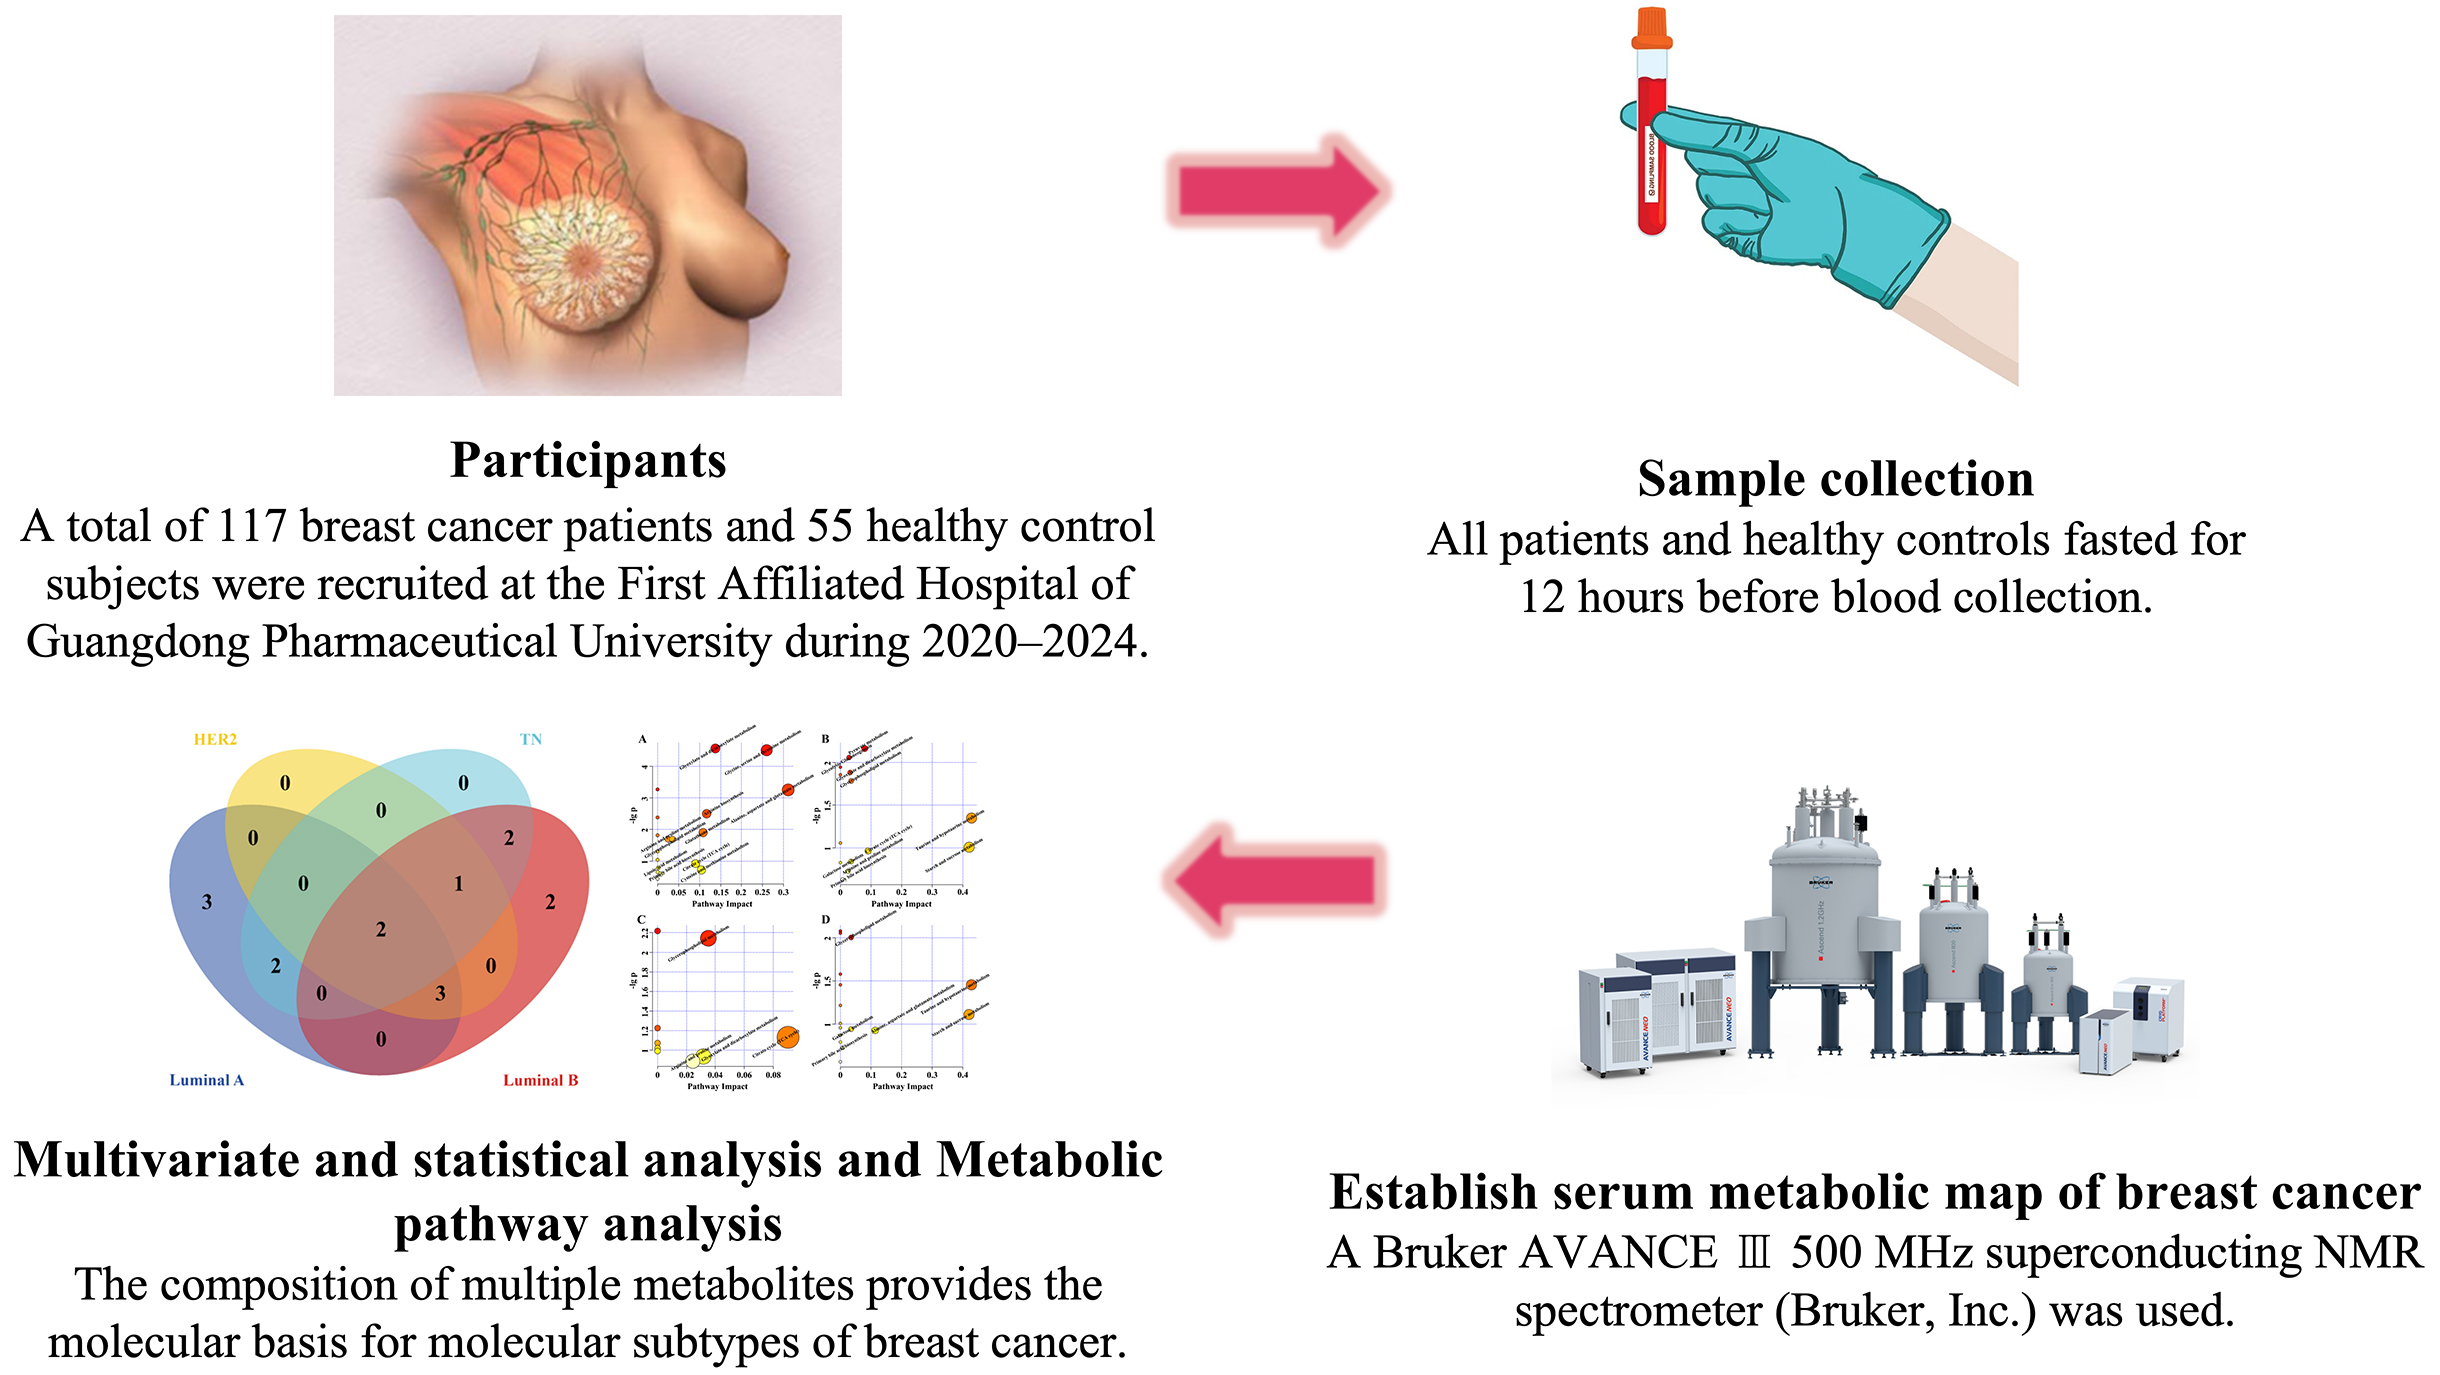
A total of 117 BC patients and 55 healthy control subjects were enrolled at the First Affiliated Hospital of Guangdong Pharmaceutical University (Guangzhou, China) between January 2020 and December 2024. Sample size was determined with power analysis (α = 0.05, power = 0.8) to ensure the detection of clinically meaningful metabolic differences.
The patient inclusion criteria were as follows: 1) histologically confirmed, newly diagnosed BC with molecular subtype determined with ER, PR, HER2, and Ki-67 status; 2) no prior oncologic treatment; and 3) absence of other malignancies or serious systemic illnesses. Healthy controls were age-matched healthy women with normal clinical examinations and no history of cancer or severe disease.
This study was approved by the Medical Ethics Committee of the First Affiliated Hospital of Guangdong Pharmaceutical University (approval No. 2022KT81).
Biological material collection and processing
Blood samples were collected from all participants after 12 h of fasting and centrifuged at 4°C at 3,000 rpm for 10 min to obtain the serum. For nuclear magnetic resonance (NMR) analysis, 300 µL of serum was mixed with 150 µL of phosphate-buffered saline (PBS) (0.2 mol/L, pH 7.4) and 100 µL of D2O in 5 mm NMR tubes after recentrifugation (3,000 rpm, 10 min, 4°C).
Assay methods and data preprocessing
High-resolution proton NMR spectra were acquired on a Bruker AVANCE III 500 MHz superconducting NMR spectrometer (Bruker Inc., Karlsruhe, Germany). The pulse sequence was Carr–Purcell–Meiboom–Gill (CPMG). Proton NMR spectra were acquired at 298 K with an echo time of 100 ms and a relaxation delay of 3 s. The spectral width was set to 10 kHz, and 128 scans were collected for each spectrum. Data were processed in TopSpin 4.1 (Bruker Inc.), where manual phase correction and baseline adjustment were performed. Chemical shifts were calibrated using the lactate methyl doublet at 1.33 ppm. Spectral integration was performed in AMIX v. 4.0.2 (Bruker Inc.) using 0.004 ppm buckets across the 0.5–9.0 ppm range. The 4.7–5.5 ppm region was excluded to remove residual water signals, and the resulting integrals were normalized to the total spectral area.
Metabolic marker selection and analysis
Previous studies have demonstrated that BC is characterized by dysregulation of key metabolic pathways, including glucose metabolism, amino acid metabolism and lipid metabolism, which together reflect hallmark features of malignancy such as the Warburg effect, altered protein synthesis and membrane lipid remodeling. The metabolic markers were identified through signals in the proton nuclear magnetic resonance (1H NMR) spectra, which represent metabolites in the serum samples. The integral data of these metabolites were used for orthogonal partial least squares discriminant analysis (OPLS-DA) analysis to distinguish between healthy controls and patients with BC. Specifically, we analyzed signals in the range of 0.5−9.0 ppm, with the integral from 4.7−5.5 ppm set to 0 to eliminate the influence of residual water signals.
Outcome measures
The study outcome measures focused on the metabolic differences between healthy controls and BC patients, as assessed through OPLS-DA. These measurements include integral data from 1H spectra obtained using NMR technology, as well as characteristic metabolites of different BC molecular subtypes analyzed via MetaboAnalyst 6.0 (http://www.metaboanalyst.ca) and the Kyoto Encyclopedia of Genes and Genomes (KEGG) database (https://www.kegg.jp) .
Statistical analyses
The processed spectral data from 172 participants (55 healthy controls, 30 luminal A, 46 luminal B, 23 HER2-positive, and 18 triple-negative (TN) patients) were analyzed using OPLS-DA in MetaboAnalyst 6.0. As an exploratory metabolomics approach, we constructed OPLS-DA models for 2 sets of comparisons. We first compared healthy controls (n = 55) with each BC molecular subtype – luminal A (n = 30), luminal B (n = 46), HER2-positive (n = 23), and TN (n = 18), and then stratified patients by receptor status and compared controls with ER-positive (n = 76), ER-negative (n = 41), HER2-positive (n = 40), and HER2-negative (n = 77) groups. Model performance was validated using 7-fold cross-validation, evaluating explained variance in the predictors (R2X), explained variance in the responses (R2Y) and the model’s predictive ability (Q2). Following OPLS-DA model construction, score plots were generated via MetaboAnalyst 6.0 for data visualization.
Potential differentially abundant metabolites were selected on the basis of variable importance in projection (VIP) scores greater than 1.0. For univariate analysis, we first tested the normality assumption via the Shapiro–Wilk test and the homogeneity of variances via Levene’s test. The discriminatory ability of different metabolite combinations between BC subtypes and healthy controls was evaluated by calculating the area under the receiver operating characteristic (ROC) curve (AUC). Venn diagrams were constructed to identify shared and unique metabolites among different BC subtypes.
Although this exploratory approach entails multiple comparisons and may increase the risk of type I errors, we applied the Benjamini–Hochberg false discovery rate correction, a more permissive method, to maximize the identification of potential metabolic alterations, defining statistical significance as an adjusted p < 0.05.
For metabolic pathway analysis, we utilized both the KEGG database (http://www.kegg.jp) and the MetaboAnalyst 6.0 online service. The KEGG analysis was performed via KEGG Mapper 2.5, with a focus on Homo sapiens pathways. In MetaboAnalyst, pathway analysis was conducted via the H. sapiens KEGG pathway library.
Pathway analysis was performed using 2 complementary methods: enrichment analysis via the hypergeometric test to identify pathways overrepresented among the differentially abundant metabolites, and topology analysis based on relative-betweenness centrality to gauge each metabolite’s network importance. Pathways with impact values greater than 0.1 and false discovery rate (FDR)-adjusted p-values below 0.05 were considered significantly altered.
Results
Clinical characteristics of patients and healthy controls
A total of 172 participants were enrolled: 55 healthy controls and 117 BC patients, stratified by molecular subtype into 30 luminal A, 46 luminal B, 23 HER2-positive, and 18 TNBC cases. Baseline demographic and clinical characteristics are summarized in Table 1.
Independent 2-tailed t-tests demonstrated no significant differences in mean age between healthy controls and each BC subtype: luminal A (t83 = 1.54, p = 0.127), luminal B (t99 = 0.33, p = 0.740), HER2-positive (t76 = 0.68, p = 0.500), or TNBC (t71 = 0.92, p = 0.361). Likewise, body mass index (BMI) did not differ significantly between controls and patients across subtypes: luminal A (t83 = 1.25, p = 0.216), luminal B (t99 = 1.50, p = 0.136), HER2-positive (t76 = 1.50, p = 0.136), or TNBC (t71 = 0.38, p = 0.703).
Serum 1H-NMR spectra pattern recognition analysis and characteristic metabolite identification
The representative serum 1H-NMR spectra from healthy controls and patients with 4 subtypes of BC are presented in Figure 1. On the basis of the Human Metabolome Database (HMDB; https://www.hmdb.ca)) and related literature reports,20, 21 24 endogenous metabolites were identified. The OPLS-DA results of the 1H-NMR data from healthy controls and patients with BC are shown in Figure 2. The score plots revealed significant metabolic differences between the serum samples of the 4 MSs and healthy controls. Metabolites with VIP ≥1 were subjected to Student’s t test, and the results are summarized in Table 2. Serum metabolic markers of the 4 MSs were subsequently screened on the basis of the VIP values and statistical analysis results. In the luminal A subtype cohort, metabolomic profiling revealed significant elevations in glutamate (t[83] = 3.49, FDR-p = 0.002), glutamine (t[83] = 5.61, FDR-p < 0.001), citrate (t[83] = 3.75, FDR-p = 0.001), phosphorylcholine/glycerophosphorylcholine (PC/GPC; t[83] = 6.46, FDR-p < 0.001), glycine (t[83] = 3.78, FDR-p < 0.001), threonine (t[83] = 4.23, FDR-p < 0.001), choline (t[83] = 6.54, FDR-p < 0.001), creatine/phosphocreatine (Cr/Pcr; t[83] = 4.70, FDR-p < 0.001), 1-methylhistidine (t[83] = 5.61, FDR-p < 0.001), and methionine (t[83] = 4.00, FDR-p < 0.001) relative to controls.
Conversely, the luminal B subgroup exhibited distinct metabolic patterns with increased lactate (t[99] = 3.37, FDR-p = 0.003) and acetate (t[99] = 4.28, FDR-p < 0.001), alongside significant reductions in citrate (t[99] = 5.27, FDR-p < 0.001), phosphorylcholine/glycerophosphorylcholine (PC/GPC) (t[99] = 7.74, FDR-p < 0.001), trimethylamine oxide (TMAO)/taurine (t[99] = 3.21, FDR-p = 0.004), taurine (t[99] = 3.94, FDR-p = 0.0008), glucose (t[99] = 4.67, FDR-p < 0.0008), choline (t[99] = 7.63, FDR-p < 0.001), Cr/Pcr (t[99]=4.07, FDR-p < 0.001), and 1-methylhistidine (t[99] = 5.34, FDR-p < 0.001) (Table 2).
HER2-positive tumors demonstrated characteristic metabolic perturbations, marked by elevated lactate (t[76] = 3.87, FDR-p < 0.001) and diminished levels of citrate (t[76] = 3.37, FDR-p = 0.003), PC/GPC (t[76] = 5.31, FDR-p < 0.001), choline (t[76] = 5.48, FDR-p < 0.001), Cr/Pcr (t[76] = 3.27, FDR-p = 0.004), and 1-methylhistidine (t[76] = 4.01, FDR-p < 0.001).
The TNBC cohort displayed the most pronounced metabolic dysregulation, featuring increased lactate (t[71] = 2.24, FDR-p = 0.043) alongside decreased concentrations of glutamine (t[71] = 2.22, FDR-p = 0.045), PC/GPC (t[71] = 3.13, FDR-p = 0.005), taurine (t[71] = 3.11, FDR-p = 0.005), glucose (t[71] = 3.02, FDR-p = 0.007), threonine (t[71] = 2.12, FDR-p = 0.043), and choline (t[71] = 3.25, FDR-p = 0.004).
Venn diagram of metabolic markers related to molecular subtypes
Figure 3 shows that choline and the phosphocholine/glycerophosphocholine (PC/GPC) ratio was significantly dysregulated across all BC subtypes. In the hormone-receptor-positive luminal A and B tumors, we additionally observed consistent alterations in citrate, creatine/phosphocreatine and 1-methylhistidine levels alongside PC/GPC and choline, reflecting a shared metabolic phenotype in endocrine-responsive cancers. However, each subtype presented distinct metabolic patterns. Luminal A is characterized by unique alterations in glutamate, glutamine, glycine, threonine, and methionine, whereas luminal B displays specific changes in lactate, TMAO, taurine, glucose, and acetate. In the HER2-enriched and TN subtypes, we observed consistent elevations in lactate alongside dysregulated choline metabolism, as evidenced by altered PC/GPC ratios and choline levels. Moreover, HER2-enriched tumors exhibited unique perturbations in citrate, creatine/phosphocreatine and 1-methylhistidine, whereas TNBC were distinguished by altered levels of glutamine, taurine, glucose, and threonine.
Diagnostic discrimination of metabolic markers related to molecular subtypes
The predictive value of metabolic markers for BC molecular subtypes was assessed through ROC curve analysis (Figure 4). For the luminal A subtype, the combined metabolite panel exhibited outstanding discrimination, with an AUC of 0.983 (95% confidence interval (95% CI): 0.918–0.997), while the subset of subtype-specific metabolites also showed strong predictive performance (AUC = 0.858; 95% CI: 0.766–0.950). For the luminal B subtype, the combined metabolite panel similarly demonstrated excellent discrimination, with an AUC of 0.967 (95% CI: 0.908–0.989), while the subtype-specific marker set achieved an AUC of 0.770 (95% CI: 0.678–0.842). Similar strong predictive performance was observed for the HER2 (AUC = 0.970; 95% CI: 0.898–0.992) and TN (AUC = 0.846; 95% CI: 0.744–0.912) subtypes.
Pathway analysis of metabolic markers related to molecular subtypes
As demonstrated in Figure 5 and Table 3, KEGG pathway enrichment of subtype-associated metabolites revealed glycerophospholipid metabolism to be a common alteration across all BC molecular subtypes. In the hormone-responsive luminal A and B subtypes, additional shared pathways included glyoxylate and dicarboxylate metabolism, the citrate (TCA) cycle, arginine and proline metabolism, and primary bile acid biosynthesis.
We found that luminal A tumors uniquely engage multiple amino acid-related pathways – namely alanine, aspartate and glutamate metabolism; glycine, serine and threonine metabolism; and arginine biosynthesis – alongside enriched glutathione metabolism as well as cysteine, methionine and lipoic acid metabolic routes. In contrast, the luminal B subtype was characterized by distinctive alterations in energy-related pathways, including taurine and hypotaurine metabolism, starch and sucrose metabolism, galactose metabolism, pyruvate metabolism, and glycolysis/gluconeogenesis. For HER2-positive tumors, the dominant metabolic signatures involved glyoxylate and dicarboxylate metabolism, the TCA cycle, and arginine and proline metabolism.
The TN subtype is characterized by involvement in primary bile acid biosynthesis; alanine, aspartate and glutamate metabolism; taurine and hypotaurine metabolism; starch and sucrose metabolism; and galactose metabolism.
Serum metabolic markers related to ER and HER2 receptor expression
To assess how ER and HER2 receptor status shapes the metabolic landscape in BC, we applied OPLS-DA to the serum metabolomic profiles of patients stratified by ER and HER2 expression. Metabolites with high VIP scores and statistically significant differences according to t-test were deemed differentially abundant (Figure 6; Table 4). With respect to ER status, glutamine, citrate, the PC/GPC ratio, the TMAO/taurine ratio, choline, creatine/phosphocreatine, and 1-methylhistidine were consistently dysregulated between ER-positive and ER-negative groups (Figure 7). Some metabolites were uniquely altered by group: Taurine, glucose and creatinine were specific to the ER-positive group, and lactate was unique to the ER-negative group. Similarly, common metabolic changes in the HER2-positive and HER2-negative groups, including glutamine, citrate, PC/GPC, TMAO/taurine, choline, creatine/Pcr, and 1-methylhistidine, were observed for HER2 receptor status. Changes specific to groups were observed: valine was specific for the HER2-positive group, and lactate, taurine and glucose were specific for the HER2-negative group.
ER and HER2 receptor-related metabolomic pathway analysis
The functions and biological pathways predicted and significantly enriched by the KEGG pathway analysis are presented in Figure 8 and Table 5, which indicate the metabolic pathways related to ER and HER2 receptor status in BC patients. In ER-luminal patients, the most significantly enriched pathways were taurine and hypotaurine metabolism; starch and sucrose metabolism; alanine, aspartate and glutamate metabolism; the citrate cycle; glycerophospholipid metabolism; galactose metabolism; glyoxylate and dicarboxylate metabolism; arginine and proline metabolism; and primary bile acid biosynthesis. Estrogen receptor-negative patients presented similar pathway enrichment patterns, except that taurine and hypotaurine metabolism, starch and sucrose metabolism, galactose metabolism, and primary cholic acid biosynthesis were not significantly affected in this group. The top enriched pathways for HER2-positive individuals were alanine, aspartate and glutamate metabolism; the citrate cycle; glycerophospholipid metabolism; glyoxylate and dicarboxylate metabolism; and arginine and proline metabolism. The HER2-negative patients included all the pathways detected in the HER2-positive patients, with further enrichment in taurine and hypotaurine metabolism, starch and sucrose metabolism, galactose metabolism, and primary bile acid biosynthesis.
Discussion
Breast cancer exhibits pronounced molecular heterogeneity, which critically influences both therapeutic response and prognosis. Current molecular classification hinges on immunohistochemical assessment of ER, PR, HER2, and Ki-67; however, intratumoral heterogeneity means that biopsy specimens may not fully capture the complexity of the entire tumor. Metabolomics has recently emerged as a powerful tool for probing the tumor microenvironment – an important determinant of disease progression and treatment efficacy.22 By profiling dynamic fluctuations in metabolites, this approach integrates information on tumor biology, genetic alterations and environmental exposures, offering a more comprehensive view of cancer behavior than static tissue markers alone.
In this study, we investigated the serum metabolic profiles of 4 molecular subtypes of BC patients and compared them with those of healthy controls, confirming that the identified metabolic signatures can discriminate among subtypes with high predictive performance. Receiver operating characteristic curve analyses confirmed that these serum metabolic signatures exhibited excellent discriminatory and predictive performance for molecular typing. Moreover, we discovered metabolic markers linked to ER and HER2 receptor status, revealing varying metabolic profiles between the receptor-positive and receptor-negative cohorts. Pathways related to energy metabolism, amino acid metabolism and phospholipid metabolism were significantly different in terms of the metabolic heterogeneity of each BC subtype.
The 4 molecular subtypes presented different metabolite compositions. Distinct metabolic signatures were identified for each subtype as promising biomarkers. Previous studies have shown that serum levels of amino acids in less aggressive luminal A cancers are lower than those in more aggressive TNBCs.23, 24 Our results corroborate these reports, as the luminal A-specific metabolic alterations mainly included amino acids, indicating subtype-specific amino acid metabolism.
Importantly, excessive acetate accumulation was specifically observed in luminal B patients, suggesting a disturbance in the level of acetate-acetyl-CoA conversion. All 4 subtypes had decreased glucose levels and increased lactate levels, with HER2-positive tumors having the greatest increase in lactate. This finding is consistent with our recent work showing an increased Warburg effect in HER2-positive BC cells,25, 26 emphasizing the metabolic heterogeneity between molecular subtypes.
Common alterations in phospholipid metabolism, particularly with respect to PC/GPC and choline, were present across all subtypes. Other studies have shown similar phenomena in several types of cancer, implying that phospholipid metabolism plays a vital role in cancer development.27, 28, 29 Notably, BC cells showed reduced ^13C-labeled choline and phosphocholine levels relative to normal mammary epithelial cells, suggesting an enhanced metabolic flux from membrane phosphatidylcholine toward free choline and phosphate in malignancy.30
In luminal BC, we identified 7 metabolic pathways that were uniquely and highly enriched: glycine, serine and threonine metabolism; arginine biosynthesis; glutathione metabolism; cysteine and methionine metabolism; lipoic acid metabolism; pyruvate metabolism; and glycolysis/gluconeogenesis.
Tumors stratified by ER status (luminal vs non-luminal) exhibited distinct metabolic signatures, with significant enrichment in pathways such as starch and sucrose metabolism, protocholic acid biosynthesis, taurine and hypotaurine metabolism, and galactose metabolism.
However, hormone receptor-positive BC cells are typically more differentiated and exhibit higher levels of proliferation-associated metabolites than hormone receptor-negative TNBC cells.31, 32, 33 We also identified distinct metabolite accumulation patterns in HER2-positive BC patients compared to healthy controls, implicating pathways such as glycerophospholipid metabolism, glyoxylate and dicarboxylate metabolism, the TCA cycle, and arginine and proline metabolism. Notably, these same pathways were enriched in luminal B tumors, likely reflecting the subset of luminal B cancers that co-express HER2 and thus share similar metabolic phenotypes.34
The serum metabolic characteristics of these molecular subtypes may provide a noninvasive diagnostic tool to complement immunohistochemical typing, especially when tumor tissue is limited or heterogeneous. These findings indicate that our subtype-specific metabolic signature can be used for targeted therapy development, e.g., by targeting amino acid metabolism in luminal subtypes and inhibiting the glycolysis pathway in HER2-positive patients. Furthermore, longitudinal profiling of these metabolic biomarkers may enable real-time monitoring of therapeutic response and disease trajectory, facilitating the early detection of emerging drug resistance or tumor recurrence. Markers correlated with ER and HER2 status may also predict responsiveness to endocrine or HER2-targeted therapies, enabling more personalized treatment strategies.
Interestingly, we observed a strong overlap between the metabolic pathways distinguishing HER2-positive from HER2-negative patients and those differentiating ER-positive from ER-negative cases; notably, these shared pathways include starch and sucrose metabolism, primary bile acid biosynthesis, taurine and hypotaurine metabolism, and galactose metabolism. This novel finding indicates potential crosstalk between receptor signaling and metabolic regulation,35 which needs to be further investigated at the molecular level.
Limitations
Despite these promising results, several limitations warrant consideration. First, our relatively small, single-center cohort limits statistical power and the generalizability of our findings to broader patient populations. Second, the cross-sectional design prevents us from drawing causal inferences about how metabolic alterations evolve with disease progression or in response to therapy; longitudinal sampling would be required to capture these dynamics. Third, although we detected a wide range of metabolites, current analytical platforms may have missed other relevant compounds, and the high cost of metabolomic assays poses practical challenges for large-scale validation. Finally, unmeasured confounders, such as variations in diet, concomitant medications and comorbid conditions, were not fully controlled and could have influenced the observed metabolic signatures. Future studies should address these issues by enrolling larger, multicenter cohorts, incorporating longitudinal designs and standardizing preanalytical variables to confirm and extend our findings.
Conclusions
In this study, we utilized 1H NMR metabolomics to identify serum metabolic signatures in patients with various molecular subtypes of BC. Through comprehensive metabolomic profiling, we explored the distinct metabolic features and pathways linked to each subtype, as well as the relationship between serum metabolites and the expression levels of ER and HER2 receptors. Our findings contribute to a deeper understanding of subtype-specific metabolic reprogramming in BC and may help uncover novel biomarkers for molecular-based classification.
Our analysis identified distinct serum metabolomic signatures corresponding to BC molecular subtypes and receptor profiles, demonstrating metabolomics’ promise as a noninvasive tool for tumor classification. These subtype-specific metabolic patterns offer complementary insights to conventional diagnostics and could guide the personalization of therapy. The markers we describe warrant further validation for enhancing patient stratification and optimizing treatment selection.
The next steps toward clinical translation include validating these metabolic markers in larger, multicenter cohorts, establishing population-specific cutoff values, and assessing their ability to predict treatment response in prospective clinical trials. Ultimately, metabolic profiling could offer powerful, noninvasive insights for BC diagnosis, real-time treatment monitoring, and the identification of novel therapeutic targets, thereby enriching patient care.
Data Availability Statement
The datasets generated and analyzed during the current study are publicly available in the Figshare repository at https://figshare.com/s/1af283918b208d404822 (doi:10.6084/m9.figshare.30073258).
Consent for publication
Not applicable.
Use of AI and AI-assisted technologies
Not applicable.
.jpg)
.png)
-pop.jpg)
.jpg)
.png)

.jpg)
.png)