


Abstract
Background. Diabetic kidney disease (DKD) is closely related to autophagy and inflammation. The mTOR/unc-51 like autophagy activating kinase 1 (ULK1) signaling axis is involved in the regulation of autophagy. Ultrashort wave (USW) therapy has been extensively studied in inflammatory diseases. However, the therapeutic effect of USW on DKD and the role of the mTOR/ULK1 signaling axis in USW interventions remain uncertain.
Objectives. This study aimed to explore the therapeutic effects of USW on DKD rats and the role of the mTOR/ULK1 signaling axis in USW interventions.
Materials and methods. A DKD rat model was established using a high-fat diet (HFD)/sugar diet and streptozocin (STZ) induction. The optimal duration of USW intervention was determined using different USW treatments. The levels of metabolism, inflammation and fibrosis associated with kidney injury in rats were measured. Western blot analysis was performed on the related indexes of autophagy and the mTOR/ULK1 signaling axis.
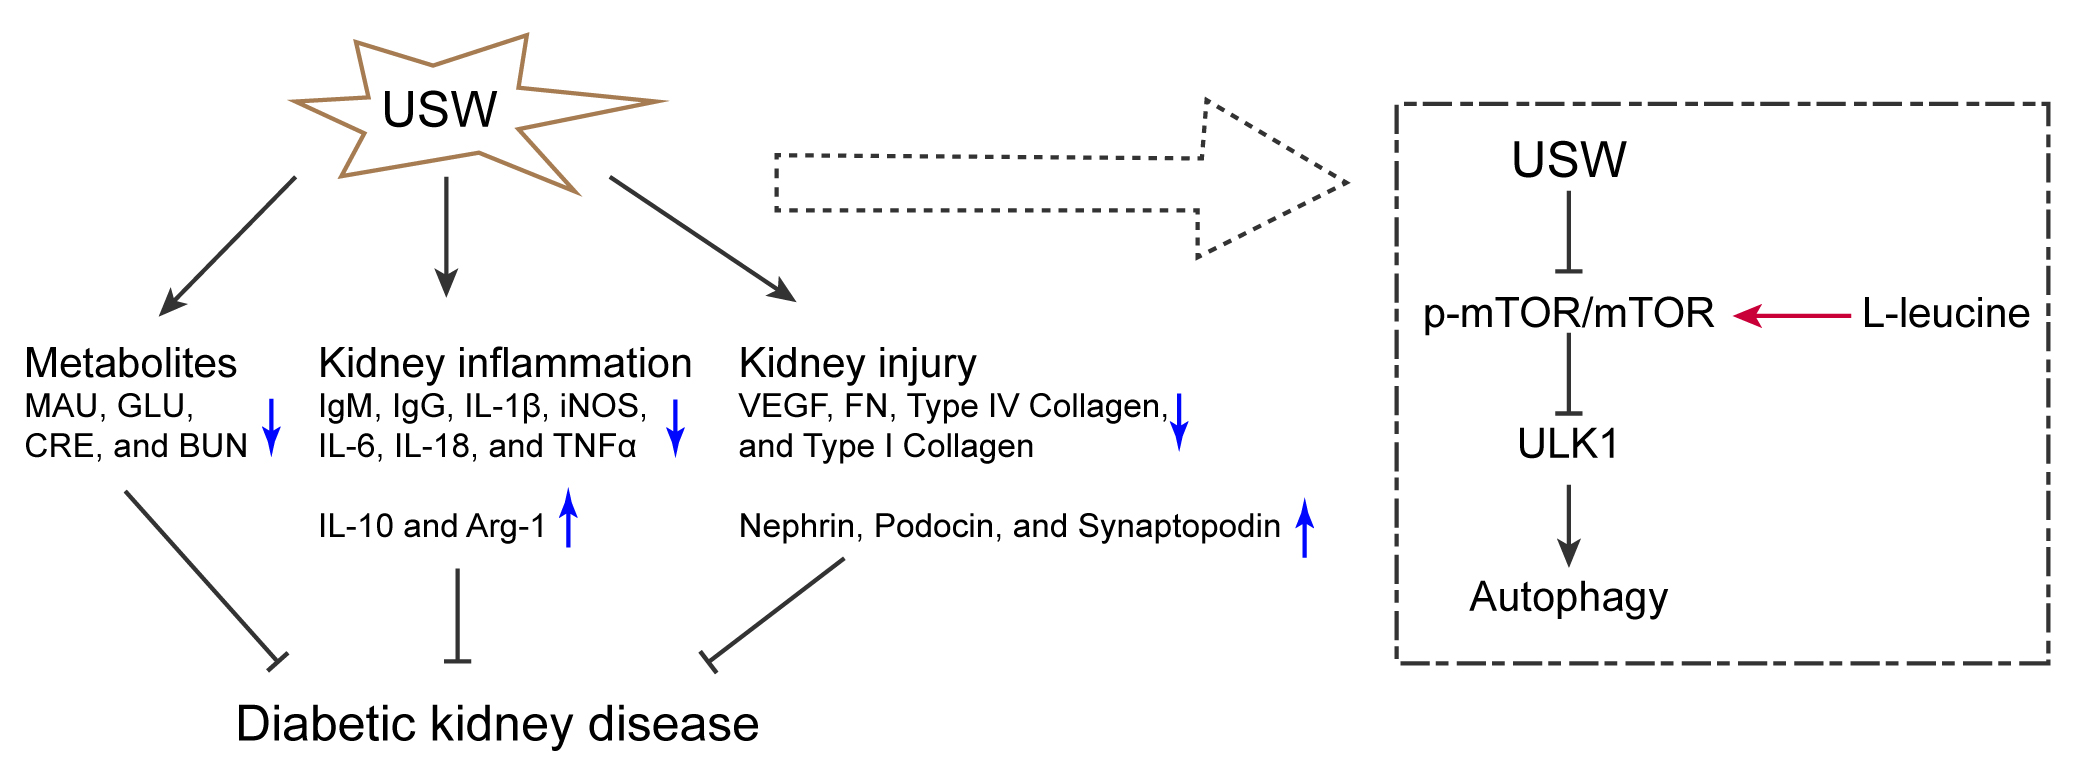
Results. In DKD rats, microalbuminuria (MAU), glucose (GLU), creatinine (CRE), and blood urea nitrogen (BUN) levels decreased after the USW intervention. Levels of interleukin (IL)-1β, inducible nitric oxide synthase (iNOS), immunoglobulin M (IgM), immunoglobulin G (IgG), IL-18, tumor necrosis factor alpha (TNF-α), and IL-6 decreased in the USW group compared to the model group. The IL-10 and arginase (Arg-1) levels were increased in the USW group. The content of fibrosis-related indexes (vascular endothelial growth factor (VEGF), fibronectin (FN), type IV collagen, and type I collagen) decreased in the urine of the DKD rats. After USW treatment, LC3B and Beclin1 levels increased, while the level of p62 decreased. The levels of nephrin, podocin and synaptopodin increased. Ultrashort wave could reduce p-mTOR/mTOR ratios and increase ULK1 expression. After the overexpression of ULK1, the levels of LC3B and Beclin1 were higher in the overexpression (oe)-ULK1 group than in the oe-negative control (NC) group, while the level of p62 decreased. After mTOR activation, LC3B and ULK1 expression decreased, while CRE, BUN, MAU, and GLU levels increased.
Conclusions. Ultrashort wave alleviated kidney injury induced by the HFD/sugar diet and STZ. The USW intervention reversed the decreased autophagy levels in the DKD rats. The mTOR/ULK1 signaling axis mediated USW to promote autophagy.
Key words: inflammation, autophagy, ultrashort wave (USW), diabetic kidney disease (DKD), mTOR/ULK1 signaling axis
Background
Diabetic kidney disease (DKD) is a common complication of diabetes and the main cause of end-stage renal disease (ESRD).1 The main features of DKD include glomerular basement membrane thickening, podocyte apoptosis, interstitial inflammatory infiltration, and renal interstitial fibrosis.2 The pathogenesis of DKD involves blood glucose (GLU),3 inflammation3 and autophagy.4 At present, the treatment of DKD mainly focuses on renal replacement therapy in terms of kidney dialysis and kidney transplantation, as well as drug therapy related to the control of blood GLU, blood pressure and the renin–angiotensin system.5, 6 While these treatments can alleviate patients’ symptoms, they place a tremendous economic burden on them.7 Therefore, there is still a need for new treatments.
Ultrashort wave (USW) therapy is a method in which ultrahigh-frequency alternating current is applied to the body to exert therapeutic effects. Low-dose USW has been shown to effectively treat various types of acute inflammation.8, 9 A previous study showed that USW could improve spinal cord injuries in a spinal cord injury model of rats established using the Allen method.9 Ultrashort wave also reduced neuroinflammation in spinal cord injury rat models.10 In rabbit models of compression injury, USW accelerated peripheral nerve regeneration.11 In a study of chronic knee osteoarthritis, USW reduced the level of inflammatory factors and improved knee function.12 It alleviated lipopolysaccharide-induced acute lung injury by reducing immune cell infiltration and inflammatory cytokine levels.13 Our previous study showed that USW has a protective effect on cerebral ischemia–reperfusion injury in rats.14 However, whether USW has a therapeutic effect on DKD remains unclear.
Autophagy is essential in maintaining the integrity of podocytes, and the induction of autophagy can serve as the main protective mechanism against glomerular injury.15, 16, 17 One study showed that the pathogenesis of DKD is related to impaired autophagy.4 Yang et al. found that activating autophagy attenuates DKD development in mice.18 Therefore, autophagy can be used as an important indicator in the development of DKD. Therapeutic strategies targeting autophagy may serve as a potential developmental direction for alleviating DKD. The mTOR, a serine/threonine-protein kinase in the PI3K-related protein kinase family, constitutes the mTOR complex 1 (mTORC1) that affects autophagy.19, 20 The mTOR is involved in the regulation of multiple functional mechanisms within cells, including mitochondrial energy production,21, 22 inflammation,23, 24 autophagy,25, 26, 27 and immune responses.28 The mTOR signaling affects the development of a variety of diseases through its involvement in autophagy, including neurocognitive impairment,29 chronic heart failure,30 spinal cord injury,31 and osteoarthritis.32 In DKD, attenuating mTOR signaling to activate autophagy may play a protective role.18 One study showed that mTOR could affect autophagy by regulating the phosphorylation level of unc-51 like autophagy activating kinase 1 (ULK1).33 Other studies have shown that the mTOR/ULK1 signaling axis is involved in the process of autophagy in cells.34, 35, 36 Thus, we focused on the mTOR/ULK1 signaling axis in DKD.
Objectives
This study aimed to explore the therapeutic effects of USW on DKD rats and the role of the mTOR/ULK1 signaling axis in USW interventions.
Materials and methods
Ethics statement
All experimental protocols were reviewed and received approval from the Institutional Animal Care and Use Committee (IACUC) of the Second Xiangya Hospital of Central South University (Changsha, China; approval No. 2021612). The experimental process strictly followed the approved protocol. We made significant efforts to minimize animal suffering.
Animal experiments
Fifty-five male Sprague Dawley rats with a body weight of 235 ±15 g were purchased from Human SJA Laboratory Animal Co., Ltd. (Changsha, China). The rats were housed under conditions of 22–24°C and a 12-hour light/dark cycle with a normal diet and water for 7 days. The model rats received a high-fat diet (HFD)/sugar diet, including 29.4% sugar, 20% protein, 45% fat, and 35% carbohydrate, that delivered 22.0 MJ/kg of energy.37 After 4 weeks, 50 mg/kg streptozocin (STZ; Sigma-Aldrich, St. Louis, USA) in 0.05 mol/L citrate buffer (pH = 4.5) was injected intraperitoneally in rats.38 The model rats were fasted the night before STZ induction. The blood GLU concentrations were measured after STZ injection for 3 days. Rats with blood GLU levels higher than 16.7 mmoL/L and with significant microalbuminuria (MAU) were considered successful DKD modeling. The control rats received a normal diet and were injected with citrate buffer.
To study the optimal treatment time for USW, the rats were randomly divided into 7 groups (n = 5 in each group): a control group, a model group, a USW3 group, a USW5 group, a USW10 group, a USW20 group, and a metformin (MET) group. An Ultrashort Wave Electrotherapy Machine (DL-CII) was purchased from Shantou Medical Equipment Factory Co., Ltd. (Shantou, China). The rats were anesthetized with pentobarbital sodium 50 mg/kg intravenously. After stabilization, the 2 electrodes of the USW therapeutic instrument were placed on opposite sides of the rat’s abdomen, approx. 0.5–1 cm away from the skin. The diameter of the circular electrodes was 12 cm. The first gear output was selected, and the power was 10 W. Rats in the USW3 group were treated for 3 min, USW5 for 5 min, USW10 for 10 min, and USW20 for 20 min. Ultrashort wave treatment was performed once daily for 3 weeks. The MET group was used as the positive control group. Metformin (Yuanye Bio-Technology, Shanghai, China) was dissolved in distilled water, and the rats were administered 250 mg/kg/day of MET intragastrically for 21 days.39 The rats in the control, model and MET groups were given sham applications of electrotherapy under general anesthesia. The MAU and blood GLU levels were determined at 0, 7, 14, and 21 days. The creatinine (CRE) and blood urea nitrogen (BUN) levels were evaluated to determine the optimal USW intervention time.
To investigate the regulatory pathway of USW in alleviating DKD, 20 more rats were randomly divided into 4 groups (n = 5 in each group): a control group, a model group, a USW group, and a USW+L-leucine group. The control, model and USW groups were treated as described above. L-leucine (0.45 g/kg/day; Yuanye Bio-Technology), an activator of mTOR, was injected intraperitoneally into the rats,40 and USW treatment was performed in the USW+L-leucine group rats.
After 21 days of USW treatment, all rats were euthanized with an intraperitoneal injection of 150 mg/kg pentobarbital sodium. Kidney, urine and blood samples were collected for further experiments.
Enzyme-linked immunosorbent assay
Fresh urine and blood samples were collected. Rat enzyme-linked immunosorbent assay (ELISA) kits for GLU (A154-1-1), CRE (C011-2-1) and BUN (C013-2-1) were purchased from the Nanjing Jiancheng Bioengineering Institute (Nanjing, China). The ELISA kits for MAU (CSB-E12991r), interleukin (IL)-1β (CSB-E08055r), IL-10 (CSB-E04595r), inducible nitric oxide synthase (iNOS; CSB-E08325r), immunoglobulin G (IgG; CSB-E07981r), immunoglobulin M (IgM; CSB-E07978r), type I collagen (CSB-E08084r), type IV collagen (CSB-E08883r), fibronectin (FN; CSB-E04553r), and vascular endothelial growth factor (VEGF; CSB-E04757r) were purchased from CUSABIO (Wuhan, China). The MAU, IgG, IgM, type I collagen, type IV collagen, FN, and VEGF levels were determined in the rats’ urine. The GLU, CRE, BUN, IL-1β, IL-10, and iNOS levels were measured in the rats’ serum, according to the manufacturer ‘s instructions.
Western blot
Proteins from renal tissue, rat renal proximal tubular epithelial cells (RRPTEpiC) and podocyte cells were extracted using radioimmunoprecipitation assay (RIPA) lysate and separated with 10% sodium dodecyl sulfate-polyacrylamide gel electrophoresis (SDS-PAGE). The proteins were then transferred onto nitrocellulose membranes. Phosphate-buffered saline with Tween (PBST) was used to prepare 5% skim milk. The membranes were blocked with skim milk at 4°C overnight. The primary and secondary antibodies were incubated for 90 min each. Electrochemiluminescence (ECL) working fluid was added to the nitrocellulose membrane. The blots were visualized using a ChemiScope 6000 chemiluminescence imaging system (CLiNX, Shanghai, China). The primary antibodies were as follows: IL-1β (1:1000, ab254360), IL-18 (1:1000, ab243091), tumor necrosis factor alpha (TNF-α; 1:1000, ab205587), IL-6 (0.5 μg/mL, ab9324), IL-10 (0.2 μg/mL, ab271261), arginase (Arg-1; 1:1000, ab91279), LC3 (1:2500, 14600-1-AP), Beclin1 (1:1000, 11306-1-AP), p62 (1:1000, 18420-1-AP), nephrin (1:1000, ab216341), podocin (1:1000, 20384-1-AP), synaptopodin (1:1000, 21064-1-AP), p-mTOR (1:1000, 67778-1-Ig), mTOR (1:25000, 66888-1-Ig), ULK1 (1:1000, 20986-1-AP), β-actin (1:5000, 60008-1-Ig), horseradish peroxidase (HRP) goat anti-mouse IgG (1:5000, SA00001-1), and HRP goat anti-rabbit IgG (1:6000, SA00001-2). The IL-1β, IL-18, TNF-α, IL-6, IL-10, Arg-1, and nephrin were purchased from Abcam (Cambridge, UK), while LC3, Beclin1, p62, podocin, synaptopodin, p-mTOR, mTOR, ULK1, β-actin, HRP goat anti-mouse IgG, and HRP goat anti-rabbit IgG were obtained from Proteintech (Wuhan, China). The expression of β-actin was used as a loading control.
Quantitative real-time polymerase chain reaction
The RNA was extracted from the rat renal tissues and cells using the Trizol method. The RNA was reversely transcribed into cDNA using a HiFiScript cDNA Synthesis Kit (CW2569M; CWBIO, Beijing, China). Polymerase chain reaction (PCR) amplification was performed using SYBR-Green PCR Master Mix (CW2601S; CWBIO). The 2−ΔΔCt was performed to calculate the RNA levels. The primers are listed in Table 1. The expression of β-actin was applied as an endogenous control.
Hematoxylin and eosin staining
The rats were sacrificed and renal tissues were immediately collected. The kidney tissues were fixed, embedded and cut into 5-μm sections. The sections were deparaffinized with xylene. Ethanol gradients were used for rehydration. After washing the sections, hematoxylin solution was used to stain for 5 min. The eosin solution was applied to counterstain for 1 s. Ethanol gradients (95–100%) were applied to dehydrate, and xylene was used to treat the sections. The sections were sealed and observed under a light microscope (model BA210T; Motic, Xiamen, China).
Masson staining
After fixation and embedding, rat renal tissue was cut into 5-μm sections. Masson staining was performed according to the instructions of the Masson staining kit (Wellbio, Changsha, China).The kidney sections were stained with Weigert’s iron hematoxylin staining solution for 5 min. Ponceau S working solution was applied to the sections for 2 min. The sections were differentiated with phosphomolybdic acid n-hydrate solution for 30 s and stained with blue aniline solution for 8 min. After the sections were rinsed and mounted, the rat kidney tissues were examined with a light microscope (model BA210T).
Flow cytometry
The rat kidney tissues were isolated, and a cell suspension was prepared. Cells were stained with 5 μL annexin V-FITC (KGA1030-100; KeyGEN BioTECH, Nanjing, China) and 5 μL propidium iodide (PI) for 10 min in the dark. Cell apoptosis was detected using a flow cytometer (Beckman Coulter, Brea, USA).
Cell culture and treatment
Rat renal tubular epithelial cells (Shanghai Zhong Qiao Xin Zhou Biotechnology Co., Ltd., Shanghai, China) were cultured using the iCell Primary Epithelial Cell Culture System (iCell Bioscience, Shanghai, China). Rat podocyte cells (Procell, Wuhan, China) were cultured using the iCell Primary Renal Podocyte Culture System (iCell Bioscience). The cells were cultured at 37°C and 5% CO2.
To explore the effect of ULK1 on autophagy in RRPTEpiC and podocyte cells, 4 groups were set up (n = 5 in each group): a control group, a model group, an overexpression (oe)-ULK1 group, and an oe-negative control (NC) group. The oe-NC and oe-ULK1 plasmids were purchased from Abiowell Biotechnology Co., Ltd. (Changsha, China). A DKD cell model induced by high glucose (HG) was constructed as previously described.41 The oe-NC and oe-ULK1 plasmids were transfected into cells using Lipofectamine 2000 (Invitrogen, Carlsbad, USA). After 24 h, the cells were treated with 30 mmol/L glucose in the oe-NC and oe-ULK1 groups. The cells in the control group did not undergo any intervention.
Statistical analyses
Data were presented as mean ± standard deviation (M ±SD). Statistical analyses were carried out using SPSS v. 18.0 (SPSS Inc., Chicago, USA) and GraphPad Prism v. 8.0.1 (GraphPad Software, San Diego, USA) software. The Shapiro–Wilk test and exploratory descriptive statistics test were adopted to analyze data distribution for normality and homogeneity of variance (Supplementary Tables 1–6). One-way analysis of variance (ANOVA) and two-way ANOVA were performed to compare data between multiple groups. Tukey’s post hoc test was applied. The value of p < 0.05 was considered statistically significant.
Results
USW intervention improved DKD metabolism
To explore whether USW has therapeutic effects on DKD rats, we treated them with USW. The concentrations of MAU in urine and GLU in serum were measured at 0, 7, 14, and 21 days. The ELISA results showed that urinary MAU (treatment: p < 0.05, ANOVA, F = 609.6; time: p < 0.05, ANOVA, F = 507.2) and blood GLU (treatment: p < 0.05, ANOVA, F = 496.3; time: p < 0.05, ANOVA, F = 1106.0) concentration decreased in the USW group compared to the model group (Figure 1A,B). Serum CRE (p < 0.05, ANOVA, F = 26.47) and BUN (p < 0.05, ANOVA, F = 144.8) concentrations decreased after USW treatment (Figure 1C). There was no obvious difference between the USW10, USW20 and MET groups, but a clear therapeutic effect was observed. Therefore, USW10 was used for the following experiments.
USW inhibited the inflammatory response in DKD rats
Next, we measured the level of inflammation in the DKD rats. The concentrations of IL-1β, IL-10 and iNOS in the serum changed (Figure 2A). The IL-1β (p < 0.05, ANOVA, F = 59.88) and iNOS (p < 0.05, ANOVA, F = 841.3) decreased after USW treatment compared to the model group. The IL-10 concentration (p < 0.05, ANOVA, F = 201.3) increased in the USW group. After USW intervention, the IgM (p < 0.05, ANOVA, F = 63.33) and IgG (p < 0.05, ANOVA, F = 55.0) levels in the urine decreased. (Figure 2B). These results suggest that USW could inhibit the development of inflammation in DKD rats to some extent. At the gene and protein levels, IL-1β (p < 0.05, ANOVA, F = 174.0), IL-18 (p < 0.05, ANOVA, F = 128.3), TNF-α (p < 0.05, ANOVA, F = 120.8), and IL-6 (p < 0.05, ANOVA, F = 158.6) levels were decreased in the USW group compared with the model group (Figure 2C,D). The IL-10 (p < 0.05, ANOVA, F = 111.4) and Arg-1 (p < 0.05, ANOVA, F = 113.0) levels were increased in the DKD rats. This further suggests that USW could relieve kidney inflammation in DKD rats.
USW alleviated kidney injury in DKD rats
Pathological examination was performed on the renal tissues of the DKD rats. The hematoxylin and eosin (H&E) staining results showed that the renal tissue of the DKD rats had obvious glomerular hypertrophy, basement membrane thickening and renal tubule dilatation. Ultrashort wave alleviated these abnormalities to some extent (Figure 3A). In the DKD rats, renal structural lesions led to abnormal protein content of VEGF, FN, type IV collagen, and type I collagen in the urine.42 The USW intervention decreased VEGF (p < 0.05, ANOVA, F = 168.2), FN (p < 0.05, ANOVA, F = 179.7), type IV collagen (p < 0.05, ANOVA, F = 173.2), and type I collagen (p < 0.05, ANOVA, F = 30.0) levels in the urine (Figure 3B). Renal interstitial fibrosis is a typical pathological feature of DKD. Masson staining showed that USW could reduce renal interstitial fibrosis in the DKD rats (Figure 3C). The renal tissue apoptosis rate of the DKD rats was also significantly reduced after USW treatment (p < 0.05, ANOVA, F = 8207; Figure 4A). Nephrin and podocin are key glomerular proteins. Nephrin, podocin and synaptopodin levels were detected using the western blot method (Figure 4B). The results showed that nephrin (p < 0.05, ANOVA, F = 117.4), podocin (p < 0.05, ANOVA, F = 71.47) and synaptopodin (p < 0.05, ANOVA, F = 175.9) were increased in the USW group compared to the model group. Considering the above experimental results, USW alleviated kidney injury in the DKD rats to a certain extent.
USW alleviated the autophagy decrease induced by HFD/STZ and affected the mTOR/ULK1 signaling axis
Next, we verified the expression of the autophagy-related indicators (LC3, Beclin1 and p62) using quantitative real-time polymerase chain reaction (qPCR) and western blot (Figure 5A, B). The LC3 (mRNA: p < 0.05, ANOVA, F = 150.9; protein: p < 0.05, ANOVA, F = 233.0) and Beclin1 (mRNA: p < 0.05, ANOVA, F = 181.3; protein: p < 0.05, ANOVA, F = 124.8) levels were increased in the USW group compared to the model group. The p62 (mRNA: p < 0.05, ANOVA, F = 373.0; protein: p < 0.05, ANOVA, F = 271.7) levels were reduced in the USW group. Protein expressions of p-mTOR, mTOR and ULK1 were measured using western blot (Figure 5C). Compared with the model group, the ratio of p-mTOR/mTOR (p < 0.05, ANOVA, F = 331.9) decreased in the USW group, and the ULK1 level (p < 0.05, ANOVA, F = 28.5) increased. This hinted that USW treatment could restore the level of renal autophagy and affect the mTOR/ULK1 signaling axis in DKD rats.
ULK1 signaling affected autophagy injury induced by HG
To explore the effect of ULK1 on autophagy in DKD cells, we overexpressed ULK1 in RRPTEpiC and podocyte cells. At the gene and protein level, the expression of ULK1 was identified (Figure 6A,B). Compared with the control group, ULK1 protein levels decreased in the model group (RRPTEpiC: p < 0.05, ANOVA, F = 20.53; podocyte: p < 0.05, ANOVA, F = 31.74). The LC3, Beclin1 and p62 levels were altered after the overexpression of ULK1 (Figure 6C). The LC3 (RRPTEpiC: p < 0.05, ANOVA, F = 179.7; podocyte: p < 0.05, ANOVA, F = 351.1) and Beclin1 (RRPTEpiC: p < 0.05, ANOVA, F = 61.15; podocyte: p < 0.05, ANOVA, F = 40.95) levels were higher in the oe-ULK1 group compared to the oe-NC group. The p62 expression decreased in the oe-ULK1 group (RRPTEpiC: p < 0.05, ANOVA, F = 21.87; podocyte: p < 0.05, ANOVA, F = 43.4). These results indicated that ULK1 was deregulated in a HG-induced DKD cell model and that regulation of ULK1 could affect the level of autophagy.
The mTOR/ULK1 signaling axis mediated USW to regulate the autophagy level in DKD rats
To further explore the role of the mTOR/ULK1 signaling axis in USW affecting DKD, USW and L-leucine were applied to treat the DKD rats. The ULK1 (p < 0.05, ANOVA, F = 90.61) and LC3 (p < 0.05, ANOVA, F = 294.9) levels decreased in the USW+L-leucine group compared to the USW group (Figure 7A). The activation of mTOR signaling affected autophagy levels in the DKD rats. Serum CRE (p < 0.05, ANOVA, F = 109.9) and BUN (p < 0.05, ANOVA, F = 498.9) concentrations were higher in the USW+L-leucine group than in the USW group. The urinary MAU (p < 0.05, ANOVA, F = 634.3) and blood GLU (p < 0.05, ANOVA, F = 472.3) levels of the DKD rats increased in the USW+L-leucine group compared to the USW group (Figure 7B). The activation of mTOR signaling affected the efficacy of USW in alleviating DKD. These results hinted that the mTOR/ULK1 signaling axis might mediate USW to alleviate DKD by regulating autophagy.
Discussion
This study revealed that the levels of relevant metabolites (MAU, GLU, CRE, and BUN) decreased in the DKD rats after the USW intervention. In DKD, there is an increase in levels of metabolites such as MAU, GLU, CRE, and BUN. However, following USW intervention, there was a decrease observed in the levels of these metabolites.43, 44 When evaluating renal function, increased expression of CRE and BUN in DKD indicated more serious renal lesions.45 Microalbuminuria was considered to be the first manifestation of DKD and a predictor of DKD progression.46 In DKD, the imbalance between filtration load and renal tubule reabsorption of albumin may lead to an increase in MAU.47 Since USW caused a decrease of MAU, GLU, CRE, and BUN levels in the DKD rats, it can be suggested that USW has a certain alleviating effect on kidney injury in DKD rats. Excessive epithelial injury and inflammation could promote the development of renal fibrosis.48 The related literature has also confirmed that the increase in MAU in DKD is related to podocyte functional and pathological morphological changes.49 Our study found that the degree of renal interstitial fibrosis in the DKD rats was reduced after the USW intervention. These findings further proved that USW had certain therapeutic effects on the DKD rats.
Inflammation plays a key role in the progression of DKD.50 Reduced inflammation can alleviate renal dysfunction.43 In our study, renal inflammation (IL-1β, IL-18, TNF-α, and IL-6) was increased in the DKD rats. The USW treatment significantly downregulated the expression of IL-1β, IL-18, TNF-α, and IL-6. These results indicate that USW could alleviate the inflammatory response in DKD to a certain extent. The levels of IgM and IgG in the urine of the DKD rats were also affected by USW. Immunoglobulin G is mainly transported through large pores in the capillary wall of the glomerulus. The increased urine concentration of IgG in DKD indicated that there was an increase in the number of large pores.51 The increase in IgM in the urine was mainly related to the size-selective barrier dysfunction of DKD glomeruli.51 Thus, USW treatment reduced urine IgM and IgG levels. This suggests that USW might reduce the number of large pores in the kidney to some extent and alleviate the selective dysfunction of glomeruli, thereby achieving the goal of improving the DKD state.
Podocytes are important components of the glomerular filtration barrier.52 Nephrin, the main component of the fissure diaphragm, is significantly reduced in DKD patients.53 This was consistent with our results that nephrin expression decreased in the kidney tissues of the DKD rats. Podocin is an integrated membrane protein expressed in mature glomerular podocytes.54 It can be combined with nephrin to form an oligomer and connect the diaphragm to the cytoskeleton.55 In the study, the USW intervention increased the expression of podocin. This suggests that USW could maintain the integrity of the glomerular barrier in DKD to a certain extent. Moreover, reversing the decreased expression of nephrin and podocin can prevent renal fibrosis in diabetic nephropathy mice (also to a certain degree).56 These findings showed that our research results have been reasonably achieved. The USW intervention restored the expression of nephrin and podocin, and reduced the level of renal interstitial fibrosis in the DKD rats.
As a pathway involved in protein and organelle degradation, autophagy plays an important role in maintaining cell homeostasis.57 Glomerular podocytes exhibited high levels of autophagy under basal conditions.15 A HFD with STZ has been shown to induce an inhibition of autophagy activity in the renal podocytes of DKD mice.58 This is consistent with our result that the level of autophagy in the kidneys of the DKD rats decreased. However, the level of autophagy increased in the DKD rats after the USW intervention. These results suggest that USW might affect renal autophagy in DKD rats. A previous study showed that mTORC1 activation was a key step in developing diabetic nephropathy in mice.59 The intervention of the mTOR/ULK1 signaling axis could affect podocyte autophagy.60, 61 In addition, the mTOR/ULK1 signaling axis was evaluated. Ultrashort wave was found to inhibit the activity of the mTOR/ULK1 signaling axis. L-leucine, an activator of mTOR, was used in the DKD rats. It was found that L-leucine could reduce the therapeutic effects of USW. Thus, it could be concluded that USW affects renal autophagy in DKD rats by inhibiting the mTOR/ULK1 signaling axis, at least in part.
Limitations
This study analyzed the regulation of the mTOR/ULK1 signaling axis by USW in DKD rats in a limited way. The intrinsic pathway by which USW regulates the mTOR/ULK1 signaling axis needs to be further explored. In the future, we will analyze the effect of USW on the gene transcriptome of DKD rat kidney tissue by RNA sequencing. The relationship between differential genes and the mTOR/ULK1 signaling axis was analyzed in combination with bioinformatics. In addition, we will further combine in vivo and in vitro experiments to analyze whether USW regulates the mTOR/ULK1 signaling axis through differential genes, thereby alleviating the decrease in autophagy in the kidney tissue of DKD rats.
Conclusions
In conclusion, the study found that USW could affect metabolic and inflammatory levels in DKD rats. Ultrashort wave could alleviate kidney injury and increase autophagy activity in DKD rats. At the same time, USW might activate renal autophagy in DKD rats via the mTOR/ULK1 signaling axis. This enriches the basic experimental data on using the USW intervention to alleviate DKD and provides a scientific basis for the clinical utilization of USW in the treatment of DKD.
Supplementary data
The supplementary materials are available at https://doi.
org/10.5281/zenodo.7693991. The package contains the following files:
Supplementary Table 1. Normality and uniformity test results of data presented in Figure 1.
Supplementary Table 2. Normality and uniformity test results of data presented in Figure 2.
Supplementary Table 3. Normality and uniformity test results of data presented in Figure 3.
Supplementary Table 4. Normality and uniformity test results of data presented in Figure 4.
Supplementary Table 5. Normality and uniformity test results of data presented in Figure 5.
Supplementary Table 6. Normality and uniformity test results of data presented in Figure 6.


