Abstract
Background. Oral lichen planus (OLP) is a chronic, immune-mediated oral mucosal disease with complex pathophysiology and potential for malignant transformation. Understanding its molecular basis is critical for the development of precise diagnostic and therapeutic strategies.
Objectives. We aimed to identify key immune-related biomarkers and characterize cellular dynamics in OLP, with a particular focus on the role of CEBPZ in disease pathogenesis.
Materials and methods. We analyzed single-cell RNA sequencing (scRNA-seq) data from OLP lamina propria samples (GSE211630) to identify disease-specific T-cell subpopulations using high-dimensional weighted gene co-expression network analysis (hdWGCNA) for oxidative stress-related gene modules. Summary-data-based Mendelian randomization (SMR) integrated FinnGen genome-wide association study (GWAS; 342,499 Europeans) data with Genotype-Tissue Expression (GTEx) expression quantitative trait loci (eQTL) data to identify causal genes. Machine learning (ML) models (least absolute shrinkage and selection operator (LASSO) and convolutional neural network (CNN)) were developed using bulk RNA-seq datasets (GSE52130 and GSE38616) for diagnostic purposes.
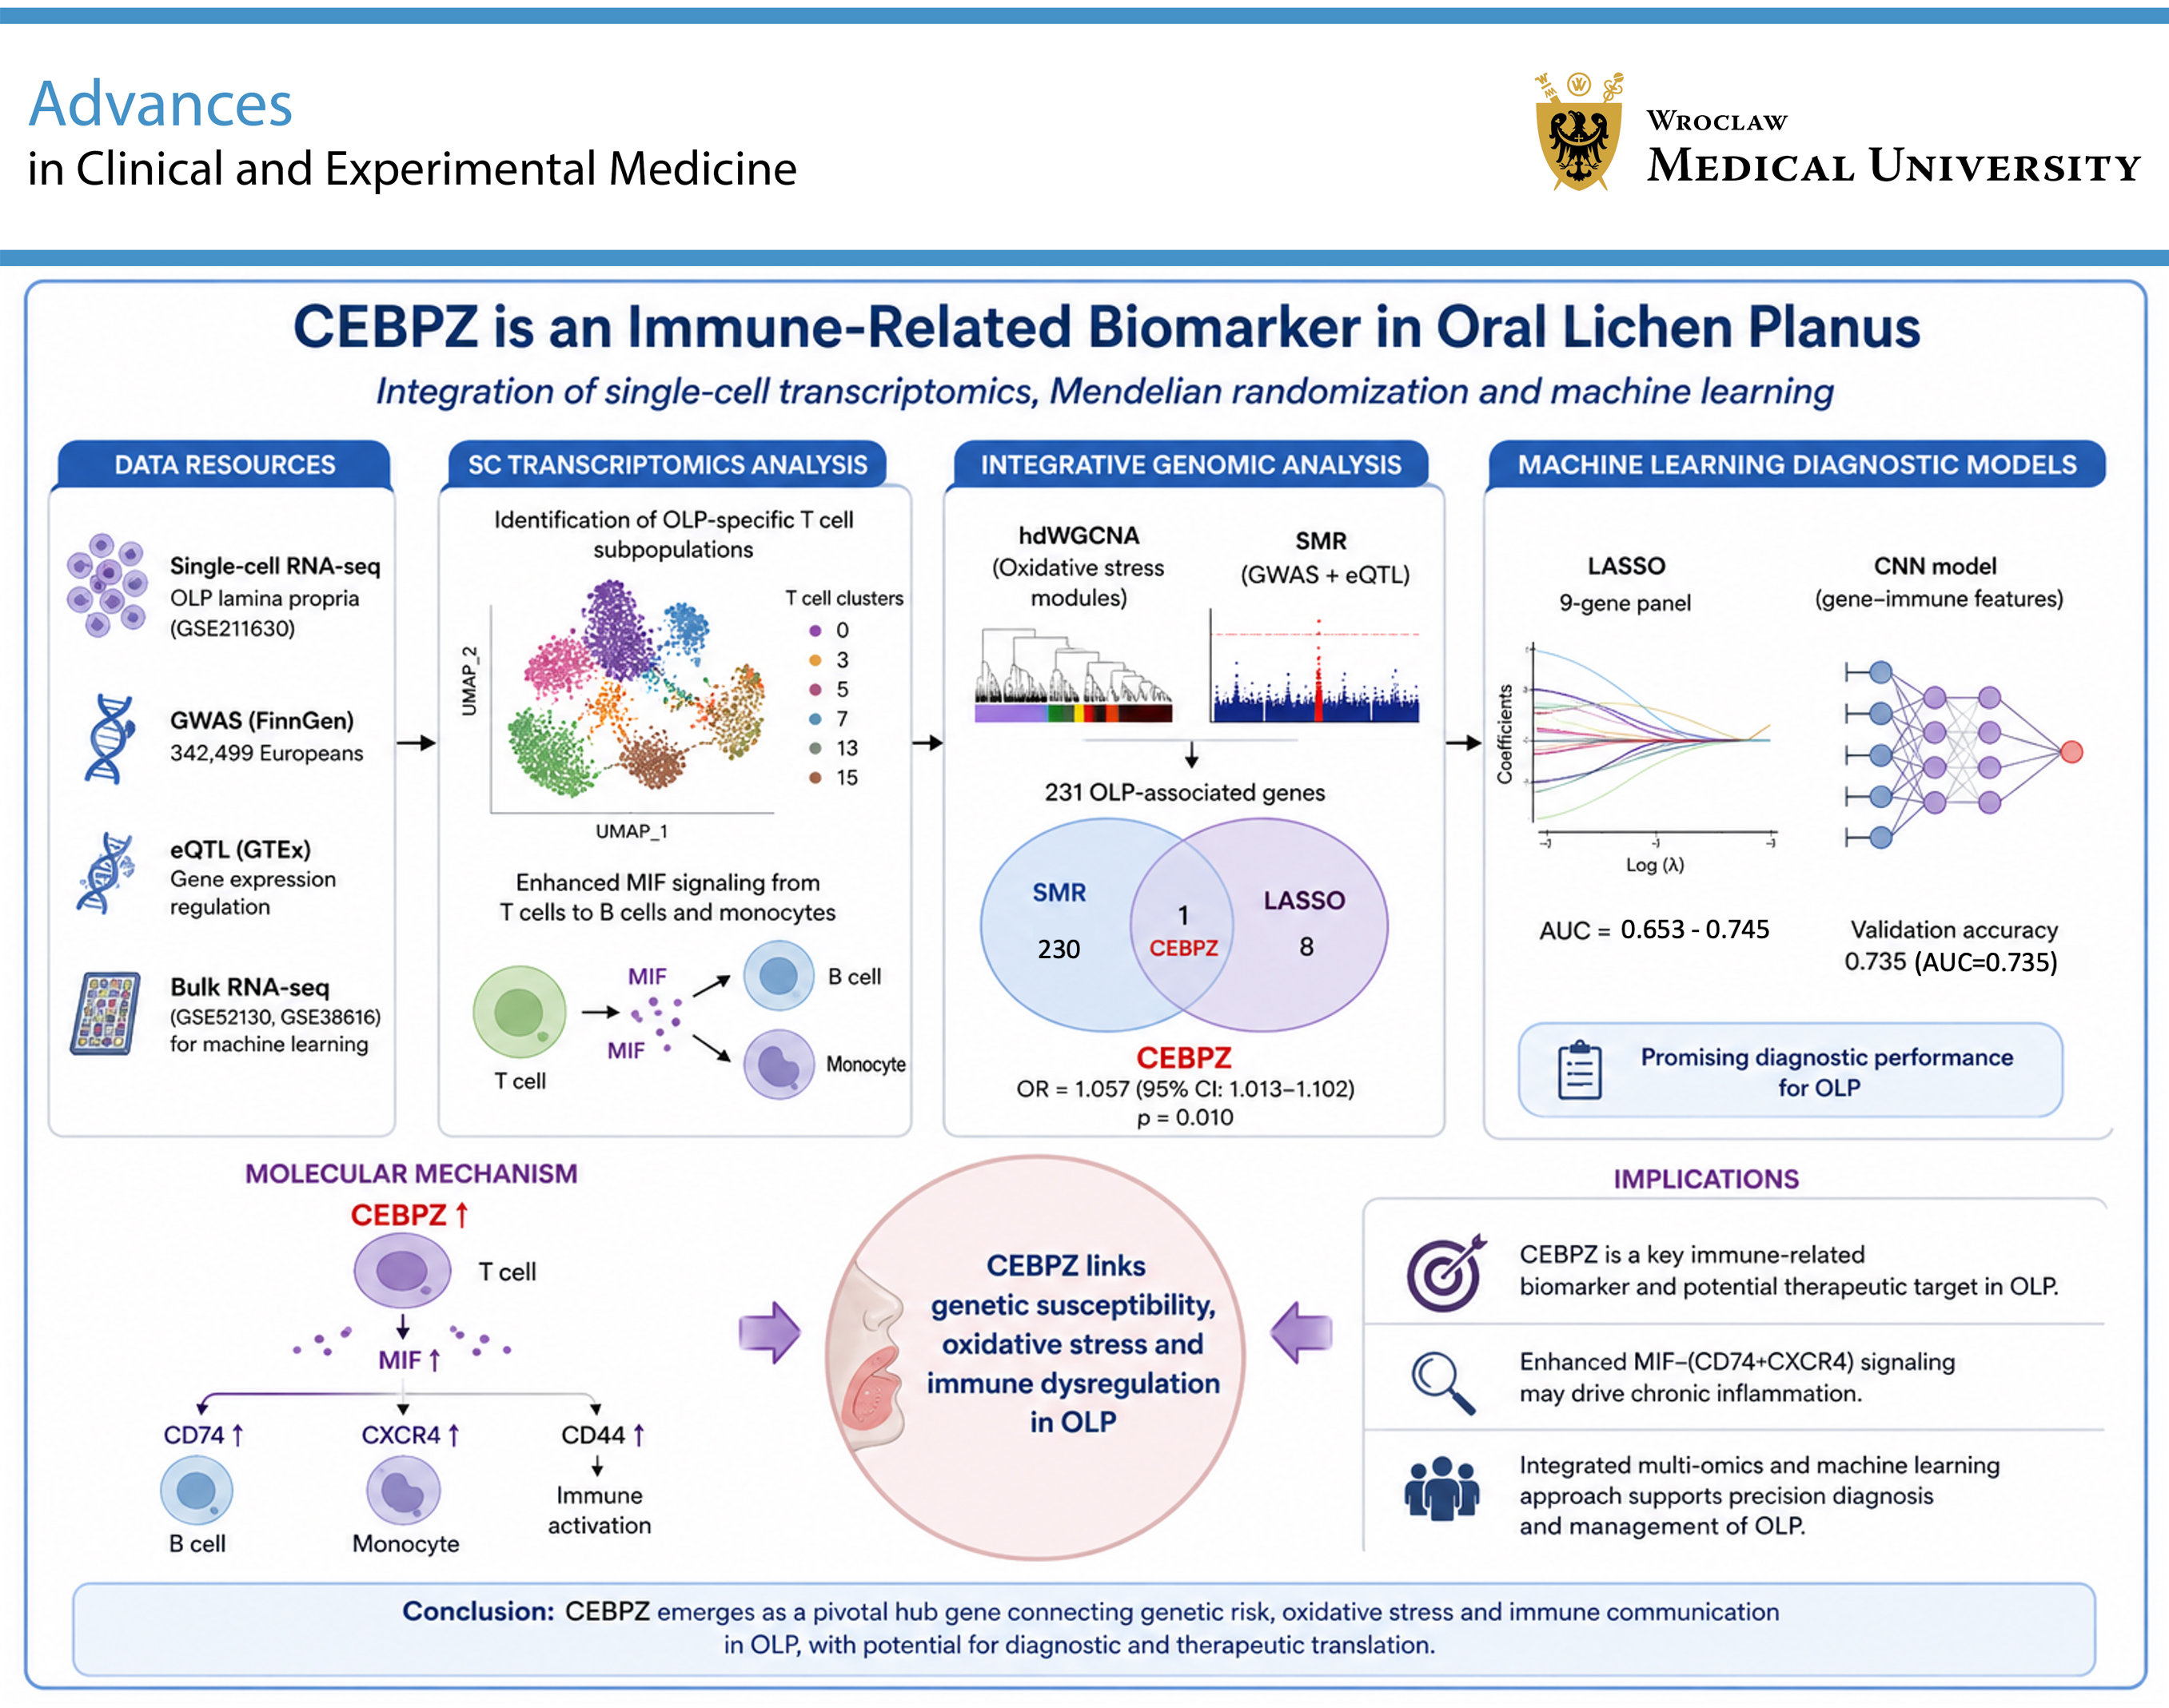
Results. We identified OLP-specific T-cell populations (clusters 0, 3, 5, 7, 13, and 15) with enhanced migration inhibition factor (MIF) pathway signaling toward B cells and monocytes. Two oxidative stress-associated modules contained hub genes, including CEBPZ. Summary-data-based Mendelian randomization analysis identified 231 OLP-associated genes, with CEBPZ uniquely intersecting LASSO-selected markers (odds ratio (OR) = 1.057, 95% confidence interval (95% CI) = 1.013–1.102, p = 0.010). Machine learning models achieved area under the curve (AUC) values ranging from 0.653 to 0.745, with the CNN model reaching a validation accuracy of 0.735. CEBPZ showed elevated expression in OLP T cells and correlated with enhanced MIF-(CD74+CXCR4) signaling.
Conclusions. This integrative approach identifies CEBPZ as a pivotal biomarker linking genetic susceptibility, oxidative stress, and immune dysregulation in OLP. Our diagnostic models offer promising tools for OLP management.
Key words: oral lichen planus, machine learning, CEBPZ, single-cell transcriptome sequencing, Mendelian randomization
Introduction
Oral lichen planus (OLP) represents a significant clinical challenge in oral medicine, affecting millions of people worldwide with chronic, painful lesions that impair quality of life and carry a risk of malignant transformation. It is a T-cell-mediated chronic inflammatory disease of the oral mucosa with no recognized cause, presenting as plaques, papules, white striations, erosions, erythema, or blisters, primarily affecting the gingiva, tongue, and buccal mucosa.1, 2 The disease affects 1–2% of the adult population.3 Oral lichen planus diagnosis relies on histological and clinical characteristics; a biopsy is recommended to confirm the diagnosis and rule out malignancy.1, 2 Annual surveillance is strongly recommended, as research indicates that 1.63% of OLP cases develop into oral squamous cell carcinoma (OSCC) within 7 years.4, 5 However, there is no recognized gold standard treatment, and both systemic and local therapeutic approaches are used. Some clinical manifestations are particularly difficult to treat, significantly reducing patients’ quality of life.2, 6 Therefore, there is an urgent need to develop more accurate methods for the early diagnosis and treatment of OLP.
Oral lichen planus may be caused by several factors, including hypersensitivity reactions, psychological stress, viral infections, and autoimmune responses.7, 8 Numerous immune cell types have been implicated in the development of OLP. The disease is characterized by liquefaction degeneration of basal keratinocytes mediated by T lymphocytes. CD8+ T lymphocytes produce granzymes and perforin, which can destroy oral mucosal keratinocytes and accelerate epithelial degradation.9 Natural killer (NK) cells in OLP lesions damage living cells and produce tumor necrosis factor alpha (TNF-α) and interferon gamma (IFN-γ).10 B cells are also frequently observed in OLP lesions.11 The basement membrane of the oral mucosa in OLP may be damaged by particles and inflammatory mediators released by mast cells, as well as by matrix metalloproteinases (MMPs) produced by T cells.12 Within complex microenvironments, immune cells interact to produce inflammatory mediators, such as chemokines and cytokines, which contribute to the development and progression of OLP. However, the complete single-cell characteristics of the immune response in OLP have not yet been fully characterized.13
Recent advances in single-cell RNA sequencing (scRNA-seq) have revolutionized our understanding of cellular heterogeneity in disease states. While previous scRNA-seq studies identified differences in T-cell composition between OLP and normal tissues,14, 15, 16 our study integrates multiple cutting-edge analytical approaches. We combined scRNA-seq with causal inference using summary data-based Mendelian randomization (SMR), network analysis via high-dimensional weighted gene co-expression network analysis (hdWGCNA), and machine learning (ML) to create a comprehensive framework for biomarker discovery and diagnostic tool development. This multimodal approach allows us not only to identify disease-associated cellular changes but also to establish their causal relationships and clinical utility.
Summary data-based Mendelian randomization is a powerful integrative analytical technique that uses genetic variants as instrumental variables to assess causal relationships between gene expression and disease outcomes.17 By combining summary-level expression quantitative trait loci (eQTL) data with genome-wide association study (GWAS) results, SMR identifies genes whose expression levels are causally linked to disease risk while minimizing the influence of confounding factors.
Using scRNA-seq analysis, we identified a distinct increase in specific T-cell subgroups in patients with OLP, designated as OLP-specific T cells (OLP_T cells). Through hdWGCNA, we identified T-cell gene modules associated with oxidative stress and linked to immune profiles. We developed diagnostic models using ML and constructed a gene–immune convolutional neural network deep learning model incorporating 10 immune cell types and 9 key genes. Summary data-based Mendelian randomization analysis of GWAS and eQTL data further identified risk genes, which were subsequently evaluated through scRNA-seq analysis and cellular communication analysis.
Objectives
This study aimed to identify key immune-related biomarkers and characterize the cellular dynamics involved in OLP, with a particular focus on understanding the role of CEBPZ in disease pathogenesis, by integrating single-cell transcriptomics, genetic causal inference, and ML approaches to uncover novel diagnostic markers and therapeutic targets.
Materials and methods
Ethical approval and consent to participate
This study did not involve direct human or animal experimentation. All analyses were performed using publicly available datasets, including scRNA-seq data from the Gene Expression Omnibus (GEO) database (https://www.ncbi.nlm.nih.gov/geo) (GSE211630, GSE52130, and GSE38616), GWAS summary data from the FinnGen database (https://www.finngen.fi), and eQTL data from the Genotype-Tissue Expression (GTEx) database (https://gtexportal.org). Therefore, no ethical approval or informed consent was required. All data were handled in accordance with the ethical guidelines and data-use policies of the respective repositories.
Data acquisition
The GEO database provided the scRNA-seq dataset GSE211630, which was processed using the standard Seurat methodology.18 The Harmony algorithm was used to eliminate batch effects between samples. Bulk RNA-seq datasets GSE52130 and GSE38616 were also obtained from GEO.19, 20 For SMR analysis, GWAS summary statistics were obtained from the FinnGen database (release 8), specifically using endpoint K11_LICHEORAL, comprising 342,499 samples of European ancestry with 20,169,554 single-nucleotide polymorphisms (SNPs). Esophageal mucosa eQTL summary data were obtained from the GTEx database (version 8) and selected as a proxy for oral squamous epithelium because of shared squamous epithelial characteristics and the lack of adequately powered oral tissue eQTL datasets. No sample overlap existed between the FinnGen and GTEx cohorts, and all genomic coordinates were harmonized to the GRCh38/hg38 reference build. Reference genotype data for linkage disequilibrium (LD) calculations were obtained from the Phase 3 European panel of the 1000 Genomes Project (EUR, n = 503). Protein interaction data were obtained from the STRING database.21
Single-cell sequencing data processing
Dataset GSE211630 was processed using the standard Seurat pipeline, with quality control parameters including a ribosomal gene percentage threshold of 10%, a mitochondrial gene proportion threshold of 20%, and between 500 and 3,000 detected genes per cell. Highly variable genes were identified using Seurat’s FindVariableFeatures function.22 Cell clustering was performed using the FindNeighbors and FindClusters functions,23 and cell types were manually annotated using established cell markers.24
The pipeline of high dimensional WGCNA
The hdWGCNA package extends traditional WGCNA to single-cell data by accounting for sparsity and high dimensionality.25 The pipeline involves 5 key steps: preprocessing to eliminate batch effects while preserving biological variation; construction of a gene co-expression network using metacells to overcome sparsity; identification of gene modules with eigengene calculation; module preservation analysis to evaluate robustness; and functional enrichment analysis to determine associated biological pathways.
Pseudotime analysis
Pseudotime analysis was performed using the Monocle2 R package (https://github.com/MaxMeieran/monocle2)to investigate the potential effects of blue and brown module genes on T-cell development in the OLP microenvironment.26, 27, 28, 29 The plot_cell_trajectory function was used to depict the cell differentiation trajectory, and the DDRTree method implemented through the reduceDimension function was used to calculate differentiation states.30, 31 Additionally, the Velocyto package (https://github.com/velocyto-team/velocyto.py) was used to infer cell developmental vectors based on the balance between spliced and unspliced mRNA, with the developmental stage linked to the quantile polarization of cell principal component values.32
Cell–cell interaction analysis
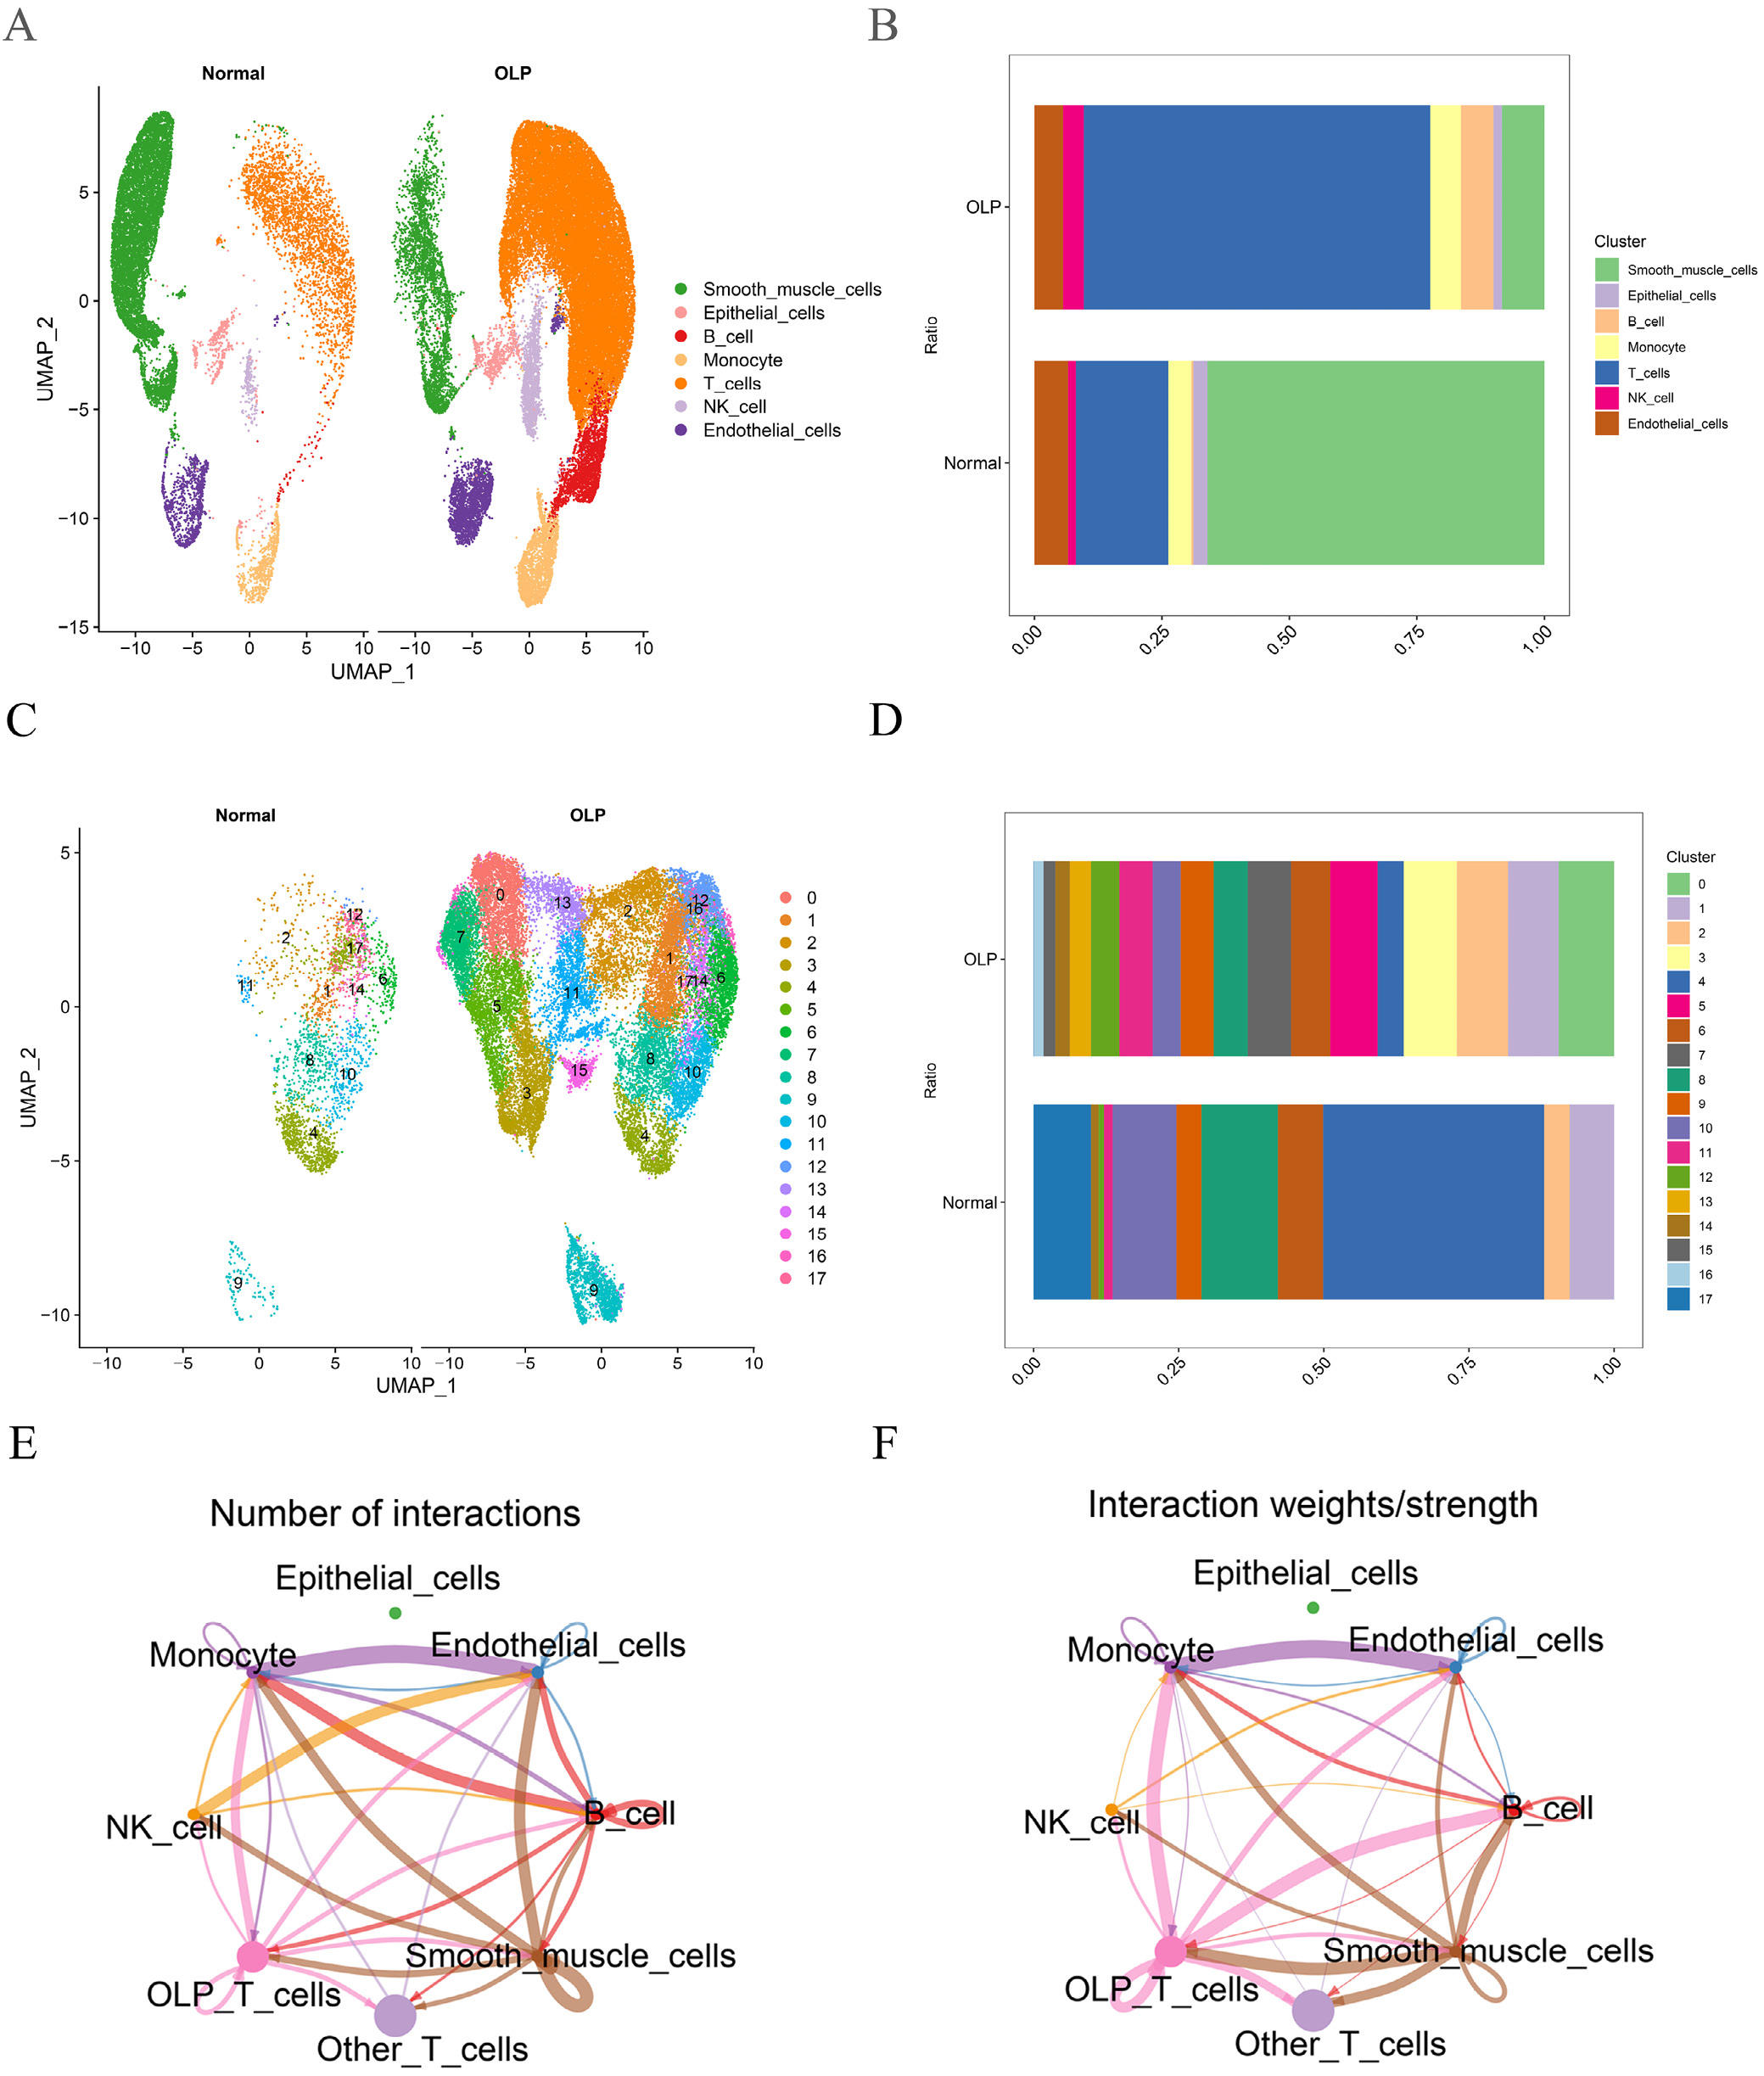
Ligand–receptor-mediated interactions and intercellular communication networks were assessed using the R package CellChat (https://github.com/sqjin/CellChat). The volume and intensity of cell-to-cell communication were graphically represented in Figure 1. The migration inhibition factor (MIF) signaling pathway, which mediates inflammatory responses through the receptors CD74, CXCR4, and CD44, was specifically examined because of its role in chronic inflammation. The principal signaling inputs and outputs of each OLP cell subpopulation were assessed using CellChatDB.33
Functional enrichment analysis
Potential interaction networks among target module proteins were identified using GeneMANIA.34, 35 Gene Ontology (GO) and Kyoto Encyclopedia of Genes and Genomes (KEGG) pathway analyses were performed using the Metascape platform,36 with a p-value threshold of 0.05.
Immune infiltration analysis based on individualized CIBERSORTx signature or MCP_counter
CIBERSORTx was used to deconvolve complex gene expression data into cell type-specific expression patterns.37 An OLP-specific gene expression signature matrix was generated from GSE211630 for the deconvolution of bulk RNA-seq datasets. The MCP-counter algorithm was used to assess the abundance of 10 cell types.38
RNA-seq bulk NMF
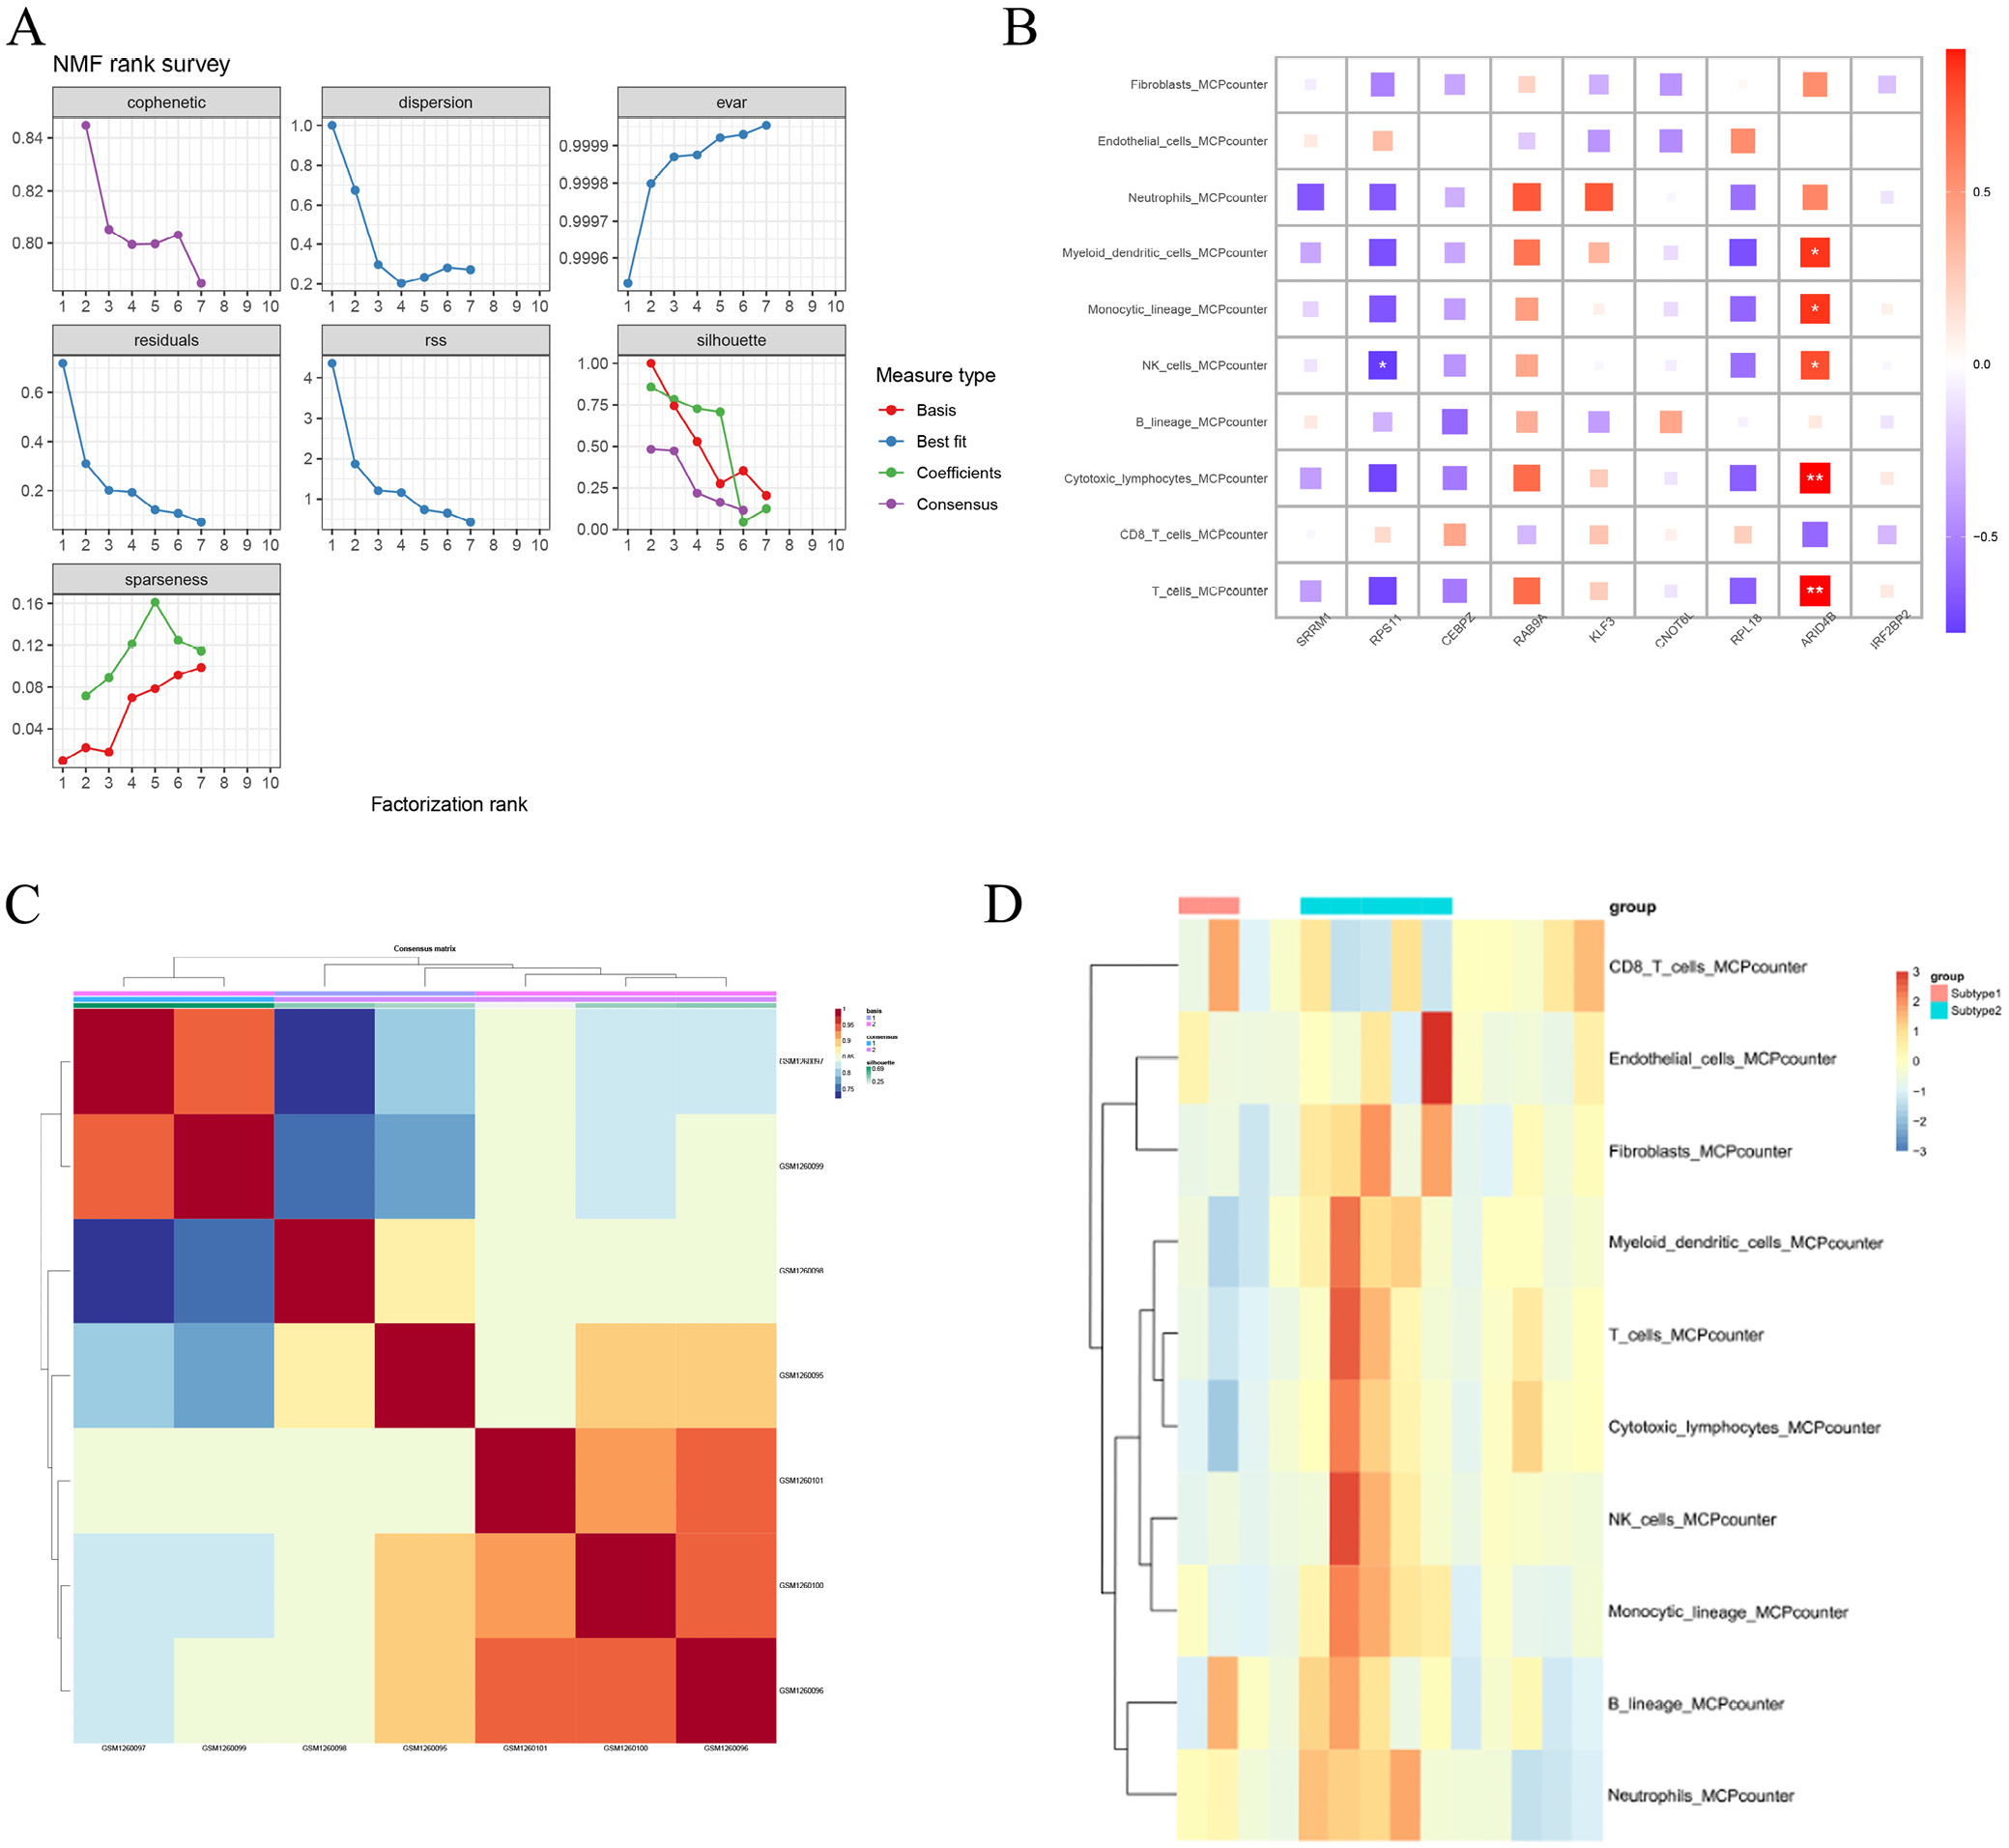
Patients with OLP were divided into subgroups using non-negative matrix factorization based on blue and brown module gene expression levels.39 The cophenetic coefficient was used to determine the optimal number of clusters.
Machine learning and deep learning
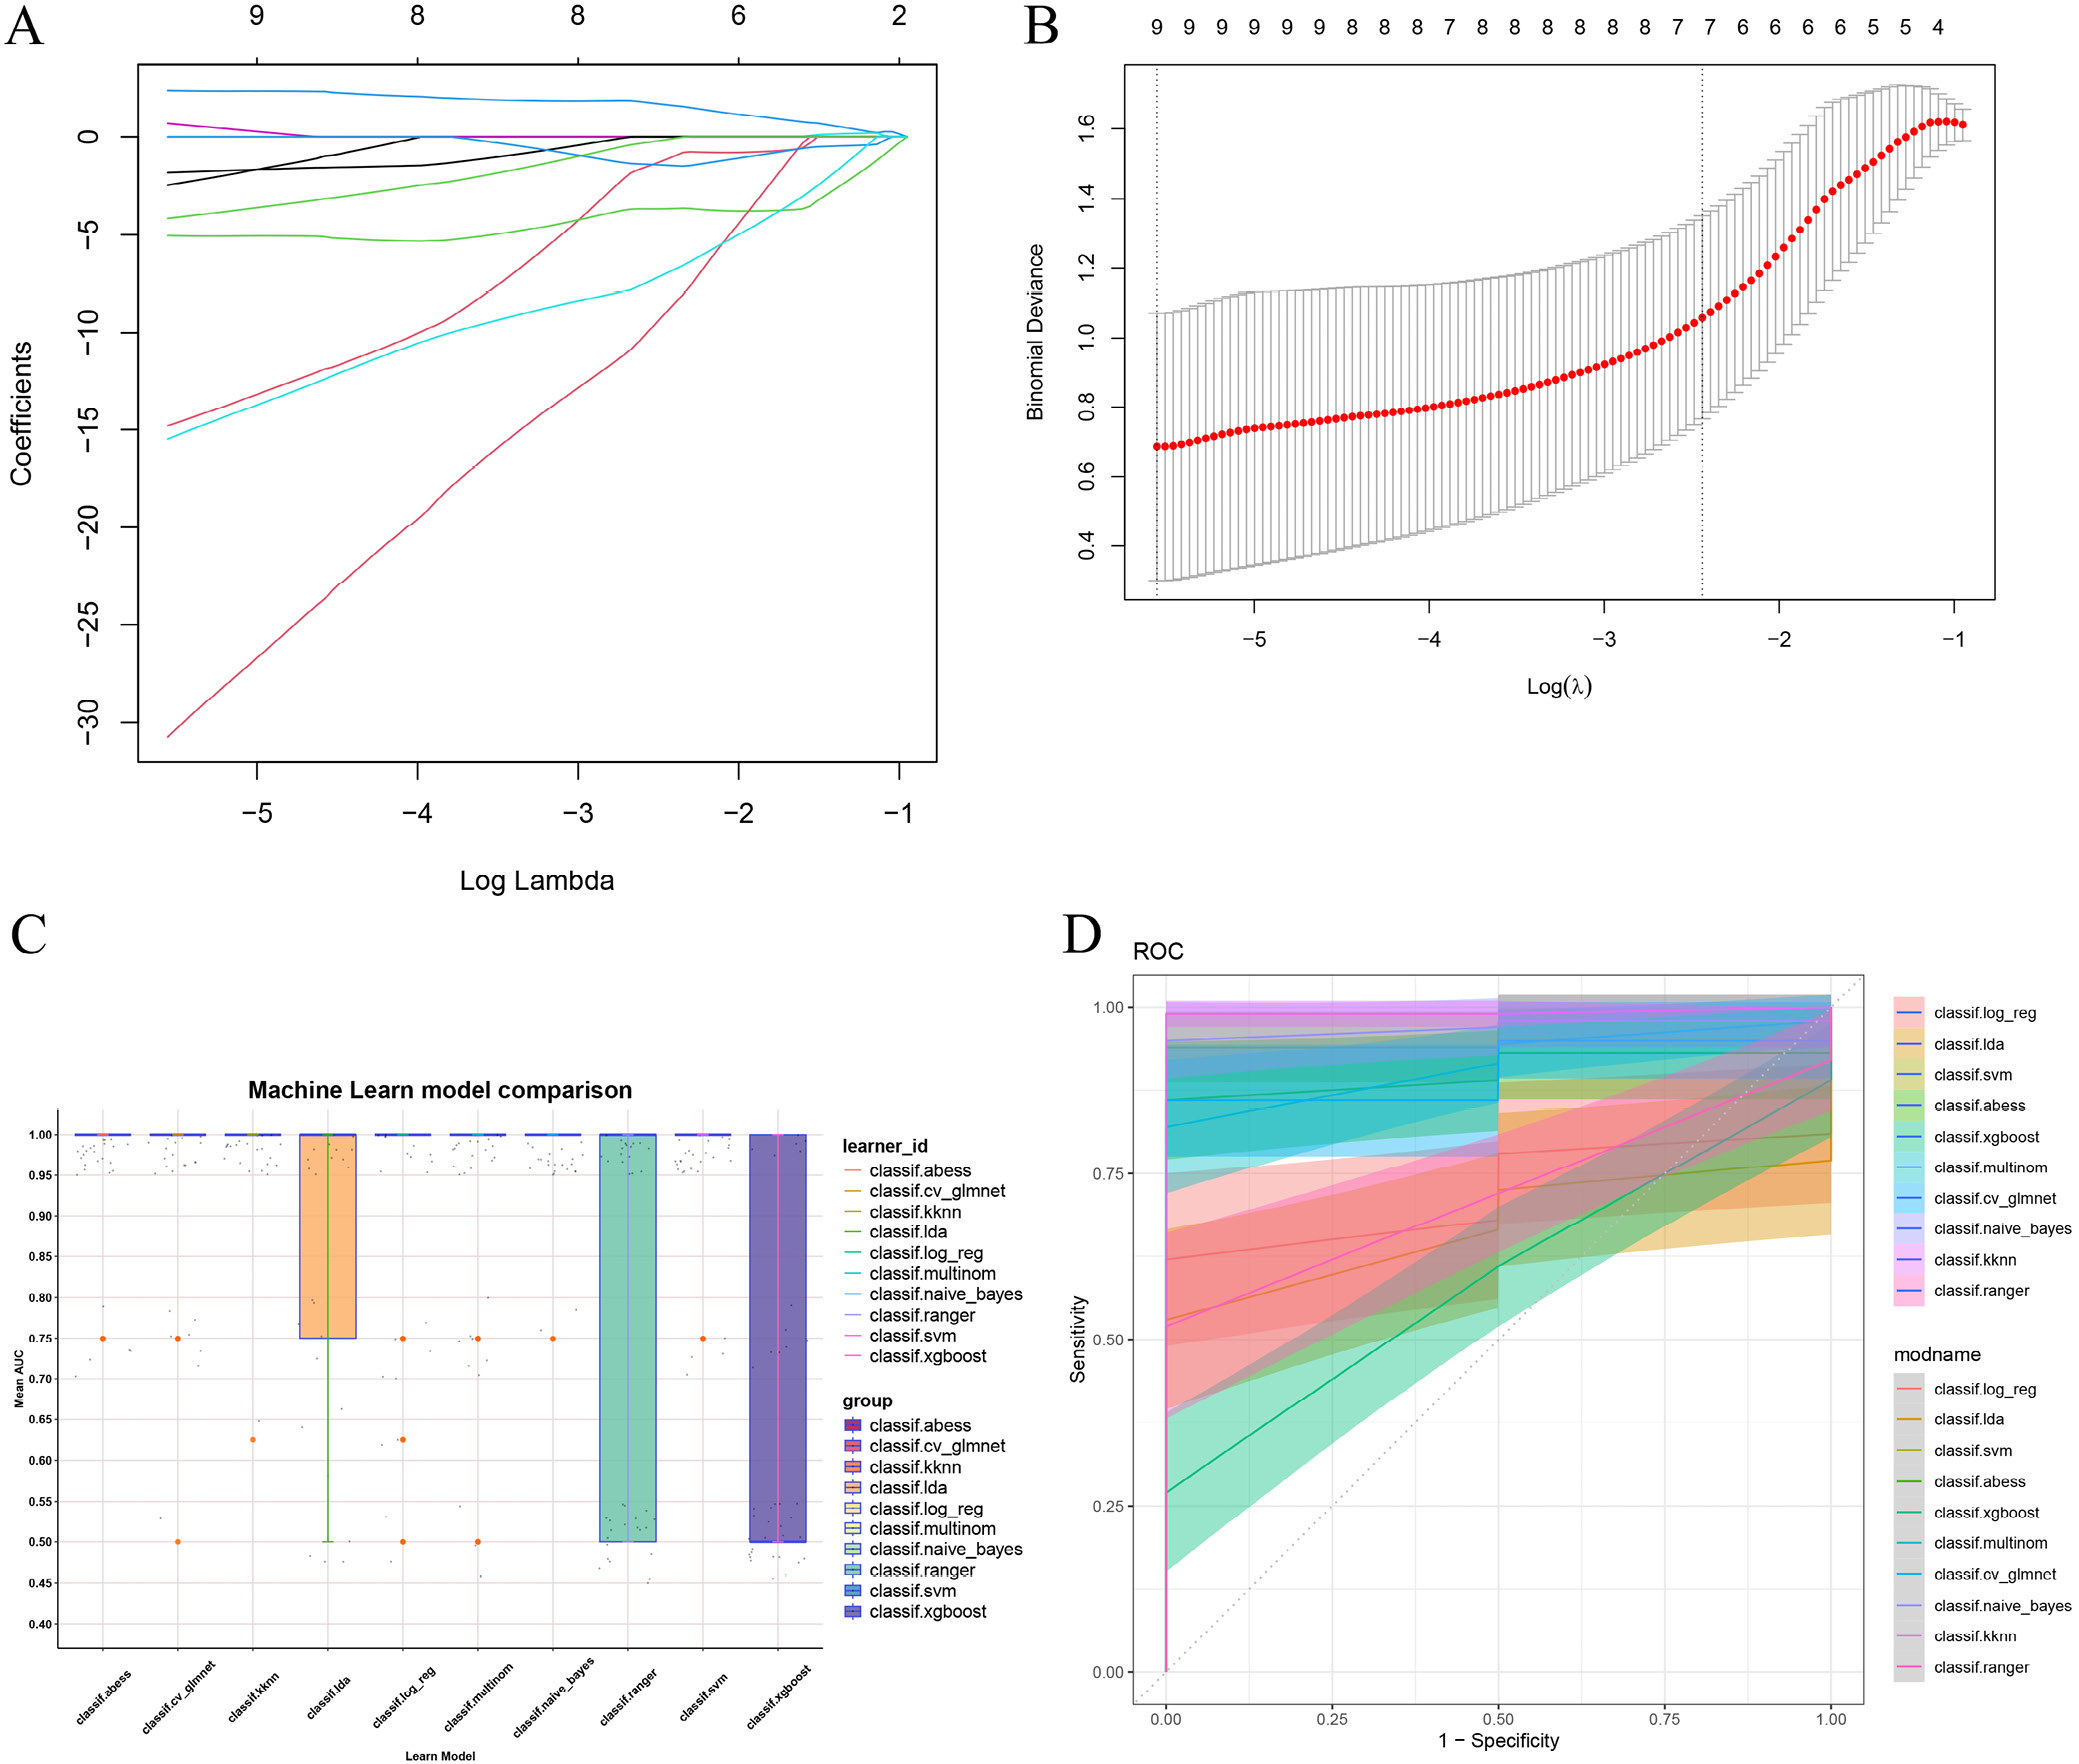
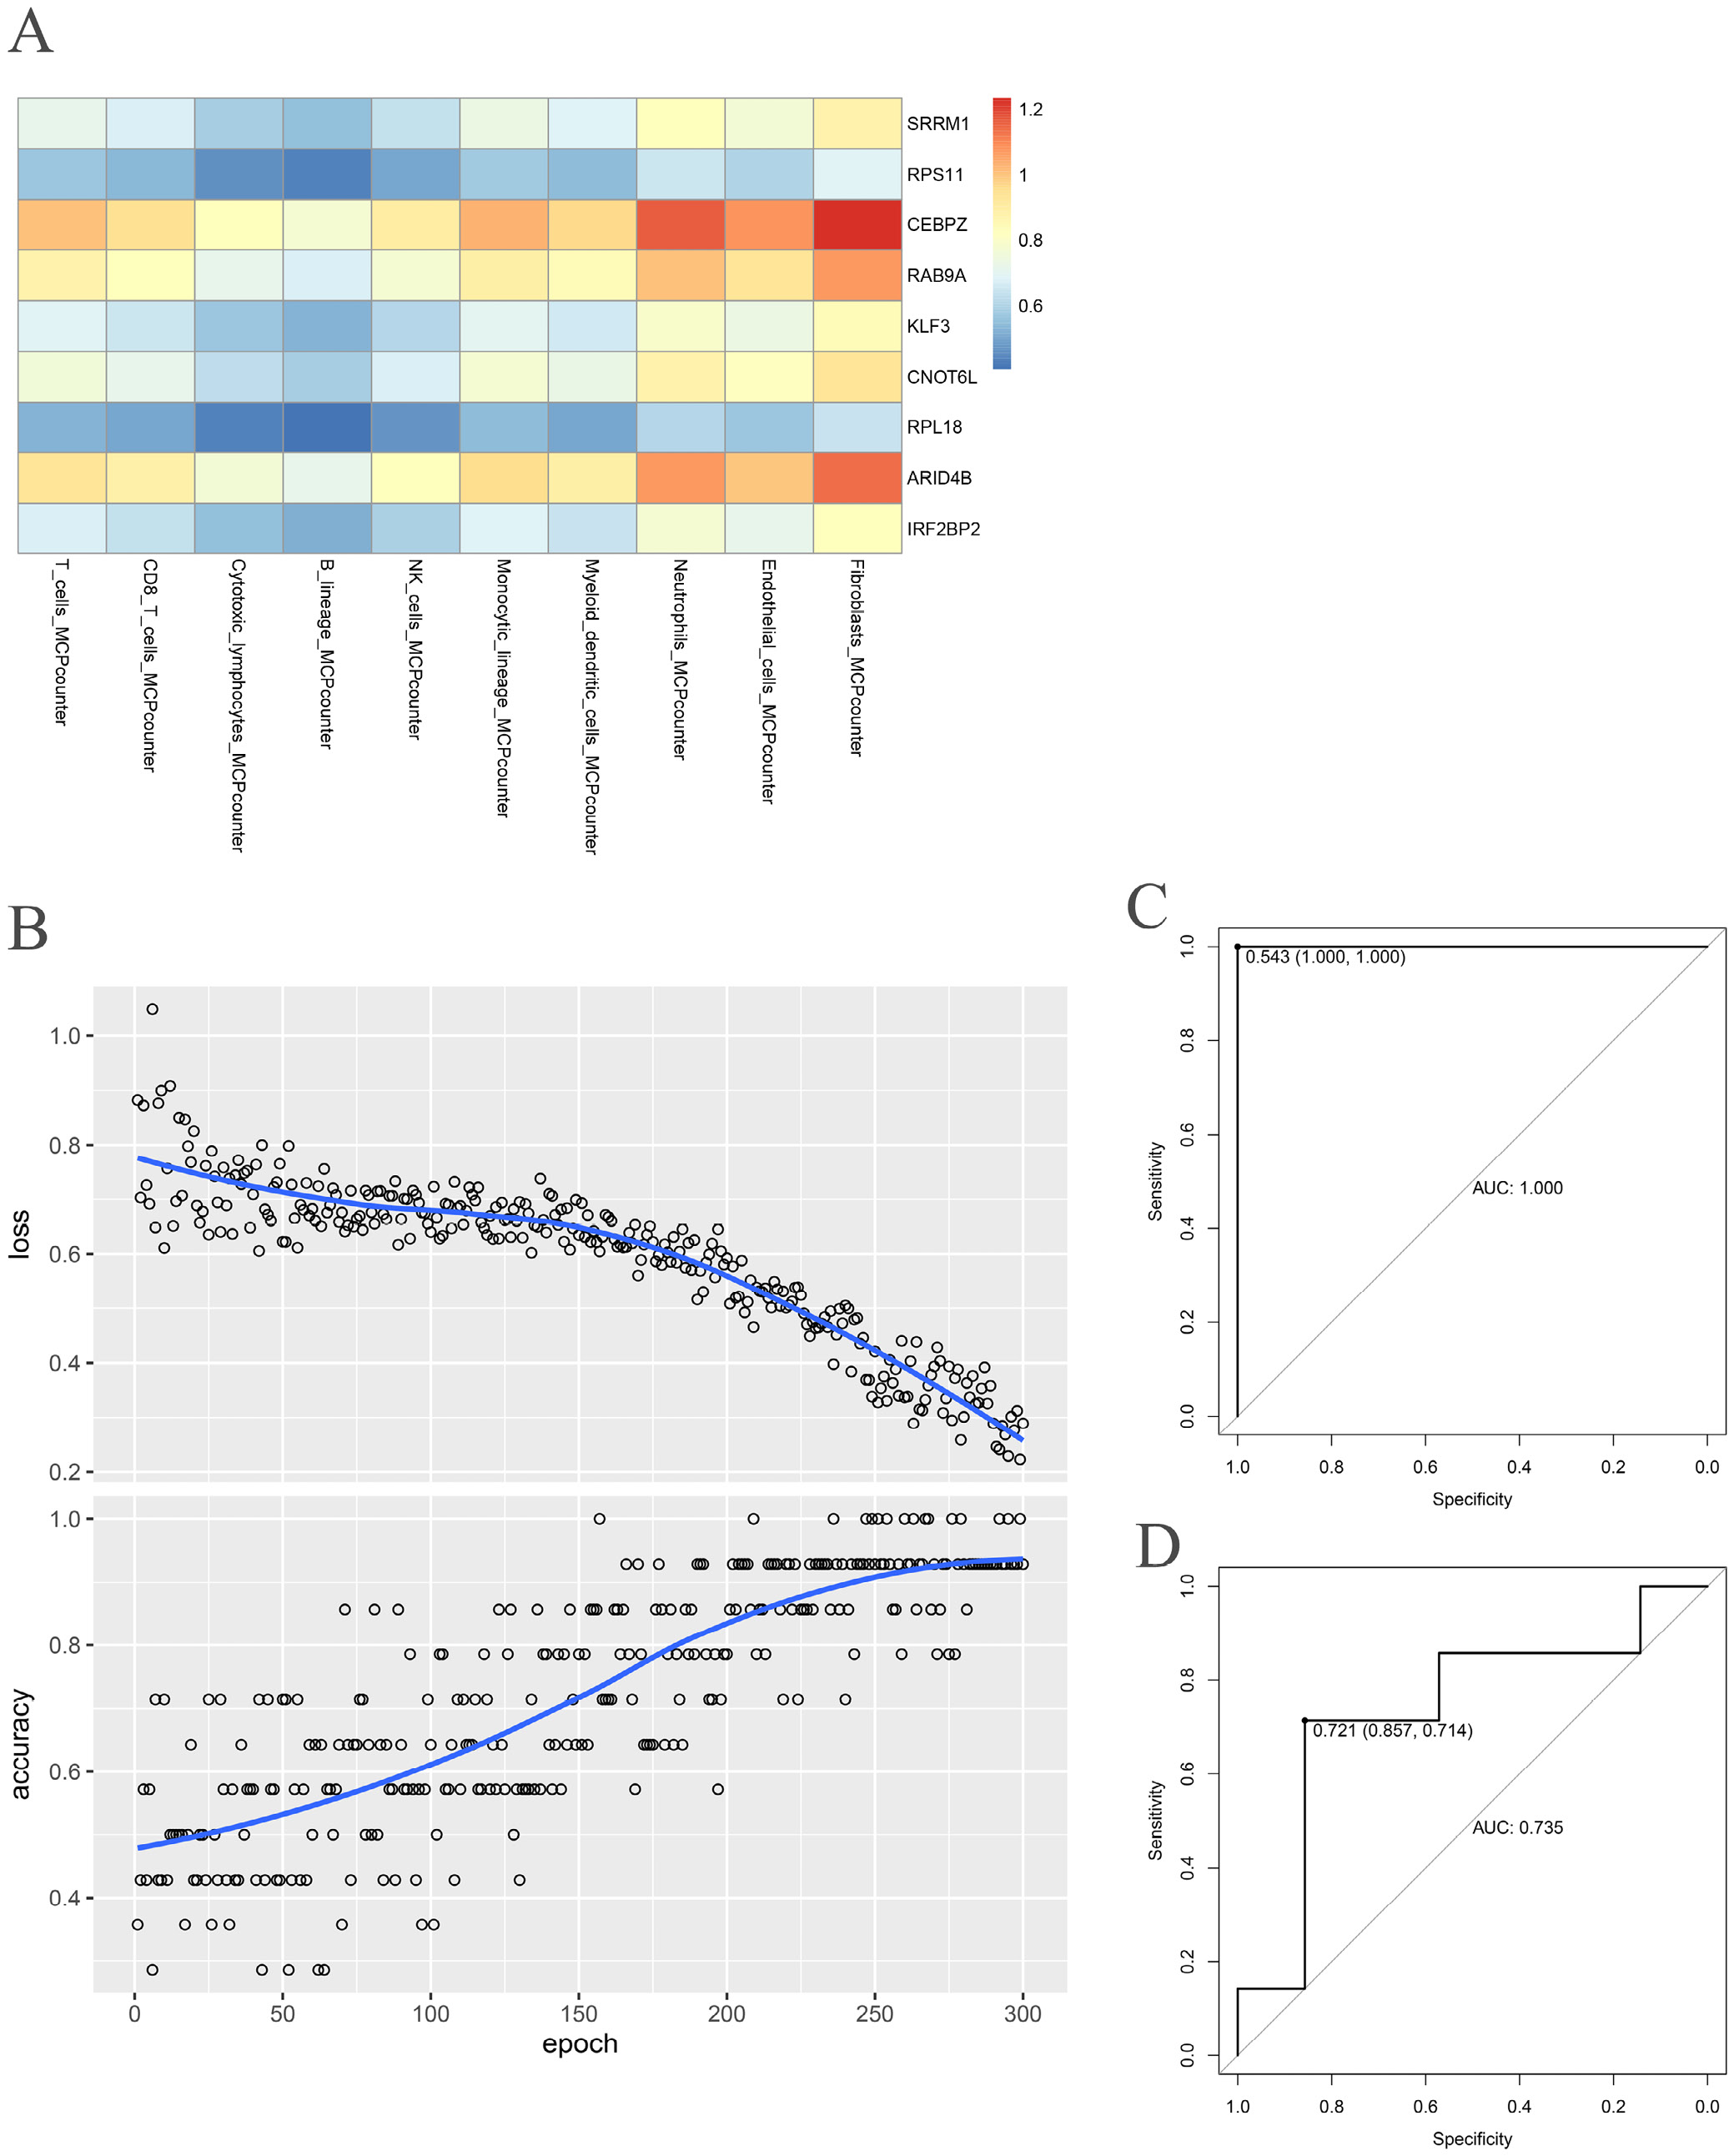
Key diagnostic genes were identified using univariate logistic regression. Least absolute shrinkage and selection operator (LASSO) regression was used for variable selection.40 Ten ML models were evaluated using the mlr3 package (https://cran.r-project.org/web/packages/mlr3/index.html): KNN, LR, LDA, NB, Ranger, ABESS, Glmnet, SVM, XGBoost, and Multinom.41 GSE52130 served as the training set and GSE38616 served as the validation set, with performance assessed using 10 iterations of five-fold cross-validation. For deep learning, images of 10 immune cell types and 9 genes were generated using the formula N<sub>j,i</sub> = immune<sub>i</sub>/gene<sub>j</sub> to investigate the association between immune cells and target genes. Convolutional neural network (CNN) models were developed using the Keras and TensorFlow frameworks.42, 43
Summary-data-based Mendelian randomization analysis
Comprehensive SMR analysis was conducted using SMR software v. 1.3.1 (https://yanglab.westlake.edu.cn/software/smr) with FinnGen GWAS summary statistics, GTEx esophageal mucosa eQTL data, and the 1000 Genomes European reference panel for LD calculation (workflow shown in Supplementary Fig. 1). All data were harmonized to GRCh38/hg38, alleles were aligned, and palindromic SNPs with a minor allele frequency (MAF) of 0.4–0.6 were removed. Instrument selection used a cis-eQTL window of ±1 Mb with clumping parameters of r2 < 0.1 within 500 kb. An eQTL was considered significant when the p-value of the top associated cis-acting single-nucleotide polymorphism (cis-SNP) was <5.00 × 10⁻⁸. The significance threshold for SMR analysis was determined using Bonferroni correction (0.05/N). Oral lichen planus-associated risk genes were defined as those with PSMR (the p-value from SMR analysis indicating a pleiotropic association) <0.05 and PHEIDI (the p-value from the Heterogeneity in Dependent Instruments test) >0.05. The HEIDI test examines whether an association is due to a shared causal variant (PHEIDI >0.05) or linkage (PHEIDI ≤0.05). Default settings were maintained for the minimum number of instruments (≥3 SNPs) and instrument strength (F-statistic >10).
Statistical analyses
Three groups were compared using the Kruskal–Wallis test, and 2 groups were compared using the Wilcoxon test. Pearson’s correlation analysis was used to investigate the relationships between 10 immune cell types and 9 key genes. Statistical significance was set at p < 0.05. All analyses were performed using R v. 4.3.1 (R Foundation for Statistical Computing, Vienna, Austria).
Results
The change in the composition of T cell subtypes in OLP lamina propria
We acquired the scRNA-seq dataset GSE211630 and used Harmony integration, dimensionality reduction, and clustering to analyze the OLP-specific cellular composition (Supplementary Fig. 2). The Uniform Manifold Approximation and Projection (UMAP) scatter plot showed the distribution of cell subtypes in the OLP lamina propria (LP) (Figure 1A), while the stacked bar chart displayed the altered proportions of these cell populations (Figure 1B). T cells showed the most pronounced shift between OLP and normal tissues (Figure 1A,B). We focused on T cells and performed dimensionality reduction and clustering of T-cell subpopulations. T-cell clusters 0, 3, 5, 7, 13, and 15 showed significant increases in the OLP LP (Figure 1C,D), which were not observed in normal tissues. Given that these adjacent clusters were distant from other T-cell subpopulations in UMAP space and exhibited specific upregulation in OLP, we designated them as OLP_T cells.
Cell–cell communication analysis revealed that OLP_T cells exhibited more numerous and stronger interactions with other cell types, including B cells, other T cells, and monocytes (Figure 1E,F). We further investigated the specific pathways through which certain cell types interacted more strongly with one another. OLP_T cells demonstrated enhanced communication through MIF-related pathways compared with other T cells, transmitting more signals to B cells and monocytes (Supplementary Fig. 3A,B). The MIF pathway mediates inflammatory responses through its receptors CD74, CXCR4, and CD44 and plays a crucial role in chronic inflammation. Overall, scRNA-seq analysis revealed an increase in OLP-specific T-cell subtypes in the OLP LP. These cells exhibited close interactions with smooth muscle cells, B cells, and monocytes, suggesting that this population of OLP-specific T-cell subtypes may be involved in the immune-inflammatory process.
hdWGCNA revealed that OLP_T cells were characterized by the blue and brown modules
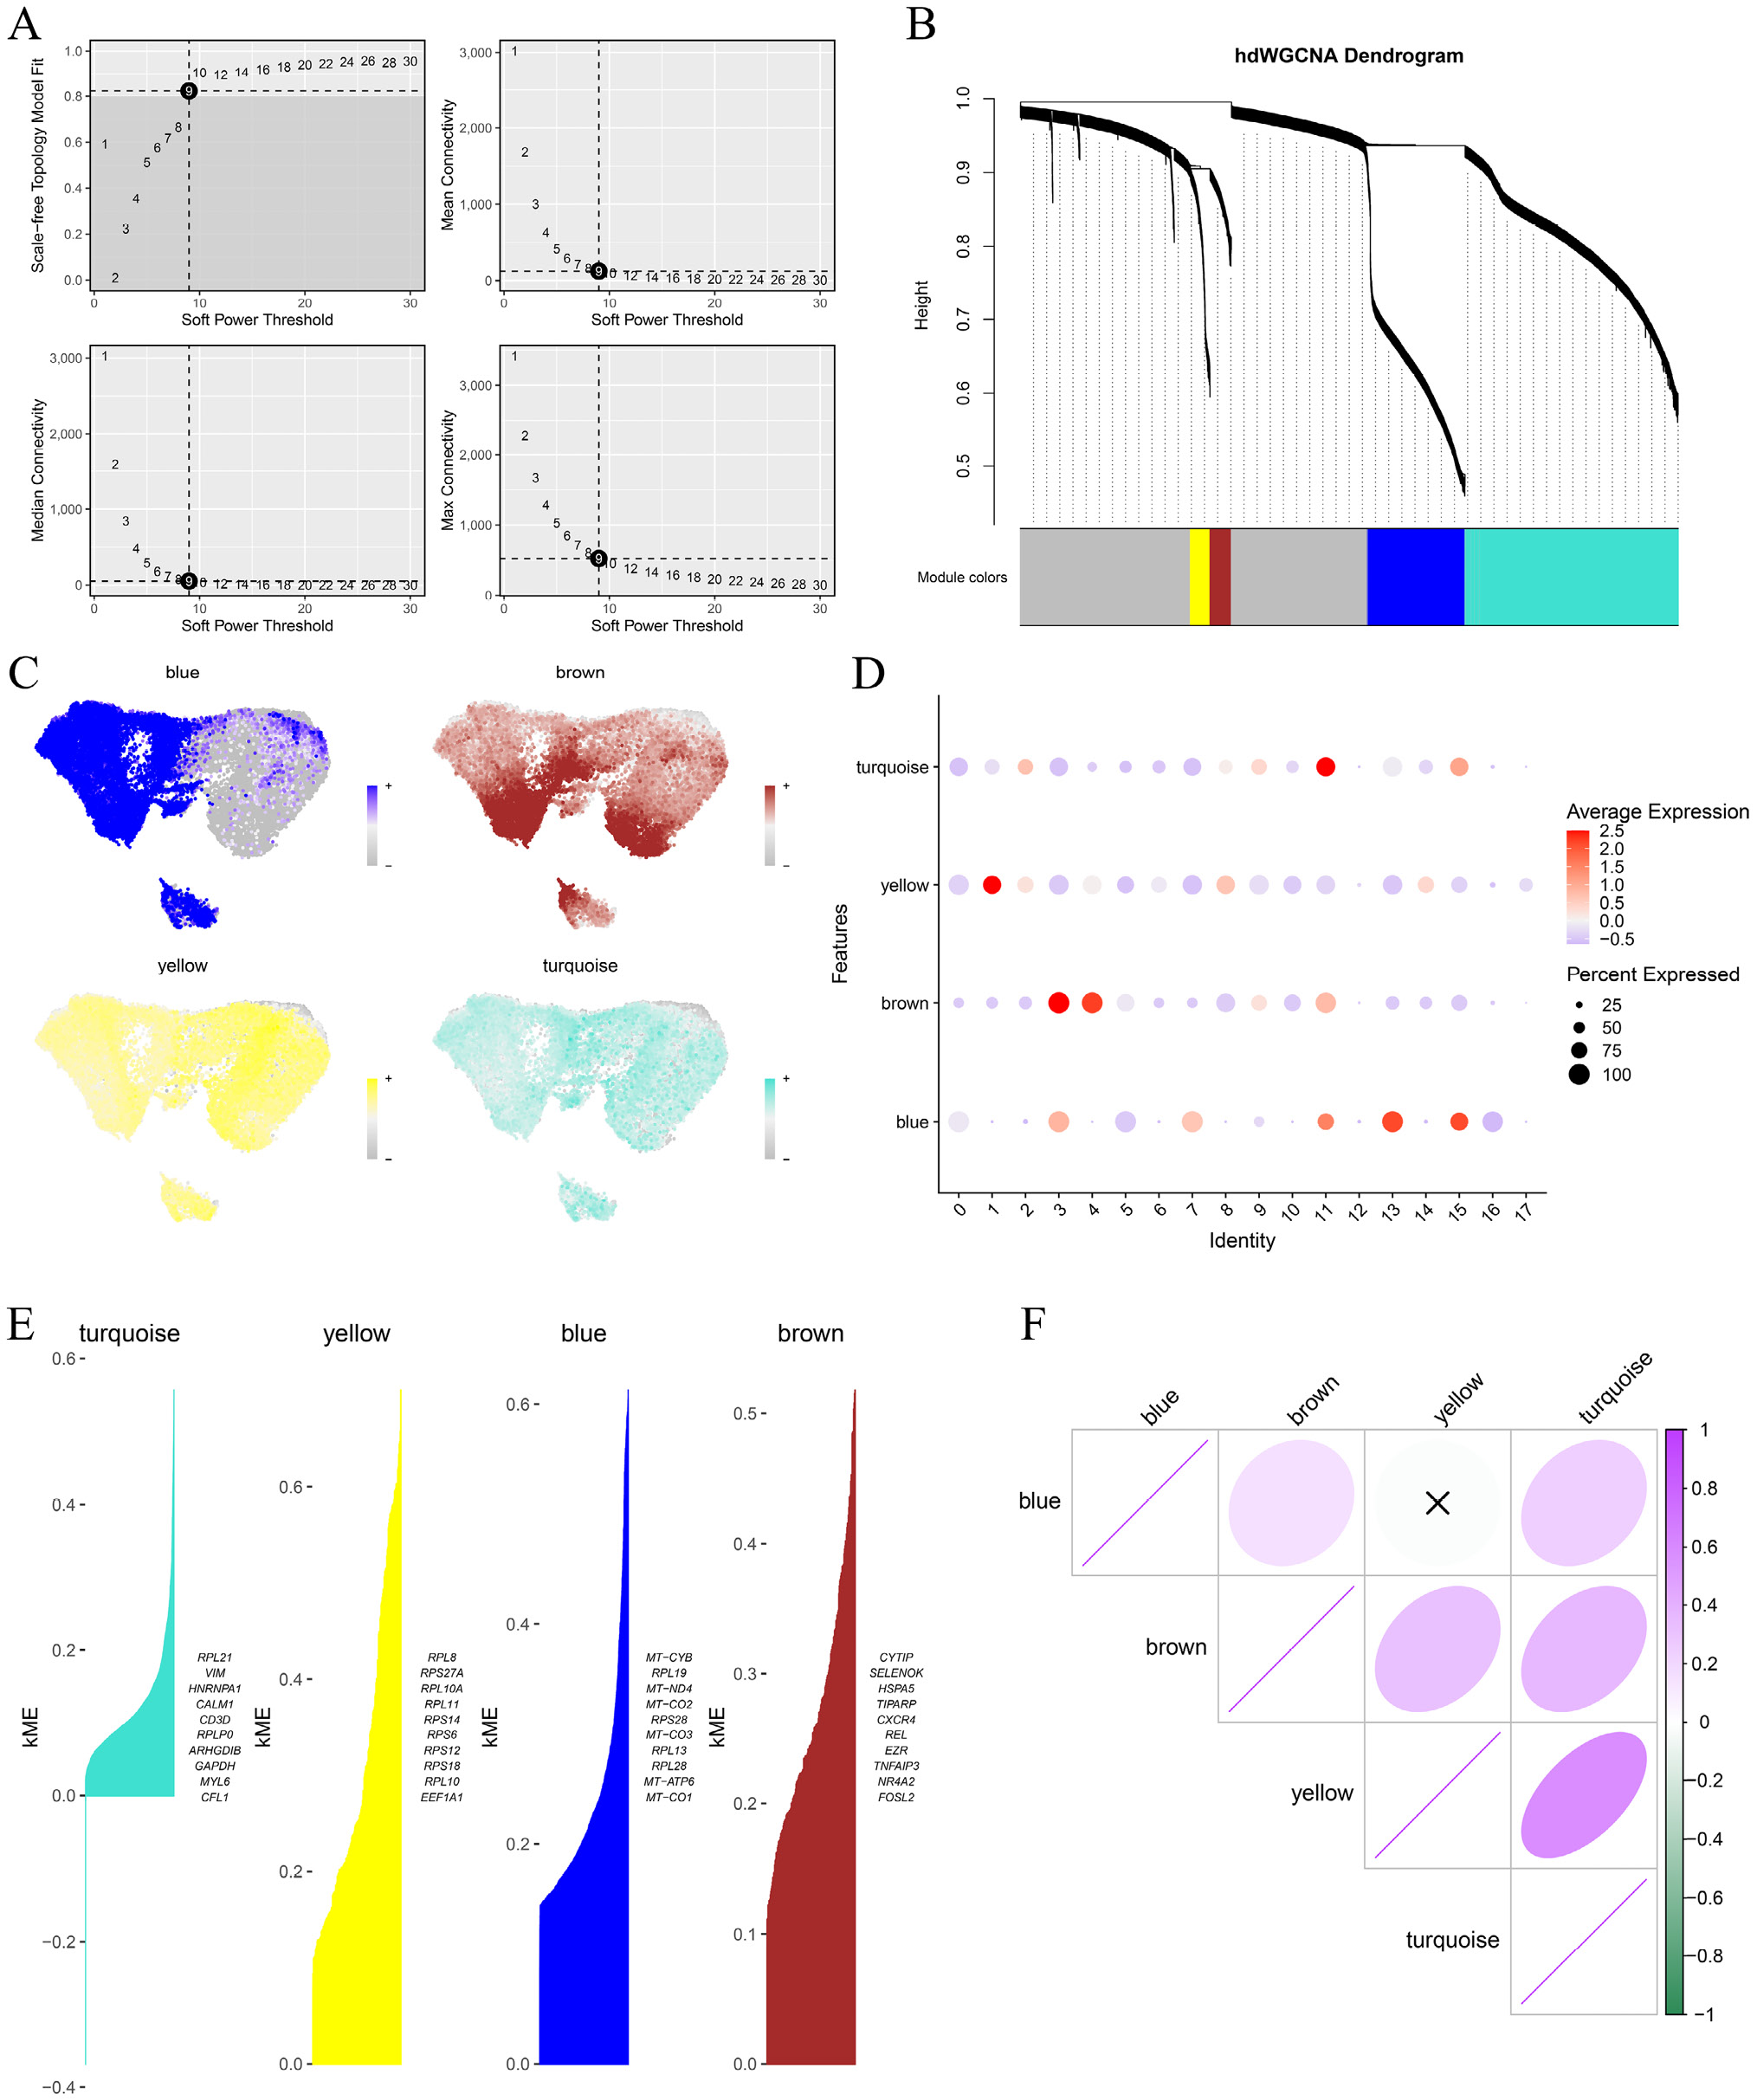
We examined OLP_T cells using hdWGCNA. A power value of 9 was selected after considering the scale-free topology model fit, median connectivity, and mean connectivity (Figure 2A). Four modules were identified (Figure 2B). The blue and brown modules showed specific expression in OLP_T cells (Figure 2C), with a positive correlation observed between the modules (Figure 2D). Hub genes, including CYTIP, RPL19, SELENOK, RPS28, FOSL2, and CXCR4, were identified (Figure 2E). Module correlations are shown in Figure 2F.
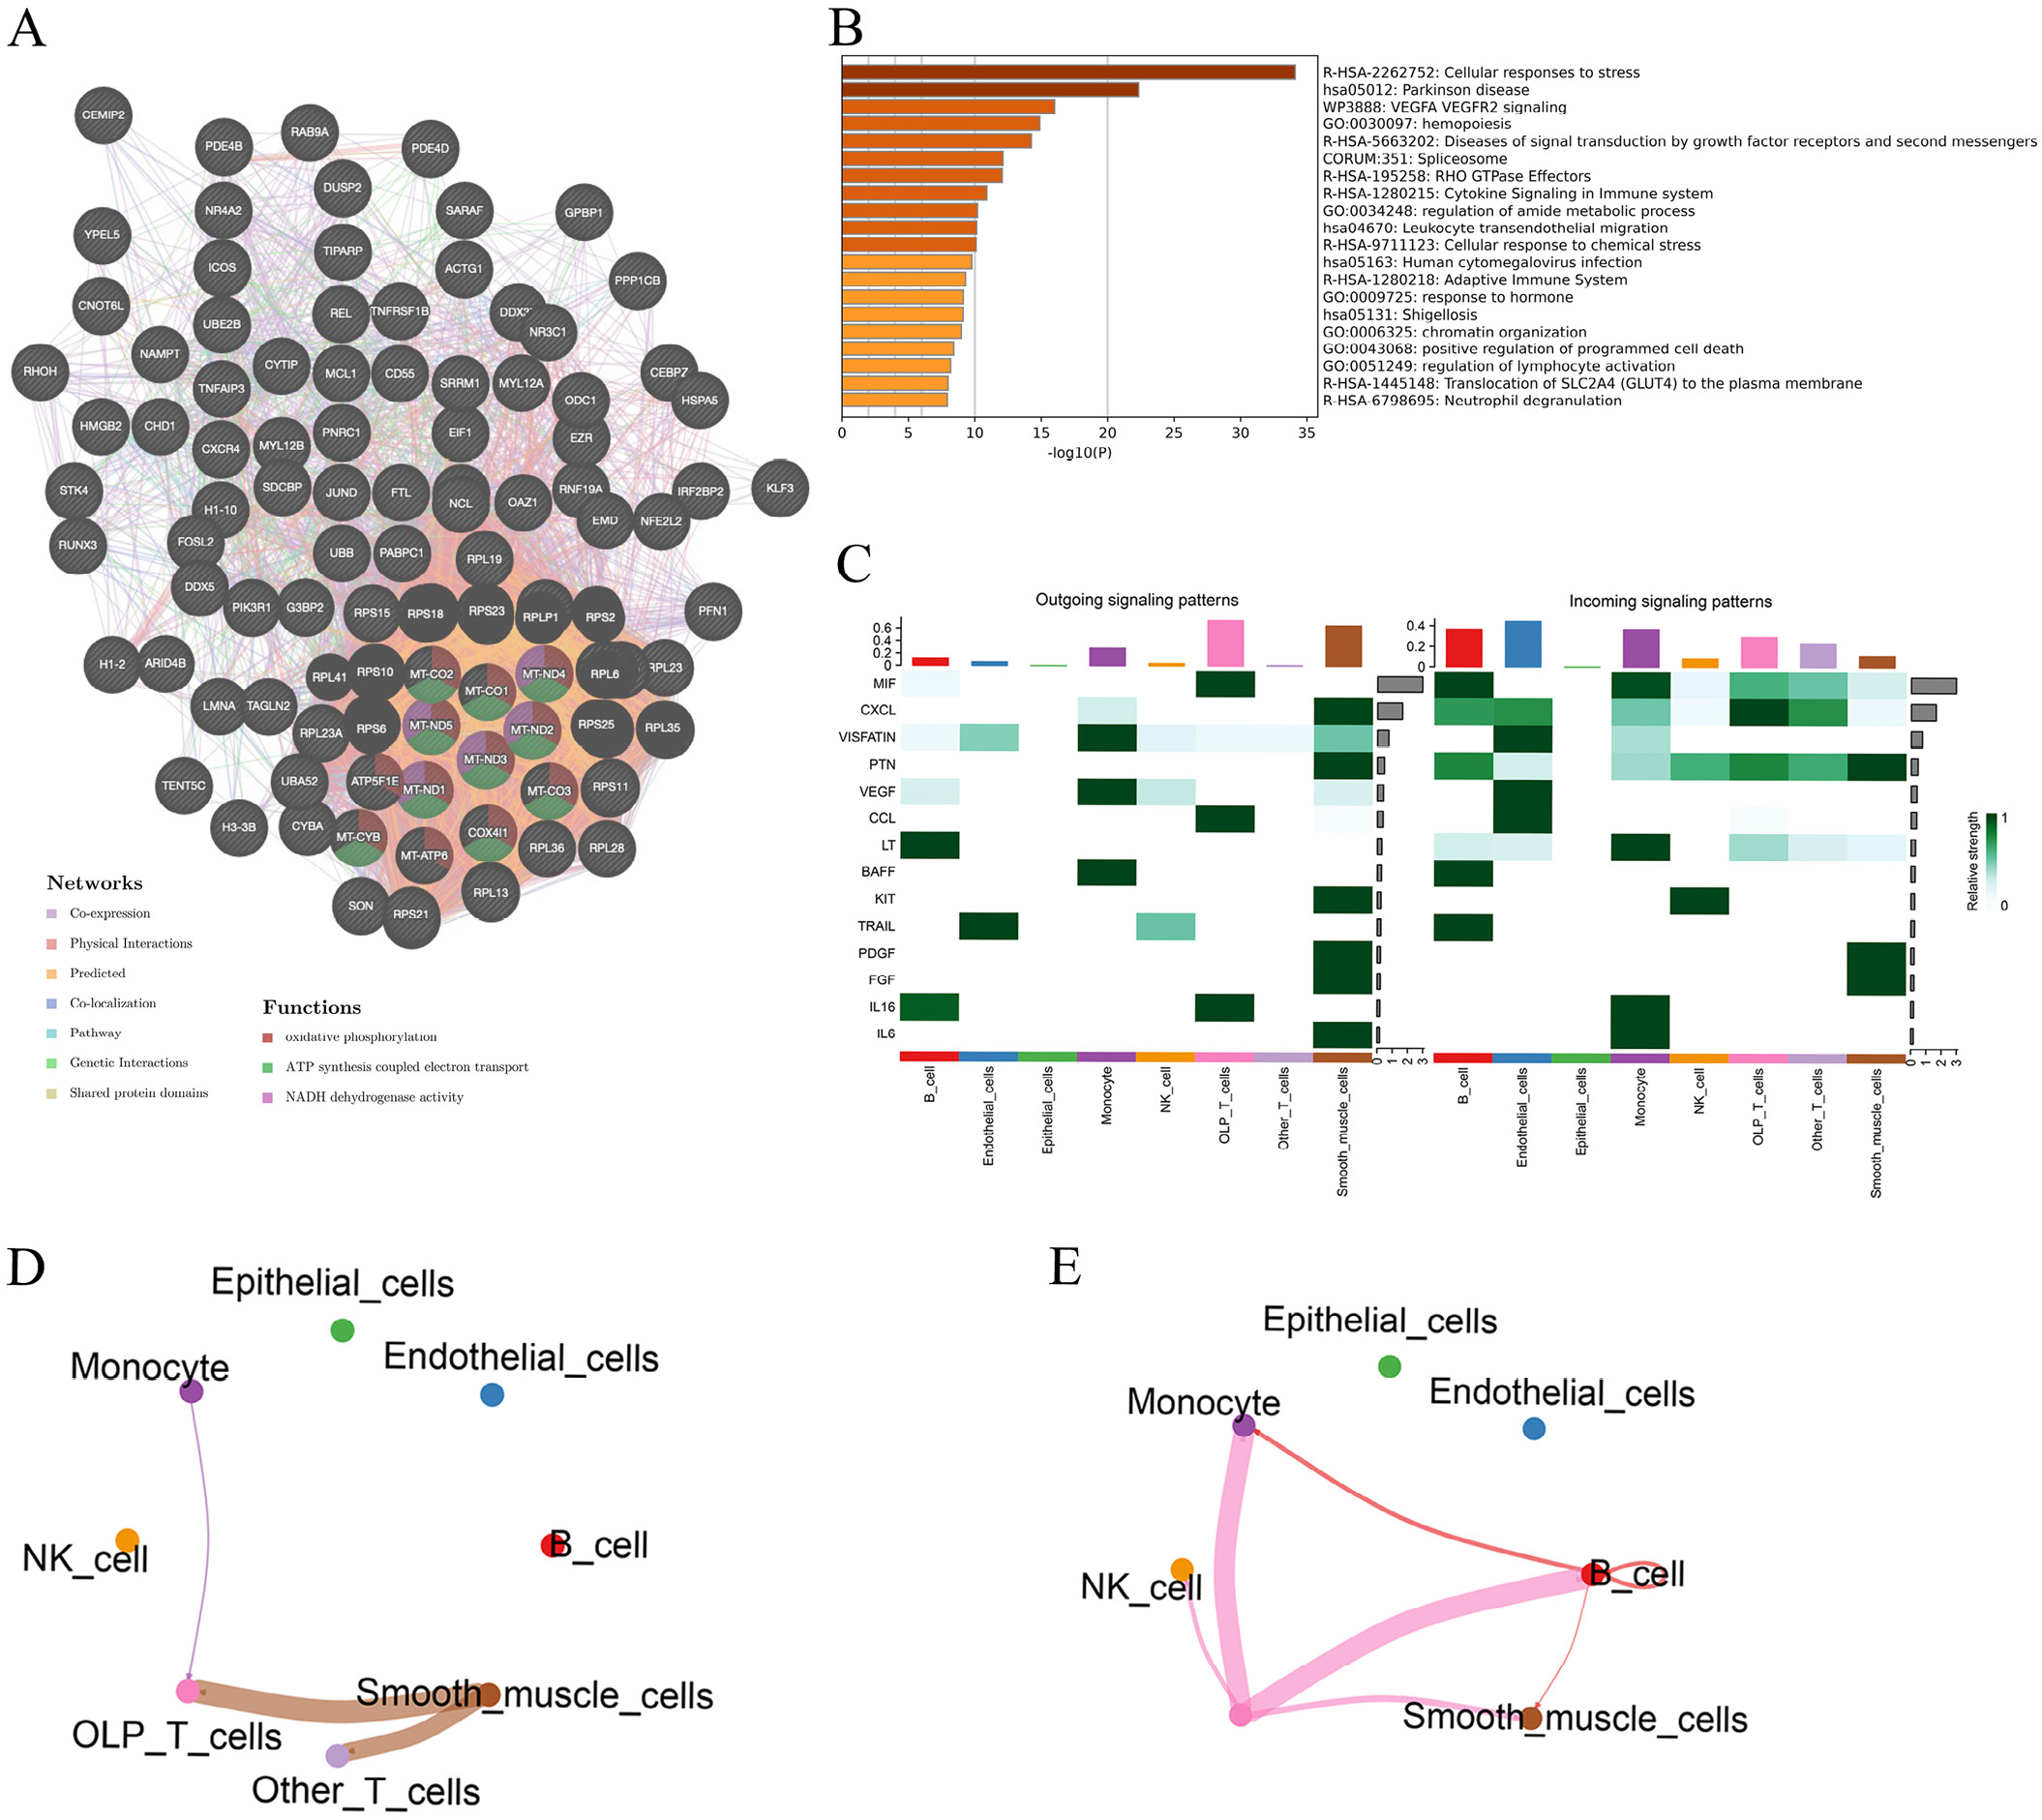
Gene enrichment analysis revealed that the blue and brown module genes were primarily involved in oxidative phosphorylation, adenosine triphosphate (ATP) synthesis coupled with electron transport, and nicotinamide adenine dinucleotide (NADH) dehydrogenase activity (Figure 3A). KEGG enrichment analysis showed that these genes participated in cellular responses to stress, implying a strong association with oxidative stress (Figure 3B). This association between CEBPZ and oxidative stress is particularly relevant because oxidative stress drives inflammatory responses in chronic diseases such as OLP through the production of reactive oxygen species (ROS), which can damage cellular components and perpetuate the inflammatory cycle. Further analysis of cell–cell communication confirmed strong interactions between OLP_T cells and B cells and monocytes, particularly through the MIF signaling pathway (Figure 3C–E; Supplementary Fig. 4A). OLP_T cells demonstrated higher signal transmission than other cell types, except in the CXCL signaling pathway (Supplementary Fig. 4B,C), where OLP_T cells were the most potent signal receivers.
Pseudotime analysis reveals early developmental stages of OLP_T cells
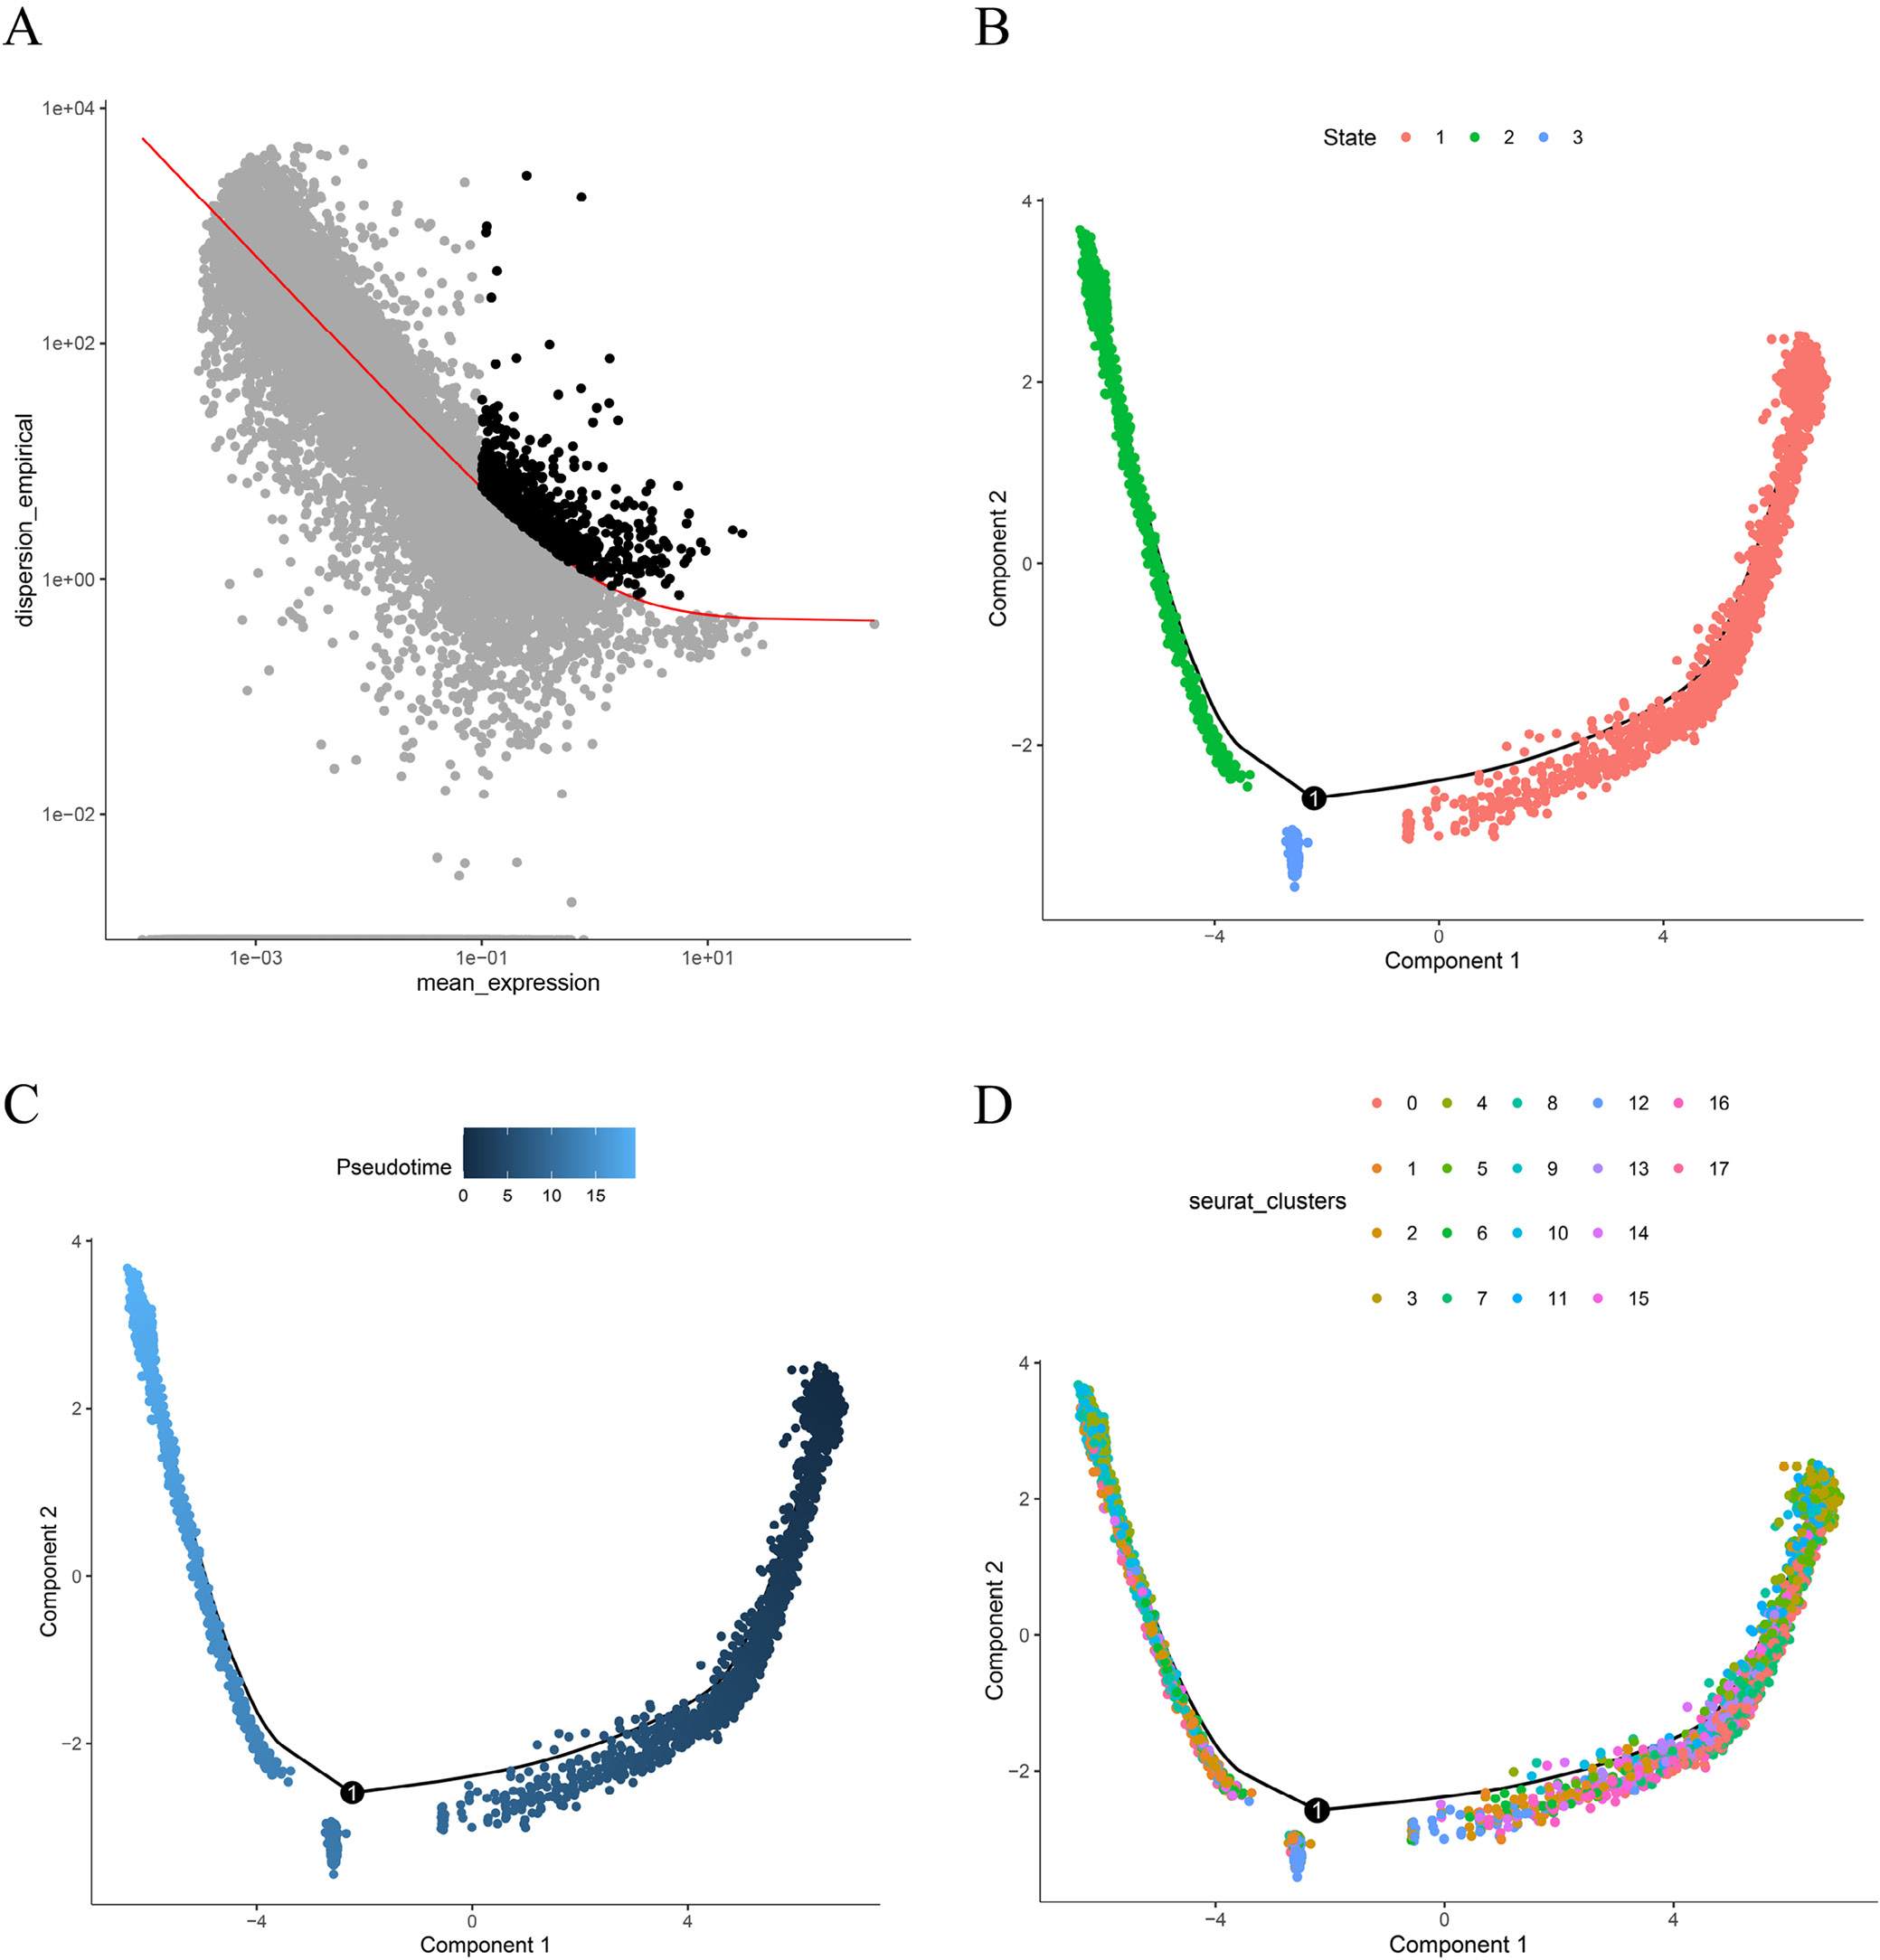
Pseudotime analysis revealed that OLP_T cells (clusters 0, 3, 5, 7, 13, and 15) were predominantly in stages 1 or 2 of T-cell development (Figure 4). This finding suggests that the pathological milieu of the OLP LP may exert an educational effect on OLP_T cells, potentially priming them toward a pro-inflammatory phenotype early in their developmental trajectory. The enrichment of OLP_T cells in early developmental stages contrasts with the more differentiated state of T cells in normal tissues, supporting the hypothesis that the OLP microenvironment actively shapes T-cell differentiation toward pathogenic phenotypes.
Development of a machine learning diagnostic model based on OLP_T cell-specific genes
The LASSO regression analysis reduced the candidate genes to 9: SRRM1, RPS11, CEBPZ, RAB9A, KLF3, CNOT6L, RPL18, ARID4B, and IRF2BP2 (Figure 5A,B). The UMAP diagram in Supplementary Fig. 5 displays the differential expression of these 9 genes between normal and OLP tissues. These selected genes were incorporated into multiple ML models, including support vector machine (SVM), naïve Bayes, K-nearest neighbors (KNN), linear discriminant analysis (LDA), and XGBoost. GSE52130 served as the training set and GSE38616 served as the validation set. Model performance was assessed using 10 iterations of five-fold cross-validation. Logistic regression (Logreg), Adaptive Best Subset Selection (ABESS), and LDA showed balanced precision and sensitivity in differentiating OLP tissues from normal tissues (Figure 5C,D). The final ML framework included these 3 techniques, which demonstrated good predictive accuracy in the external validation set (area under the ROC curve (AUC) = 0.745, 0.694, and 0.653, respectively; Supplementary Fig. 6A–C).
Oxidative stress genes in OLP_T cells correlate with immune profiles and enable OLP patient subtyping
Using non-negative matrix factorization (NMF) based on oxidative stress genes, patients with OLP were stratified into 2 subgroups to investigate the clinical significance of these genes in patient classification (Figure 6A). The consensus matrix heatmap displayed OLP patient subtypes when k = 2 (Figure 6B). Further analysis at the bulk RNA-seq level revealed strong associations between immune infiltration and patient heterogeneity.
Using CIBERSORTx to generate an OLP-specific signature derived from scRNA-seq data, we determined the abundance of cellular components in the OLP LP and assessed correlations with OLP_T-specific oxidative stress gene expression patterns. Most of these genes showed strong associations with different cell types, suggesting their involvement in modulating the OLP microenvironment. Notably, most oxidative stress genes specific to OLP_T exhibited robust positive correlations with lymphocyte infiltration (Figure 6C). Subtype 2 showed stronger lymphocyte activation (Figure 6D) and higher proportions of most immune cell populations (Supplementary Fig. 7A), further supporting stronger immune activation in this subtype.
Establishment of the gene–immune convolutional neural network model
Considering the established relationship between the immunological landscape and oxidative stress genes in OLP_T cells, we developed a gene–immune CNN classifier to create a general diagnostic model while minimizing batch effects. We generated a unique gene–immune heatmap (9 units wide × 10 units long), in which the value of each square for a given OLP patient represents the proportion of a specific immune cell divided by the expression level of the indicated gene (Figure 7A). GSE52130 served as the training set, and GSE38616 served as the validation set. After 300 epochs of training (Figure 7B), the CNN model demonstrated strong predictive accuracy in both datasets (Figure 7C,D; training AUC = 1.000, testing AUC = 0.735), suggesting potential for broader applications in OLP diagnosis.
SMR analysis identifies OLP-related gene targets
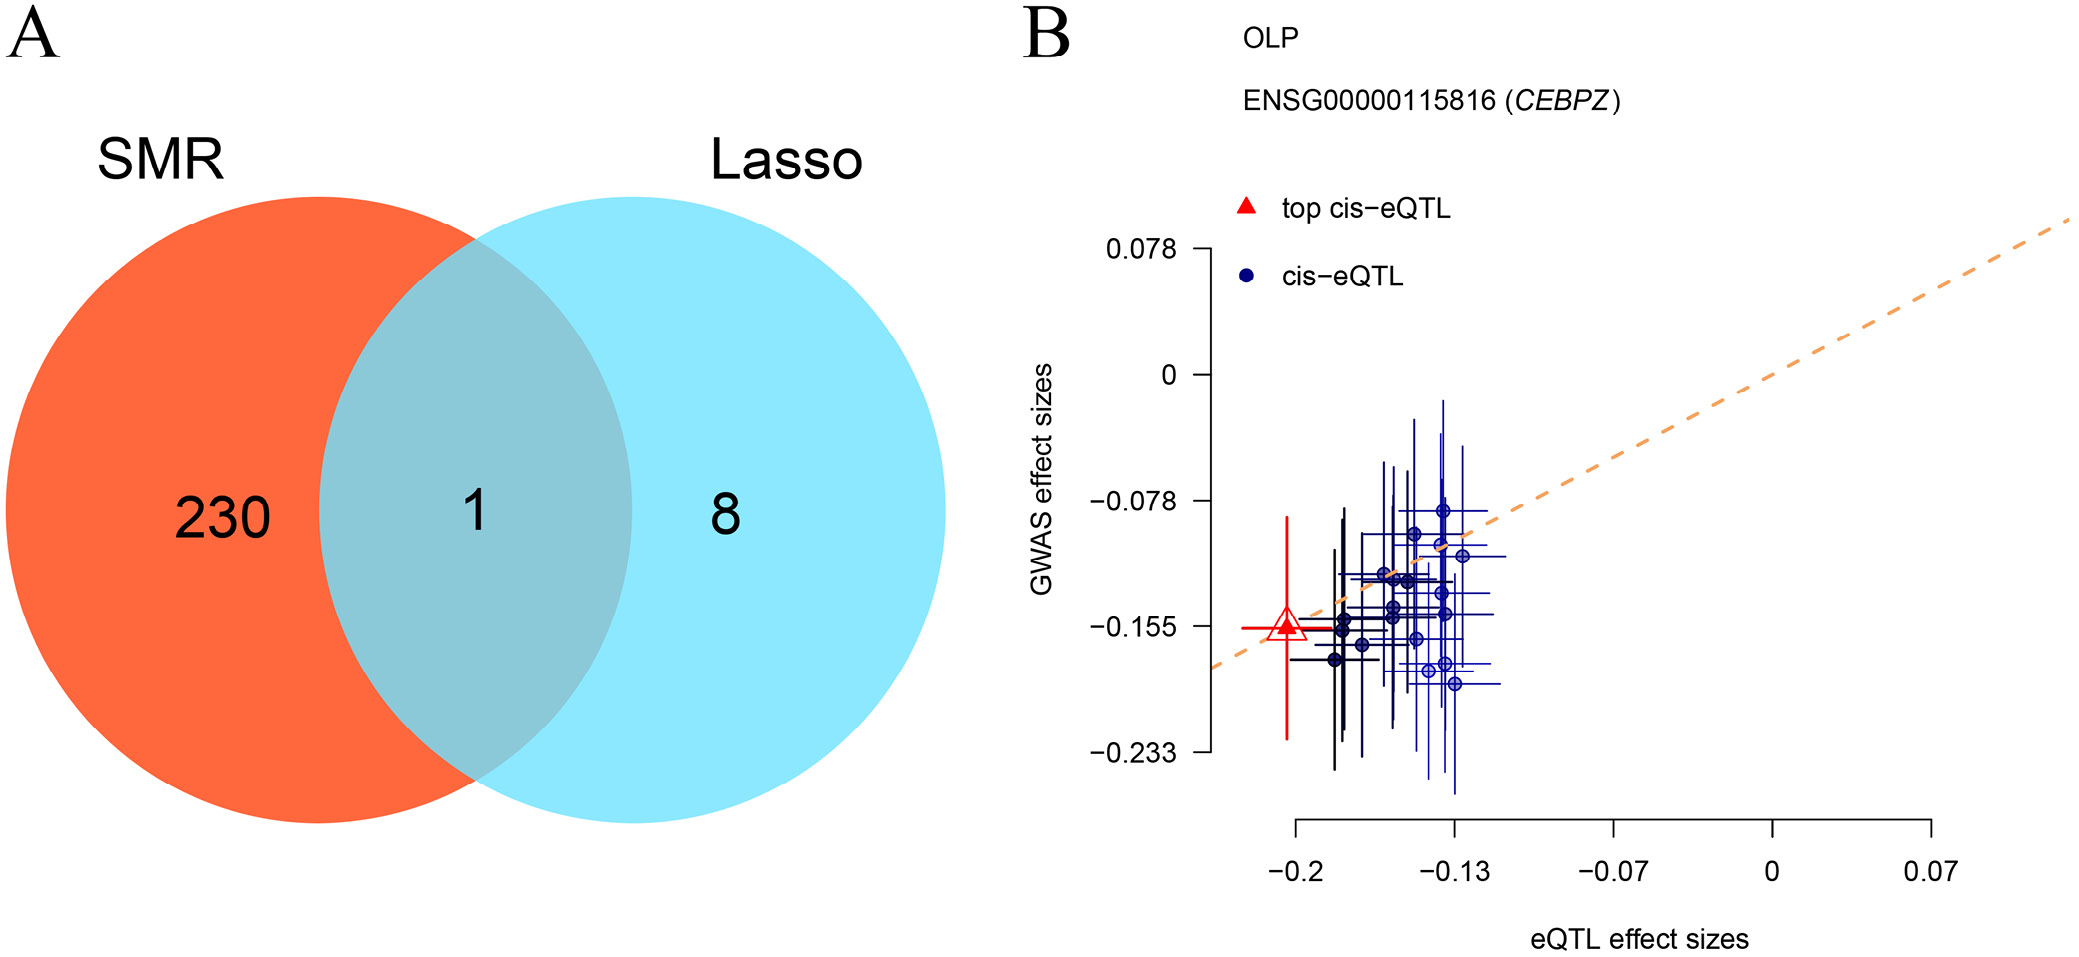
SMR analysis of GWAS and eQTL data identified regulatory genes causally associated with OLP using significance thresholds of PSMR < 0.05 and PHEIDI > 0.05. A total of 231 genes were found to be pleiotropically linked to OLP (Supplementary Table 1). Among these, the top 10 genes are highlighted because of their significant associations (Table 1). Notably, CEBPZ was the only gene that overlapped with the LASSO regression results (Figure 8A). CCAAT/enhancer-binding proteins (CEBPs), including CEBPZ, have been reported to regulate cytokine production and macrophage function, thereby enhancing inflammatory responses.44, 45 Our findings showed a correlation between OLP risk and increased CEBPZ expression (odds ratio (OR) = 1.057, 95% confidence interval (95% CI): 1.013–1.102, p = 0.010; Figure 8B).
We acknowledge that esophageal mucosa eQTLs served as proxies for oral epithelium because of the lack of adequately powered oral tissue eQTL data. Although both tissues share squamous epithelial characteristics, tissue-specific regulatory mechanisms may differ. Future studies should validate these findings using oral tissue-specific eQTLs. Sensitivity analyses using whole-blood eQTLs or other immune-relevant tissues would strengthen causal inferences.
Expression levels of SMR outcome gene in oral lichen planus
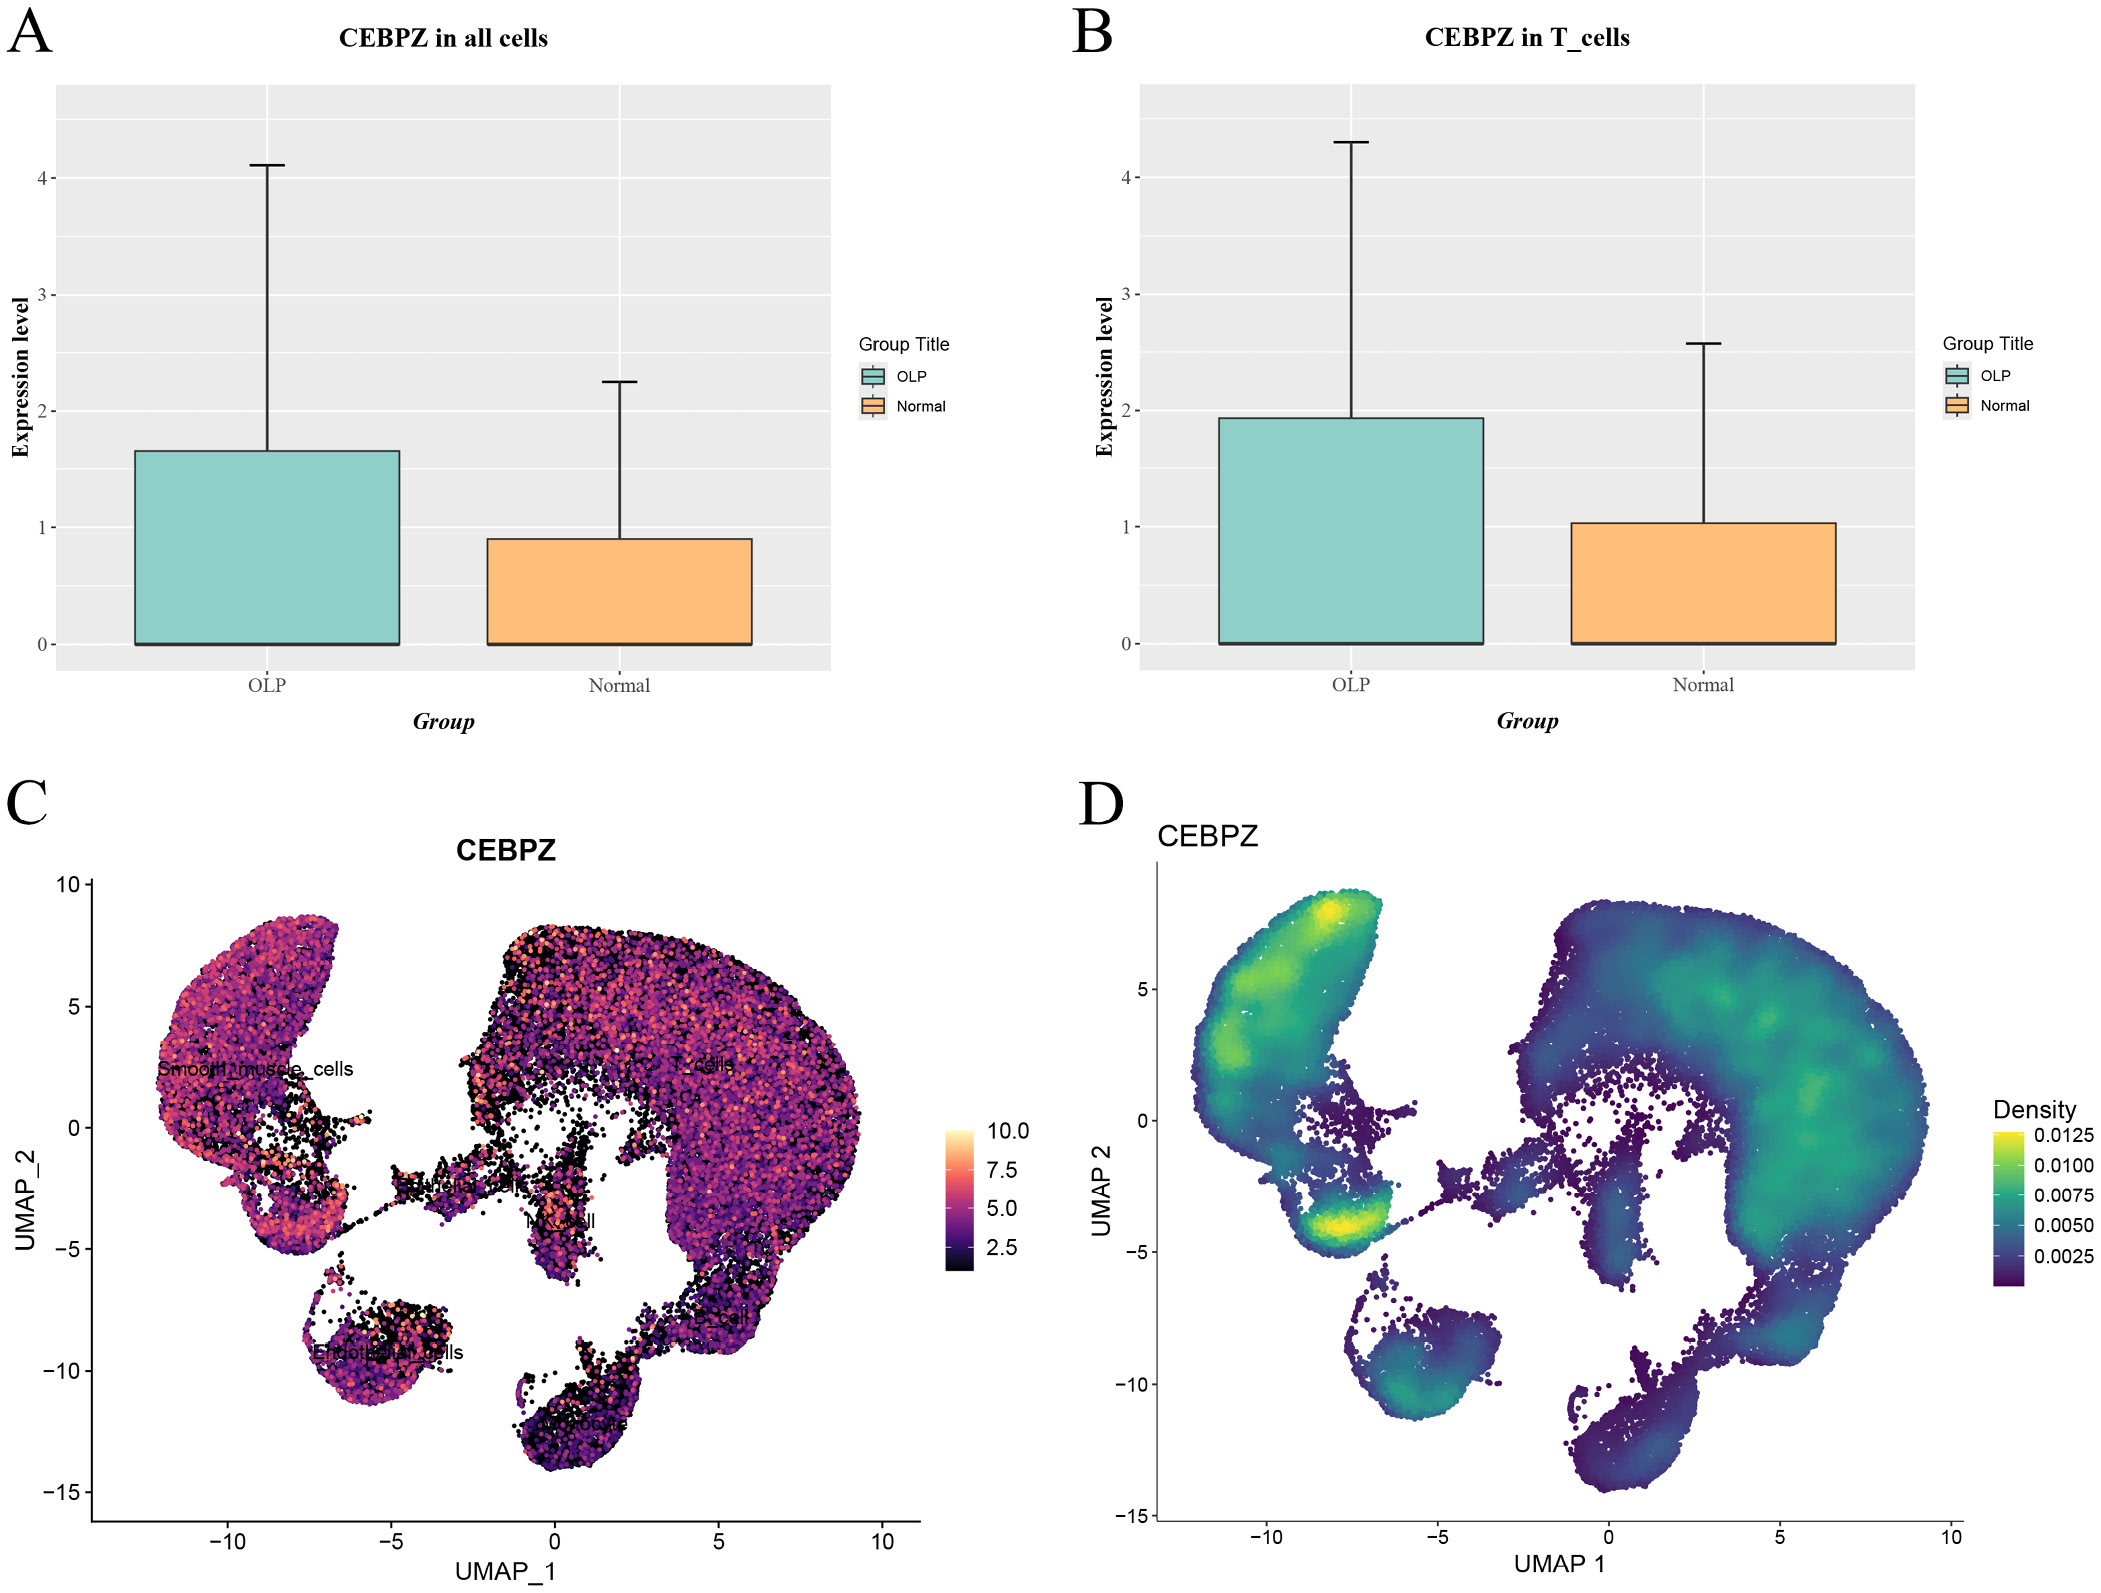
CEBPZ expression was significantly higher in OLP patients than in healthy individuals across all cells and T cells (Figure 9A,B). The UMAP plot and enrichment analysis demonstrated CEBPZ expression across all OLP cell populations (Figure 9C,D). Expression was increased in T cells, epithelial cells, and smooth muscle cells (Supplementary Fig. 8A). Unsupervised developmental inference analysis indicated that CEBPZ expression increased with cell differentiation (Supplementary Fig. 8B–D).
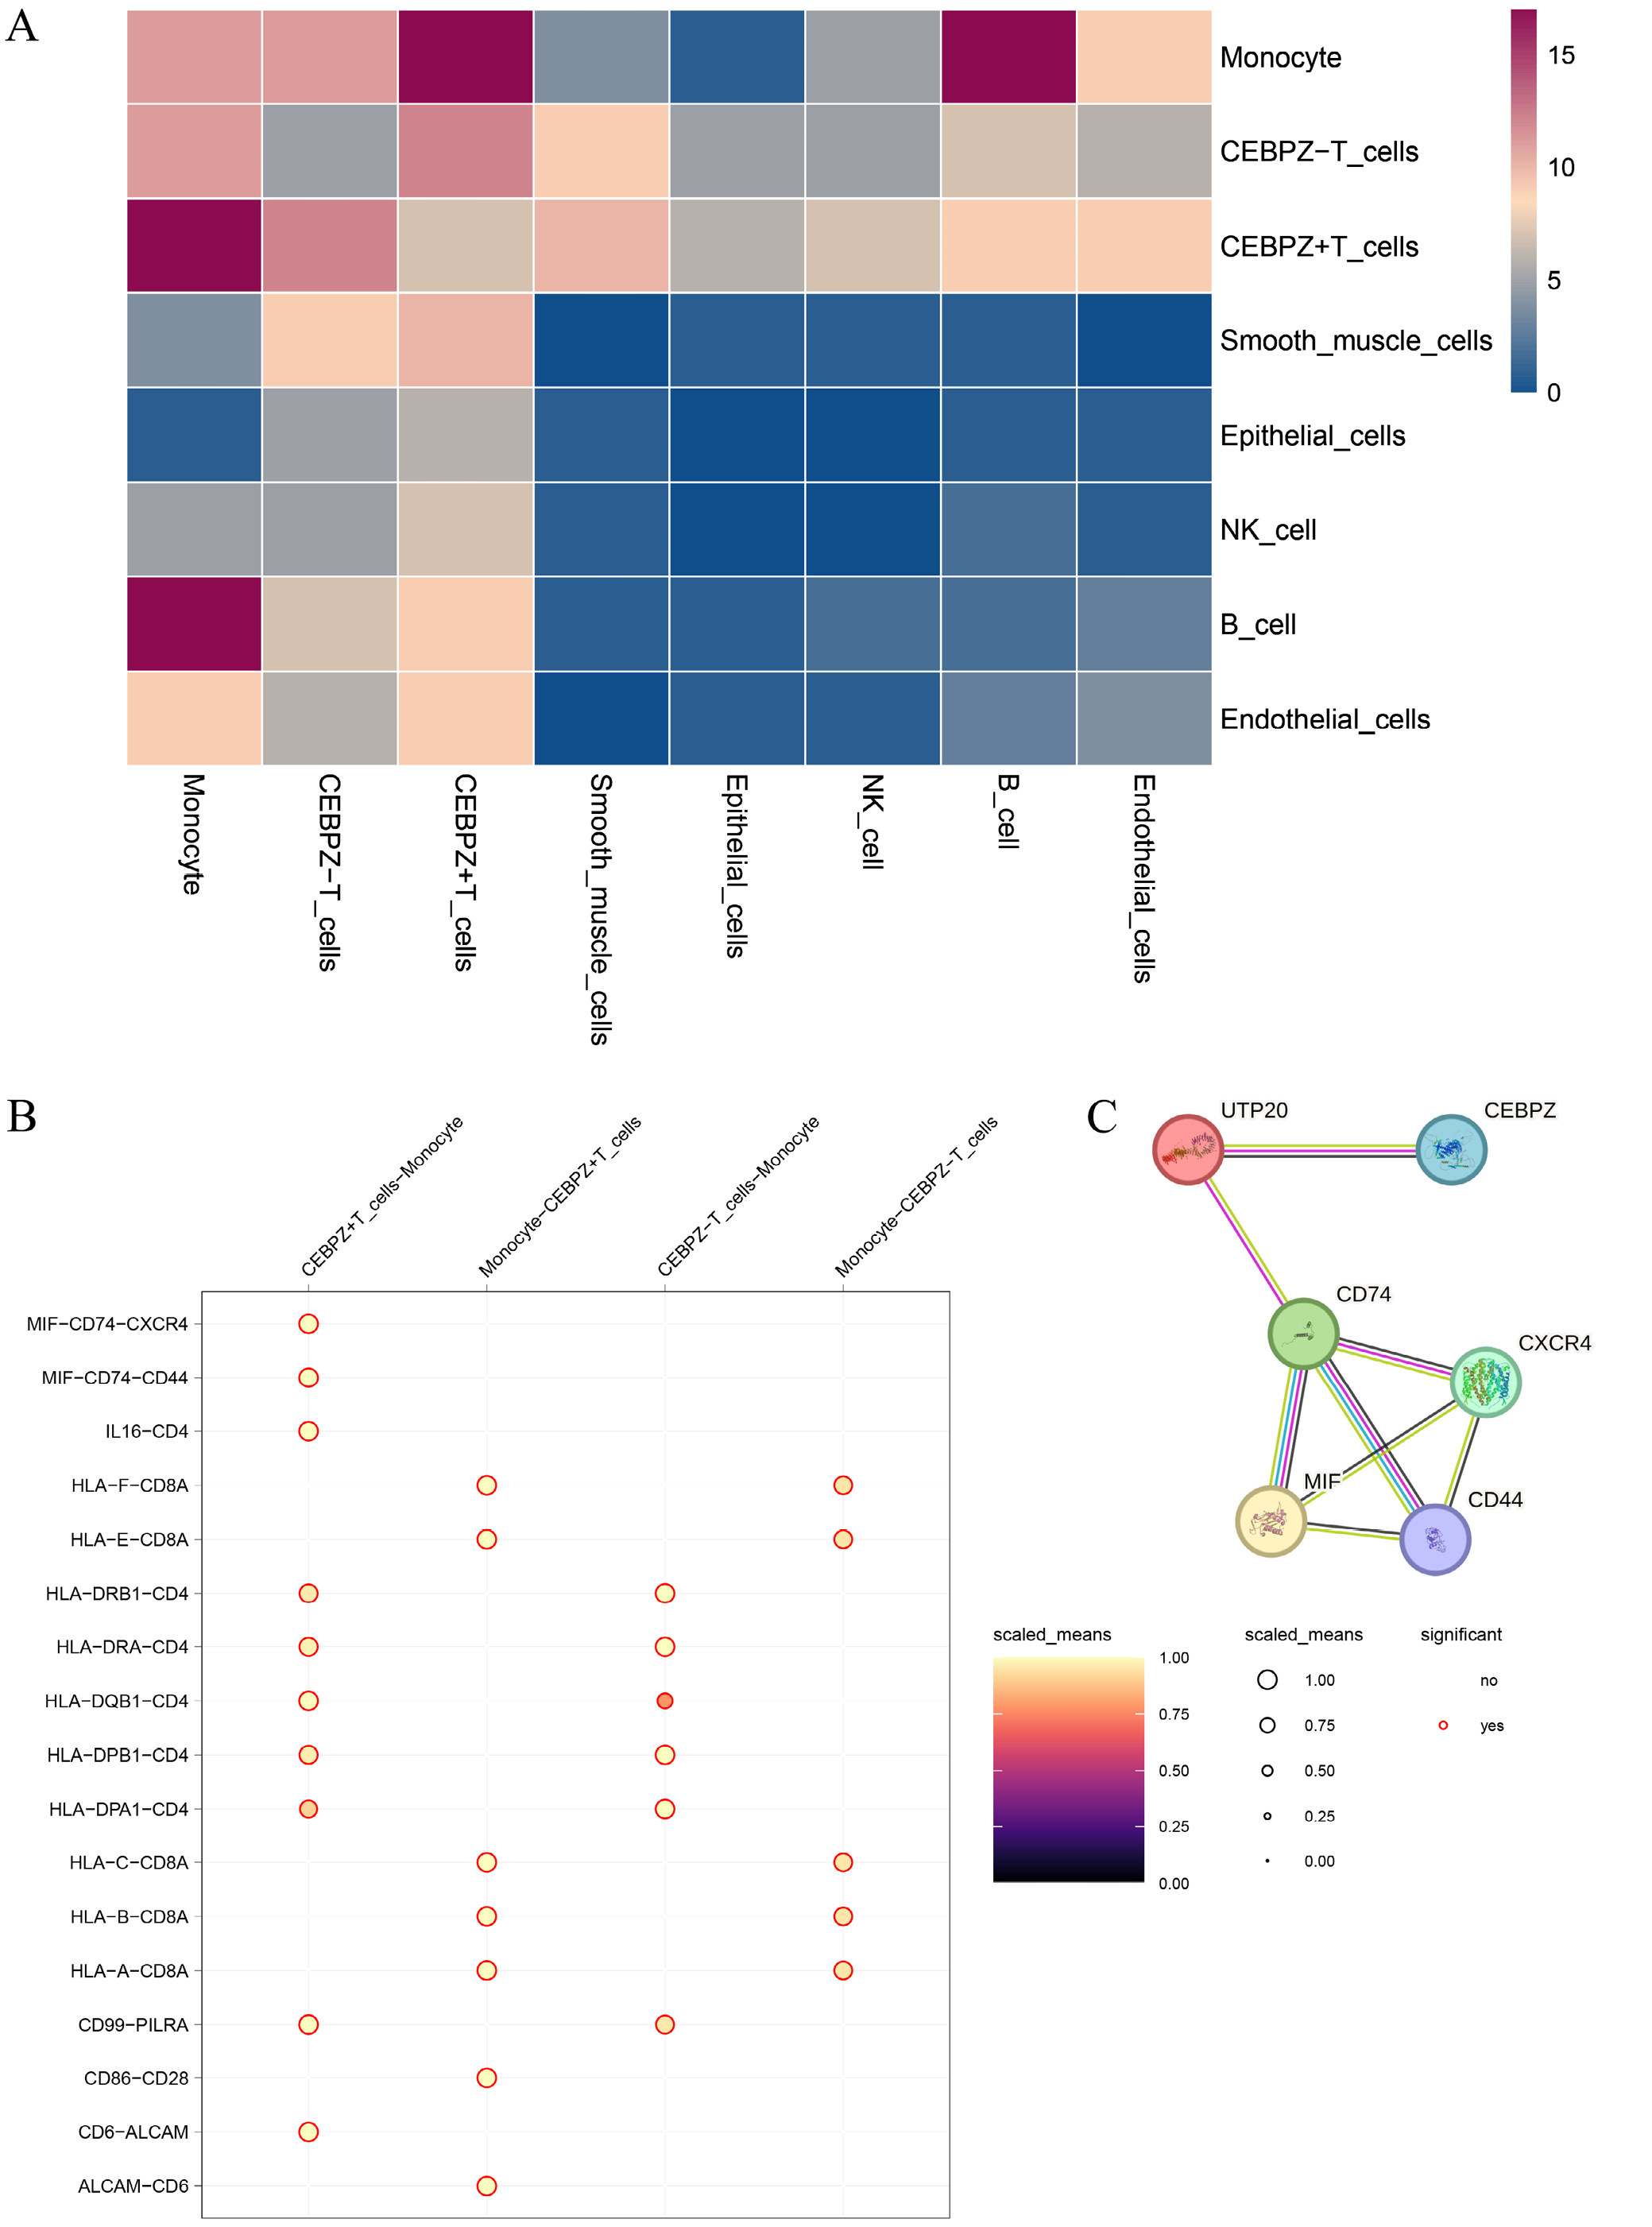
Given that OLP is a chronic T-cell-mediated inflammatory disease, and consistent with our previous analyses, we focused on CEBPZ expression in T cells. We divided T cells into CEBPZ+ (high-expression) and CEBPZ− (low-expression) groups according to their expression levels. Using CellChat to calculate receptor–ligand interaction strength, we found that signaling pathways between CEBPZ+ T cells and monocytes were significantly enhanced compared with those between CEBPZ− T cells (Figure 10A). The enhanced interactions involving “MIF-(CD74+CXCR4)” and “MIF-(CD74+CD44)” were consistent with the enhanced communication observed in OLP_T cells through MIF-related pathways (Figure 10B). According to recent studies, MIF, CD74, CXCR4, and CD44 are associated with inflammation. MIF mediates the chronicity and potential malignant transformation of OLP. A protein–protein interaction (PPI) network generated using the STRING database identified interactions among CEBPZ, MIF, CD74, CD44, and CXCR4 (Figure 10C).
Discussion
Oral lichen planus is an immune-mediated inflammatory disease that primarily affects the tongue, gingiva, and buccal mucosa. Research indicates that 1.63% of OLP cases develop into OSCC within 7 years, leading the World Health Organization (WHO) to classify OLP as a potentially malignant condition. Early diagnosis and ongoing monitoring are crucial for the management of OLP. However, current diagnostic methods lack precision and are noninvasive.46 The development of high-throughput sequencing technology has enabled rapid and precise analysis of gene expression differences between healthy and diseased tissues.47 However, using bulk sequencing techniques to determine cellular composition and the involvement of specific subpopulations in diseased tissues remains challenging.48 Single-cell sequencing technology addresses these limitations by enabling detailed analysis of cellular heterogeneity and communication within diseased tissues.49 SMR analysis helps identify disease-associated genes while minimizing confounding factors and providing important information regarding causality, thereby offering a dynamic view of disease progression.50
Studies have indicated that OLP has a major immunological component.16 The current study found TNF-α expression throughout the subepithelial T-cell infiltrate and TNF receptor 1 (TNFR1) expression in basal and suprabasal epithelial cells in OLP. Oral lichen planus is characterized by a balance between pro-inflammatory (IFN-γ, TNF-α) and immunosuppressive (transforming growth factor beta 1 (TGF-β1)) cytokines. Insufficient immunosuppression associated with decreased TGF-β1 activity may promote hyperactive immune responses in OLP. Conversely, high TGF-β1 activity may impair antitumor immunity and thereby promote OLP carcinogenesis.51, 52
Corticosteroids, used as first-line treatment for OLP, primarily suppress the CD4+ Th-cell subgroup and downregulate NF-κB (nuclear factor kappa-light-chain-enhancer of activated B cells) signaling, thereby reducing IFN-γ levels and exerting immunomodulatory effects.53, 54 Tacrolimus, a second-line treatment, inhibits cytokine production and T-cell activation, reduces Treg proliferation, inhibits mast cell activation, and affects Langerhans cell activity.55, 56, 57 Studies based on the immune landscape of OLP have identified potential therapeutic targets, including β-integrins and ICAM-1 inhibitors for controlling adhesion molecule expression, RANTES inhibitors for stabilizing mast cells, Fas cell surface death receptor (FAS) or Fas ligand (FASL) inhibitors, and TNF-α receptor inhibitors for reducing keratinocyte apoptosis.58, 59 However, further research is required before these approaches can be translated into clinical practice based on the OLP immune microenvironment.
Based on oral scRNA-seq transcriptomic features, we developed a 9-gene classifier that may assist in OLP diagnosis and highlights the potentially important role of specific T-cell subsets characterized by pronounced oxidative stress in OLP pathophysiology. The expression patterns of these 9 genes correlate with oxidative stress, inflammation-related pathways, and treatment-related responses in T cells.2, 60, 61 The application of scRNA-seq has revealed the heterogeneity of immune cells in OLP and their interactions with epithelial cells, which is crucial for understanding disease progression and developing targeted therapies.
CCAAT/enhancer-binding proteins including CEBPA, CEBPB, CEBPD, CEBPE, CEBPG, and CEBPZ, play important roles in physiological and pathological processes.62, 63, 64 CEBPZ functions as either an activator or a suppressor depending on cellular context and is associated with programmed cell death, cell-cycle arrest, and cellular stress.65 Strong correlations have been reported between CEBPZ expression and methylation in acute myeloid leukemia,66 and overexpression has also been observed in esophageal squamous cell carcinoma.62 Nearly all 9 LASSO-selected genes were strongly associated with oxidative stress, inflammation, and OLP pathogenesis. The intrinsic OLP score was markedly elevated according to single-sample Gene Set Enrichment Analysis (ssGSEA) based on genes from the blue and brown modules, suggesting worsening immunological dysregulation and inflammation within the oral microenvironment. Strong correlations between the expression patterns of blue- and brown-module genes and immune infiltration suggest that these genes may participate in immune regulation.
By combining SMR and scRNA-seq analyses, we found that high CEBPZ expression is associated with activated MIF pathway signaling between T cells and monocytes. CEBPZ may influence the expression of MIF, CXCR4, CD74, and CD44 through the MIF pathway, creating a feed-forward loop that perpetuates inflammation and oxidative stress in the OLP microenvironment. Studies have demonstrated that T-cell-mediated inflammation in OLP is associated with increased TRIM21 expression.67 TRIM21 links ubiquitinated NF-κB via K63, thereby activating the NF-κB signaling pathway and promoting inflammation.68 Corticosteroids are first-line therapies that target NF-κB and have considerable therapeutic significance in OLP treatment. T cells may trigger keratinocyte apoptosis through TNF-α binding to TNF receptor 1 (TNFR1), CD95L binding to CD95, or granzyme B entering through perforin-created membrane pores.69, 70, 71 This finding highlights the potential significance of CEBPZ in immune modulation and provides a novel direction for investigating its potential as a therapeutic target or biomarker. While clinical examination and histological assessment remain the preferred approaches for evaluating OLP, molecular diagnostic methods such as oral tissue RNA sequencing may significantly enhance diagnostic accuracy.
The clinical implications of CEBPZ extend beyond diagnosis. CEBPZ expression could potentially guide treatment selection, with high expression indicating patients who may benefit from MIF pathway-targeted therapies or oxidative stress interventions. Integration of CEBPZ into ML models could enable risk stratification and identify patients at higher risk of malignant transformation who require more intensive surveillance.
Limitations of the study
This study has several limitations that should be considered when interpreting the results. First, the analyses relied on publicly available datasets from predominantly European populations, which may lack comprehensive clinical metadata, potentially limiting the generalizability of the findings to other ethnic groups. Second, the cross-sectional nature of the data restricts the ability to infer temporal changes beyond the genetic associations established through SMR. Third, esophageal mucosa eQTLs served as proxies for oral epithelium; although both tissues share squamous epithelial characteristics, tissue-specific regulatory mechanisms may differ, and future validation using oral tissue-specific eQTLs will be essential. Fourth, experimental validation of identified biomarkers, such as CEBPZ, is needed to confirm their functional roles through in vitro and in vivo studies. Fifth, potential batch effects between different datasets, despite computational correction, may have influenced the results. Finally, ML models require prospective validation in independent, clinically characterized cohorts to assess their real-world applicability. Future studies incorporating longitudinal samples, functional assays, and clinical trials will be essential to strengthen the translational impact.
Conclusions
This study pioneers an integrative genomic approach to unravel the immune-mediated mechanisms of OLP by combining scRNA-seq, SMR, hdWGCNA, and ML. We identified a novel T-cell subpopulation in the OLP LP characterized by heightened oxidative stress and enhanced MIF pathway interactions with monocytes and B cells. CEBPZ emerged as a pivotal biomarker at the intersection of SMR and LASSO analyses, with elevated expression correlating with immune infiltration and OLP pathogenesis. The developed diagnostic models (AUC: 0.653–0.745) offer promising tools for clinical application. These findings deepen our understanding of the molecular landscape of OLP and highlight CEBPZ as a potential therapeutic target, paving the way for precision medicine strategies in OLP.
Supplementary data
The supplementary materials are available at https://doi.org/10.5281/zenodo.18939928. The package contains the following files:
Supplementary Fig. 1. SMR analysis workflow schematic. Step-by-step diagram illustrating the SMR analysis pipeline, including data acquisition, quality control, instrument selection, SMR/HEIDI analysis, and multi-omic integration.
Supplementary Fig. 2. Quality control of the scRNA-seq dataset. UMAP plots showing the GSE211630 dataset before and after quality-control preprocessing.
Supplementary Fig. 3. Signaling pathways in cell–cell communication. Bubble plots highlighting significant signaling pathways involved in cell–cell communication between T-cell subtypes and other cell types, identified using CellChat.
Supplementary Fig. 4. MIF and CXCL signaling pathway analysis. A. Role of T-cell subtypes in the MIF signaling pathway network; B. Role of T-cell subtypes in the CXCL signaling pathway network; C. Scatter plot of outgoing vs incoming interaction strengths across cell types.
Supplementary Fig. 5. Expression of LASSO-selected genes. UMAP plots displaying expression patterns of 9 LASSO-selected genes in OLP and healthy tissues.
Supplementary Fig. 6. External validation of ML models. ROC curves for the Logreg, ABESS, and LDA models in the external validation set GSE38616 (AUC = 0.745, 0.694, and 0.653, respectively).
Supplementary Fig. 7. Immune cell proportions between OLP subtypes. Box plot comparing immune cell composition between Subtype 1 and Subtype 2 across 10 MCP-counter cell types.
Supplementary Fig. 8. CEBPZ expression across cell types and developmental trajectory. A. Dot plot of CEBPZ expression across cell types; B. RNA velocity analysis showing developmental vectors; C. UMAP of T-cell clusters in OLP and normal tissues; D. CEBPZ expression distribution across T-cell clusters.
Supplementary Table 1. Complete SMR analysis results. Excel file containing all 231 genes identified through SMR analysis, together with their corresponding statistical values.
Data Availability Statement
The datasets analyzed in this study are publicly available. Single-cell RNA sequencing data (GSE211630, GSE52130, and GSE38616) were obtained from the GEO database (https://www.ncbi.nlm.nih.gov/geo). GWAS summary data for oral lichen planus were obtained from the FinnGen database (release 8; https://www.finngen.fi). Esophageal mucosa eQTL data were retrieved from the GTEx database (version 8; https://gtexportal.org). Protein interaction data were obtained from the STRING database (https://string-db.org). The complete results of the SMR analysis, including 231 genes, are provided in Supplementary Table 1. All data were processed in accordance with the guidelines and policies of the respective repositories. No new data were generated in this study.
Consent for publication of personal information
Not applicable.
Use of AI and AI-assisted technologies
Not applicable.