



Abstract
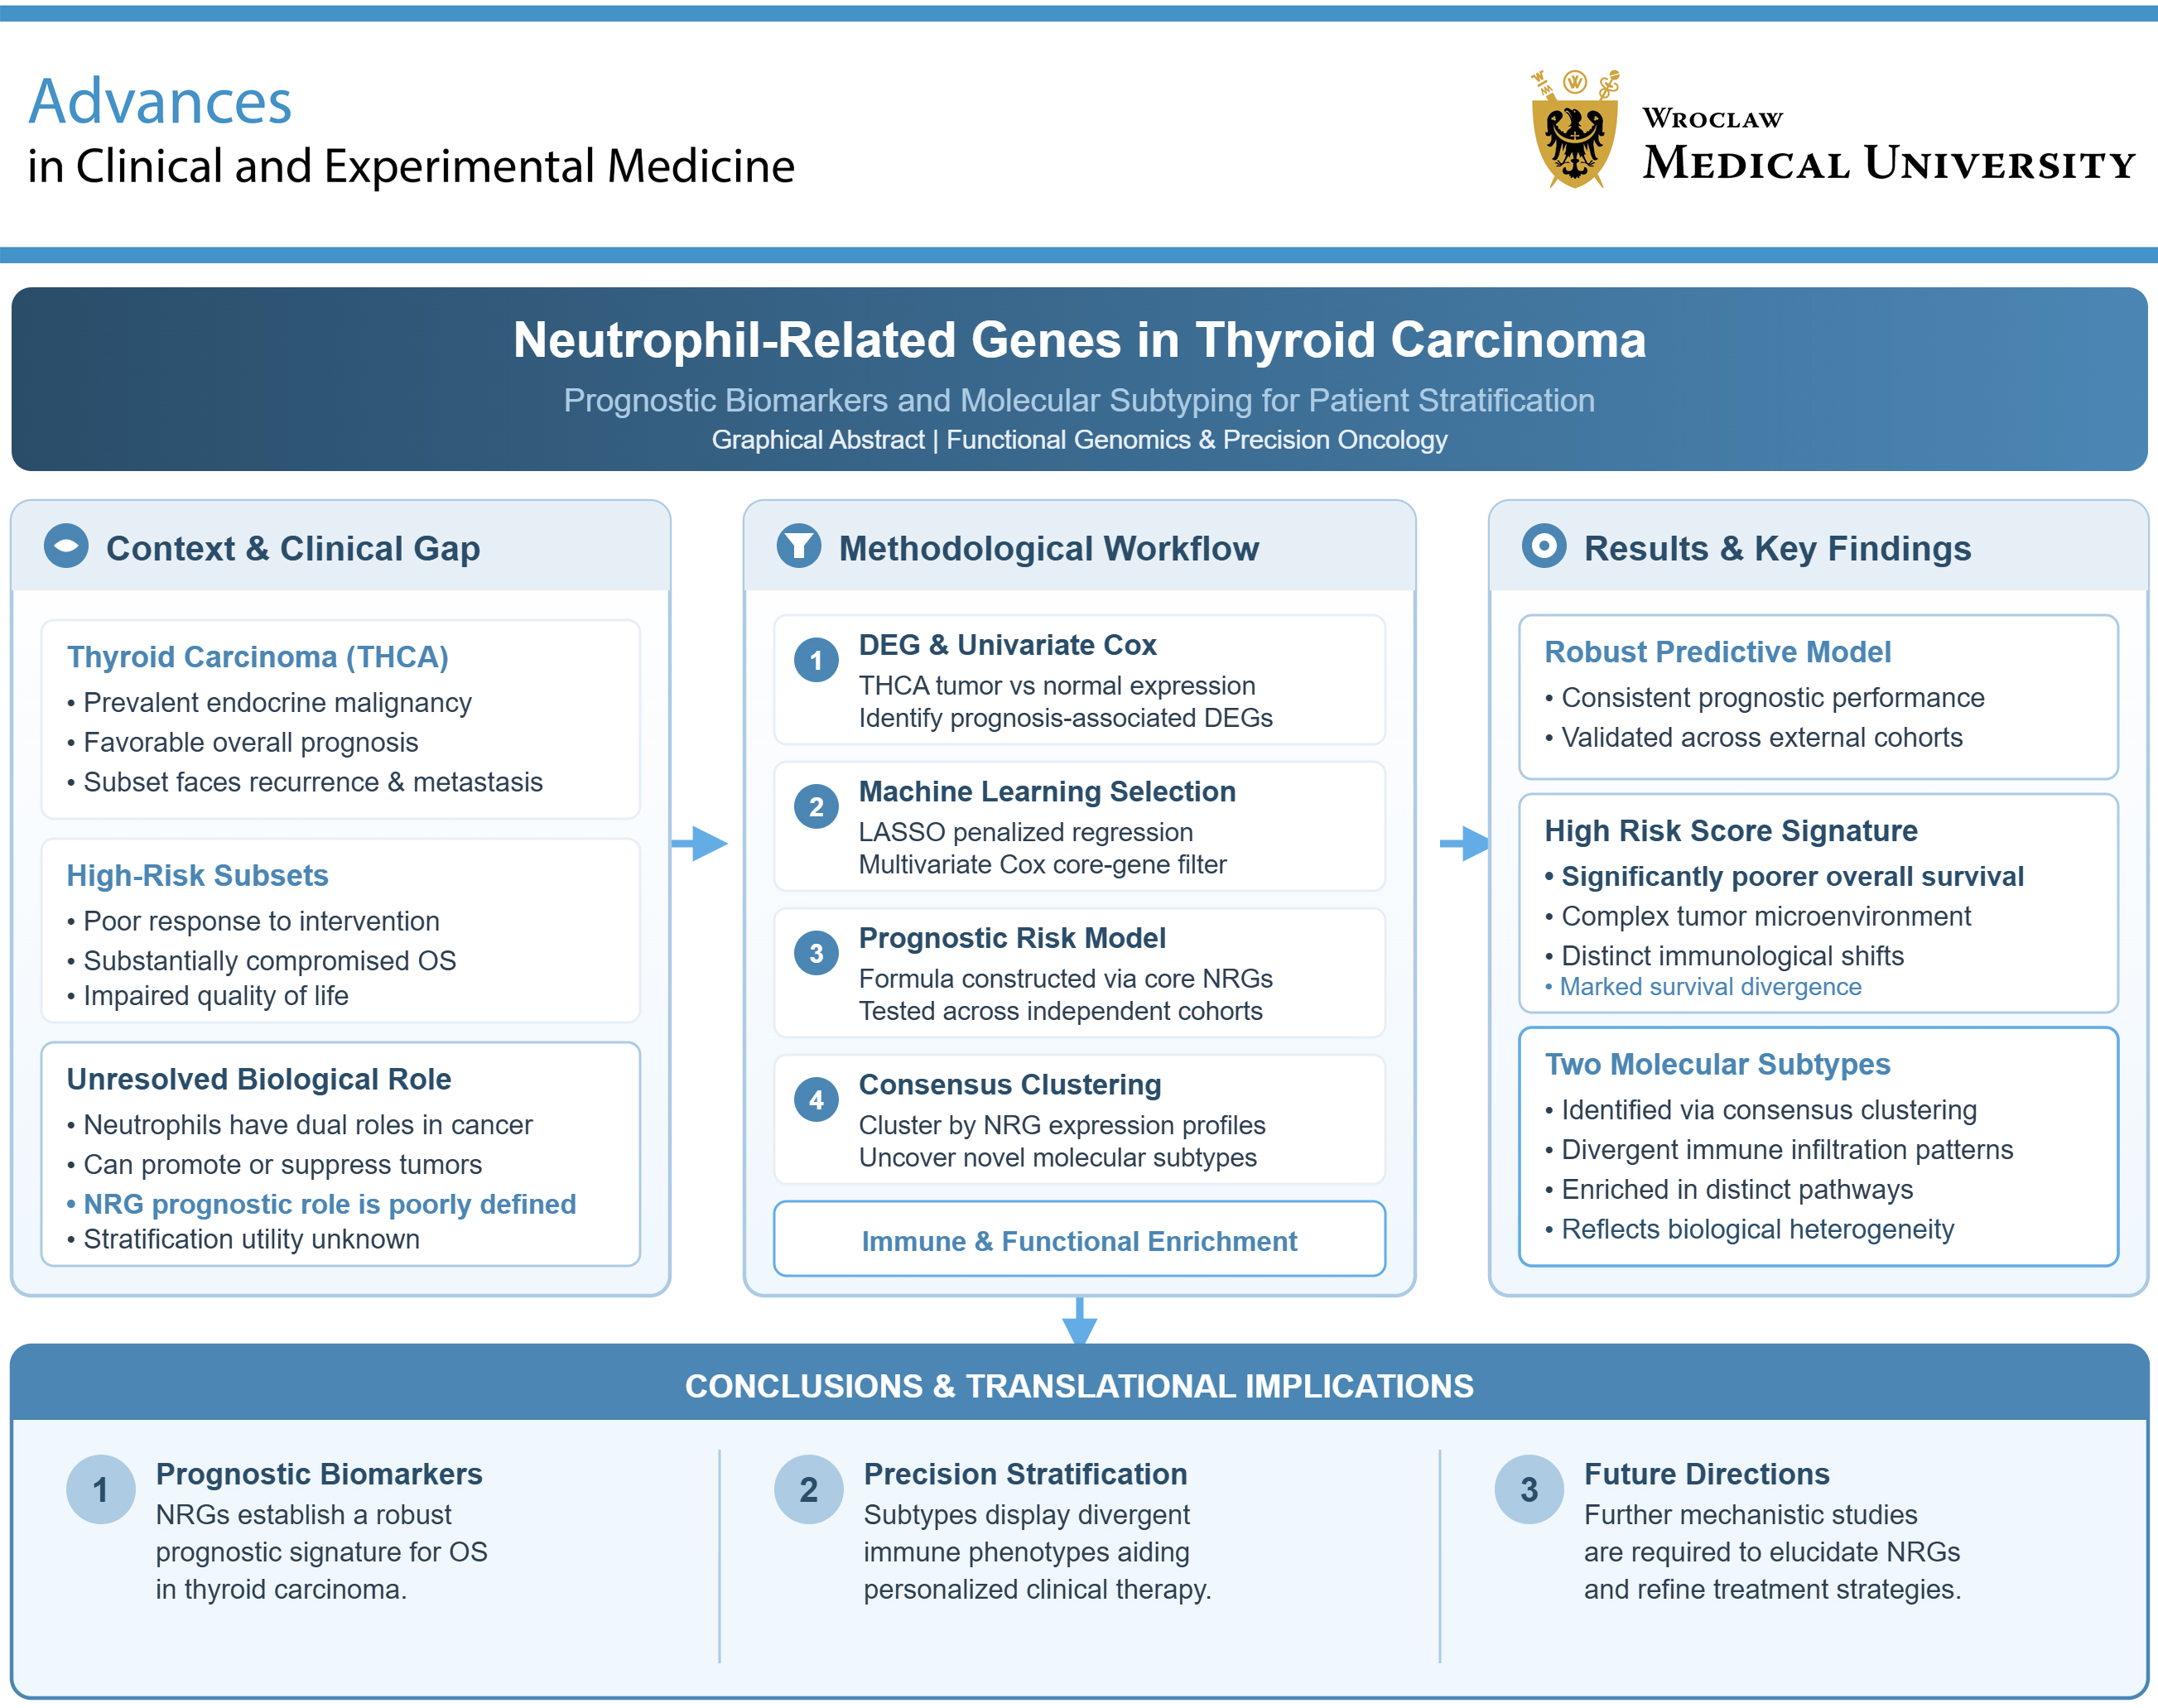
Background. Thyroid carcinoma (THCA) represents the most prevalent malignancy of the endocrine system. Although the majority of patients exhibit favorable clinical outcomes, a subset still faces significant clinical challenges, including distant metastasis, recurrence, and poor response to therapeutic interventions, all of which substantially compromise quality of life and overall survival (OS).
Objectives. Neutrophils, as pivotal components of the innate immune system, exhibit dichotomous roles in cancer biology, exerting both tumor-promoting and tumor-suppressive functions. However, the prognostic value of neutrophil-related genes (NRGs) and their contribution to the molecular stratification of THCA remain poorly defined. Our aim was to identify and evaluate NRG biomarkers with the potential to inform personalized therapeutic strategies for patients with THCA.
Materials and methods. We first identified differentially expressed genes (DEGs) between THCA tumor and normal samples. Prognosis-associated DEGs were filtered using univariate Cox regression analysis. Subsequently, least absolute shrinkage and selection operator (LASSO) regression and multivariate Cox analysis were employed to identify a core set of prognostic NRGs. A risk model was constructed based on these core genes and validated in independent testing cohorts. Furthermore, consensus clustering was applied to delineate THCA molecular subtypes based on NRG expression profiles, followed by comprehensive analyses of functional enrichment and immune microenvironment characteristics.
Results. The prognostic signature derived from NRGs demonstrated robust and consistent predictive performance across the training and validation datasets. Patients with high NRG-based risk scores exhibited significantly poorer OS and a more immunologically complex tumor microenvironment (TME) than their low-risk counterparts. Consensus clustering further revealed 2 distinct molecular subtypes of THCA, each characterized by divergent immune infiltration patterns and functional pathway enrichment, suggesting biological heterogeneity with potential therapeutic implications.
Conclusions. Our study highlights NRGs as promising prognostic biomarkers in THCA, uncovering distinct molecular subtypes with potential relevance for personalized therapeutic stratification. These findings underscore the clinical value of NRGs and emphasize the need for further mechanistic investigations to advance our understanding of THCA biology and refine precision treatment strategies.
Key words: thyroid neoplasms, neutrophils, prognostic biomarkers, tumor microenvironment, gene expression profiling
Background
Thyroid carcinoma (THCA) is the most prevalent endocrine tumor.1, 2 It is generally categorized into 3 pathological subtypes: differentiated thyroid cancer (DTC), medullary thyroid cancer (MTC), and anaplastic thyroid cancer (ATC).3 Its incidence is influenced by a variety of factors, most notably geographic region4 and sex, with women exhibiting nearly threefold higher incidence rates compared to men.5 Most cases of THCA exhibit an indolent clinical course and are amenable to conventional treatment strategies, including surgical resection and radioactive iodine therapy.6 While surgery is the standard therapy for MTC and is curative only in intrathyroidal disease, ATC and poorly differentiated thyroid cancer (PDTC) exhibit the most unfavorable prognosis.7 A subset of patients presents with aggressive clinical features, such as extrathyroidal extension,8 vascular invasion, or distant metastases, and consequently faces a markedly poorer prognosis.9 These clinical challenges underscore the pressing need to elucidate the molecular mechanisms driving THCA progression and to identify robust biomarkers that can not only predict therapeutic responses but also stratify patients according to their risk, thereby guiding the development of more precise and effective therapeutic strategies.
Within the tumor microenvironment (TME), a heterogeneous and dynamic network composed of malignant cells, stromal elements, and infiltrating immune populations collectively governs tumor initiation, progression, and therapeutic response.10, 11 Among these, neutrophils represent the most abundant phagocytic leukocyte population, exhibiting both pro-tumorigenic and antitumor functions.12 Tumor-associated neutrophils (TANs) have been shown to possess a spectrum of tumor-suppressive capacities. Neutrophil infiltration has been associated with enhanced CD8+ T-cell recruitment and improved prognosis in colorectal cancer, suggesting their role in promoting antitumor immunity. Conversely, TANs can also contribute to malignant progression by secreting pro-inflammatory chemokines such as interleukin-8 (IL-8) and potent angiogenic factors such as vascular endothelial growth factor (VEGF), thereby promoting neovascularization and tumor expansion.13 Neutrophils also release proteolytic enzymes that degrade components of the extracellular matrix (ECM) and facilitate cancer cell invasion and metastasis.14 This functional duality underscores the complex role of neutrophils in cancer biology; however, their prognostic relevance and immunological context in THCA remain incompletely defined.
Objectives
The primary objective of this study was to identify and evaluate neutrophil-related gene (NRG) biomarkers with the potential to inform personalized therapeutic strategies for patients with THCA. Leveraging transcriptomic data from The Cancer Genome Atlas (TCGA), we sought to elucidate the prognostic value of NRG signatures in THCA. To this end, we constructed a prognostic model centered on a core set of NRGs, capable of stratifying patients by risk and predicting clinical outcomes.
Material and methods
Data collection
The mRNA expression profiles, somatic mutation data, and corresponding clinical information for patients with THCA were retrieved from the TCGA database (https://portal.gdc.cancer.gov). To ensure the reliability of the survival analyses, patients with an overall survival (OS) of less than 30 days were excluded, resulting in a final cohort of 502 cases. The cohort was randomly partitioned into a training and a validation set (7 : 3). Neutrophil-related genes were curated based on previously published literature and further refined using gene sets annotated in the Molecular Signatures Database (https://www.gsea-msigdb.org/gsea/msigdb).
Identification of differentially expressed NRGs
Differentially expressed genes (DEGs) between tumor and normal samples in the TCGA-THCA cohort were identified using the limma package in R (https://bioconductor.org/packages/release/bioc/html/limma.html) (|log2FC| > 1, adjusted p < 0.05). The intersection of the DEGs and NRGs was then computed to obtain differentially expressed NRGs (DENRGs). Gene Ontology (GO) and Kyoto Encyclopedia of Genes and Genomes (KEGG) enrichment analyses were performed on the DENRGs using the clusterProfiler R package (https://bioconductor.org/packages/release/bioc/html/clusterProfiler.html).
Selection of prognostic features and construction of the THCA prognostic model
Univariate Cox regression was performed on the TCGA-THCA cohort to identify candidate genes (p < 0.05). Least absolute shrinkage and selection operator (LASSO) regression, implemented via the glmnet package in R (https://cran.r-project.org/web/packages/glmnet/index.html), was used to minimize overfitting and select genes by cross-validation with an optimal penalty parameter (lambda). Multivariate Cox regression was then applied to construct a prognostic model using the survival package (https://cran.r-project.org/web/packages/survival/index.html). Risk scores were calculated based on gene expression levels and the corresponding coefficients. Patients were stratified into 2 groups according to the median risk score. Survival curves were plotted, and the model’s predictive accuracy was evaluated using time-dependent receiver operating characteristic (ROC) curves with the timeROC package (https://cran.r-project.org/web/packages/timeROC/index.html). Risk score distributions, survival status, and heatmaps of gene expression were generated for visual comparison between the groups.
Construction of a nomogram for independent prognostic analysis
To assess the independent prognostic value of the constructed risk model, a nomogram was developed using the rms package in R (https://cran.r-project.org/web/packages/rms/index.html), integrating the prognostic risk score and clinical factors to predict the survival probabilities of patients with THCA. Calibration curves were plotted to evaluate the accuracy of the nomogram’s predictions by comparing the predicted and observed survival rates.
Immune infiltration analysis
Malignant Tumours using Expression data (ESTIMATE) scores for patients with TCGA-THCA were calculated using Single Sample Gene Set Enrichment Analysis (ssGSEA) with the estimate and GSVA R packages (https://estimate.r-forge.r-project.org; https://www.bioconductor.org/packages/release/bioc/html/GSVA.html). Immune infiltration levels were assessed using the CIBERSORT algorithm (https://cibersortx.stanford.edu). Immune checkpoint expression across different groups was analyzed and visualized using box plots. The association between immune subtypes and risk groups (high vs low) was evaluated. Immune subtype scoring data for THCA were downloaded from The Cancer Immunome Atlas (TCIA), and differences in scores between subtypes were analyzed.
Gene set enrichment analysis
The gene set enrichment analysis (GSEA) was performed using the GSEA software (https://www.gsea-msigdb.org/gsea/downloads.jsp) to identify enriched pathways between risk groups. Differential analysis between the high- and low-risk groups was conducted using the limma package (|log2FC| > 0.585, p < 0.05). The GO enrichment analysis was performed on differential genes.
THCA subtype analysis
Based on the NRGs from the constructed model, consensus clustering was performed on THCA samples from the TCGA-THCA dataset using the ConsensusClusterPlus package (https://www.rdocumentation.org/packages/ConsensusClusterPlus/versions/1.36.0/topics/ConsensusClusterPlus). A total of 205 patients were assigned to Cluster 1 and 297 to Cluster 2. Kaplan–Meier survival curves were generated using the survminer package (https://cran.r-project.org/web/packages/survminer/index.html) to compare OS between subtypes. Immune infiltration analysis was subsequently conducted for both subtypes, with differential analysis performed using the limma package and GO enrichment analysis.
Drug sensitivity analysis and regulatory network construction
To identify potential therapeutic targets and effective drugs, we utilized the CellMiner database (https://discover.nci.nih.gov/cellminercdb) to screen for antitumor drugs whose sensitivity is significantly associated with prognostic genes. The pRRophetic R package (https://github.com/paulgeeleher/pRRophetic) was used to predict the half-maximal inhibitory concentration (IC50) of different drugs in risk groups.
Statistical analyses
Statistical significance was determined using R v 4.4.2 (R Foundation for Statistical Computing, Vienna, Austria). Spearman analysis was utilized to compute the correlation coefficient. The difference between groups was assessed for statistical significance using Wilcoxon rank sum test. Two-way analysis of variance (ANOVA) test was utilized for comparing differences among the 3 groups. R v. 4.4.2 software was employed for analyzing all bioinformatics data. All Cox regression analyses, including model fitting and assumption verification, were performed using the survival R package. The ROC curves were used to evaluate the predictive performance of candidate genes used to construct predictive models.
Results
Development of a neutrophil-related prognostic model for THCA
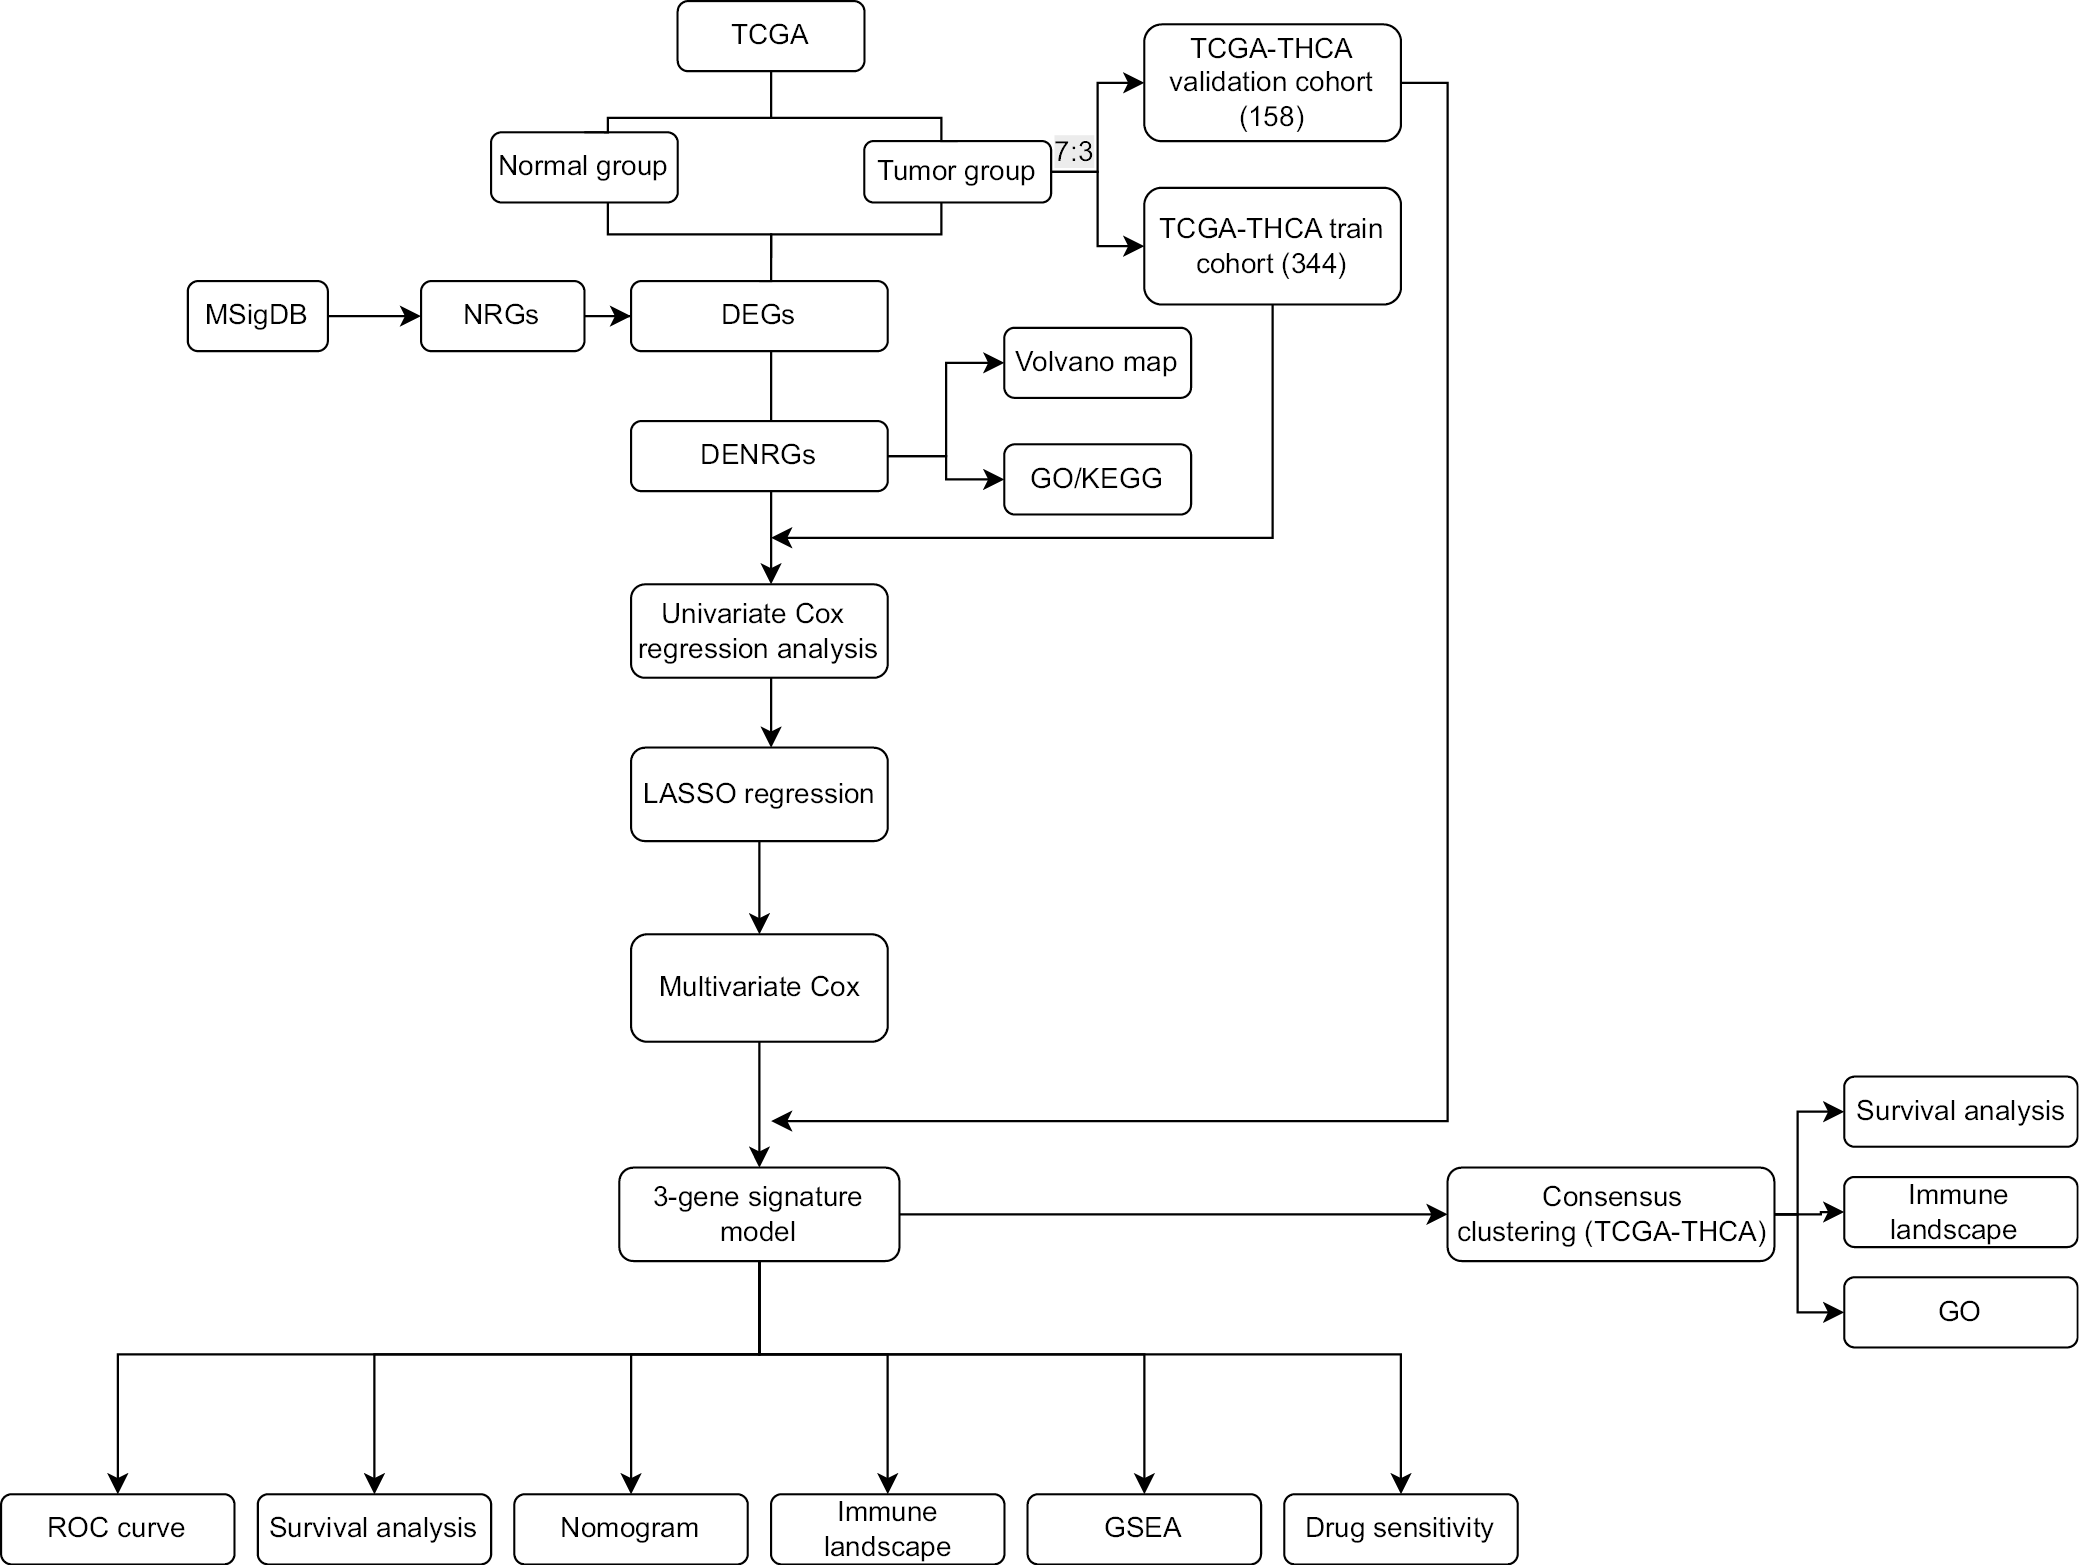
The overall research workflow is illustrated in Figure 1. Differential expression analysis between tumor and normal tissues identified DEGs (Supplementary Fig. 1A). Intersecting the DEGs with the NRGs gen set yielded 91 DENRGs (Supplementary Table 1), which were subjected to GO and KEGG enrichment analyses. These genes were significantly enriched in immune-related processes and pathways, including “leukocyte migration”, “cell chemotaxis”, “cytoplasmic vesicle lumen”, and “cytokine–cytokine receptor interaction” (Supplementary Fig. 1B). Univariate Cox regression identified prognostic DENRGs (Figure 2A), followed by LASSO regression to reduce redundancy and prevent overfitting, ultimately selecting 4 candidate genes (Figure 2B,C). Multivariate Cox regression refined the model to 3 signature genes (Figure 2D): Risk score = 0.583 × CCL17 – 0.467 × NPC2 – 0.564 × DPP4. Schoenfeld and Martingale residuals indicated that the proportional hazards and linearity assumptions of the Cox model were satisfied, and all variance inflation factors were below 3 (Supplementary Tables 2,3 and Supplementary Fig. 2), supporting the validity of the analysis. Spearman’s correlation among the 3 genes was low (all p < 0.05, Supplementary Fig. 3), confirming the independence of the predictors.
Patients were stratified into risk groups based on the median risk score. Time-dependent ROC analysis showed that the area under the curve (AUC) values for 1-, 3-, and 5-year survival all exceeded 0.7 in the training, validation, and full TCGA cohorts, suggesting strong predictive performance (Figure 3A). Compared with other transcriptome-based prognostic models, our model achieved relatively high AUC values (Supplementary Fig. 4). Kaplan–Meier analysis demonstrated significantly worse survival in the high-risk group across all cohorts (Figure 3B). Risk score distributions, survival status plots, and heatmaps of gene expression further illustrated clear distinctions between the 2 risk groups (Figure 3C). Among the 3 signature genes, CCL17 was significantly upregulated in the high-risk group, whereas NPC2 and DPP4 were downregulated (Figure 3D). Expression levels of all 3 genes were significantly elevated in tumor tissues compared with normal controls (Figure 3E). Moreover, survival analysis based on gene expression stratification revealed that high NPC2 expression was associated with a better prognosis (Figure 3F).
Independent prognostic value and nomogram construction
Univariate and multivariate Cox regression analyses, including clinical parameters and the risk score, indicated that both age and the risk score were independently associated with OS (Figure 4A,B). Notably, the risk score remained a significant adverse prognostic factor (p < 0.01, hazard ratio (HR) >1), confirming its independence and robustness. A prognostic nomogram integrating clinical variables and the risk score was developed to predict survival probabilities in patients with THCA (Figure 4C). Calibration plots demonstrated strong concordance between the predicted and observed survival outcomes (Figure 4D,E), indicating good predictive performance of the model. Moreover, patients with advanced-stage disease (stage III–IV) exhibited significantly higher risk scores, aligning with the stratified prognostic potential of the risk model (Supplementary Fig. 5).
Immune infiltration landscape between high- and low-risk groups
Immune phenotyping based on the Immunophenoscore (IPS) revealed significantly higher scores across most immune categories in the low-risk group, except for the IPS_CTLA4_pos_PD1_pos subgroup, which showed no significant difference (Figure 5A, Supplementary Table 4). These results suggest enhanced predicted responsiveness to immune checkpoint blockade in the low-risk cohort. We next assessed the expression of immune checkpoint (ICP)-related genes between the 2 groups (Figure 5B, Supplementary Table 5). Most ICP genes, including CD200, CD11, and TNFSF15, were downregulated in the high-risk group. Notably, IDO1 and TNFSF4 were significantly upregulated in the high-risk group, suggesting potential immune evasion mechanisms. Although the high-risk group exhibited a significantly elevated StromalScore, analysis of the IMvigor210 cohort revealed a reduced immune response compared with the low-risk group (Figure 5C, Supplementary Tables 6,7). ssGSEA revealed distinct immune functional differences: aDCs and type II IFN response were enriched in the low-risk group, whereas B cells, dendritic cells (DCs), and T follicular helper (Tfh) cells were more abundant in the high-risk group (Figure 6A,B, Supplementary Table 8). To further dissect immune infiltration, we applied the CIBERSORT algorithm to estimate the abundance of 22 immune cell types. Significant differences were observed in specific populations (Figure 6C, Supplementary Table 9): monocytes were increased in the high-risk group, whereas M0 macrophages and resting mast cells were more enriched in the low-risk group.
Pathway enrichment analysis with GSEA
Gene set enrichment analysis was performed to identify KEGG pathways differentially enriched between the risk groups. In the high-risk group, significantly enriched pathways included cardiac muscle contraction, oxidative phosphorylation, Parkinson’s disease, and propanoate metabolism (Supplementary Fig. 6). In contrast, the low-risk group showed enrichment in pathways such as adherens junction, chronic myeloid leukemia, DNA replication, and lysosome (Supplementary Fig. 7). Subsequent differential expression analysis between the 2 risk groups (|log2FC| > 0.585, adjusted p < 0.05) identified 67 upregulated and 176 downregulated genes. Gene Ontology enrichment analysis revealed that the upregulated genes were primarily associated with response to copper ion and response to cadmium ion (BP), basement membrane (CC), and ECM structural constituent and heparin binding (MF) (Figure 7A). Conversely, downregulated genes were enriched in epidermis development, wound healing, and axonogenesis (BP); collagen-containing ECM and cytoplasmic vesicle lumen (CC); and enzyme inhibitor activity, glycosaminoglycan binding, and peptidase regulator activity (MF) (Figure 7B).
Molecular subtype analysis of THCA based on prognostic genes
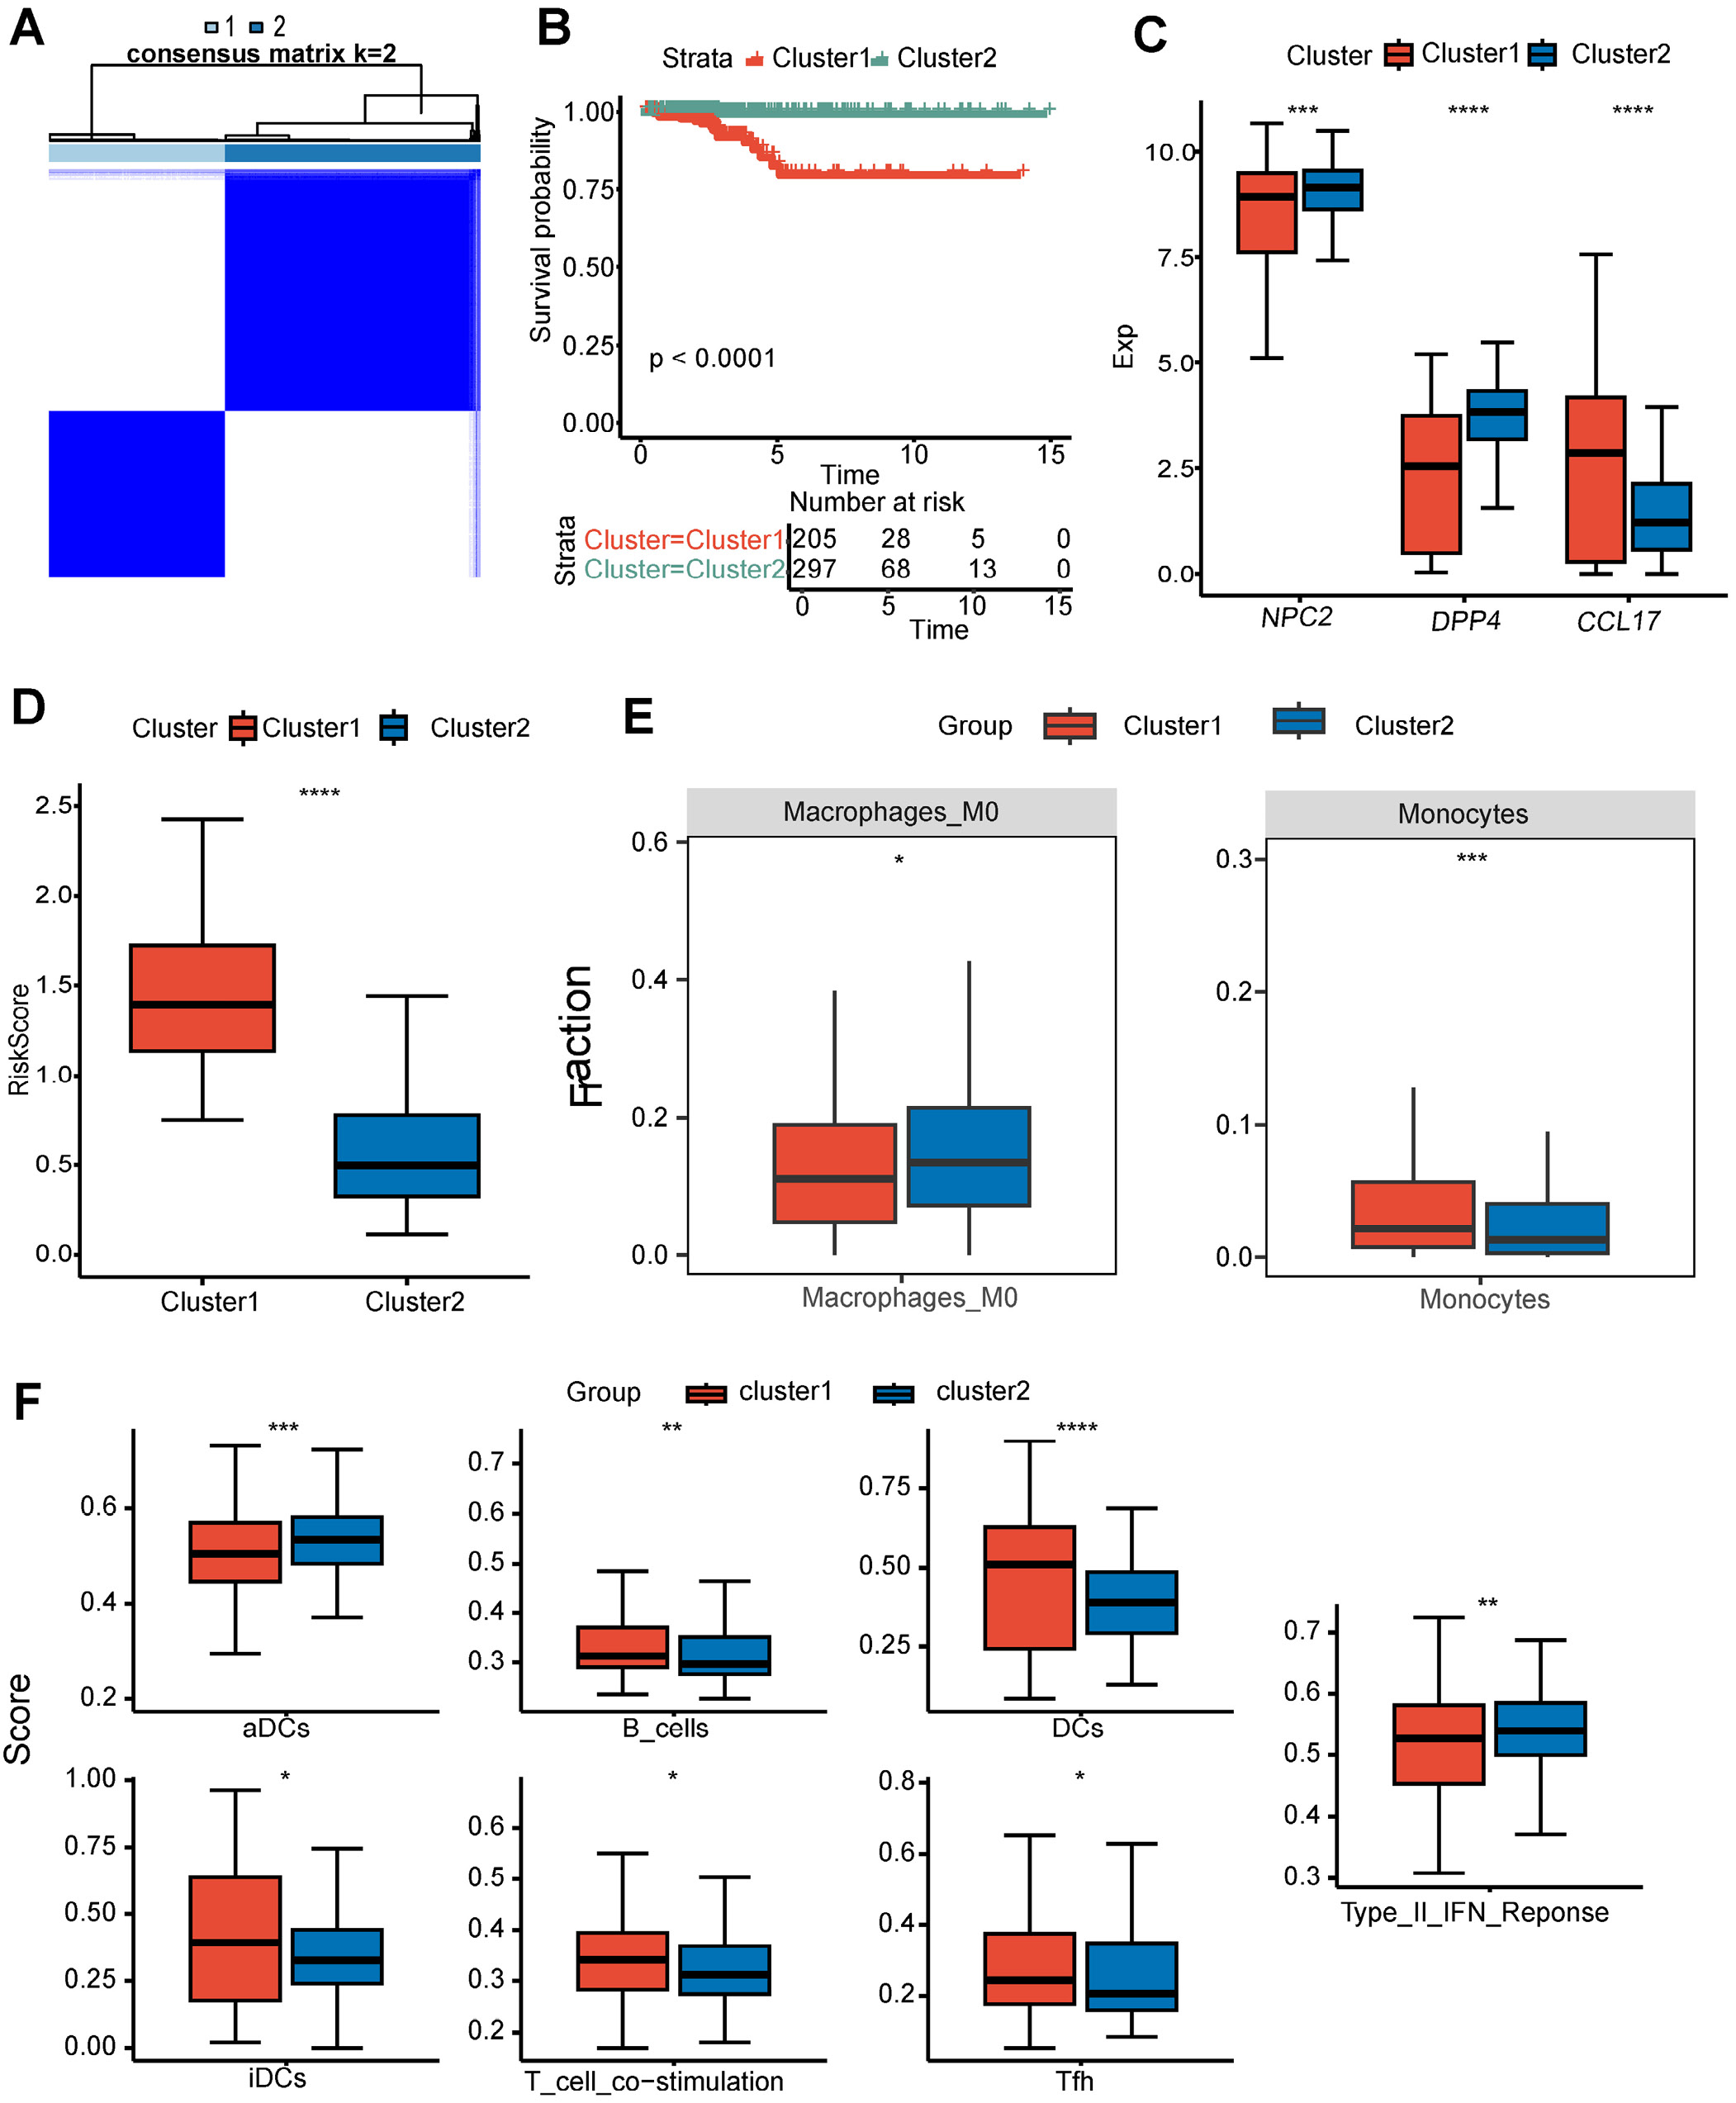
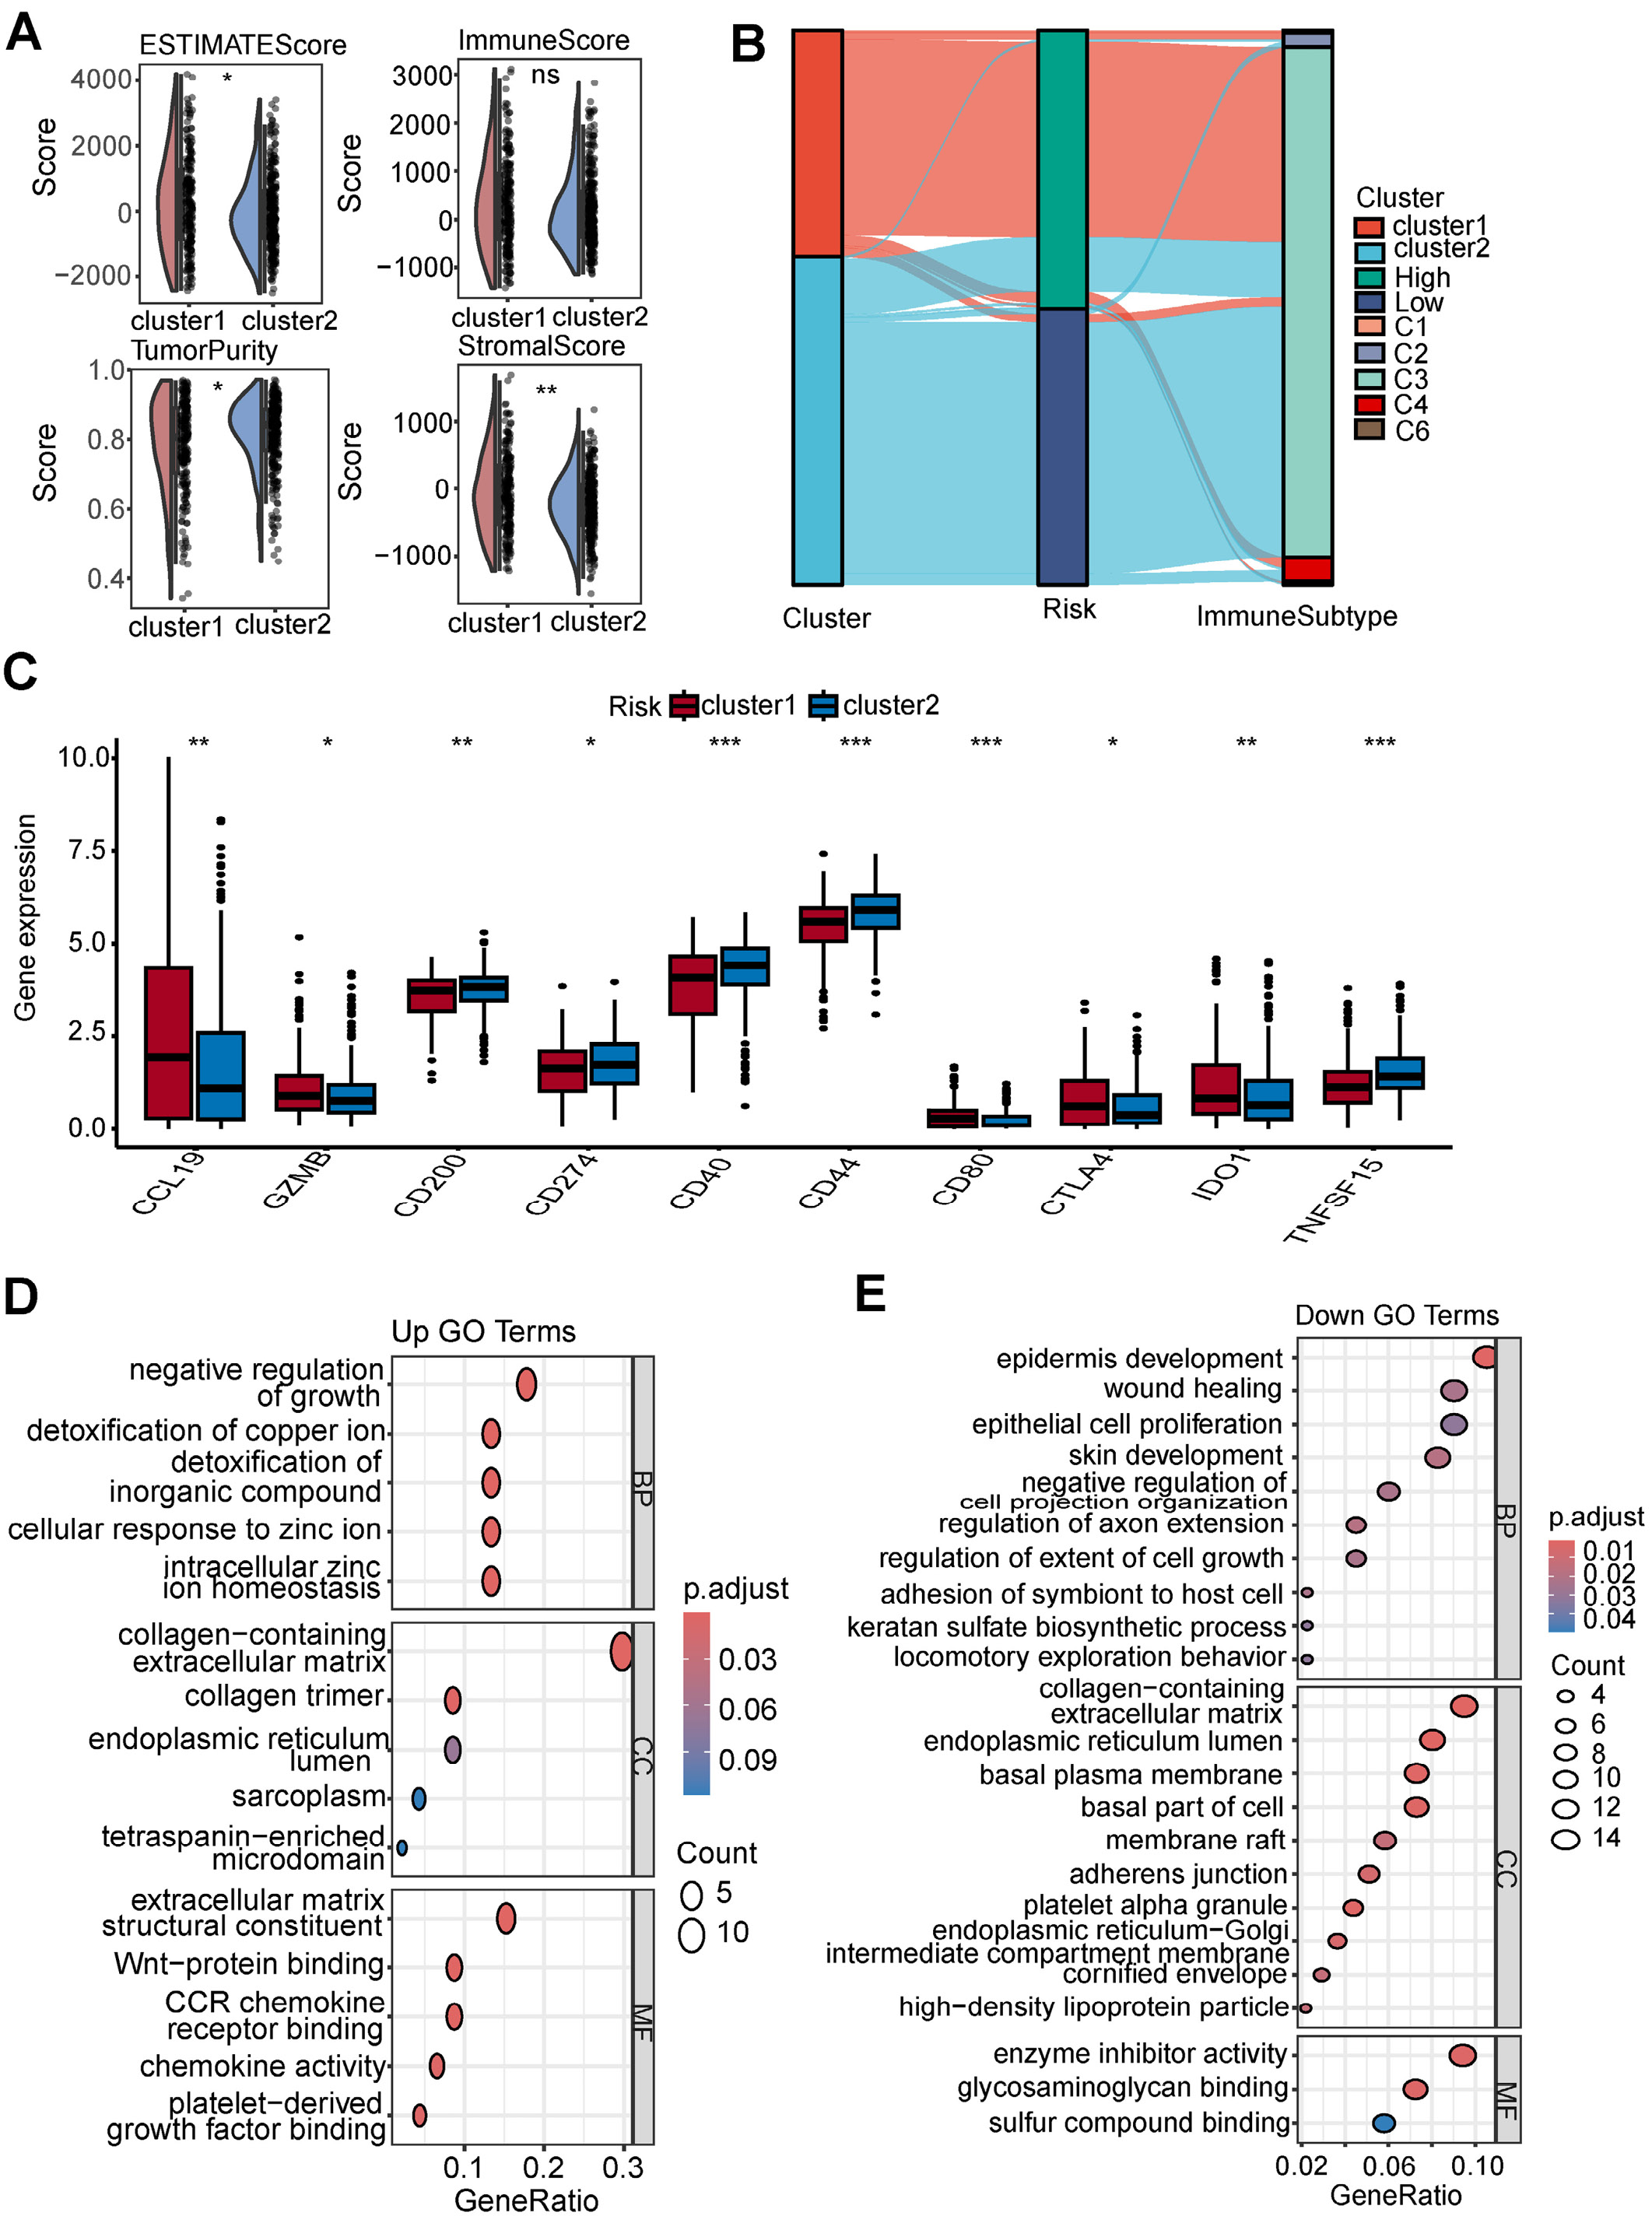
Unsupervised consensus clustering based on the expression of the 3 prognostic genes identified 2 molecular subtypes of THCA: Cluster 1 (n = 205) and Cluster 2 (n = 297) (Figure 8A). Kaplan–Meier survival analysis revealed significantly poorer OS in Cluster 1 (Figure 8B). Expression levels of the 3 genes differed markedly between the 2 subtypes (Figure 8C and Supplementary Table 10), with Cluster 1 exhibiting a significantly higher risk score (Figure 8D and Supplementary Table 11). Immune profiling using the CIBERSORT algorithm indicated distinct immune infiltration patterns between the subtypes. Notably, monocytes were enriched in Cluster 1, whereas M0 macrophages were more abundant in Cluster 2 (Figure 8E and Supplementary Table 12). ssGSEA revealed that Cluster 1 exhibited generally higher immune cell infiltration and immune-related functional scores than Cluster 2 (Figure 8F and Supplementary Table 13). Moreover, tumor purity was higher in Cluster 2, whereas stromal and ESTIMATE scores were significantly higher in Cluster 1 (Figure 9A and Supplementary Table 14). Analysis of the relationship between the subtypes and the 6 immune subtypes (C1–C6) from the TCGA Pan-Cancer immune classification revealed that both THCA clusters were predominantly enriched in the inflammatory subtype C3 (Figure 9B). Immune checkpoint gene expression analysis showed significantly higher levels of CD40, CD44, CD200, and TNFSF15 in Cluster 2, whereas CCL19, GZMB, CTLA4, and IDO1 were more abundant in Cluster 1 (Figure 9C and Supplementary Table 15). Differential expression analysis between the 2 subtypes (|log2FC| > 0.585, adjusted p < 0.05) identified 189 DEGs, including 47 upregulated and 142 downregulated genes in Cluster 1. Gene Ontology enrichment analysis of the upregulated genes highlighted terms such as Wnt-protein binding and CCR chemokine receptor binding, whereas the downregulated genes were enriched in enzyme inhibitor activity (Figure 9D,E). Tumor mutational burden (TMB) analysis showed that the TMB of Cluster 1 was significantly higher than that of Cluster 2 (Supplementary Fig. 8).
Drug sensitivity analysis and network construction
We estimated the IC50 values of commonly used chemotherapeutic agents (docetaxel, cisplatin, fluorouracil, vinorelbine, doxorubicin, and paclitaxel) in the risk groups. IC50 was significantly higher in the high-risk group, suggesting reduced drug sensitivity (Figure 10 and Supplementary Table 16). To further explore potential therapeutic targets, we analyzed the correlation between prognostic gene expression and drug sensitivity using data from the CellMiner database. DPP4 expression was positively correlated with sensitivity to Midostaurin and ENMD-2076 precursor (r = 0.523 and 0.494, respectively). CCL17 showed a significant negative correlation with 7-hydroxystaurosporine (r = –0.450) and a positive correlation with PLX-4720 (r = 0.465). NPC2 expression was negatively correlated with des-fluoro-TAK-960 and docetaxel (r = –0.407 and –0.437, respectively) (Supplementary Fig. 9 and Supplementary Table 17).
Discussion
Through comprehensive bioinformatics analysis of neutrophil-related genes, this study uncovers novel insights of THCA. It highlights the intricate relationship between neutrophils and THCA progression. Neutrophils are critical regulators of tumor progression. Our research confirms existing literature by demonstrating that high NRGs scores are associated with poor prognosis in THCA patients.15, 16 The neutrophil-to-lymphocyte ratio (NLR) has prognostic value, with elevated NLR correlating with significantly worse OS.17 Inflammatory stimuli induce the release of neutrophil extracellular traps (NETs), which have been implicated in promoting tumor growth and progression.18 Additionally, SLCO4A1 may effect progression-free survival (PFS) in THCA patients by modulating neutrophil-mediated immune pathways.19
The 3 core NRGs (CCL17, NPC2, and DPP4) are associated with THCA has been established. CCL17, a CCR4 ligand expressed in M2 macrophages and thymus,20, 21 has been implicated in tumor progression across cancers.22, 23, 24, 25 Consistent with previous findings in THCA,26 our data show that high CCL17 expression is associated with poorer survival. NPC2 which encodes a lysosomal cholesterol transporter,27 has been implicated in several malignancies including colon,28 lung cancer,29, 30 and thyroid cancer.31 In THCA, NPC2 knockdown promotes tumor cell apoptosis in vitro. DPP4 (CD26) is a cell surface glycoprotein.32 DPP4 acts as either an oncogene or tumor suppressor depending on context.33 Its high expression is linked to poor prognosis in clear cell carcinoma,34 pancreatic cancer,35 and colorectal cancer,36 while exhibiting tumor-suppressive roles in ovarian, endometrial,37 and prostate cancer.38 DPP4 overexpression in THCA can be used as a potential prognostic marker.39, 40 Compared to models from other transcriptomic studies, our risk model demonstrated superior predictive performance, with AUCs ranging from 0.797 to 0.933. While direct comparisons with genomic markers such as BRAF mutation status are constrained by differences in data type and clinical context, our integrated nomogram – combining the risk score with key clinical parameters – offers a practical and interpretable tool for personalized patient management.
We analyzed DEGs between risk groups to explore how risk scores influence THCA progression. High-risk tumors showed enrichment of oxidative phosphorylation and myocardial contraction pathways, consistent with cardiovascular complications often observed in aggressive THCA under thyrotoxic conditions.41 OXPHOS also promotes resistance to apoptosis and persistence of TH17 cells in the TME.42 Co-upregulation of copper ion response and collagen remodeling genes indicates a pro-metastatic phenotype, as copper drives tumor growth via RTK/ERK signaling and mediates cuproptosis.43, 44 Increased matrix stiffness may trigger matrix autophagy, further supporting tumor progression.45 These findings reflect the connective tissue proliferative stroma and metabolic plasticity observed in advanced THCA.46 In contrast, low-risk tumors preserve adherens junctions and DNA replication fidelity.47 Suppression of axonogenesis and epidermal development genes may reduce perineural invasion.48, 49 These findings provide mechanistic rationale for exploring targeted or repurposed therapies in aggressive THCA. Notably, bergapten may serve as a natural therapeutic agent for papillary thyroid carcinoma (PTC), as it has been shown to inhibit PTC cell growth through suppression of PI3K/AKT and GSK-3β signaling, highlighting the potential of pathway-specific interventions.50
Previous studies demonstrate that dynamic interactions within the TME drive tumor progression.51, 52 In this study, we systematically profiled the immune landscape of THCA by integrating risk stratification and molecular subtyping. Immunophenoscore analysis revealed significantly higher immune scores in the low-risk group across most categories, except for the CTLA4+PD1+ subgroup. This corresponded with higher expression of most immune checkpoint genes, suggesting greater immunotherapy responsiveness in this group. These results are aligned with prior observations that immunotherapy can improve outcomes in THCA patients.53 Moreover, we uncovered distinct immune infiltration patterns linked to our novel molecular subtypes. Cluster 1 exhibited higher infiltration of M0 macrophages, along with elevated CTLA4 expression and higher TMB. These features suggest an immunologically active phenotype potentially responsive to immune checkpoint inhibitors, particularly CTLA4 blockade.54, 55 In contrast, Cluster 2 displayed lower immune infiltration, reduced TMB, and frequent BRAF mutations, consistent with an immune-cold, genomically stable phenotype that may benefit more from mitogen-activated protein kinase (MAPK)-targeted therapies.56 While previous THCA immune profiling studies have highlighted macrophage and T-cell infiltration,39, 57 our subtype-specific immune landscapes – especially the integration of neutrophil-related risk stratification – have not been previously reported. This framework provides novel insights into THCA immunobiology and may aid in identifying patients more likely to benefit from immunotherapy.
High-risk THCA patients exhibited broadly elevated IC50 values, suggesting low-risk group is more sensitive to chemotherapy drugs than the high-risk group. This pattern may reflect intrinsic resistance mechanisms and underscores the limited benefit of cytotoxic regimens in aggressive THCA. To inform alternative strategies, we integrated gene expression with CellMiner drug response data to identify actionable associations. DPP4 expression correlated with sensitivity to midostaurin and ENMD-2076, suggesting vulnerability to multi-kinase inhibition.58 CCL17 expression was associated with opposing sensitivities to 7-hydroxystaurosporine and PLX-4720, reflecting pathway-specific therapeutic windows.59, 60 NPC2 was linked to resistance against des-fluoro-TAK-960 and docetaxel, implying a role in mitotic drug evasion.61 These associations highlight candidate compounds for drug repurposing in high-risk THCA and warrant further translational exploration.
Limitations of the study
Despite the comprehensive analysis of NRGs in THCA, several limitations remain. Owing to current experimental constraints, functional and drug response validation could not be performed and will be pursued in future studies to support clinical translation. Future application of single-cell RNA sequencing and spatial transcriptomics could uncover spatially confined immune niches or cell–cell interactions shaping the TME. Moreover, functional validation of the prognostic genes and subtype-specific immune features through in vitro perturbation and in vivo tumor models will be essential to confirm their mechanistic relevance and therapeutic potential.
Conclusions
This study elucidates the role of NRGs in shaping the THCA TME and proposes a clinically applicable biomarker system for prognostic stratification and therapeutic guidance. The 3-gene NRG signature predicts patient survival and facilitates risk-adapted treatment strategies involving chemotherapy and immunotherapy. Incorporating the signature into a nomogram alongside clinical variables enhances prognostic accuracy and supports its translational applicability. This model may assist in stratifying patients according to treatment intensity and tailoring follow-up schedules based on individualized risk profiles. Furthermore, subtype-specific immune landscapes underscore actionable therapeutic opportunities and may inform individualized approaches to immunotherapy and drug repurposing.
Supplementary data
The supplementary materials are available at https://doi.org/10.5281/zenodo.17730267. The package contains the following files:
Supplementary Fig. 1. Differential gene expression and enrichment analysis.
Supplementary Fig. 2. Martingale residuals of multivariate Cox model.
Supplementary Fig. 3. Spearman correlation analysis of 3 signature genes.
Supplementary Fig. 4. Comparison of AUC values for multiple models.
Supplementary Fig. 5. Risk scores for different cancer stages.
Supplementary Fig. 6. GSEA results of high-risk groups.
Supplementary Fig. 7. GSEA results of low-risk groups.
Supplementary Fig. 8. TMB of subtype.
Supplementary Fig. 9. Correlation plot of drug sensitivity predictions using the CellMiner database.
Supplementary Table 1. Differentially expressed neutrophil-related genes identified between tumor and normal samples.
Supplementary Table 2. Schoenfeld residual test for proportional hazards assumption.
Supplementary Table 3. Variance inflation factor (VIF) for multicollinearity. assessment in the Cox regression model.
Supplementary Table 4. Comparison of immune phenotype scores between risk groups using Wilcoxon test.
Supplementary Table 5. Comparison of immune checkpoint–related gene expression between high- and low-risk groups using Wilcoxon test.
Supplementary Table 6. Comparison of ESTIMATE scores between high- and low-risk groups using Wilcoxon test.
Supplementary Table 7. χ2 test results for the distribution of no response (NR) and response (R) across high- and low-risk groups.
Supplementary Table 8. Wilcoxon test of immune cell composition and immune function between high- and low-risk groups.
Supplementary Table 9. Comparison of immune cell type proportions between high- and low-risk groups using Wilcoxon test.
Supplementary Table 10. Wilcoxon test of signature gene expression between clusters.
Supplementary Table 11. Wilcoxon test of risk scores between clusters.
Supplementary Table 12. Wilcoxon test of immune cell composition between clusters.
Supplementary Table 13. Wilcoxon test of immune cell composition and immune function between clusters.
Supplementary Table 14. Wilcoxon test of ESTIMATE scores and tumor purity between clusters.
Supplementary Table 15. Wilcoxon test of immune checkpoint gene expression between clusters.
Supplementary Table 16. Wilcoxon test of drug response between risk groups.
Supplementary Table 17. Gene–drug correlation analysis.
Data Availability Statement
The datasets supporting the findings of the current study are openly available in Zenodo at https://doi.org/10.5281/zenodo.17734513.
Consent for publication of personal information
Not applicable.
Use of AI and AI-assisted technologies
Not applicable.
.jpg)
.png)
-pop.jpg)
.jpg)
.jpg)
.jpg)
.jpg)