Abstract
Background. Polycystic ovary syndrome (PCOS) is a common endocrine disorder associated with a substantial health burden.
Objectives. Given the interplay between the immune and endocrine systems, this study aimed to investigate the potential causal relationship between autoimmune diseases and PCOS using Mendelian randomization (MR).
Materials and methods. A 2-sample MR analysis was conducted using genome-wide association study (GWAS) data from the FinnGen (n = 118,870) and European Bioinformatics Institute (EBI) (n = 141,355) cohorts. Instrumental variables were selected as single nucleotide polymorphisms (SNPs), and the inverse-variance weighted (IVW), weighted median, and MR-Egger methods were applied. Sensitivity analyses were performed to assess heterogeneity and horizontal pleiotropy. To validate the MR findings, transcriptomic analyses of Gene Expression Omnibus (GEO) datasets (GSE209596 for multiple sclerosis (MS) and GSE277906 for PCOS) were performed to identify shared differentially expressed genes (DEGs), followed by Gene Ontology (GO) and Kyoto Encyclopedia of Genes and Genomes (KEGG) enrichment analyses. Diagnostic nomograms were constructed based on the identified key genes.
Results. Mendelian randomization analysis suggested a potential inverse causal association between MS and PCOS (IVW: odds ratio (OR) = 0.906; 95% confidence interval (95% CI): 0.820–0.999; p = 0.049), which was consistent across both datasets and robust in the sensitivity analyses. No significant causal associations were identified for the other autoimmune diseases. Transcriptomic analysis identified 4 shared DEGs (CD52, ARHGDIB, GCHFR, and S100A9), which were enriched in immune-related pathways. Nomogram models based on these genes accurately discriminated patients from controls in both cohorts, achieving areas under the curve (AUCs) of 82.8% for MS and 81.1% for PCOS.
Conclusions. This integrative analysis suggests a potential protective association between MS and PCOS mediated by immune-related mechanisms. These findings provide new insights into the immunopathology of PCOS and support the future development of diagnostic biomarkers.
Key words: transcriptomics, polycystic ovary syndrome (PCOS), multiple sclerosis (MS), Mendelian randomization, autoimmune diseases
Background
Polycystic ovary syndrome (PCOS) is one of the most common endocrine disorders in women of reproductive age, affecting approx. 6–12% of women worldwide.1 It is characterized by hyperandrogenism, ovulatory dysfunction, and polycystic ovarian morphology. It is a multifactorial disorder with a complex pathophysiology involving genetic predisposition, insulin resistance, and endocrine dysregulation. These factors contribute to reproductive complications, including infertility, menstrual irregularities, and pregnancy complications, as well as metabolic disturbances such as type 2 diabetes, dyslipidemia, and cardiovascular disease.2, 3, 4, 5, 6 Consequently, PCOS imposes a substantial burden on women’s health and quality of life, increasing the risk of metabolic syndrome, type 1 diabetes (T1D), hypertension, and cardiovascular disease, thereby contributing to long-term morbidity and healthcare costs.7
Autoimmune diseases, including T1D, celiac disease, systemic lupus erythematosus, and autoimmune thyroid diseases,8, 9, 10, 11 result from immune dysregulation, leading to chronic inflammation and tissue damage. Recent studies have shown that patients with PCOS often exhibit low-grade chronic inflammation, imbalances in immune cell subsets, and elevated levels of pro-inflammatory cytokines, suggesting that PCOS may have an underlying immunopathological component in addition to its endocrine and metabolic features.12, 13 Evidence also indicates shared genetic susceptibility loci and immune-related pathways between PCOS and several autoimmune diseases, supporting the hypothesis of overlapping pathophysiological mechanisms.14
Among autoimmune diseases, multiple sclerosis (MS) is a prototypical disorder characterized by central nervous system demyelination and chronic neuroinflammation. It predominantly affects women of reproductive age and involves T-cell- and B-cell-mediated immune dysregulation and inflammatory signaling pathways.15 Recent studies have explored the genetic relationship among PCOS, testosterone levels, sex hormone-binding globulin (SHBG), and MS. Although these studies did not support a protective causal effect of PCOS, as a hyperandrogenic phenotype, on the risk of MS in women, they identified several shared genetic loci involving testosterone, SHBG, and MS, providing new insights into the underlying biological mechanisms.16 These findings highlight the importance of considering both genetic and hormonal factors when investigating the relationship between PCOS and MS. Therefore, whether MS or other autoimmune diseases are causally associated with PCOS warrants further investigation and mechanistic validation.
Mendelian randomization (MR) is a genetics-based analytical approach that evaluates causal relationships between exposure factors and disease outcomes by using genetic variants as instrumental variables. For example, genetic variants associated with PCOS can be used to investigate their potential causal relationship with autoimmune diseases.17 This approach minimizes confounding and reverse causation, thereby allowing more robust causal inference. By leveraging genetic variants as naturally randomized instruments, MR provides stronger evidence for causality than conventional observational studies. Although previous studies have suggested potential associations between PCOS and autoimmune diseases, the causality and magnitude of these associations remain unclear.
Objectives
To clarify the direction of the causal relationship between autoimmune diseases and PCOS, we performed a 2-sample MR analysis using large-scale genome-wide association study (GWAS) data. To enhance the biological interpretability and clinical relevance of the MR findings, we further integrated transcriptomic analyses of publicly available gene expression datasets to identify shared differentially expressed genes (DEGs) between MS and PCOS. Functional enrichment analyses and predictive modeling were subsequently performed. This integrative approach aims to provide a more comprehensive understanding of the immune-related mechanisms underlying the potential association between MS and PCOS and to identify candidate biomarkers for future risk assessment and therapeutic targeting.
Materials and methods
Study design and participants
The causal association between autoimmune diseases and PCOS was investigated using a 2-sample MR analysis. The analysis was based on GWAS datasets for autoimmune diseases and PCOS obtained from publicly available resources. Genetic variants represented by single nucleotide polymorphisms (SNPs) that were significantly associated with autoimmune diseases were selected as instrumental variables. The MR approach is based on 3 core assumptions: 1) the instrumental SNPs are strongly associated with the exposure (autoimmune diseases); 2) the selected SNPs are independent of potential confounding factors; and 3) the SNPs influence PCOS only through the exposure, with no alternative causal pathways.
A total of 8 autoimmune diseases were included as exposure variables: systemic lupus erythematosus, ankylosing spondylitis, MS, celiac disease, T1D, Crohn’s disease, juvenile idiopathic arthritis, and primary biliary cholangitis. Polycystic ovary syndrome was analyzed as the outcome. Mendelian randomization analyses were performed using the inverse-variance weighted (IVW), weighted median, and MR-Egger methods. Sensitivity analyses were conducted to evaluate the robustness and validity of the findings. An overview of the study design is presented in Supplementary Fig. 1.
To enhance the biological interpretability and clinical relevance of the MR findings, we further integrated transcriptomic analyses, including differential gene expression analysis, functional enrichment analyses (GO and KEGG), and predictive nomogram construction.
Data sources and measurement
This study used data obtained from 2 large GWAS resources (https://gwas.mrcieu.ac.uk) to ensure adequate statistical power and reliability. PCOS-related genetic data were obtained from the FinnGen database (R8 release), which included 118,870 individuals with PCOS and covered 16,379,676 SNPs, and from the European Bioinformatics Institute (EBI) GWAS Catalog, which included 141,355 individuals with PCOS and covered 22,981,890 SNPs.
Genetic data for autoimmune diseases were obtained from multiple GWAS datasets covering systemic lupus erythematosus, ankylosing spondylitis, MS, celiac disease, T1D, Crohn’s disease, juvenile idiopathic arthritis, and primary biliary cholangitis, with sample sizes ranging from 1,219 to 520,580 participants. All datasets included in this study were derived from populations of European ancestry to minimize potential bias due to population stratification. Detailed information on each dataset, including sample size and SNP coverage, is provided in Table 1.
To enhance the biological interpretability of the MR findings, we integrated transcriptomic data from 2 Gene Expression Omnibus (GEO) datasets: GSE209596 (memory regulatory T (mTreg) and memory effector T (mTeff) cells from 37 patients with MS and 40 healthy controls) and GSE277906 (cumulus cells from 23 patients with PCOS and 17 controls without PCOS). These datasets were used to identify and functionally characterize DEGs.
Variables
Selection of instrumental variables
Single nucleotide polymorphisms significantly associated with the exposure (autoimmune diseases) were selected as instrumental variables using a genome-wide significance threshold of p < 5 × 10–8.18 When no eligible SNPs met this criterion, a more relaxed threshold of p < 5 × 10⁻⁶ was applied. To ensure the independence of the selected SNPs, linkage disequilibrium (LD) pruning was performed using an LD threshold of r2 < 0.001 within a 1,000-kb window. Single nucleotide polymorphisms with an F statistic ≤10 were considered weak instruments and excluded from the analysis, whereas those with an F statistic >10 were retained.
Mendelian randomization analysis
The TwoSampleMR package (v. 0.5.7; https://github.com/MRCIEU/TwoSampleMR) in R (R Foundation for Statistical Computing, Vienna, Austria) was used to perform MR analyses and investigate the causal relationship between autoimmune diseases and PCOS. The MR analyses included the IVW, weighted median, MR-Egger, simple mode, and weighted mode methods, allowing causal estimates to be evaluated using multiple complementary approaches.19 The IVW method combines the effects of multiple genetic variants using inverse-variance weighting, assuming that all instrumental variables are valid and unaffected by horizontal pleiotropy. Because the IVW method is sensitive to horizontal pleiotropy, sensitivity analyses were performed to assess the robustness of the findings. Applying all 5 MR methods enhances the robustness and reliability of the causal inference. Consistent findings across the different methods strengthen the evidence for a causal relationship, whereas inconsistent results warrant further investigation of potential pleiotropy or the validity of the selected instrumental variables. As the primary analytical method, IVW was used to assess the causal relationship between the exposure and the outcome, whereas the remaining methods provided supportive evidence. A positive result was defined as consistent directions of effect (all β coefficients either >0 or <0) across the IVW, weighted median, and MR-Egger methods, together with an IVW p < 0.05.
Sensitivity analyses
To validate the stability and credibility of MR results, extensive sensitivity analyses were carried out.20 Cochran’s Q test was used to assess heterogeneity, with a Q_pval > 0.05 indicating no heterogeneity. Heterogeneity prompted the use of either the weighted median method or the IVW random-effects model. In the absence of heterogeneity, the IVW random-effects model was used. Additionally, when sensitivity analyses indicated pleiotropy, the MR-PRESSO test was applied to identify and adjust for horizontal pleiotropy, enhancing the reliability of causal estimates. A pleiotropy p > 0.05 indicated no pleiotropy. If pleiotropy was detected, outliers were removed and the analysis was repeated; persistent pleiotropy led to exclusion of the result. The effect of each SNP on the overall estimate was assessed using a leave-one-out sensitivity analysis.
Differential expression analysis
Transcriptomic data were obtained from the GEO database, specifically GSE209596 (MS) and GSE277906 (PCOS). Differential expression analysis was carried out using the R package limma (https://bioconductor.org/packages/release/bioc/html/limma.html). After log2 normalization of the expression matrices, a design matrix was constructed, and differential expression was evaluated using a linear model with empirical Bayes (eBayes) moderation. Genes with |log2FC| > 0.585 and a false discovery rate (FDR) <0.05 were considered significantly DEGs. The distribution and expression patterns of the DEGs were visualized using volcano plots and heatmaps.
Enrichment analysis
In order to explore the potential biological functions of disease-related target genes, target genes were subjected to GO and KEGG pathway enrichment analysis. First, the gene symbols were converted to Entrez IDs using the org.Hs.eg.db data package, and the clusterProfiler package was used to perform annotation analysis after removing genes that could not be mapped. In the GO analysis, the 3 major ontology categories (Biological Process, Cellular Component, and Molecular Function) were selected, and the thresholds for the p-value and q-value were set at 0.05. The KEGG pathway enrichment analysis was performed using the enrichKEGG function, and the significance thresholds were also set at p < 0.05 and q < 0.05.
Nomogram construction
A logistic regression-based nomogram model was constructed using key DEGs as predictive variables. Receiver operating characteristic (ROC) curve analysis was used to assess the model’s discriminative ability, and decision curve analysis (DCA) was conducted to evaluate its net clinical benefit, highlighting its clinical utility.
Statistical analyses
Data analyses were executed using R v. 4.3.3 and GraphPad Prism v. 10.0.2 (GraphPad Software, San Diego, USA). Continuous variables were expressed as the mean ± standard deviation (SD) for normally distributed data and as the median with the interquartile range (IQR) for non-normally distributed data. The Shapiro–Wilk test was used to assess normality. For comparisons between 2 groups, either Student’s t test or the Mann–Whitney U test was applied, as appropriate. For comparisons among 3 or more groups, one-way analysis of variance (ANOVA) followed by Tukey’s post hoc test or the Kruskal–Wallis test followed by Dunn’s multiple comparisons test was used. Correlation analyses were conducted using Pearson’s or Spearman’s methods, depending on data distribution. A 2-tailed p < 0.05 was considered statistically significant.
Results
Effect of autoimmune diseases on PCOS from the FinnGen database
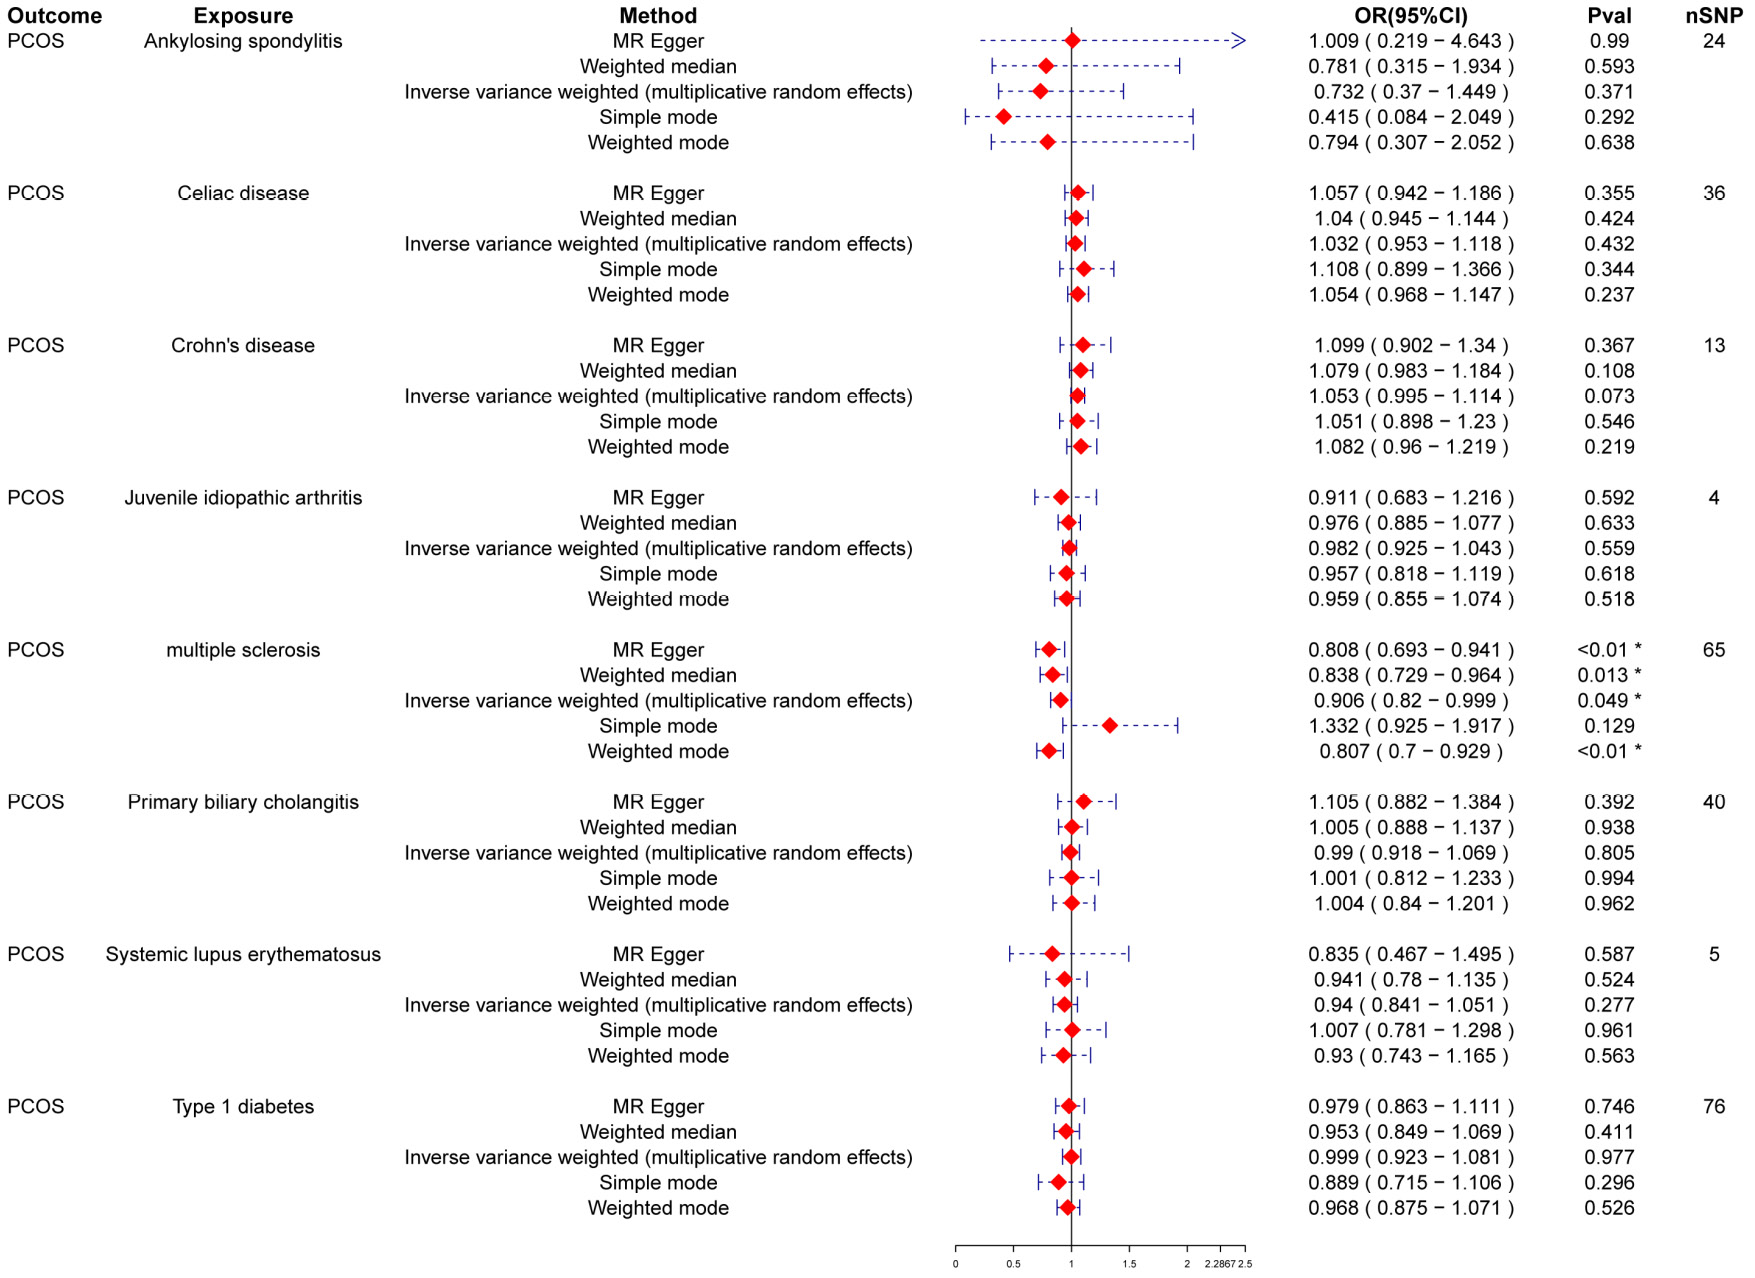
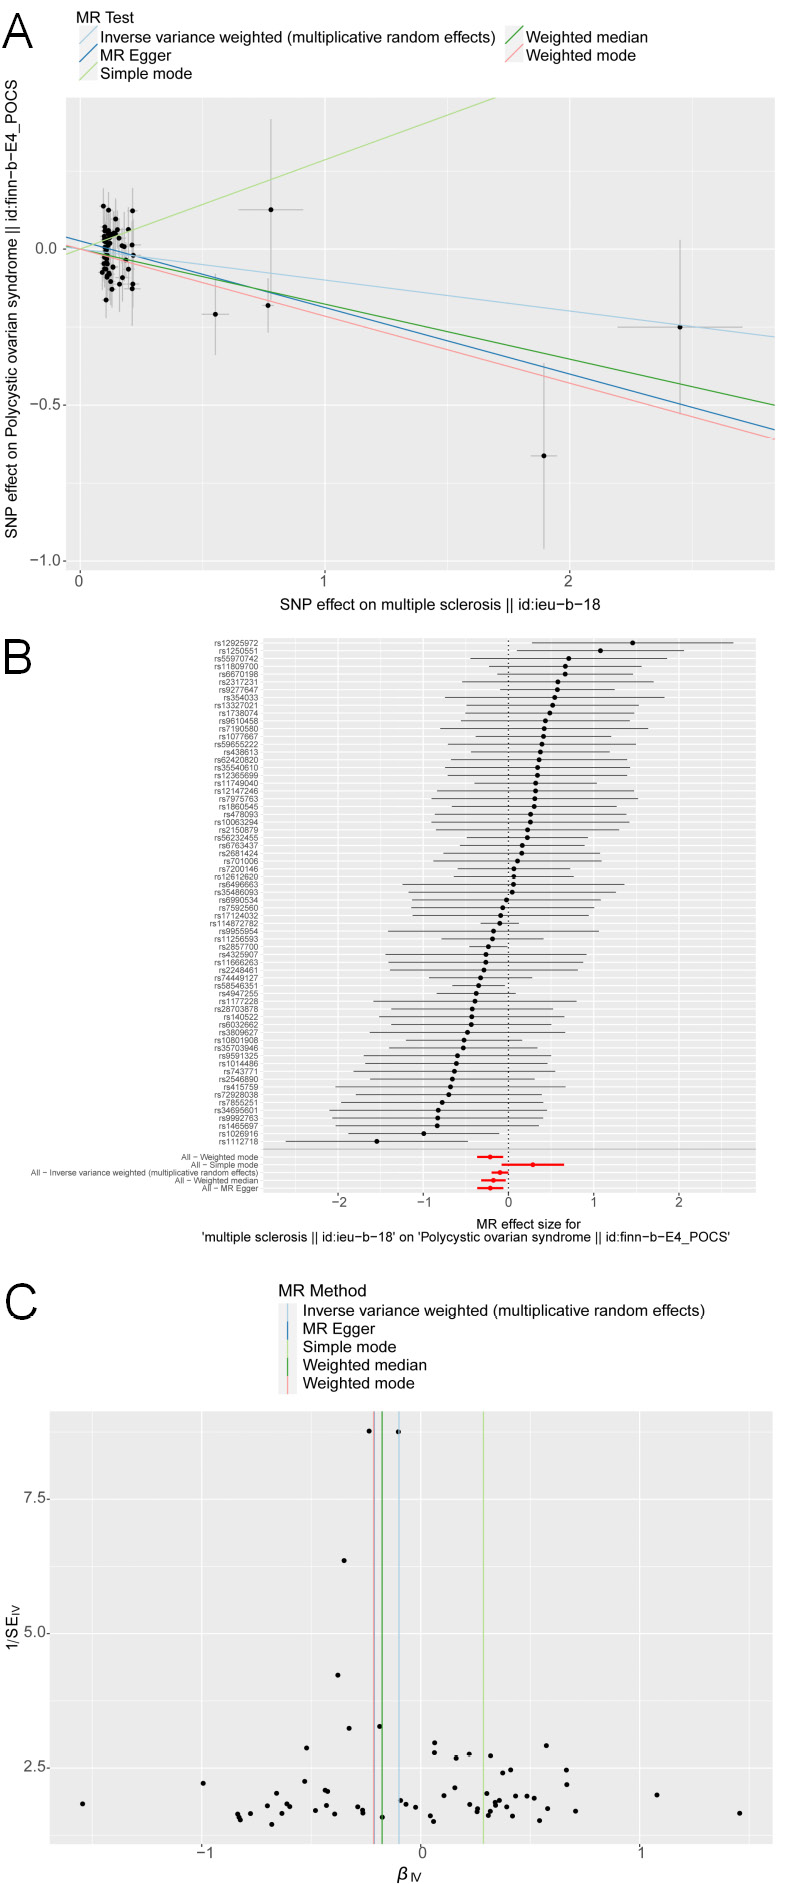
Using the FinnGen dataset, MR analysis estimated a weak protective causal relationship between MS and PCOS, with the IVW method yielding an odds ratio (OR) of 0.906 (95% confidence interval (95% CI): 0.820–0.999, p = 0.049) (Figure 1). MR-Egger, IVW, and weighted median analyses revealed consistent trends (Figure 2). Sensitivity analyses showed no statistically significant heterogeneity (Q_pval > 0.05) or pleiotropy (pval > 0.05) (Table 2), indicating that the observed association was not driven by horizontal pleiotropy. No significant causal associations were observed between PCOS and the other autoimmune diseases included in the analysis, namely ankylosing spondylitis, celiac disease, Crohn’s disease, juvenile idiopathic arthritis, primary biliary cholangitis, systemic lupus erythematosus, and T1D (all p > 0.05), as summarized in Table 2, Table 3. To account for multiple testing across all autoimmune diseases, we applied the Benjamini–Hochberg FDR correction to the IVW p-values; however, the MS–PCOS association did not remain significant after adjustment (Supplementary Table 1). These findings suggest that, if autoimmune factors contribute to PCOS, their effects are likely disease-specific rather than generalizable across autoimmune disorders.
Effect of autoimmune diseases on PCOS from the EBI database
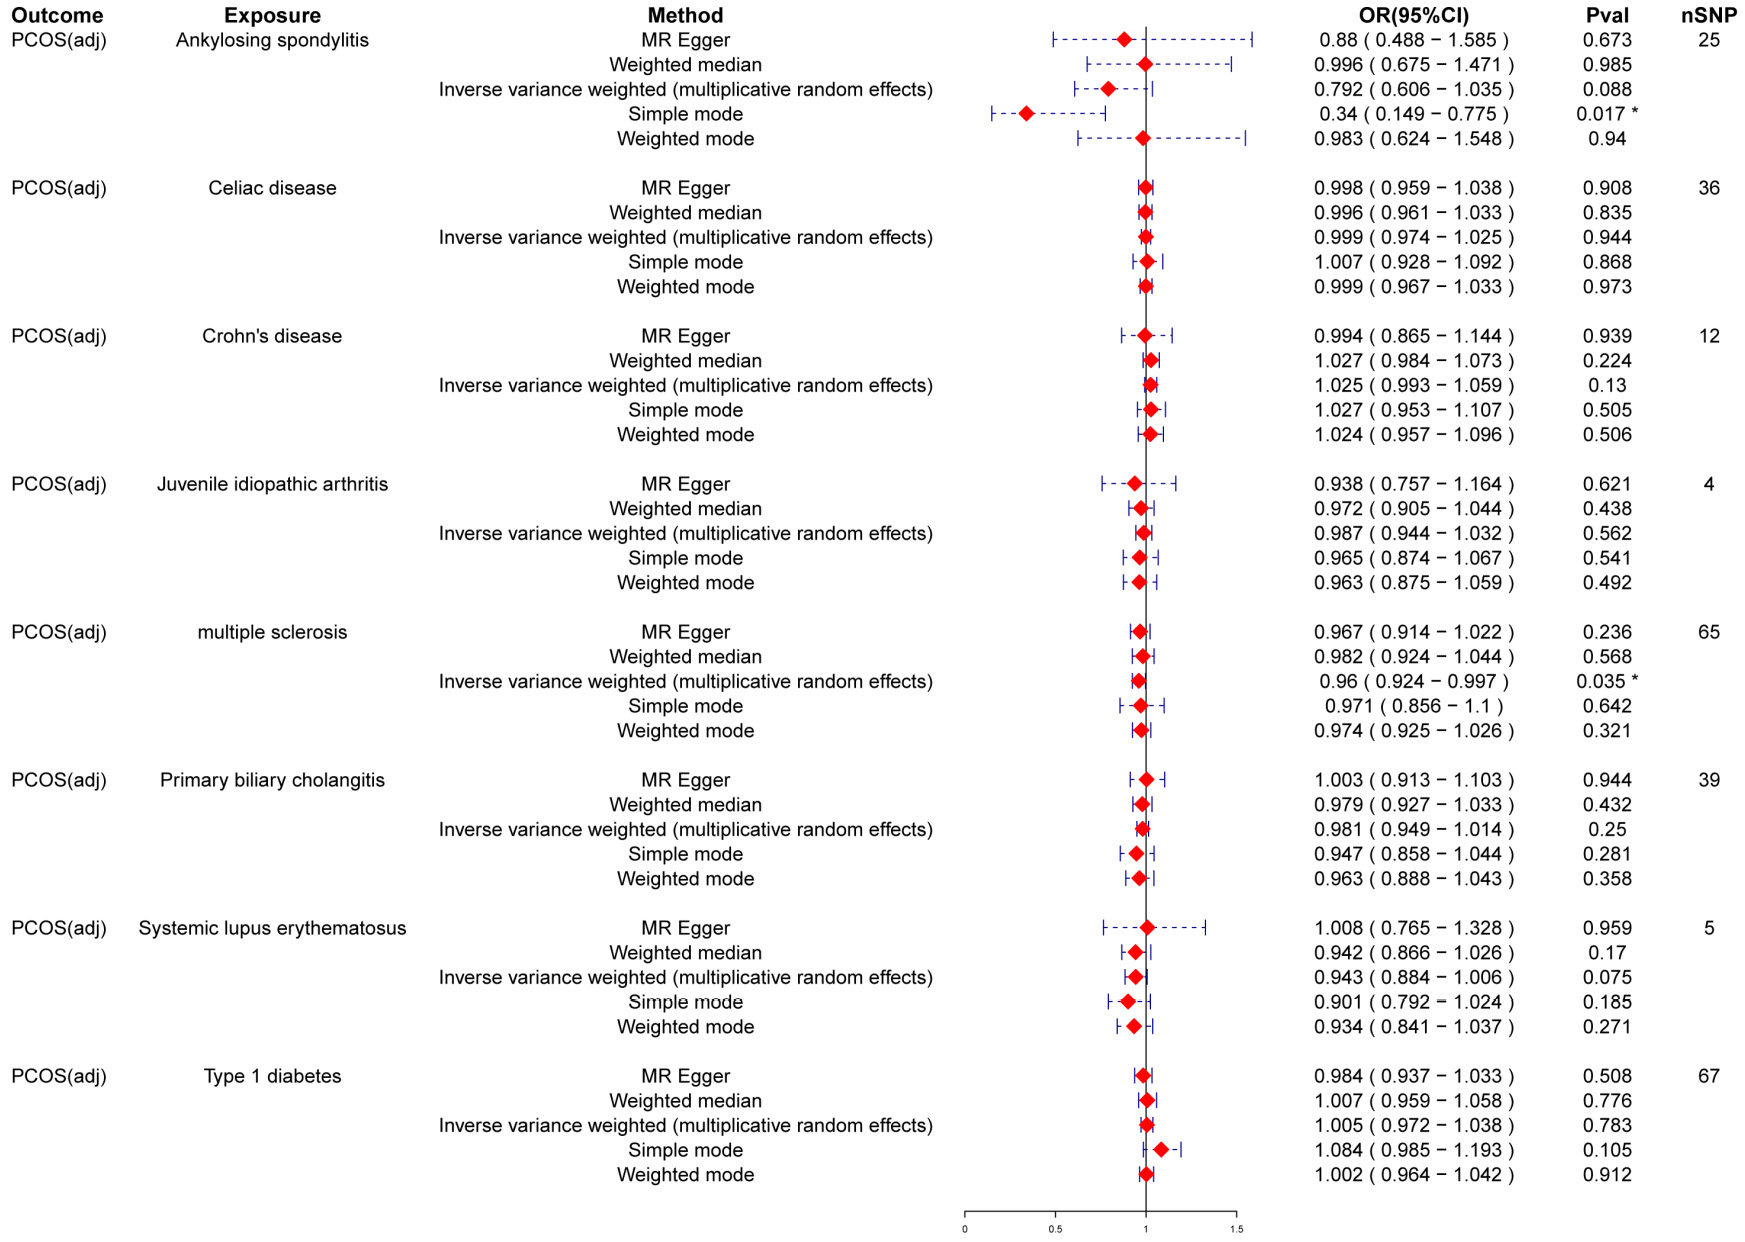
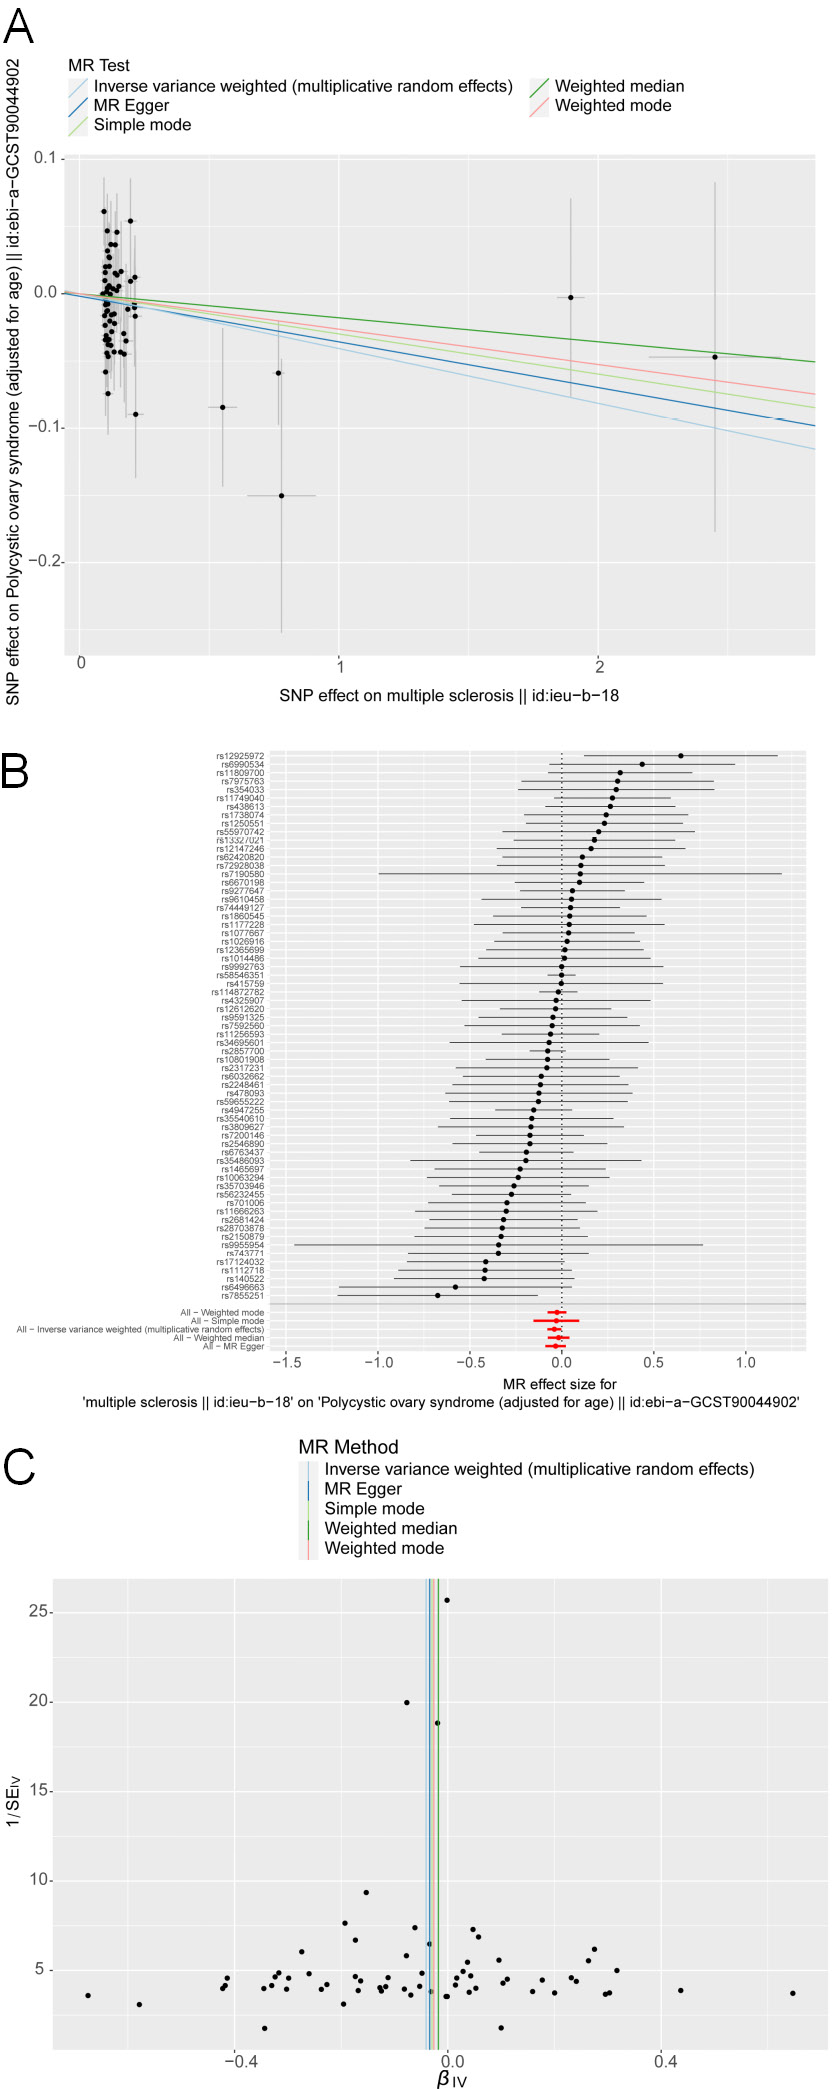
To further investigate the observed relationship and eliminate potential confounding by age, an additional MR analysis was conducted using age-standardized PCOS data from the EBI database. The results remained consistent, with the IVW method estimating an OR = 0.960 (95% CI: 0.924–0.997, p = 0.035) (Figure 3) for the protective effect of MS on PCOS. MR-Egger, IVW, and weighted median analyses revealed consistent trends (Figure 4). Sensitivity analyses showed no statistically significant heterogeneity (Q_pval > 0.05) or pleiotropy (pval > 0.05) (Table 3), reinforcing the robustness of the observed association. After applying FDR correction, the inverse association between MS and PCOS was no longer significant in the EBI analysis (Supplementary Table 1).
Differential expression analysis and identification of key genes in MS and PCOS
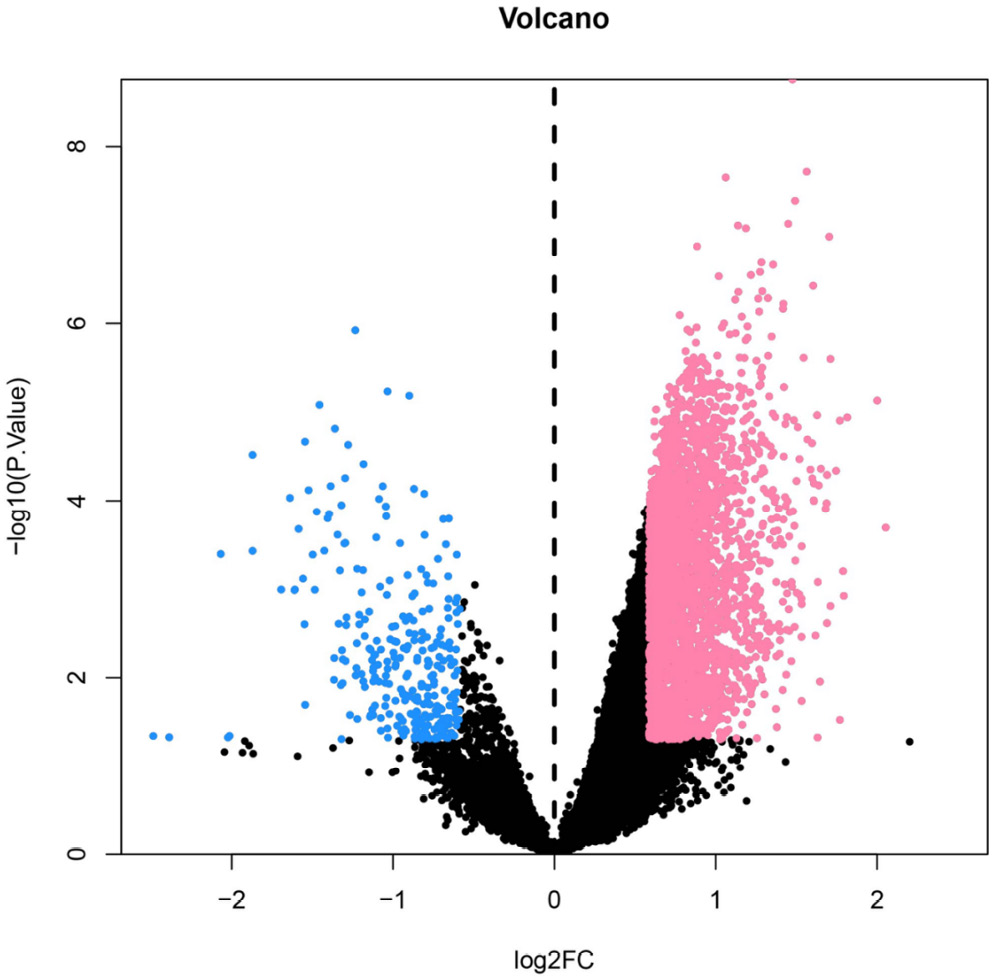
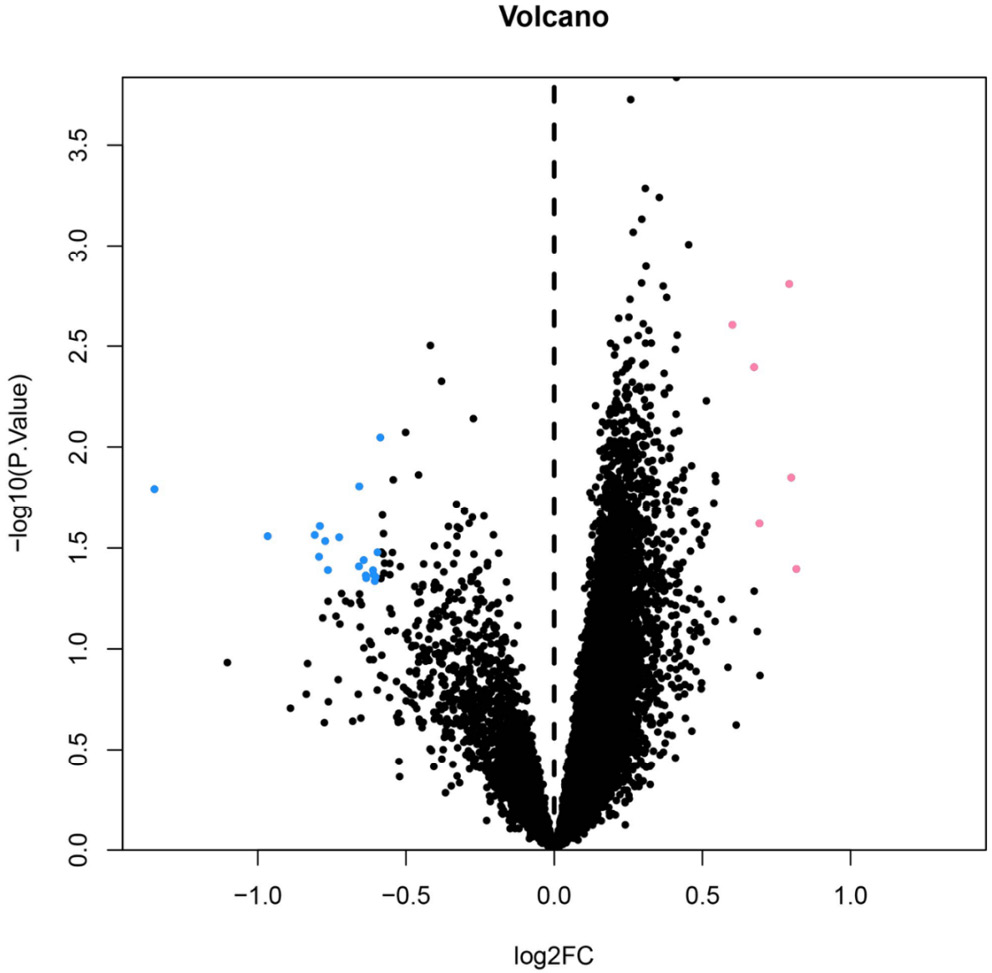
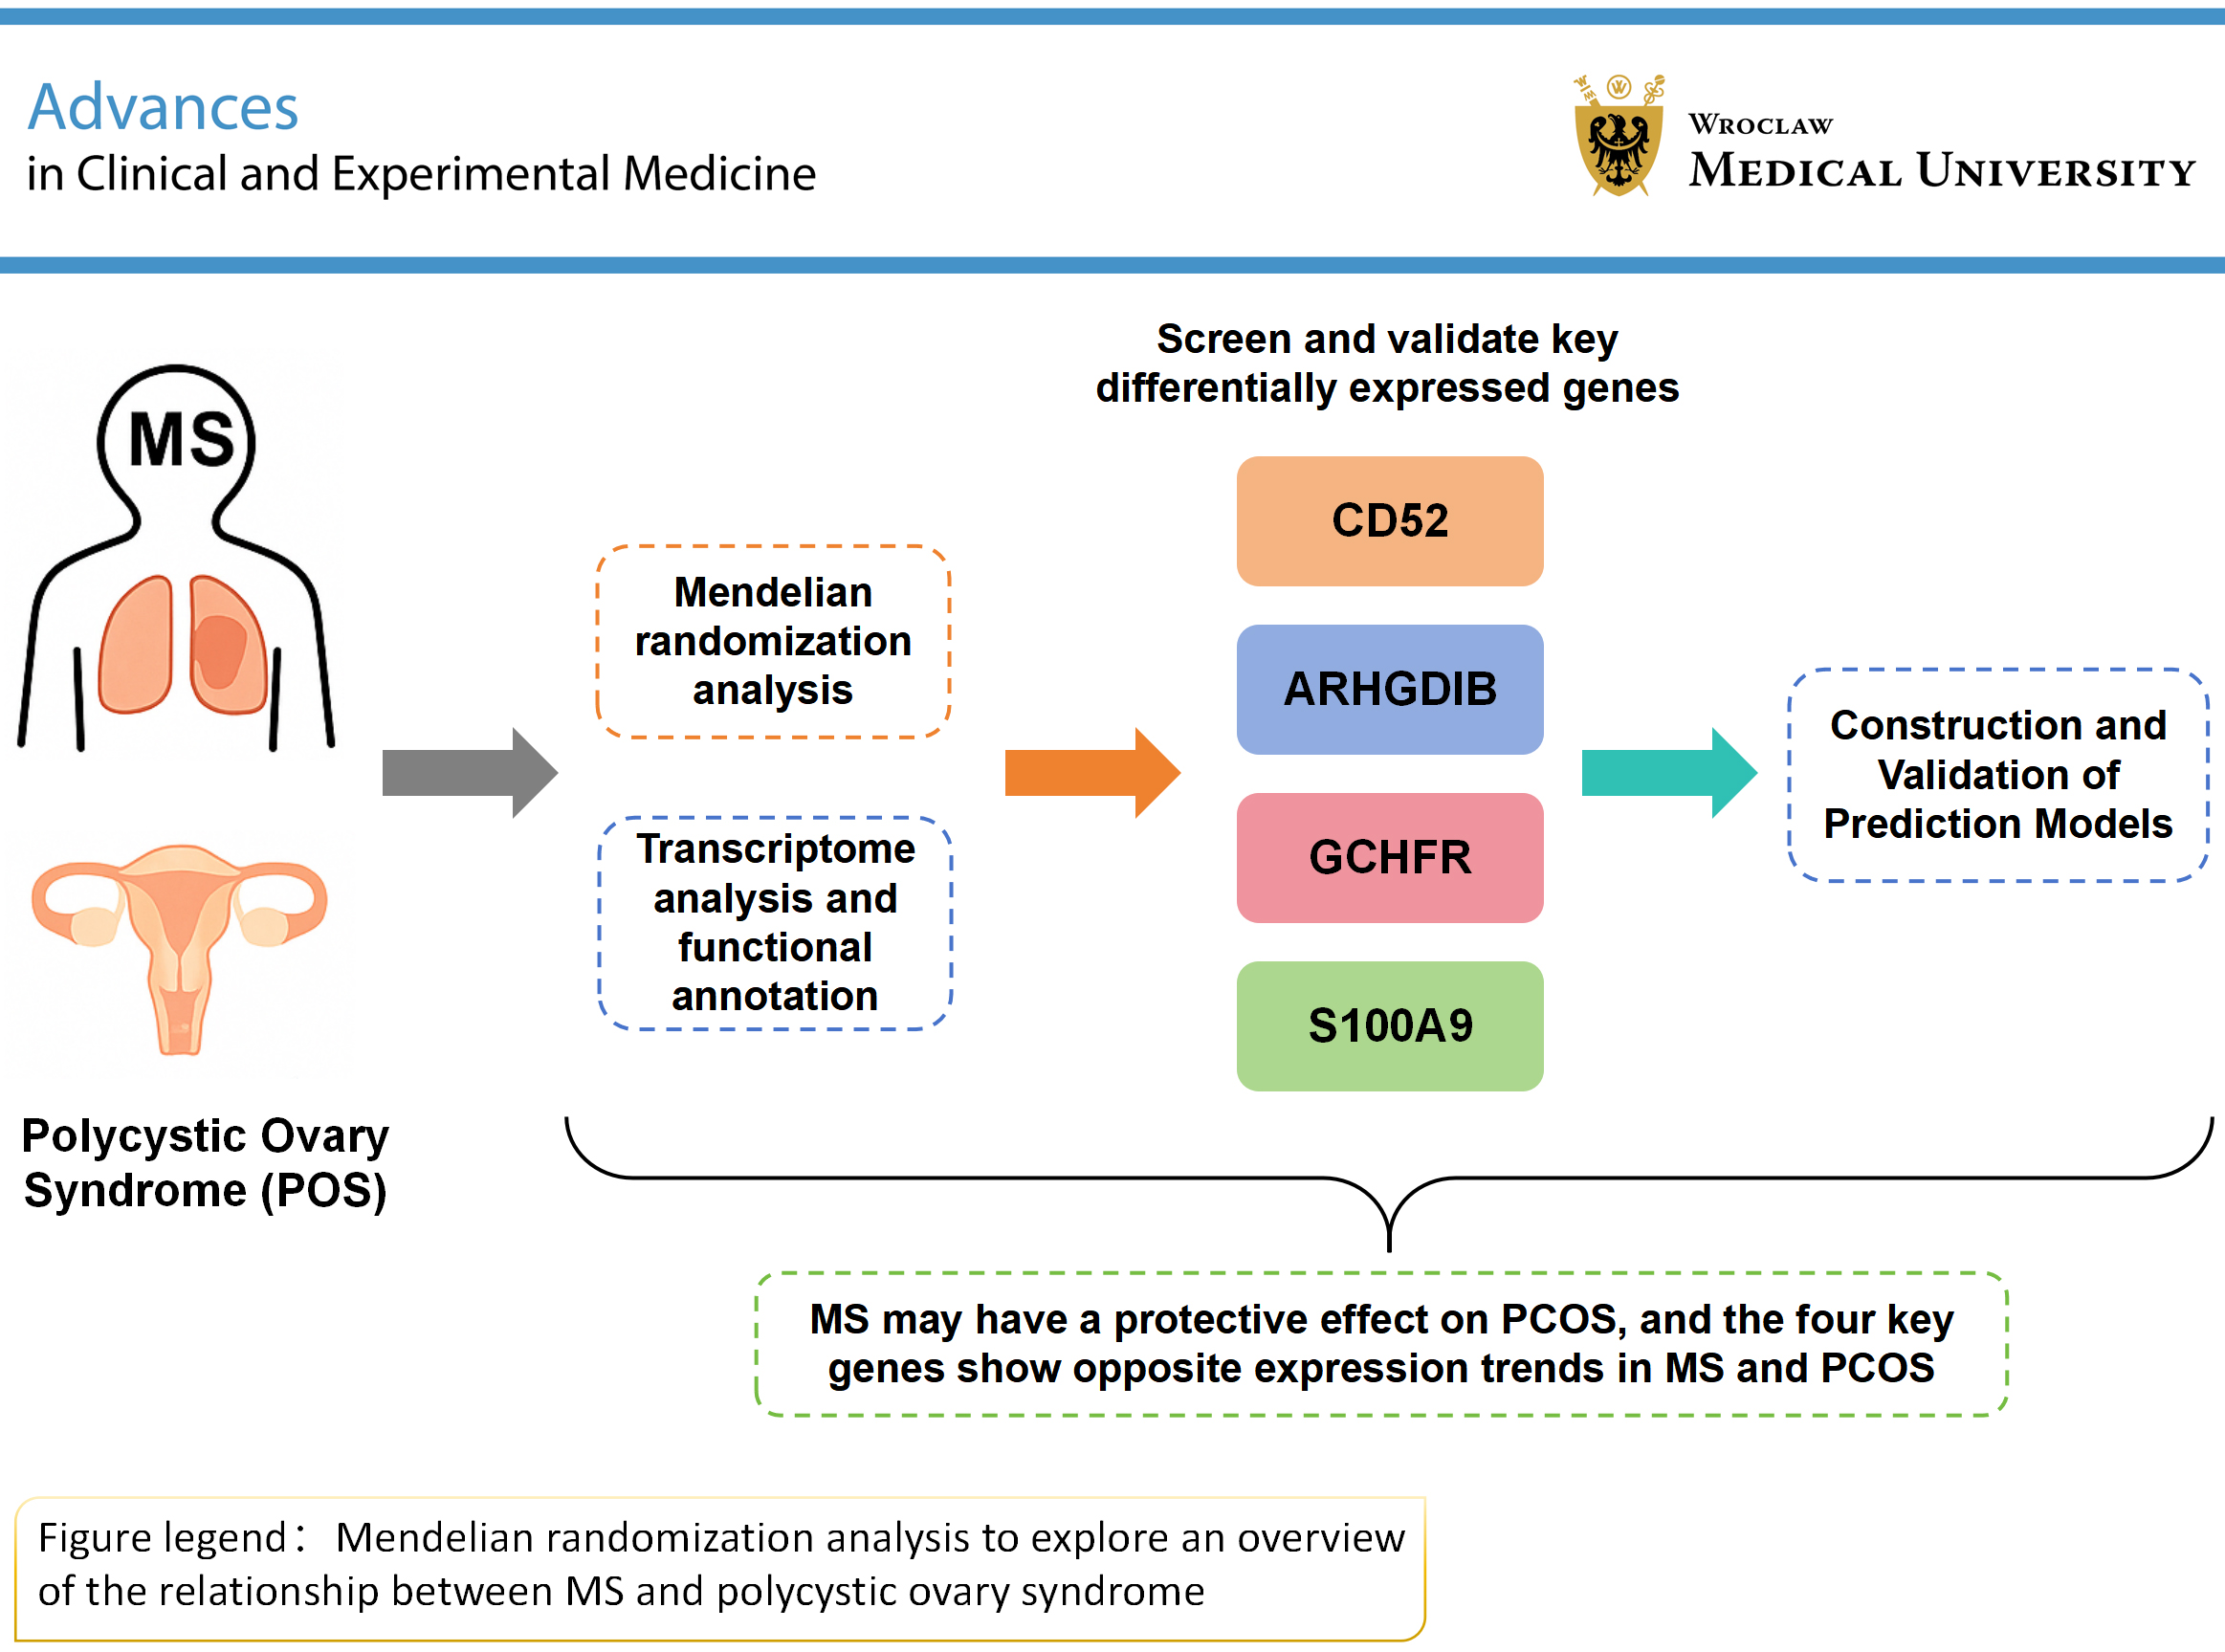
In the MS dataset, a total of 3,316 significantly DEGs were identified through differential analysis between the disease and control groups, including 3,028 upregulated and 288 downregulated genes (Supplementary Table 2). A volcano plot clearly illustrates the distribution of significantly upregulated (red) and downregulated (blue) DEGs (Figure 5). In the PCOS dataset, 25 significant DEGs were identified, comprising 6 upregulated and 19 downregulated genes (Supplementary Table 3), as visualized in Figure 6. Subsequently, the intersection of the 2 DEG sets revealed 4 shared DEGs: CD52, ARHGDIB, GCHFR, and S100A9 (Supplementary Fig. 2).
Functional enrichment analysis of key DEGs via GO and KEGG
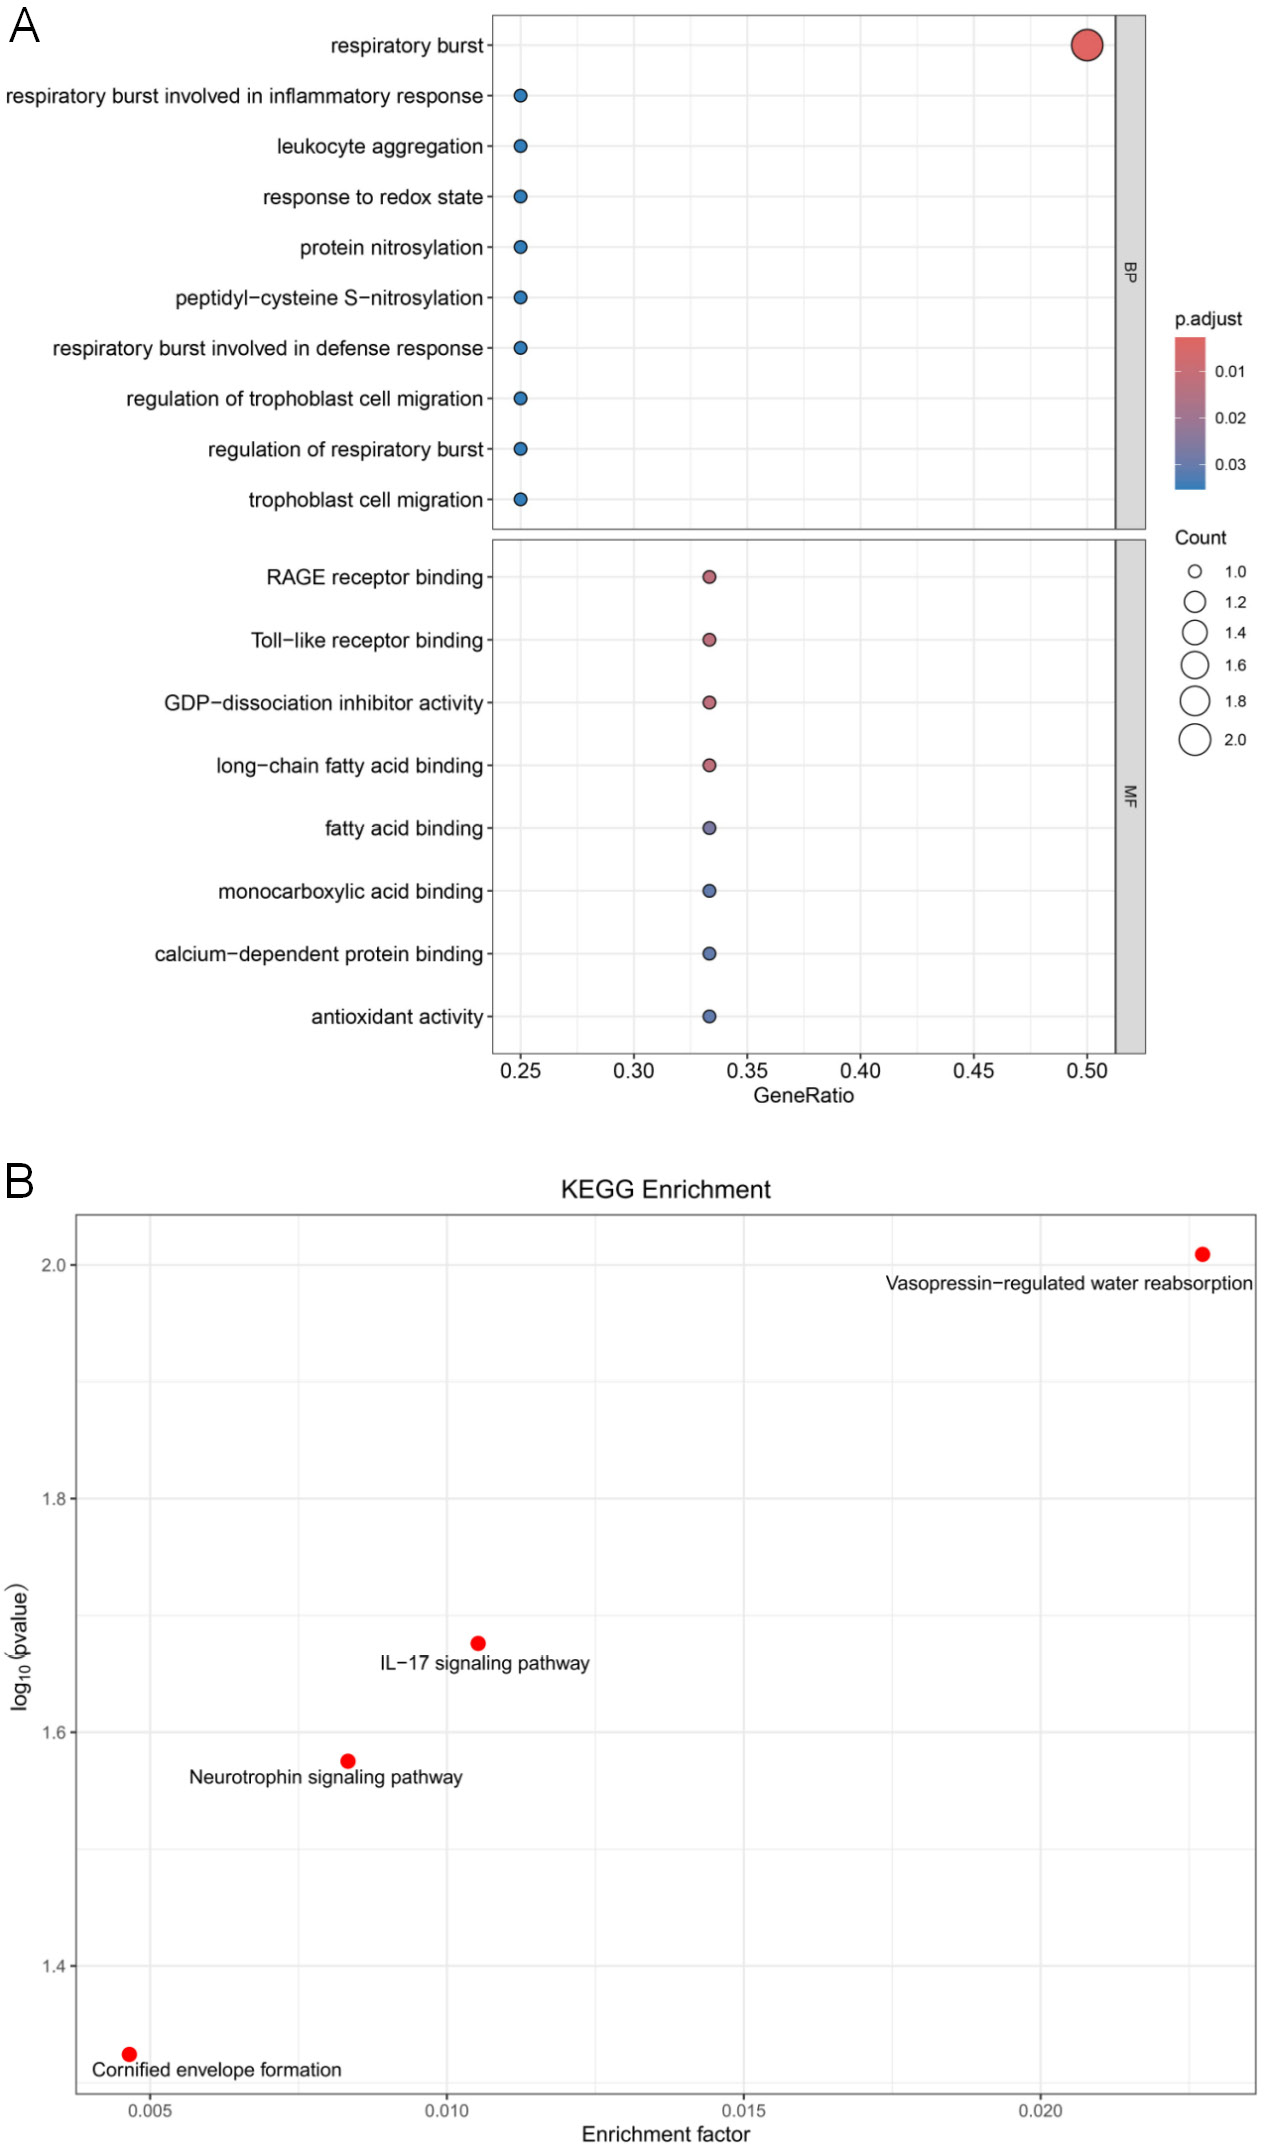
Gene Ontology (GO) enrichment analysis showed that these genes were significantly enriched in multiple immune- and inflammation-related biological processes. For example, the enriched biological processes included regulation of the immune response, leukocyte migration, cell chemotaxis, and T-cell activation. These findings suggest that the key genes may be involved in regulating the host immune response, particularly the immune imbalance observed in inflammatory disease states. Gene Ontology analysis also identified pathways involved in cytokine-mediated signal transduction and endocrine–immune interactions, further supporting their close association with disease-related immune mechanisms (Figure 7A; Supplementary Table 4).
In the KEGG pathway enrichment analysis, the key genes were significantly enriched in several well-established signaling pathways, including the neurotrophin signaling pathway, interleukin (IL)-17 signaling pathway, and vasopressin-regulated water reabsorption. Among these, the IL-17 signaling pathway is closely associated with a variety of autoimmune and metabolic diseases, whereas the neurotrophin signaling pathway is involved in inflammatory regulation and cell survival. These results suggest that the key genes may contribute to immune regulation and participate in disease development through the neuroimmune axis (Figure 7B; Supplementary Table 5).
Construction and evaluation of predictive nomogram models based on key DEGs
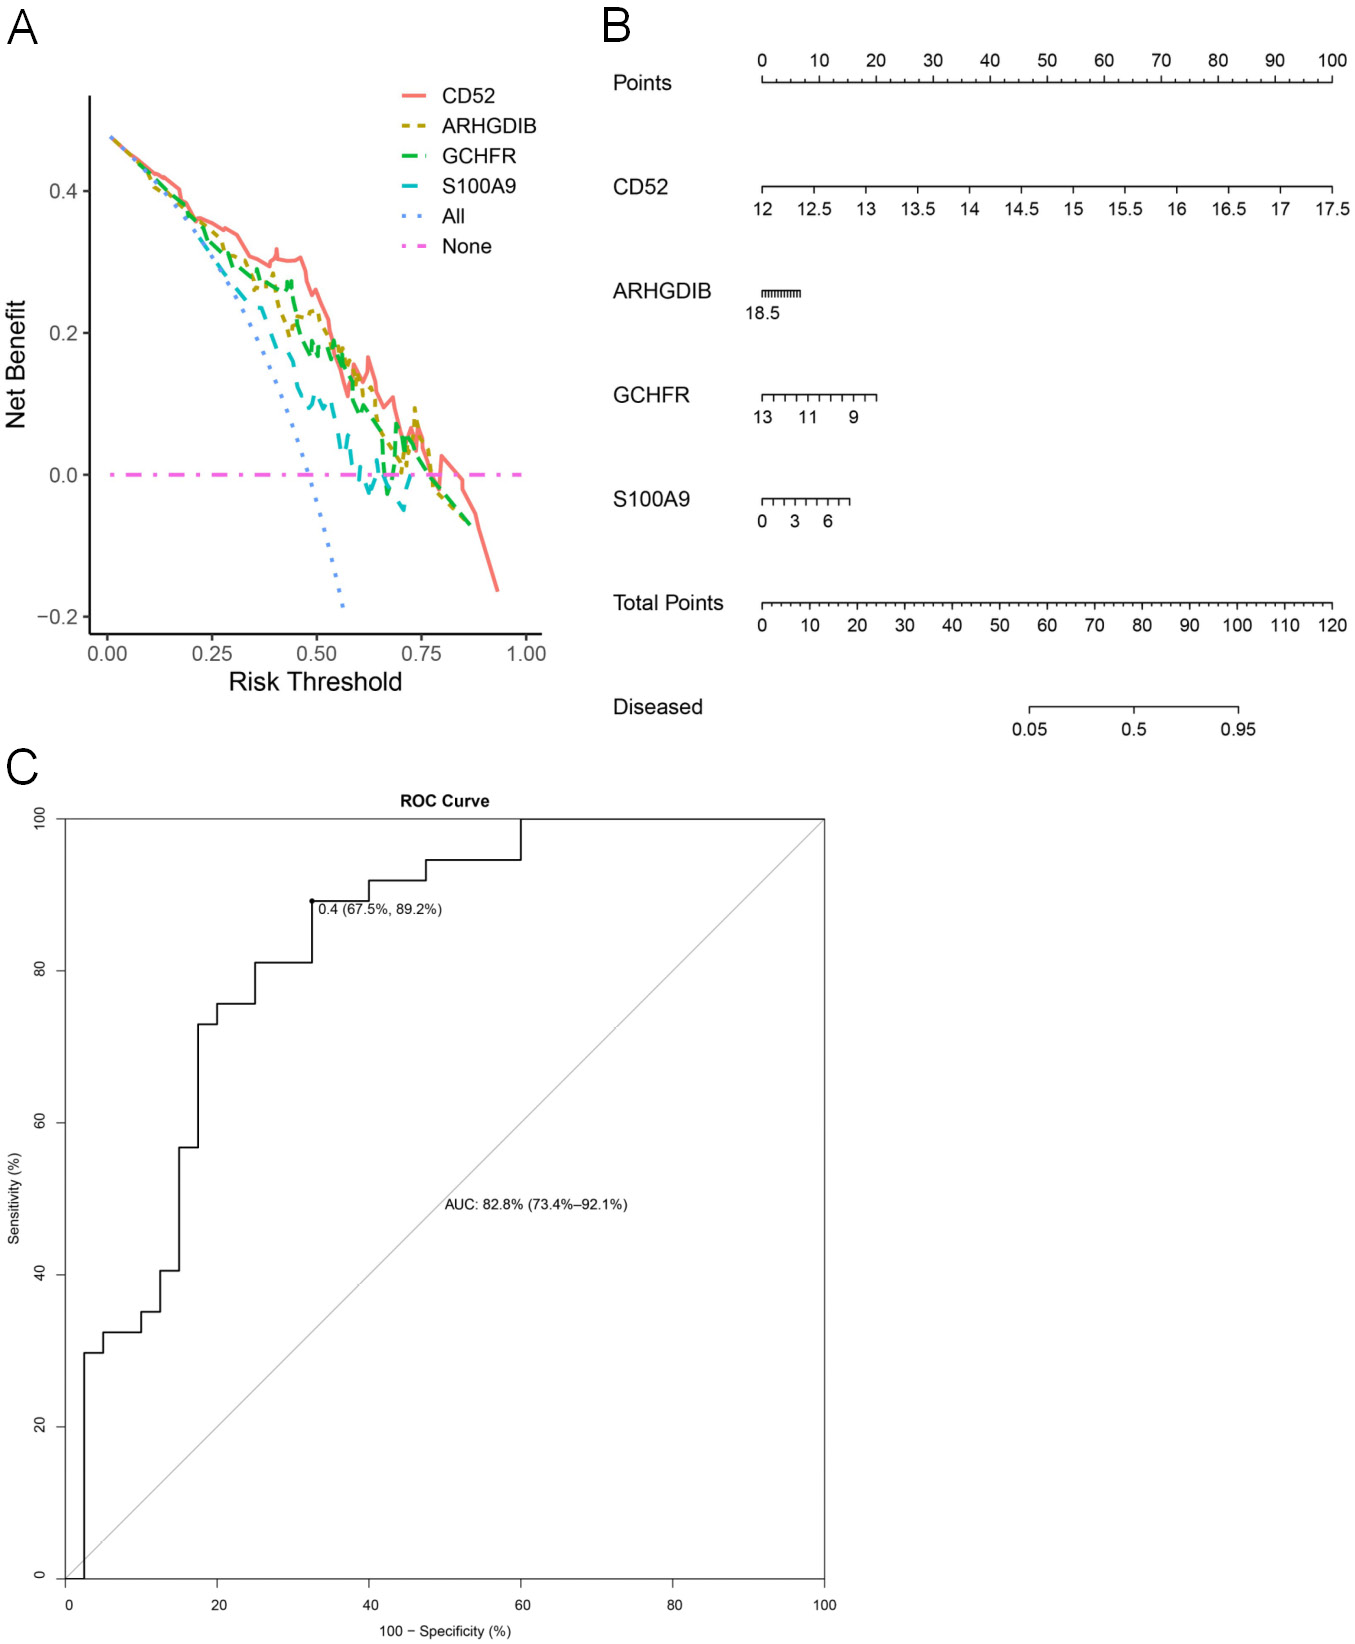
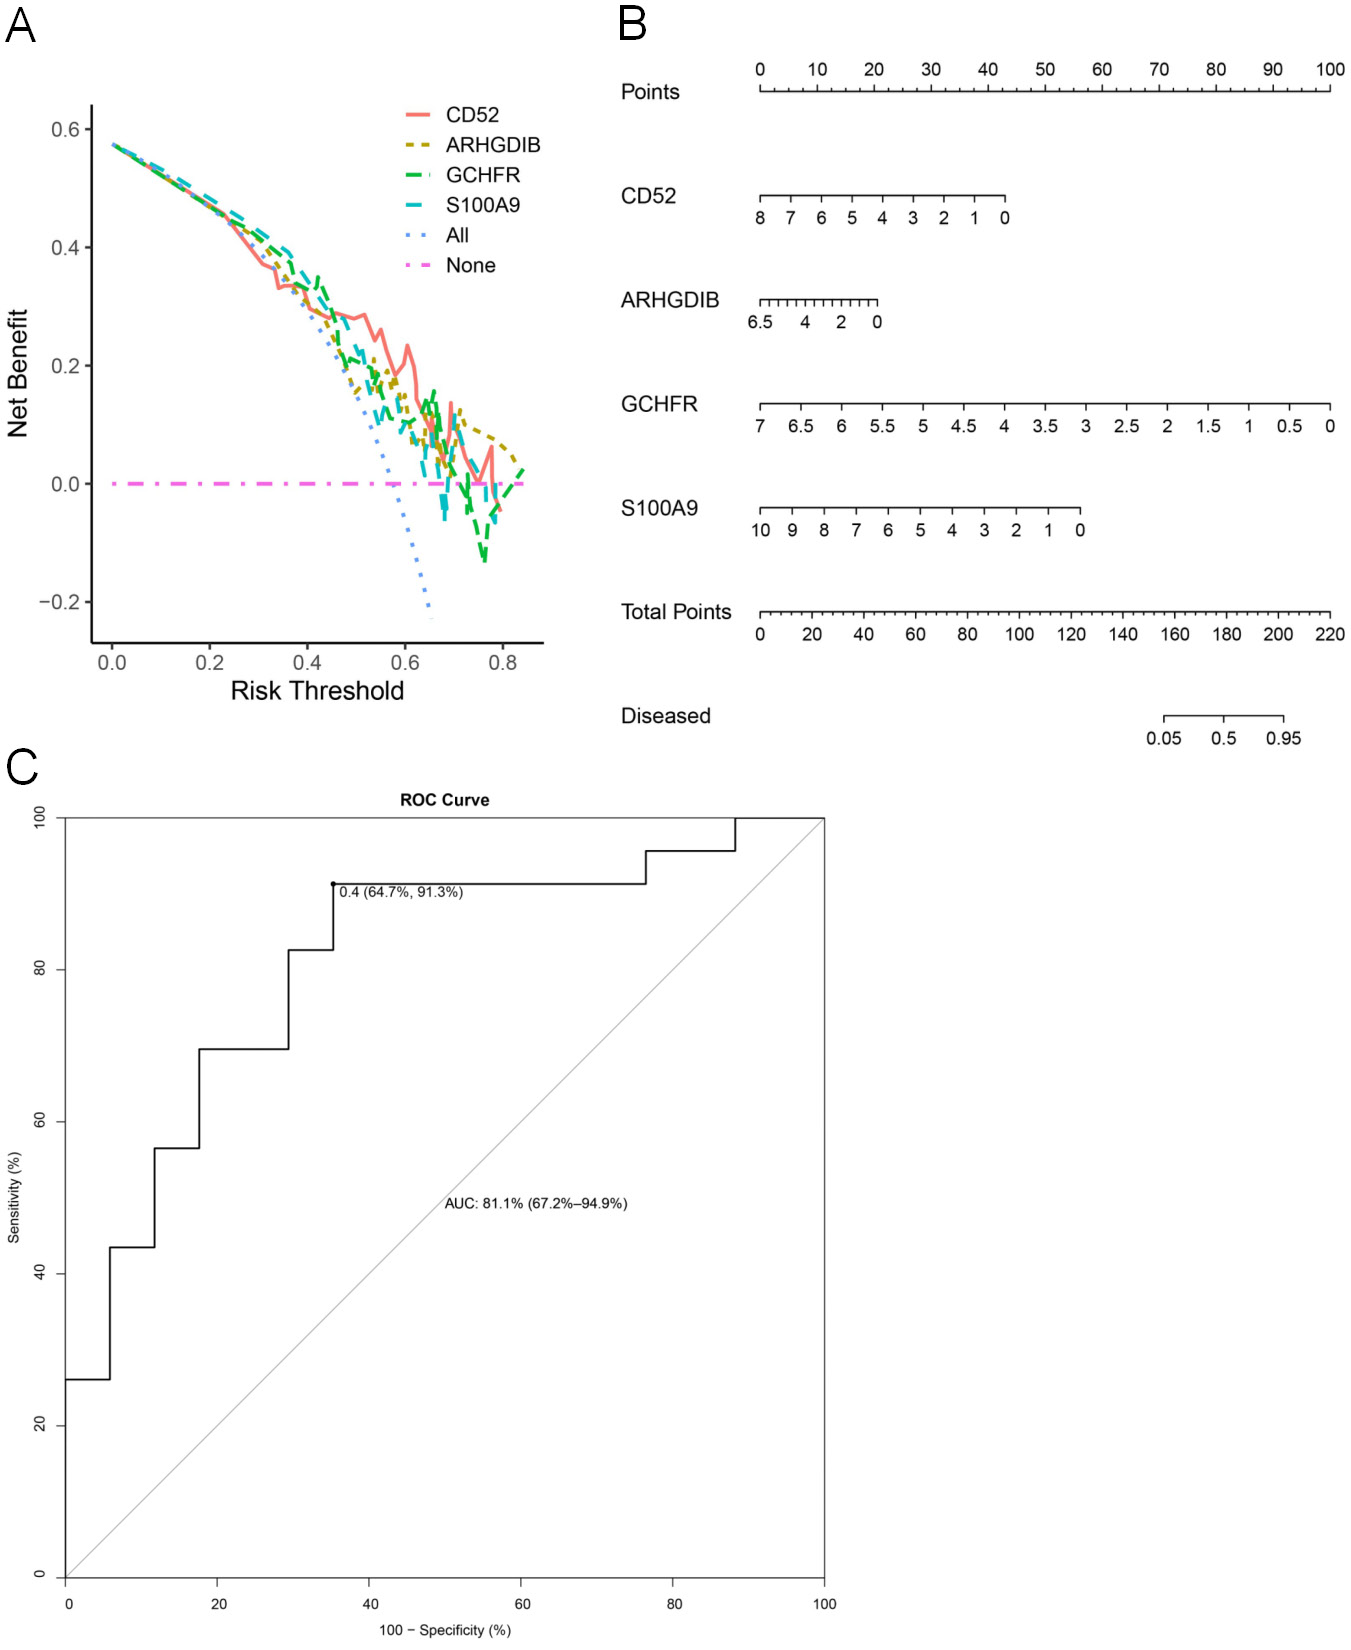
To evaluate the diagnostic utility of the 4 shared hub genes (CD52, ARHGDIB, GCHFR, and S100A9), we constructed multivariable logistic regression-based nomogram models for both MS and PCOS. The predictive performance of each model was assessed using ROC and DCA. In the MS cohort, the model demonstrated excellent discriminative ability, with an area under the curve (AUC) of 82.8% (95% CI: 73.4–92.1%). Decision curve analysis further confirmed a net clinical benefit across a wide range of threshold probabilities, highlighting the model’s potential clinical applicability (Figure 8). Similarly, the nomogram constructed for the PCOS cohort achieved an AUC of 81.1% (95% CI: 67.2–94.9%), accurately discriminating patients from controls and demonstrating strong diagnostic performance. The DCA curve showed a favorable net benefit, reinforcing its applicability for risk prediction and early clinical intervention (Figure 9). The combined expression profile of the 4 hub genes may serve as a practical biomarker panel for individualized risk assessment in both MS and PCOS populations.
Discussion
Polycystic ovary syndrome is a common endocrine and metabolic disorder with a multifactorial pathogenesis involving hormonal imbalance, insulin resistance, and low-grade chronic inflammation.1, 21 In this study, we identified a novel inverse causal relationship between MS and PCOS using 2-sample MR. This finding was consistently observed across 2 large GWAS datasets and remained robust under multiple analytical frameworks. To further explore the underlying mechanisms, we integrated transcriptomic profiling and identified 4 shared hub genes (CD52, ARHGDIB, GCHFR, and S100A9) that exhibited opposite expression patterns in MS and PCOS. Functional enrichment analyses implicated these genes in immune and neuroendocrine pathways. Together, our findings provide evidence for immunological divergence between MS and PCOS and suggest candidate molecular targets for future investigation.
The marked difference in the number of DEGs between MS and PCOS may result from variations in sample size, tissue type, and analytical thresholds. The MS dataset, derived from immune cells, reflects broad inflammatory changes, whereas the PCOS dataset, based on cumulus cells, represents a localized endocrine environment with subtler transcriptomic alterations. Despite the smaller DEG set in the PCOS dataset, the shared genes likely indicate biologically robust immune–endocrine interactions.
It is also noteworthy that no significant causal associations were found between PCOS and the other autoimmune diseases. This may be explained by limited statistical power in some GWAS datasets, weak genetic correlations between PCOS and most autoimmune traits, or biological heterogeneity among different autoimmune disorders. These factors suggest that the observed association between MS and PCOS is likely disease-specific and may reflect distinct immune and endocrine interactions rather than a generalized autoimmune effect. Although the MS–PCOS association reached nominal significance, it did not remain significant after FDR correction, indicating that this result should be interpreted with caution and validated in larger cohorts.
The downstream transcriptomic analysis identified 4 hub genes (CD52, ARHGDIB, GCHFR, and S100A9) that were differentially expressed in MS and PCOS but in opposite directions, highlighting a shared yet antagonistically regulated immune signature. CD52, a lymphocyte surface antigen and the therapeutic target of alemtuzumab in MS, is known to suppress T-cell activation.22 Interestingly, downregulation of CD52 has been observed in granulosa and cumulus cells from patients with PCOS, potentially contributing to impaired immune privilege and altered folliculogenesis.23
S100A9 is a calcium-binding protein that typically forms a heterodimer with S100A8, known as calprotectin. It acts as a damage-associated molecular pattern (DAMP) molecule in various inflammatory diseases.24 Studies have shown that serum levels of the S100A8/S100A9 complex are significantly elevated in patients with MS, potentially contributing to central nervous system inflammation and demyelination by activating microglia and promoting the release of pro-inflammatory cytokines.25 In PCOS, upregulation of S100A9 has been associated with insulin resistance and low-grade chronic inflammation, suggesting that it may contribute to the pathogenesis of both diseases through distinct mechanisms, reflecting its multifunctional role in immune and metabolic regulation.26
ARHGDIB has been linked to neutrophil function and blood–brain barrier regulation,27 while GCHFR may influence neurotransmitter balance in MS and nitric oxide availability in ovarian tissue in PCOS by regulating tetrahydrobiopterin metabolism.28 Additionally, previous studies have also reported downregulation of CD52 and ARHGDIB in immune cells from PCOS patients, accompanied by increased pro-inflammatory cytokines, indicating a shift toward a pro-inflammatory immune profile.29 The nomogram model constructed based on these 4 key genes demonstrated strong predictive performance in both MS and PCOS populations, suggesting their potential as disease-specific immune biomarkers to guide future stratified immunotherapeutic strategies.
In addition to gene-level signals, our functional enrichment analyses further confirmed mechanistic coherence between the transcriptomic and genetic findings. The 4 hub genes were enriched in IL-17 signaling and neurotrophin pathways – both pivotal in MS pathogenesis and increasingly implicated in PCOS. IL-17-producing Th17 cells are elevated in active MS and contribute to neuroinflammatory damage,30 while reduced IL-17 signaling in PCOS is linked to disrupted ovarian angiogenesis and insulin signaling.31 Likewise, neurotrophins such as BDNF (brain-derived neurotrophic factor) and NGF (nerve growth factor) are upregulated in MS and aid in remyelination, but their deficiency in PCOS is associated with follicular dysmaturation and ovulatory failure.32 These findings suggest that shared immune–endocrine axes may be differently tuned across autoimmune and metabolic disease contexts, thus reinforcing the MR-based inference with biological plausibility.
Based on MR analysis, a potential inverse causal relationship between MS and PCOS was identified. Integrative transcriptomic analysis identified 4 immune-related hub genes (CD52, ARHGDIB, GCHFR, S100A9) with opposing expression trends in MS and PCOS, implicating divergent immune regulatory mechanisms. These findings provide preliminary evidence for disease-specific immunopathogenesis and offer potential molecular targets for future investigation.
Limitations of the study
While this integrative approach provides valuable insights, several limitations should be acknowledged. First, the GWAS and transcriptomic datasets were predominantly derived from European populations, which may limit the generalizability of our findings. Second, gene expression data were obtained from peripheral blood and cumulus cells rather than disease-specific tissues, such as the central nervous system or ovarian stroma. Third, reverse MR analysis was not performed. Finally, neither external nor internal validation of the transcriptomic or nomogram analyses was conducted because of the limited sample size, which may increase the risk of overfitting and affect reproducibility. Nonetheless, the consistency observed across the genetic and transcriptomic data supports the robustness of our conclusions. Future studies should include functional validation of the identified genes, broader multiethnic analyses, and bidirectional MR approaches to more definitively support or exclude the possibility of reciprocal causality between MS and PCOS.
Conclusions
This study suggests a possible inverse causal relationship between MS and polycystic ovary syndrome, although the association was not sustained after correction for multiple testing. Transcriptomic integration identified 4 shared immune-related genes with opposite expression patterns, indicating distinct immune regulatory features in the 2 conditions. These findings provide preliminary biological support for disease-specific immune involvement in PCOS and highlight targets for further mechanistic validation. Larger and more diverse studies are required to confirm these results.
Supplementary data
The supplementary materials are available at https://doi.org/10.5281/zenodo.17462656. The package contains the following files:
Supplementary Table 1. FDR-adjusted MR results for autoimmune diseases and PCOS.
Supplementary Table 2. DEGs found between MS patients and healthy controls in the GSE209596 dataset.
Supplementary Table 3. DEGs identified between PCOS patients and non-PCOS controls in the GSE277906 dataset.
Supplementary Table 4. GO enrichment analysis results for the 4 shared hub genes.
Supplementary Table 5. KEGG pathway enrichment analysis of the 4 shared hub genes.
Supplementary Fig. 1. Research design.
Supplementary Fig. 2. Venn diagram showing the overlap of DEGs between MS and PCOS. Four common genes – CD52, ARHGDIB, GCHFR, and S100A9 – were identified as shared DEGs between the 2 conditions.
Data Availability Statement
Data sharing does not apply to this article, as all data are already included in the manuscript and its supplementary files
Consent for publication
Not applicable.
Use of AI and AI-assisted technologies
Not applicable.