Abstract
Background. Ischemic heart disease (IHD) remains a leading global cause of mortality. While reperfusion is essential for treating ischemic cardiomyopathy, it paradoxically induces myocardial ischemia/reperfusion (I/R) injury targeting the microvascular endothelium. The link between autophagy and microvascular damage in myocardial I/R requires clarification.
Objectives. This study aimed to identify autophagy-related biomarkers of myocardial I/R injury using integrated bioinformatics and experimental validation, characterize the associated molecular and immune features, and evaluate the role of Myc in cardiac microvascular endothelial injury.
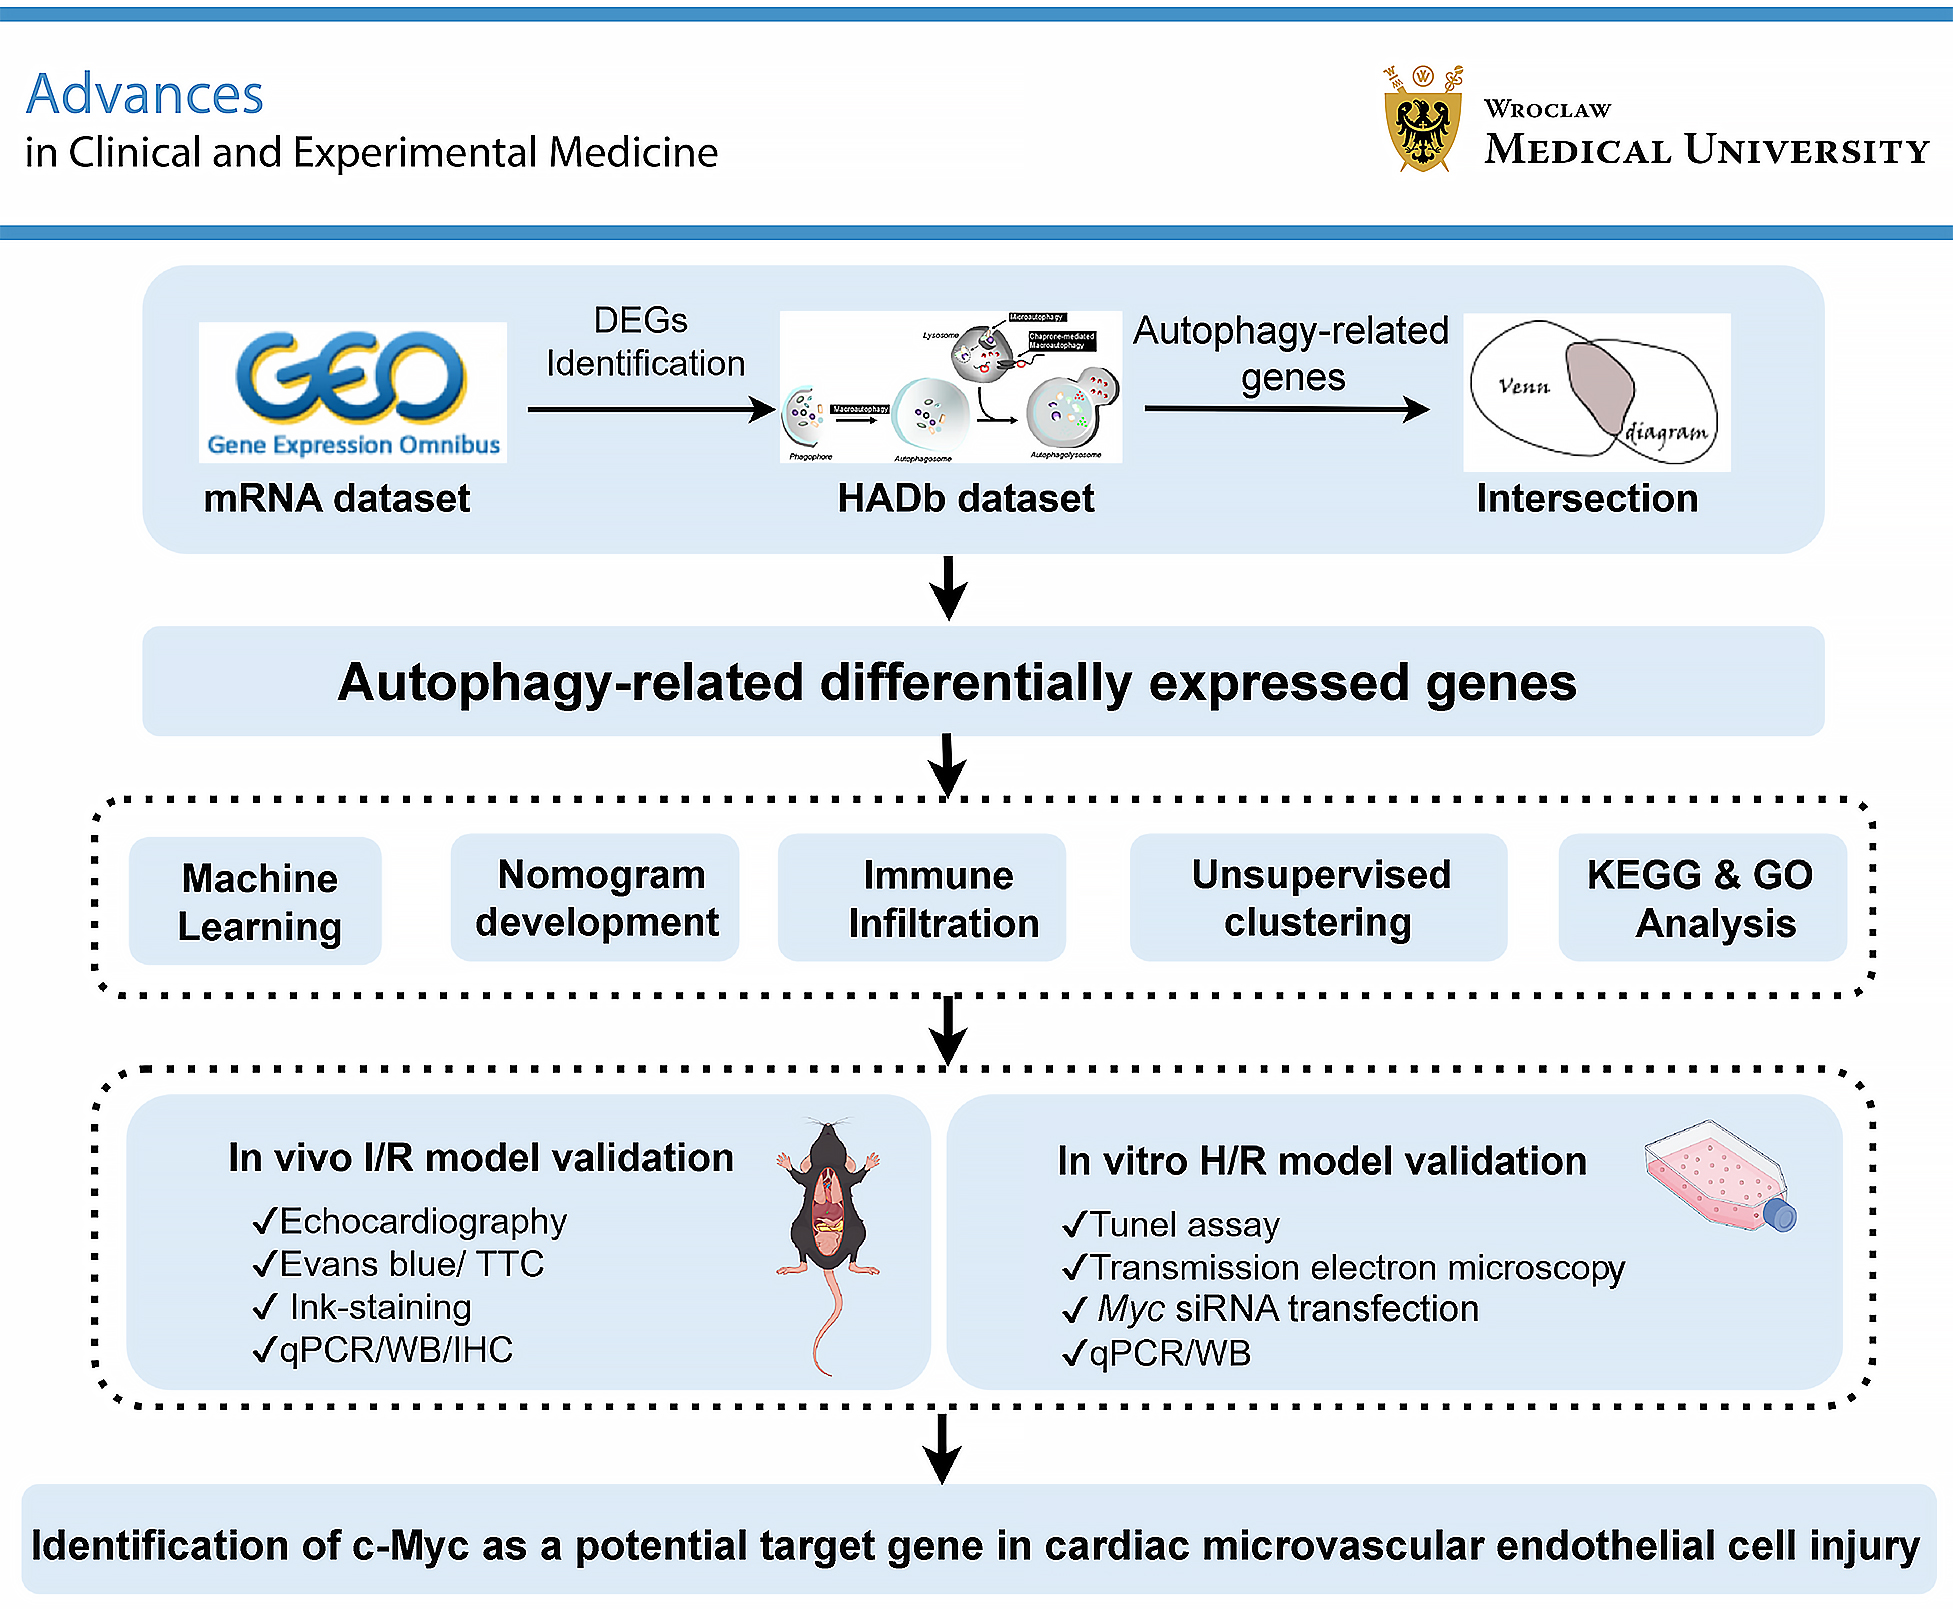
Materials and methods. Bioinformatics analysis of Gene Expression Omnibus (GEO) multi-chip datasets intersected autophagy-related genes (HADb) with differentially expressed genes (DEGs) to identify signature biomarkers using machine-learning algorithms. Diagnostic efficacy was validated using a nomogram. Mechanistic exploration through gene set enrichment analysis (GSEA) and immune profiling revealed I/R subtypes. Biomarker expression was externally validated in the GSE168610 dataset. Myocardial I/R models were assessed using echocardiography (cardiac function), Evans blue/TTC staining (infarction area), and ink perfusion (microvascular density). Hub gene expression was quantified using quantitative polymerase chain reaction (qPCR), western blot (WB), and immunohistochemistry (IHC). In vitro, c-Myc-knockout cardiac endothelial cells underwent hypoxia/reoxygenation (H/R), followed by analysis of autophagy (WB), apoptosis (TUNEL), and autophagic vacuoles (transmission electron microscopy (TEM)).
Results. Seven autophagy-related DEGs were identified and linked to muscle proliferation, protease activation, and oncogenesis. Four signature genes (Casp4, Cdkn1a, Myc, and Rgs19) were identified by 3 machine-learning algorithms, with diagnostic validation. In the development cohort, the AUCs ranged from 0.756 to 0.876. In the external-validation cohort, the AUC was 1.000 for Casp4, Myc, and Rgs19 and 0.875 for Cdkn1a. GSEA linked these genes to tricarboxylic acid cycle (TCA) dysregulation and immune infiltration. Unsupervised clustering identified 2 molecular subtypes. C1 exhibited higher expression of 6 of the 7 autophagy-related DEGs, whereas C2 showed higher proportions of mast cells and activated dendritic cells and enrichment of mitochondrial and energy-metabolism pathways. c-Myc knockout reduced endothelial apoptosis and autophagic injury.
Conclusions. c-Myc emerged as a critical driver linking excessive autophagy to microvascular damage, providing a promising diagnostic and therapeutic target for reperfusion injury management.
Key words: autophagy, biomarkers, myocardial ischemia, reperfusion injury, microcirculation
Background
Ischemic heart disease (IHD) remains one of the leading causes of mortality worldwide, with both its prevalence and mortality increasing substantially on a global scale.1 Over the past 3 decades, the incidence and mortality of IHD have increased by 103.5% and 60.4%, respectively, and are projected to continue rising over the next 2 decades.2 Although early reperfusion remains the cornerstone of treatment for ischemic cardiomyopathy, it can paradoxically induce ischemia/reperfusion (I/R) injury. Myocardial I/R injury is characterized by tissue damage resulting from insufficient blood supply during ischemia, which is exacerbated upon reperfusion.3 The pathological manifestations of myocardial I/R include myocardial stunning, the no-reflow phenomenon, reperfusion arrhythmias, and lethal reperfusion injury.4 The no-reflow phenomenon, driven by microvascular injury, is a fundamental mechanism of myocardial I/R injury and an independent predictor of mortality and recurrent myocardial infarction.5, 6 Compared with cardiomyocytes, cardiac microvascular endothelial cells sustain earlier and more severe injury during myocardial I/R.7 This injury is closely associated with several pathogenic mechanisms, including calcium overload,8 endoplasmic reticulum stress,9 mitochondrial dysfunction, and impaired mitochondrial quality control.10, 11 Despite extensive research aimed at elucidating the mechanisms underlying myocardial I/R-induced microvascular injury and developing novel therapeutic strategies, early diagnosis, timely intervention, and a comprehensive understanding of the underlying mechanisms remain major challenges.
With increasing insight into the pathophysiological mechanisms of microvascular injury during myocardial I/R, autophagy has emerged as a promising therapeutic target. Autophagy, a fundamental intracellular degradation and recycling process, plays an essential role in cardiovascular homeostasis by removing damaged mitochondria and protein aggregates.12 While physiological levels of autophagy support cellular homeostasis, excessive activation may lead to cellular dysfunction and death.13 Accumulating evidence has linked dysregulated autophagy to the initiation and progression of microvascular injury during myocardial I/R. Cardiac microvascular endothelial cells, which account for more than 60% of the total cardiac cell population, possess a tightly regulated autophagic system. Impaired autophagy can compromise endothelial cell integrity.14 Experimental models of myocardial I/R have demonstrated excessive autophagy in cardiac microvascular endothelial cells and have shown that inhibition of autophagy attenuates cellular injury and apoptosis.15, 16 Conversely, autophagy activation has also been reported to exert protective effects against myocardial I/R injury, highlighting its dual role in the I/R process.17 Therefore, a comprehensive evaluation of autophagy may improve our understanding of the molecular mechanisms underlying the no-reflow phenomenon associated with microvascular I/R injury and facilitate the identification of potential diagnostic biomarkers.
Objectives
Despite advances in cardiac I/R research at the genomic level, studies specifically investigating autophagy-related genes in the context of myocardial I/R-induced microvascular injury remain limited. This gap hinders a comprehensive understanding of the underlying molecular mechanisms and the identification of potential diagnostic biomarkers. Therefore, the present study was designed to identify and characterize key autophagy-related genes associated with microvascular injury during myocardial I/R.
This study aimed to identify novel biomarkers for the diagnosis of myocardial I/R injury by integrating bioinformatics and experimental validation. It also investigated the functional role of dysregulated autophagy in microvascular injury, identified key biomarkers, and explored the mechanistic link between autophagy, microvascular injury, and the regulator c-Myc.
Materials and methods
Microarray data retrieval and pre-processing
Cardiac I/R datasets were retrieved from the National Center for Biotechnology Information (NCBI) Gene Expression Omnibus (GEO) database (http://www.ncbi.nlm.nih.gov/geo) using the keywords “myocardial ischemia/reperfusion injury” and “cardiac ischemia/reperfusion injury”. Seven datasets (GSE108940, GSE115568, GSE4105, GSE58486, GSE61592, GSE83472, and GSE168610) were retrieved from the GEO database on June 5, 2024. A combined multi-chip cohort comprising 25 sham samples and 28 I/R samples from GSE108940, GSE115568, GSE4105, GSE58486, GSE61592, and GSE83472 (Supplementary Table 1) underwent batch-effect correction using the SVA R package (https://www.bioconductor.org/packages//release/bioc/html/sva.html). The effectiveness of batch correction was assessed using principal component analysis (PCA) plots generated with the ggplot2 package (https://cran.r-project.org/web/packages/ggplot2/index.html). The first 6 datasets were used to identify differentially expressed genes (DEGs), whereas GSE168610 was used for external validation.
DEGs identification
Differential expression analysis between the sham and I/R groups was performed using the limma R package (https://bioconductor.org/packages/release/bioc/html/limma.html). Heatmaps and volcano plots were generated using the pheatmap (https://cran.r-project.org/web/packages/pheatmap/index.html) and ggplot2 packages. Genes with a p < 0.05 and an absolute log<sub>2</sub> fold change (|log<sub>2</sub>FC|) >1.0 were considered DEGs. The top 20 DEGs were visualized in a heatmap.
Identification of DEGs related to autophagy and functional enrichment analysis
A total of 215 autophagy-related genes (ARGs) were retrieved from the Human Autophagy Database (HADb; http://autophagy.lu) and converted to their mouse homologs. Differentially expressed autophagy-related genes (ARDEGs) were identified using Venn diagram analysis by intersecting the DEGs with the ARGs. Functional enrichment analysis of ARDEGs was performed using Gene Ontology (GO) (http://geneontology.org) analysis (biological process (BP), cellular component (CC), and molecular function (MF)) and Kyoto Encyclopedia of Genes and Genomes (KEGG) (https://www.kegg.jp) pathway analysis (ClusterProfiler; https://bioconductor.org/packages/release/bioc/html/clusterProfiler.html). Results with a p < 0.05 were visualized as bubble plots using ggplot2.
Recognition of hub genes based on well-established machine learning algorithms
Machine-learning algorithms – including least absolute shrinkage and selection operator (LASSO; glmnet R package (https://cran.r-project.org/web/packages/glmnet/index.html)), support vector machine–recursive feature elimination (SVM-RFE; e1071/MSVM-RFE), and Random Forest (RF; randomForest (https://cran.r-project.org/web/packages/randomForest/index.html)) – were used to identify signature genes associated with cardiac microvascular I/R injury. Using the 7 shared ARDEGs as input, LASSO with 10-fold cross-validation was applied to calculate regression coefficients and identify the optimal features based on partial likelihood deviance and λ-logarithm curves (cv.glmnet; https://www.rdocumentation.org/packages/glmnet/versions/5.0/topics/cv.glmnet). SVM-RFE performed sequential backward feature selection to identify key hub genes at the highest 5-fold cross-validation accuracy (highlighted by a red circle). Random Forest ranked gene importance using an ensemble of decision trees. Hub genes were defined as those identified by all 3 machine-learning algorithms, as illustrated in the Venn diagram.
Nomogram construction and ROC evaluation
To further evaluate the predictive performance of the model, a nomogram was constructed by integrating the 4 hub genes using the rms package (https://cran.r-project.org/web/packages/rms/index.html) in R. A score was assigned to the expression level of each gene, and the total score was used to estimate the probability of I/R injury. Model performance was evaluated using decision curve analysis (DCA) and calibration curves. In addition, the area under the receiver operating characteristic (ROC) curve (AUC) was calculated to assess the diagnostic performance of each candidate biomarker.
Single-gene gene set enrichment analysis
Single-gene gene set enrichment analysis (GSEA) of the 4 diagnostic genes was performed using the ClusterProfiler package. To investigate the association between the underlying molecular mechanisms and gene expression phenotypes, Hallmark gene sets were retrieved from the Molecular Signatures Database (MSigDB; version accessed May 18, 2024) (https://www.gsea-msigdb.org/gsea/msigdb/mouse/genesets.jsp?collection=MH). Enrichment plots were generated to display the top 5 positively and negatively enriched pathways for each gene in the 2 study groups.
Immune cell infiltration analysis
The CIBERSORT R package (https://github.com/Moonerss/CIBERSORT) was used to estimate the relative proportions of immune cell populations in the combined multi-chip datasets from the I/R and sham groups. Based on gene expression data, the CIBERSORT algorithm was applied to estimate immune cell abundance by deconvolution, and the results were visualized as bar plots. In addition, the ggplot2 package was used to generate lollipop plots illustrating the correlations between the expression of each hub gene and immune cell abundance.
Unsupervised clustering analysis of I/R subtypes
Ischemia/reperfusion subtypes were identified using consensus clustering with the ConsensusClusterPlus R package (https://www.rdocumentation.org/packages/ConsensusClusterPlus/versions/1.36.0/topics/ConsensusClusterPlus) based on the expression profiles of ARDEGs (1,000 iterations). The optimal number of clusters was determined using the consensus matrix, cumulative distribution function (CDF) index, and the relative change in the area under the CDF curve. Intercluster heterogeneity was assessed using PCA and box plots. Functional differences, including immune cell infiltration and KEGG/GO pathway enrichment, were compared between Cluster 1 and Cluster 2.
Validation of hub genes within the dataset
The GSE168610 dataset served as an external validation cohort. Raw data retrieved from the GEO database underwent expression matrix transformation using Perl and normalization with the limma R package. Expression levels of the 4 hub genes were extracted, compared between groups using the Wilcoxon rank-sum test, and visualized as violin plots. Diagnostic performance was evaluated using receiver operating characteristic (ROC) curves, and the area under the curve (AUC) was calculated for each biomarker.
Animals
A total of 60 healthy adult male C57BL/6J mice (8–10 weeks old, 18–22 g) were obtained from the Guangxi Medical University Laboratory Animal Center (Nanning, China). The mice were housed at 21–23°C with a relative humidity of 55 ±5%. Before the experiments, they had ad libitum access to food and water and were maintained under a 12-h light/dark cycle. The animal facility was cleaned regularly to maintain standardized housing conditions. All animal experiments were conducted in accordance with the applicable Chinese regulations and were approved by the Animal Ethics Committee of Guangxi Medical University (approval No. 202401020).
Myocardial I/R model establishment and electrocardiogram and echocardiography analysis
Mice were randomly assigned to the sham (n = 30) or I/R (n = 30) group using a lottery-drawing method. Anesthesia was induced by intraperitoneal administration of avertin (1.25%, 0.2 mL/10 g). Myocardial ischemia/reperfusion was induced by 45 min of left anterior descending coronary artery (LAD) ligation using an 8-0 silk suture, followed by 120 min of reperfusion.18, 19 Sham-operated mice underwent the same surgical procedure without LAD ligation. Cardiac function was assessed after reperfusion using a VINNO D700 VET ultrasound system under 1–2% isoflurane anesthesia. Left ventricular ejection fraction (LVEF) and left ventricular fractional shortening (LVFS) were measured using B-mode and M-mode imaging over 3 consecutive cardiac cycles. Electrocardiography (ECG) was performed before ischemia and after reperfusion using an ECG-3306G system (Sanyue, Guangzhou, China).
Subsequently, mice designated for Evans blue/TTC staining (n = 16) and gelatin–ink perfusion (n = 16) underwent intracardiac perfusion with the respective solutions under continuous anesthesia before heart excision. Mice assigned to the tissue analysis cohort (n = 12) and the molecular analysis cohort (n = 16) were euthanized by anesthetic overdose, and the hearts were immediately harvested and snap-frozen at −80°C. All subjectively assessed outcomes (specifically histological scoring, infarct size analysis, and behavioral video analysis) were evaluated by an independent investigator blinded to the experimental group assignments.
Evans blue and TCC staining analysis
After 120 min of reperfusion, myocardial infarct size was assessed using 2,3,5-triphenyltetrazolium chloride (TTC) and Evans blue staining. A 2% Evans blue solution was retrogradely perfused through the right ventricle until cyanosis of the extremities was observed. Hearts were excised, rinsed with saline, frozen at −20°C for 10 min, and sectioned into 1-mm-thick slices. The sections were incubated in the dark with 1% TTC (Leagene Biotechnology, Anhui, China) at 37°C for 30 min. Infarct size was quantified as the proportion of white ischemic tissue relative to the total left ventricular area using ImageJ (National Institutes of Health (NIH), Bethesda, USA).
Gelatin-ink perfusion
Following 120 min of reperfusion, hearts were perfused through the right ventricle with 4% gelatin–ink to achieve uniform cardiac staining. The tissues were harvested, fixed in 4% paraformaldehyde, and sectioned. Microvascular architecture was examined at ×20 magnification using an Olympus BX53 light microscope (Olympus Corp., Tokyo, Japan), and images were acquired for quantitative morphometric analysis.
Immunohistochemical staining
Cardiac tissues were fixed in 4% paraformaldehyde, embedded in paraffin, and sectioned at a thickness of 5 μm. After deparaffinization and antigen retrieval, endogenous peroxidase activity was blocked with 3% H2O2, followed by blocking with 3% bovine serum albumin (BSA) at room temperature for 30 min. Sections were incubated overnight at 4°C with anti-c-Myc (1:200; HA721182; Huabio, Hangzhou, China) or anti-caspase-4 (1:300; ER60011; Huabio) primary antibodies, followed by incubation with horseradish peroxidase (HRP)-conjugated secondary antibodies. 3,3′-Diaminobenzidine (DAB) was used as the chromogenic substrate, followed by hematoxylin counterstaining. Images were acquired using an Olympus BX53 light microscope, and positively stained areas were quantified using ImageJ.
Cell culture and hypoxia/reoxygenation model
Cardiac microvascular endothelial cells (CMECs) were obtained from Procell Life Science (cat. No. CP-M129; Procell, Wuhan, China). Quality control confirmed CD31 immunofluorescence positivity ≥90%, the absence of HIV-1, HBV, HCV, and mycoplasma (polymerase chain reaction (PCR)-tested), and the absence of microbial contamination (culture-verified). Cells were cultured in mouse cardiac microvascular endothelial cell complete medium (ECM; cat. No. CM-M129; Procell) at 37°C in a humidified atmosphere containing 5% CO2. At 80–90% confluence, CMECs between passages 3 and 8 were subjected to hypoxia in glucose- and fetal bovine serum (FBS)-free Dulbecco’s modified Eagle’s medium (DMEM; cat. No. PM150122; Procell) under 1% O2, 5% CO2, and 94% N2 for 24 h, followed by reoxygenation in complete medium under 95% O2 and 5% CO2 for 24 h.
siRNA transfection
Cells were seeded and cultured for 24 h to achieve 70–80% confluence before transfection with siRNA targeting Myc (si-Myc) (sequence: TGGAGATGATGACCGAGTTAC; Hanbio Co., Ltd., Shanghai, China) using Lipo8000™ transfection reagent (C0533; Beyotime Biotechnology, Shanghai, China). The transfection complex was prepared by mixing the siRNA with Lipo8000™ in antibiotic- and serum-free DMEM, followed by incubation at room temperature for 20 min. The transfection complex was then added to the CMEC culture and incubated for 24 h. Subsequently, the transfection medium was replaced with glucose- and serum-free DMEM, and the cells were subjected to 24 h of hypoxia followed by 24 h of reoxygenation.
TUNEL staining assay
To evaluate apoptosis in CMECs in vitro, a terminal deoxynucleotidyl transferase-mediated dUTP nick-end labeling (TUNEL) assay kit (Beyotime Biotechnology) was used. After hypoxia/reoxygenation (H/R) treatment, CMECs at an appropriate density were selected for TUNEL staining. According to the manufacturer’s instructions, the cells were washed, fixed, permeabilized, and incubated with the TUNEL reaction mixture at 37°C in the dark. Images were acquired using a fluorescence microscope (200× magnification; Zeiss Axiocam 506 Color; Carl Zeiss AG, Jena, Germany).
Transmission electron microscopy of mitochondria
Cell pellets (1 × 10⁷ cells) were fixed in 2.5% glutaraldehyde at 4°C for 24 h, rinsed with phosphate-buffered saline (PBS), and post-fixed in 1% osmium tetroxide for 2 h. En bloc staining was performed with uranyl acetate in 70% ethanol for 3 h. After graded ethanol dehydration, samples were treated with propylene oxide, infiltrated with Eponate 12 resin (hardener: DDSA/NMA/DMP-30), and polymerized at 45°C for 12 h, followed by 72°C for 24 h. Ultrathin sections (70 nm) were prepared using a Leica UC-7 ultramicrotome (Leica Camera AG, Wetzlar, Germany), stained with lead citrate, and examined using a JEOL JEM-1400 transmission electron microscope (TEM) (80 kV; Morada G3 CCD; JEOL Ltd., Tokyo, Japan). Mitophagy was identified by the presence of double-membrane autophagosomes containing mitochondria with disrupted cristae.
RT-qPCR assay
Total RNA was isolated from myocardial tissues and cultured cells using TRIzol reagent (Solarbio, Beijing, China). RNA concentration and purity (A260/A280 ratio) were measured using a NanoDrop spectrophotometer (Thermo Fisher Scientific, Waltham, USA). Complementary DNA (cDNA) was synthesized from 1,000 ng of RNA using HyperScript III RT SuperMix (R202; EnzyArtisan Biotech, Shanghai, China). Quantitative reverse transcription polymerase chain reaction (RT-qPCR) was performed using ×2 S6 Universal SYBR Mix (Q204-1; EnzyArtisan Biotech) on a 7500 Real-Time PCR System (Thermo Fisher Scientific). Primer sequences are listed in Supplementary Table 2. The thermal cycling conditions were as follows: 95°C for 10 min, followed by 40 cycles of 95°C for 15 s, 60°C for 30 s, and 72°C for 30 s. For RT-qPCR, 5 independent myocardial tissue samples per group and 6 independent cell samples per group were analyzed. Each RNA sample was measured in 3 technical replicates, and the technical-replicate Ct values were averaged before downstream analysis. Gene expression levels were normalized to GAPDH and calculated using the 2−ΔΔCt method.
Western blot assay
Cardiac tissues were homogenized in radioimmunoprecipitation assay (RIPA) buffer (R0010; Solarbio) containing protease and phosphatase inhibitors (P1261; Solarbio). Protein concentration was determined using a bicinchoninic acid (BCA) assay kit (P0398S; Beyotime Biotechnology) at 562 nm. Equal amounts of protein (20 μg/lane) were separated by 10% sodium dodecyl sulfate-polyacrylamide gel electrophoresis (SDS-PAGE), transferred to polyvinylidene difluoride (PVDF) membranes (ISEQ00010; MilliporeSigma, St. Louis, USA), and blocked with 5% non-fat milk in Tris-buffered saline with Tween-20 (TBST) for 2 h at room temperature. Membranes were incubated overnight at 4°C with the following primary antibodies: anti-caspase-4 (1:500; TA5130; Abmart, Shanghai, China), anti-c-Myc (1:1,000; T55150; Abmart), anti-Cdkn1a (1:1,000; #382492; Zen-Bioscience, Chengdu, China), anti-Bax (1:1,000; #50599-2-Ig; Proteintech, Wuhan, China), anti-Bcl-2 (1:1,000; #26593-1-AP; Proteintech), anti-LC3 (1:1,000; #382687; Zen-Bioscience), anti-GAPDH (1:10,000; #301341; Zen-Bioscience), and anti-β-tubulin (1:5,000; #48375; Signalway Antibody, USA). After washing with TBST, HRP-conjugated secondary antibodies (1:10,000; #301341; Zen-Bioscience) were applied for 1 h at room temperature. Protein bands were visualized using an e-BLOT Touch Imager (Ebiotrade Life Science, Shanghai, China) and quantified using ImageJ.
Statistical analyses
All bioinformatics and statistical analyses were performed using R v. 4.3.3 (R Foundation for Statistical Computing, Vienna, Austria). Statistical analyses and graphical visualizations were generated using GraphPad Prism v. 8.0 (GraphPad Software, San Diego, USA). All statistical analyses were performed in accordance with the statistical guidelines of Advances in Clinical and Experimental Medicine.20 The results of all assumption checks for parametric tests are presented in Supplementary Table 5.
The normality of data distribution was assessed using the Shapiro–Wilk test. Data are presented as the mean ± standard deviation (SD) for normally distributed variables or as the median with the 1st and 3rd quartiles (Q1 and Q3) for non-normally distributed variables. Differences between 2 independent groups were analyzed using the Mann–Whitney U test. Comparisons among multiple groups were performed using one-way analysis of variance (ANOVA) followed by Tukey’s post hoc test. A p < 0.05 was considered statistically significant.
Results
Identification of DEGs
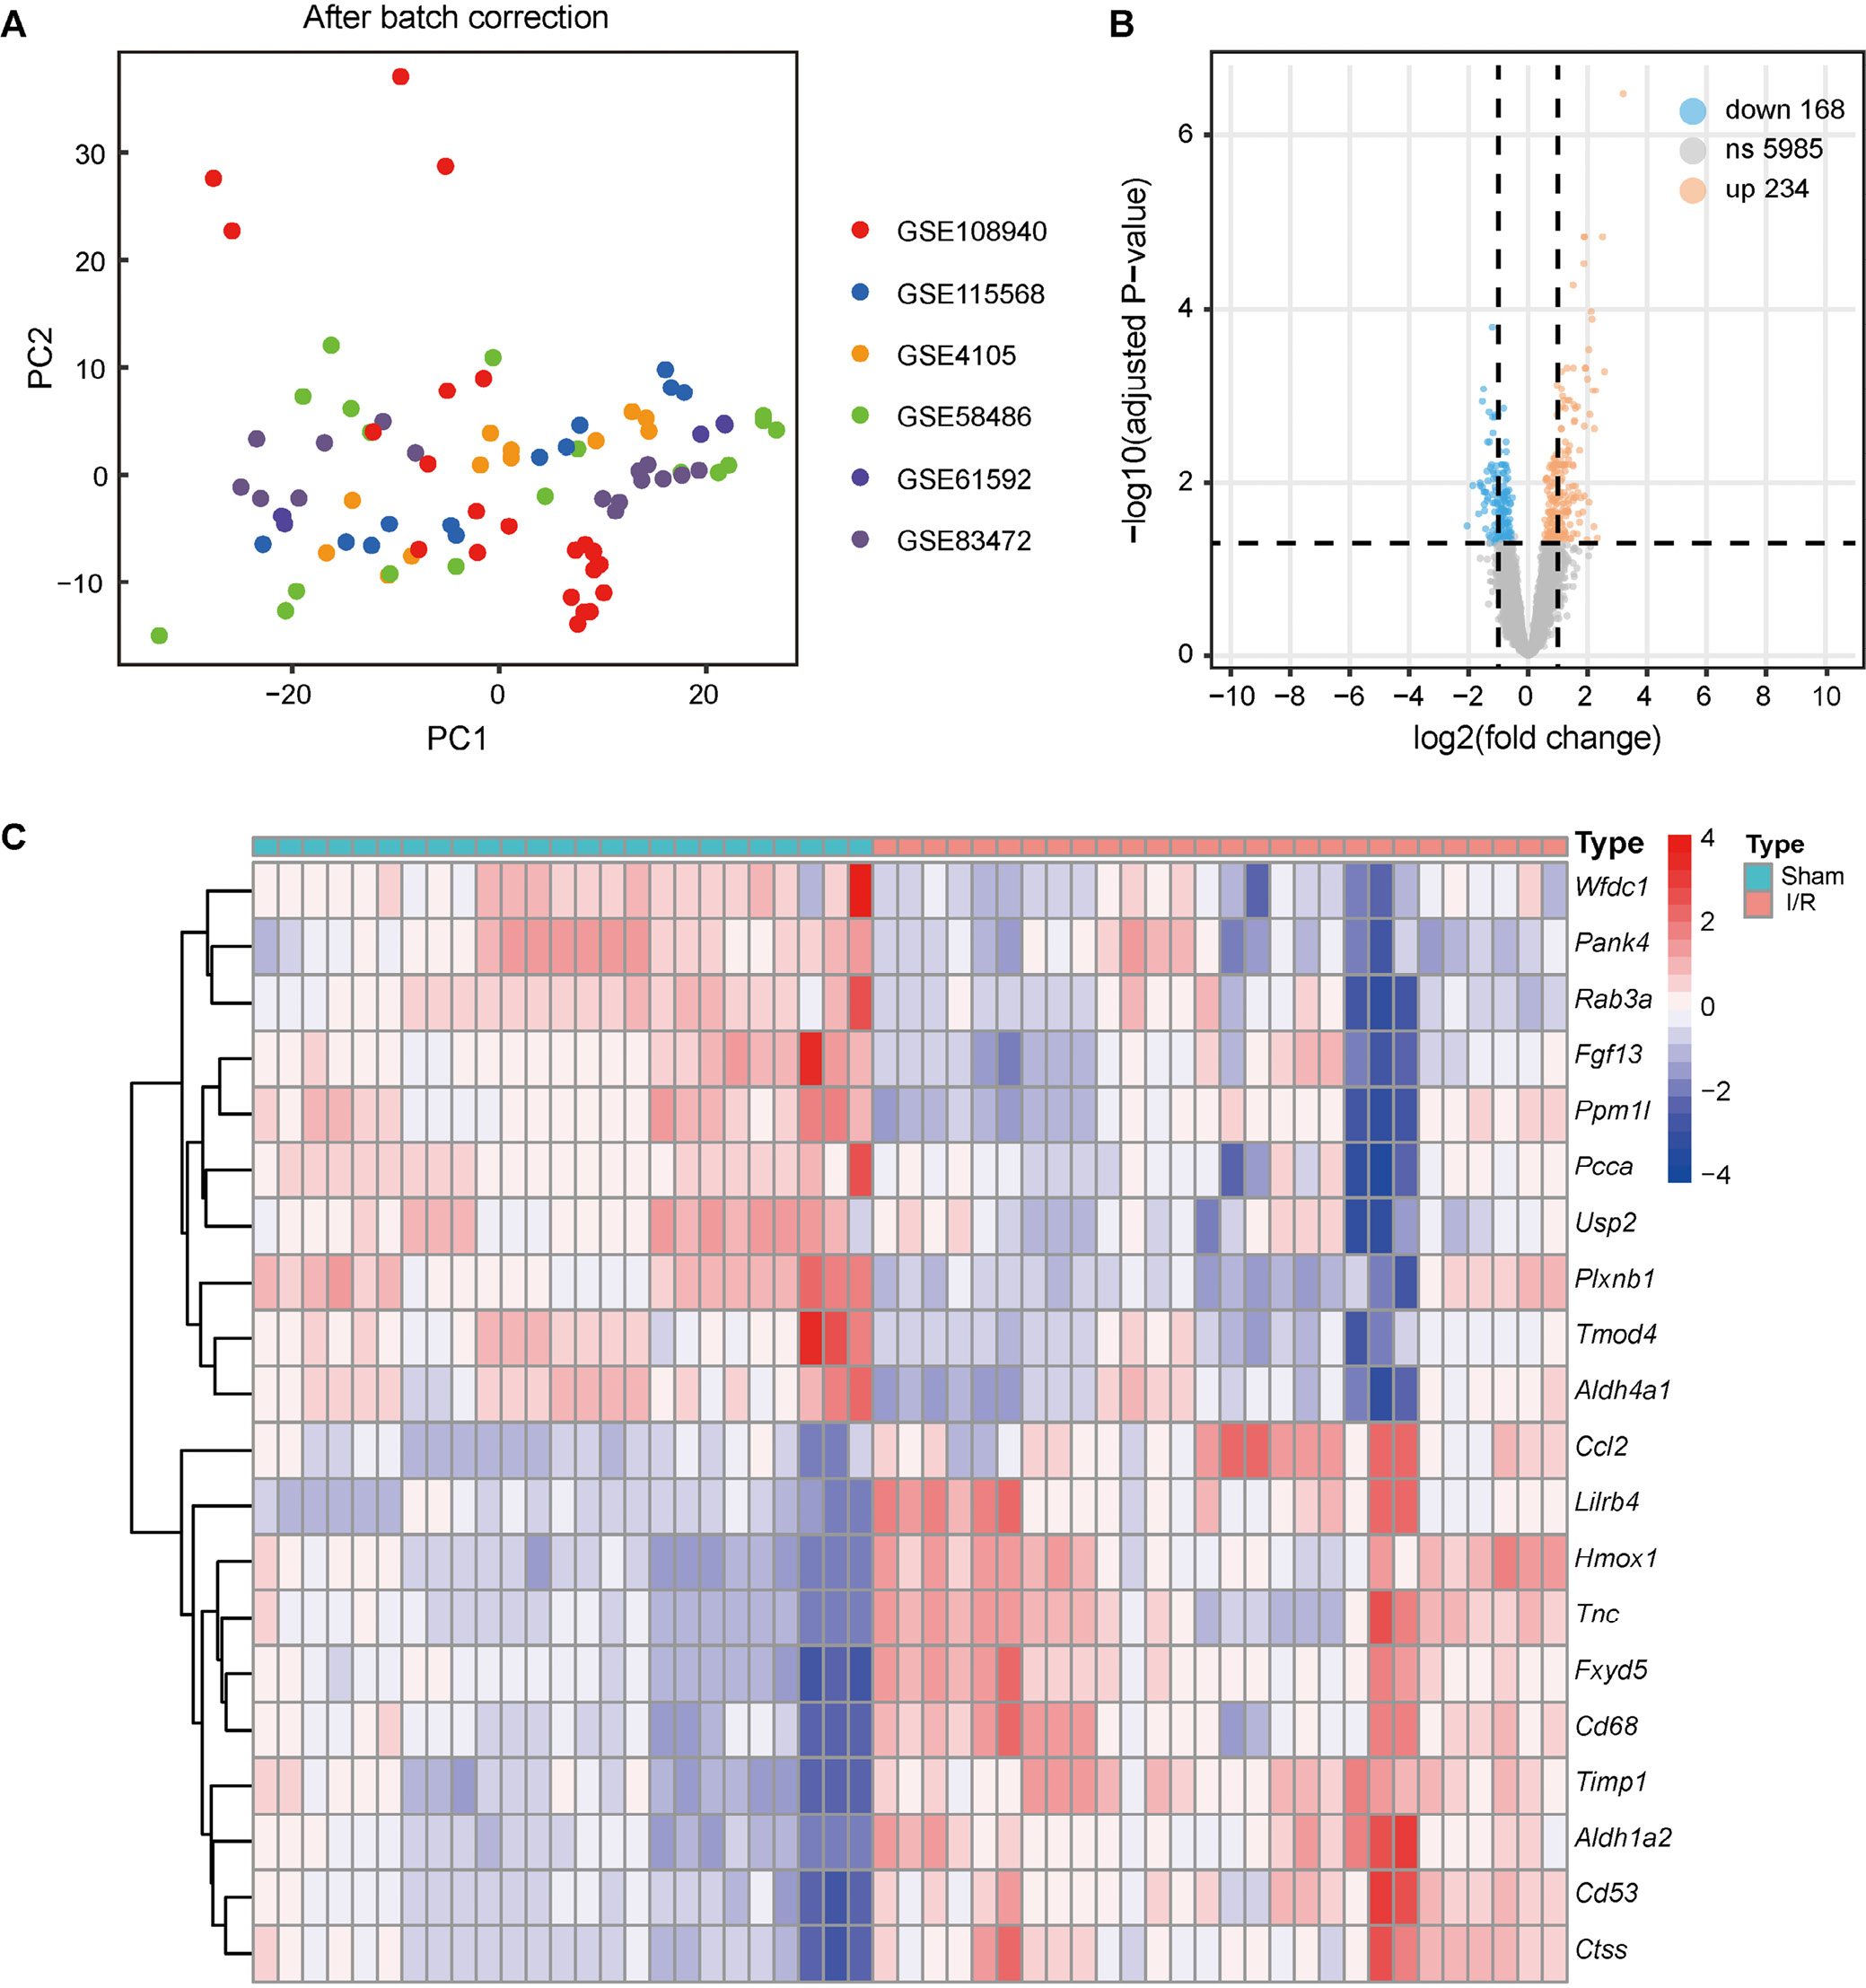
After batch-effect correction, PCA demonstrated a more homogeneous distribution of samples across all datasets (Figure 1A). A total of 402 DEGs were identified across the 6 datasets, including 168 downregulated and 234 upregulated genes, using the thresholds of p < 0.05 and an absolute log<sub>2</sub> fold change (|log<sub>2</sub>FC|) >1.0 (Figure 1B). A clustered heatmap further illustrates the expression profiles of the top 20 DEGs in the 2 study groups (Figure 1C).
Functional enrichment analysis of ARDEGs
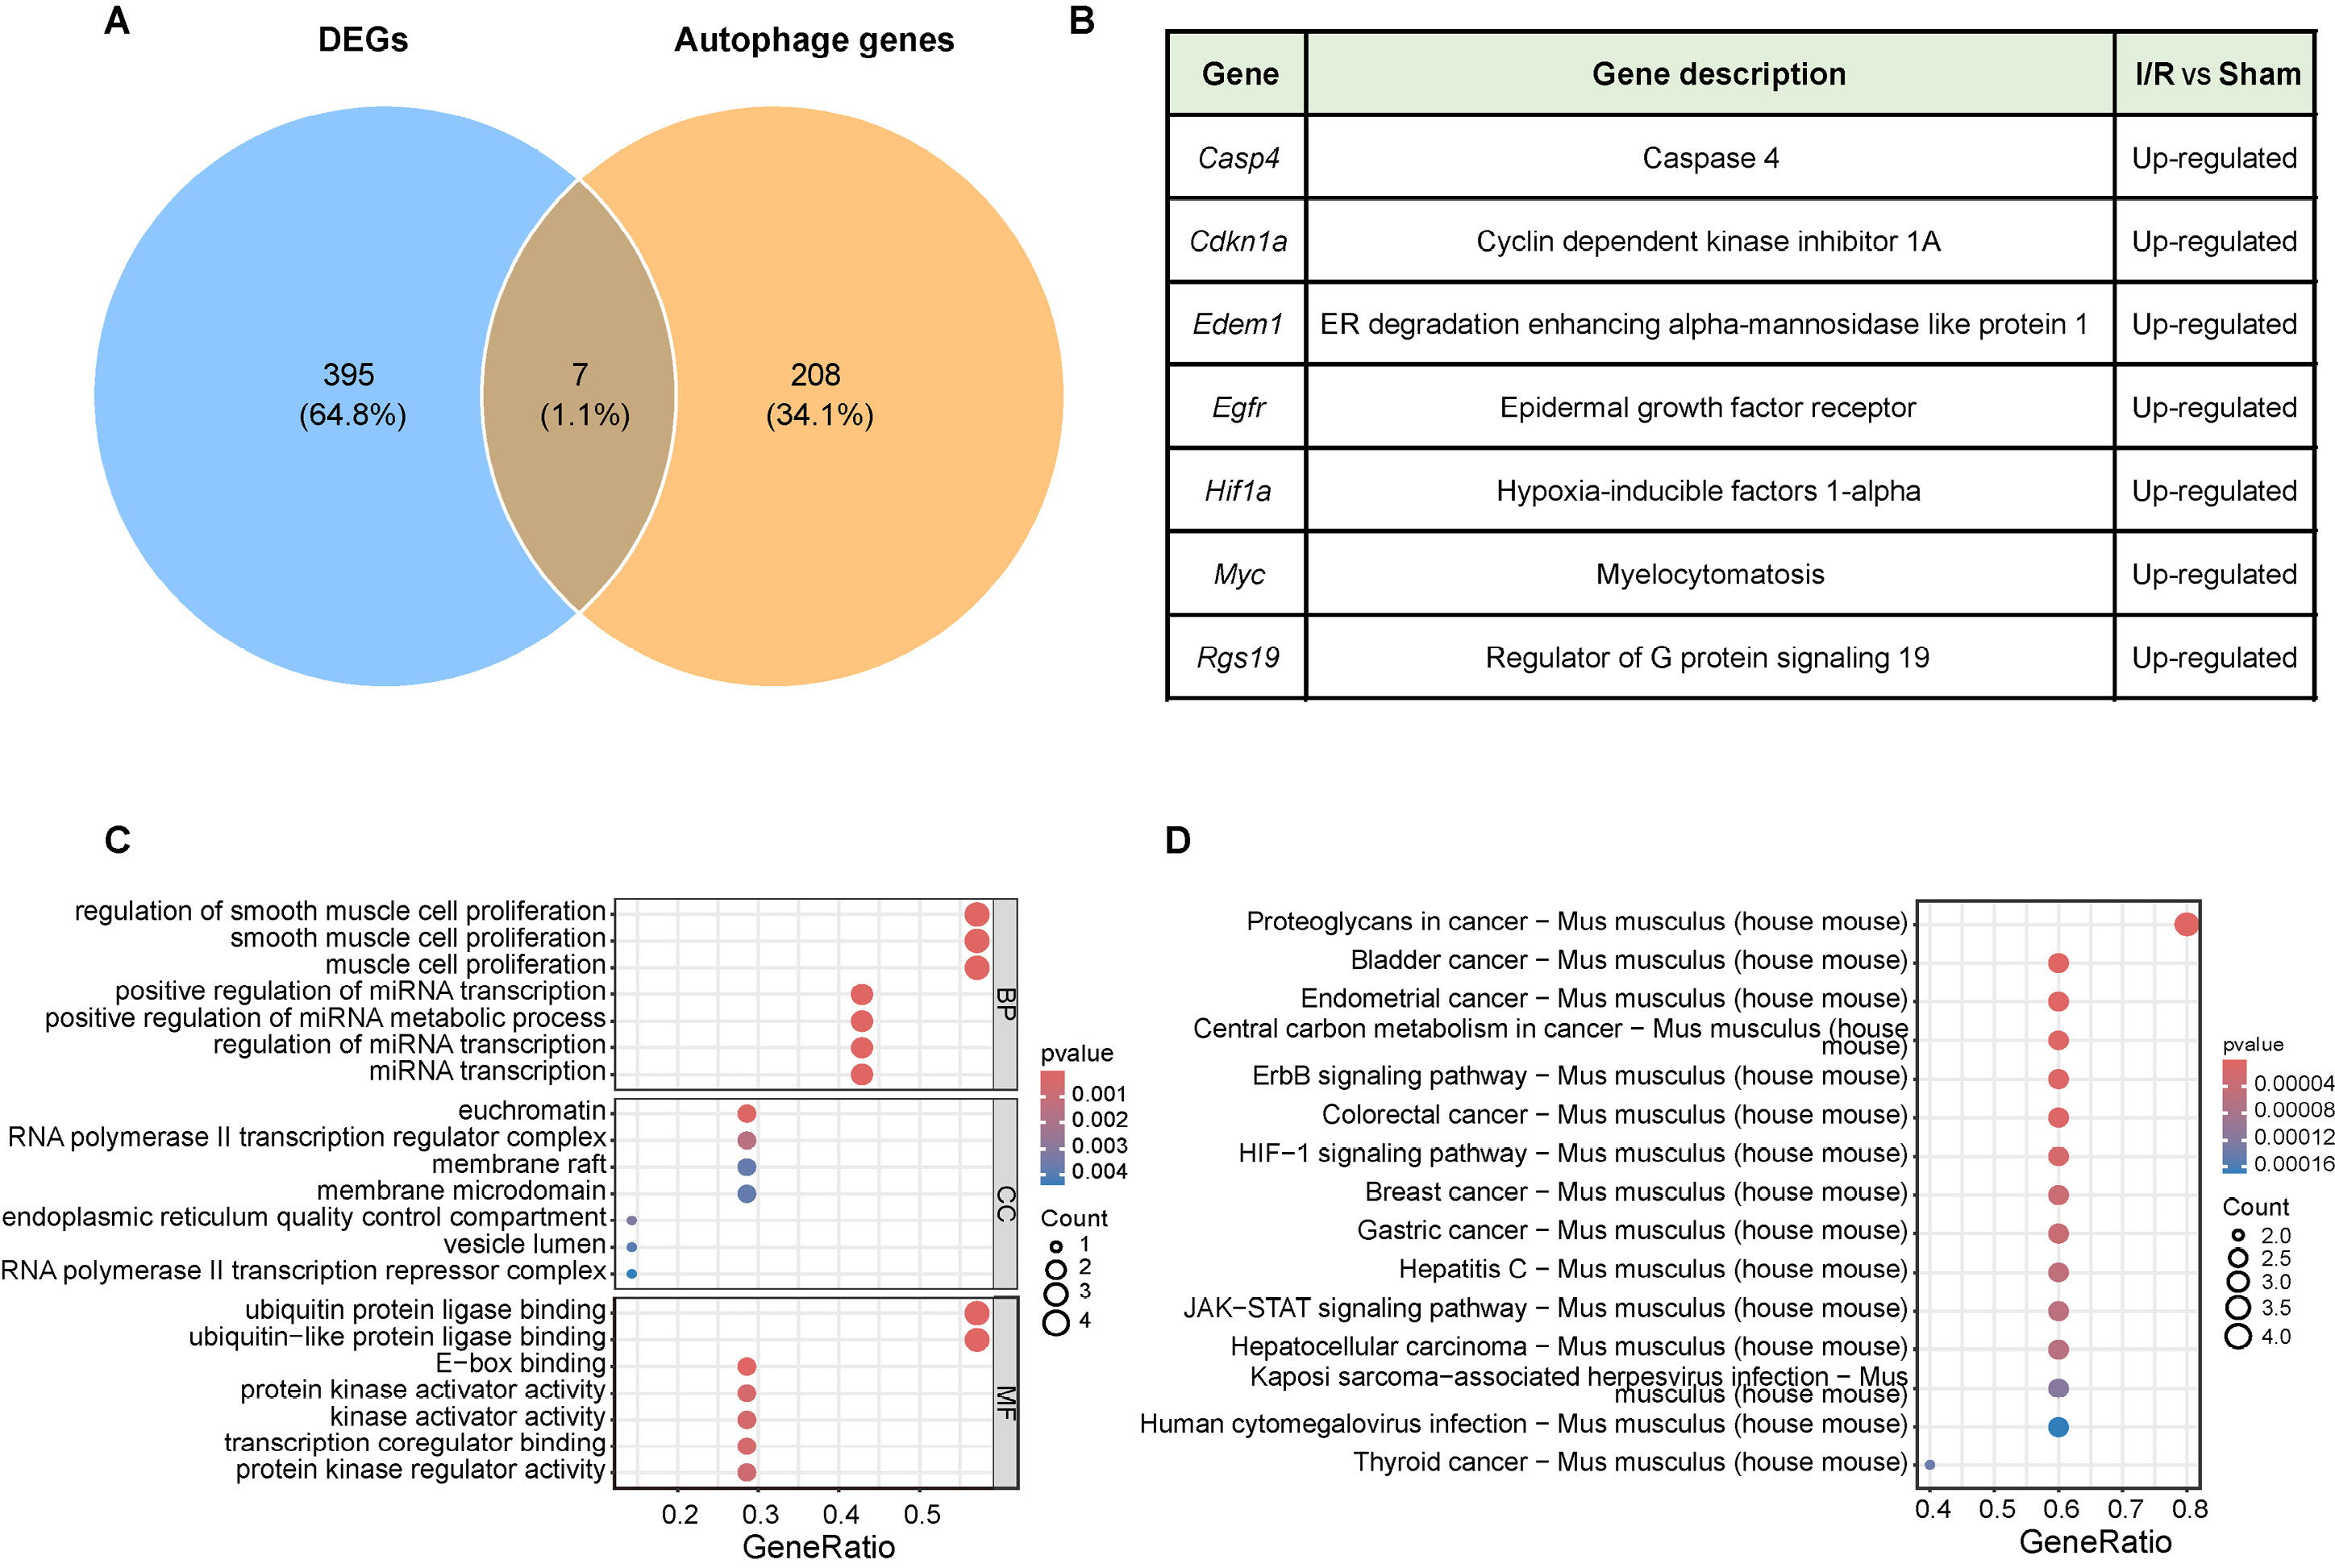
The Venn diagram in Figure 2A shows that 7 genes were identified at the intersection of the DEGs and ARGs. These 7 genes (Casp4, Cdkn1a, Edem1, Egfr, Hif1a, Myc, and Rgs19) were significantly upregulated in the I/R group compared with the sham group (Figure 2B). To gain further functional insight, GO enrichment analysis was performed to characterize the BP, CC, and MF associated with the ARDEGs. As shown in Figure 2C, the ARDEGs were significantly enriched in several biological processes, including the regulation of smooth muscle cell proliferation, positive regulation of microRNA (miRNA) metabolic processes, and regulation of miRNA transcription. With respect to cellular components, the ARDEGs were significantly associated with euchromatin, RNA polymerase II transcription regulator complexes, and membrane rafts. Molecular function analysis identified significant enrichment for ubiquitin or ubiquitin-like protein ligase binding, E-box binding, and protein kinase activator activity. Furthermore, KEGG pathway analysis demonstrated significant enrichment in pathways including proteoglycans in cancer, bladder cancer, the ErbB signaling pathway, the HIF-1 signaling pathway, hepatitis C, and the JAK-STAT signaling pathway (Figure 2D).
Identification of the hub genes via machine learning algorithms
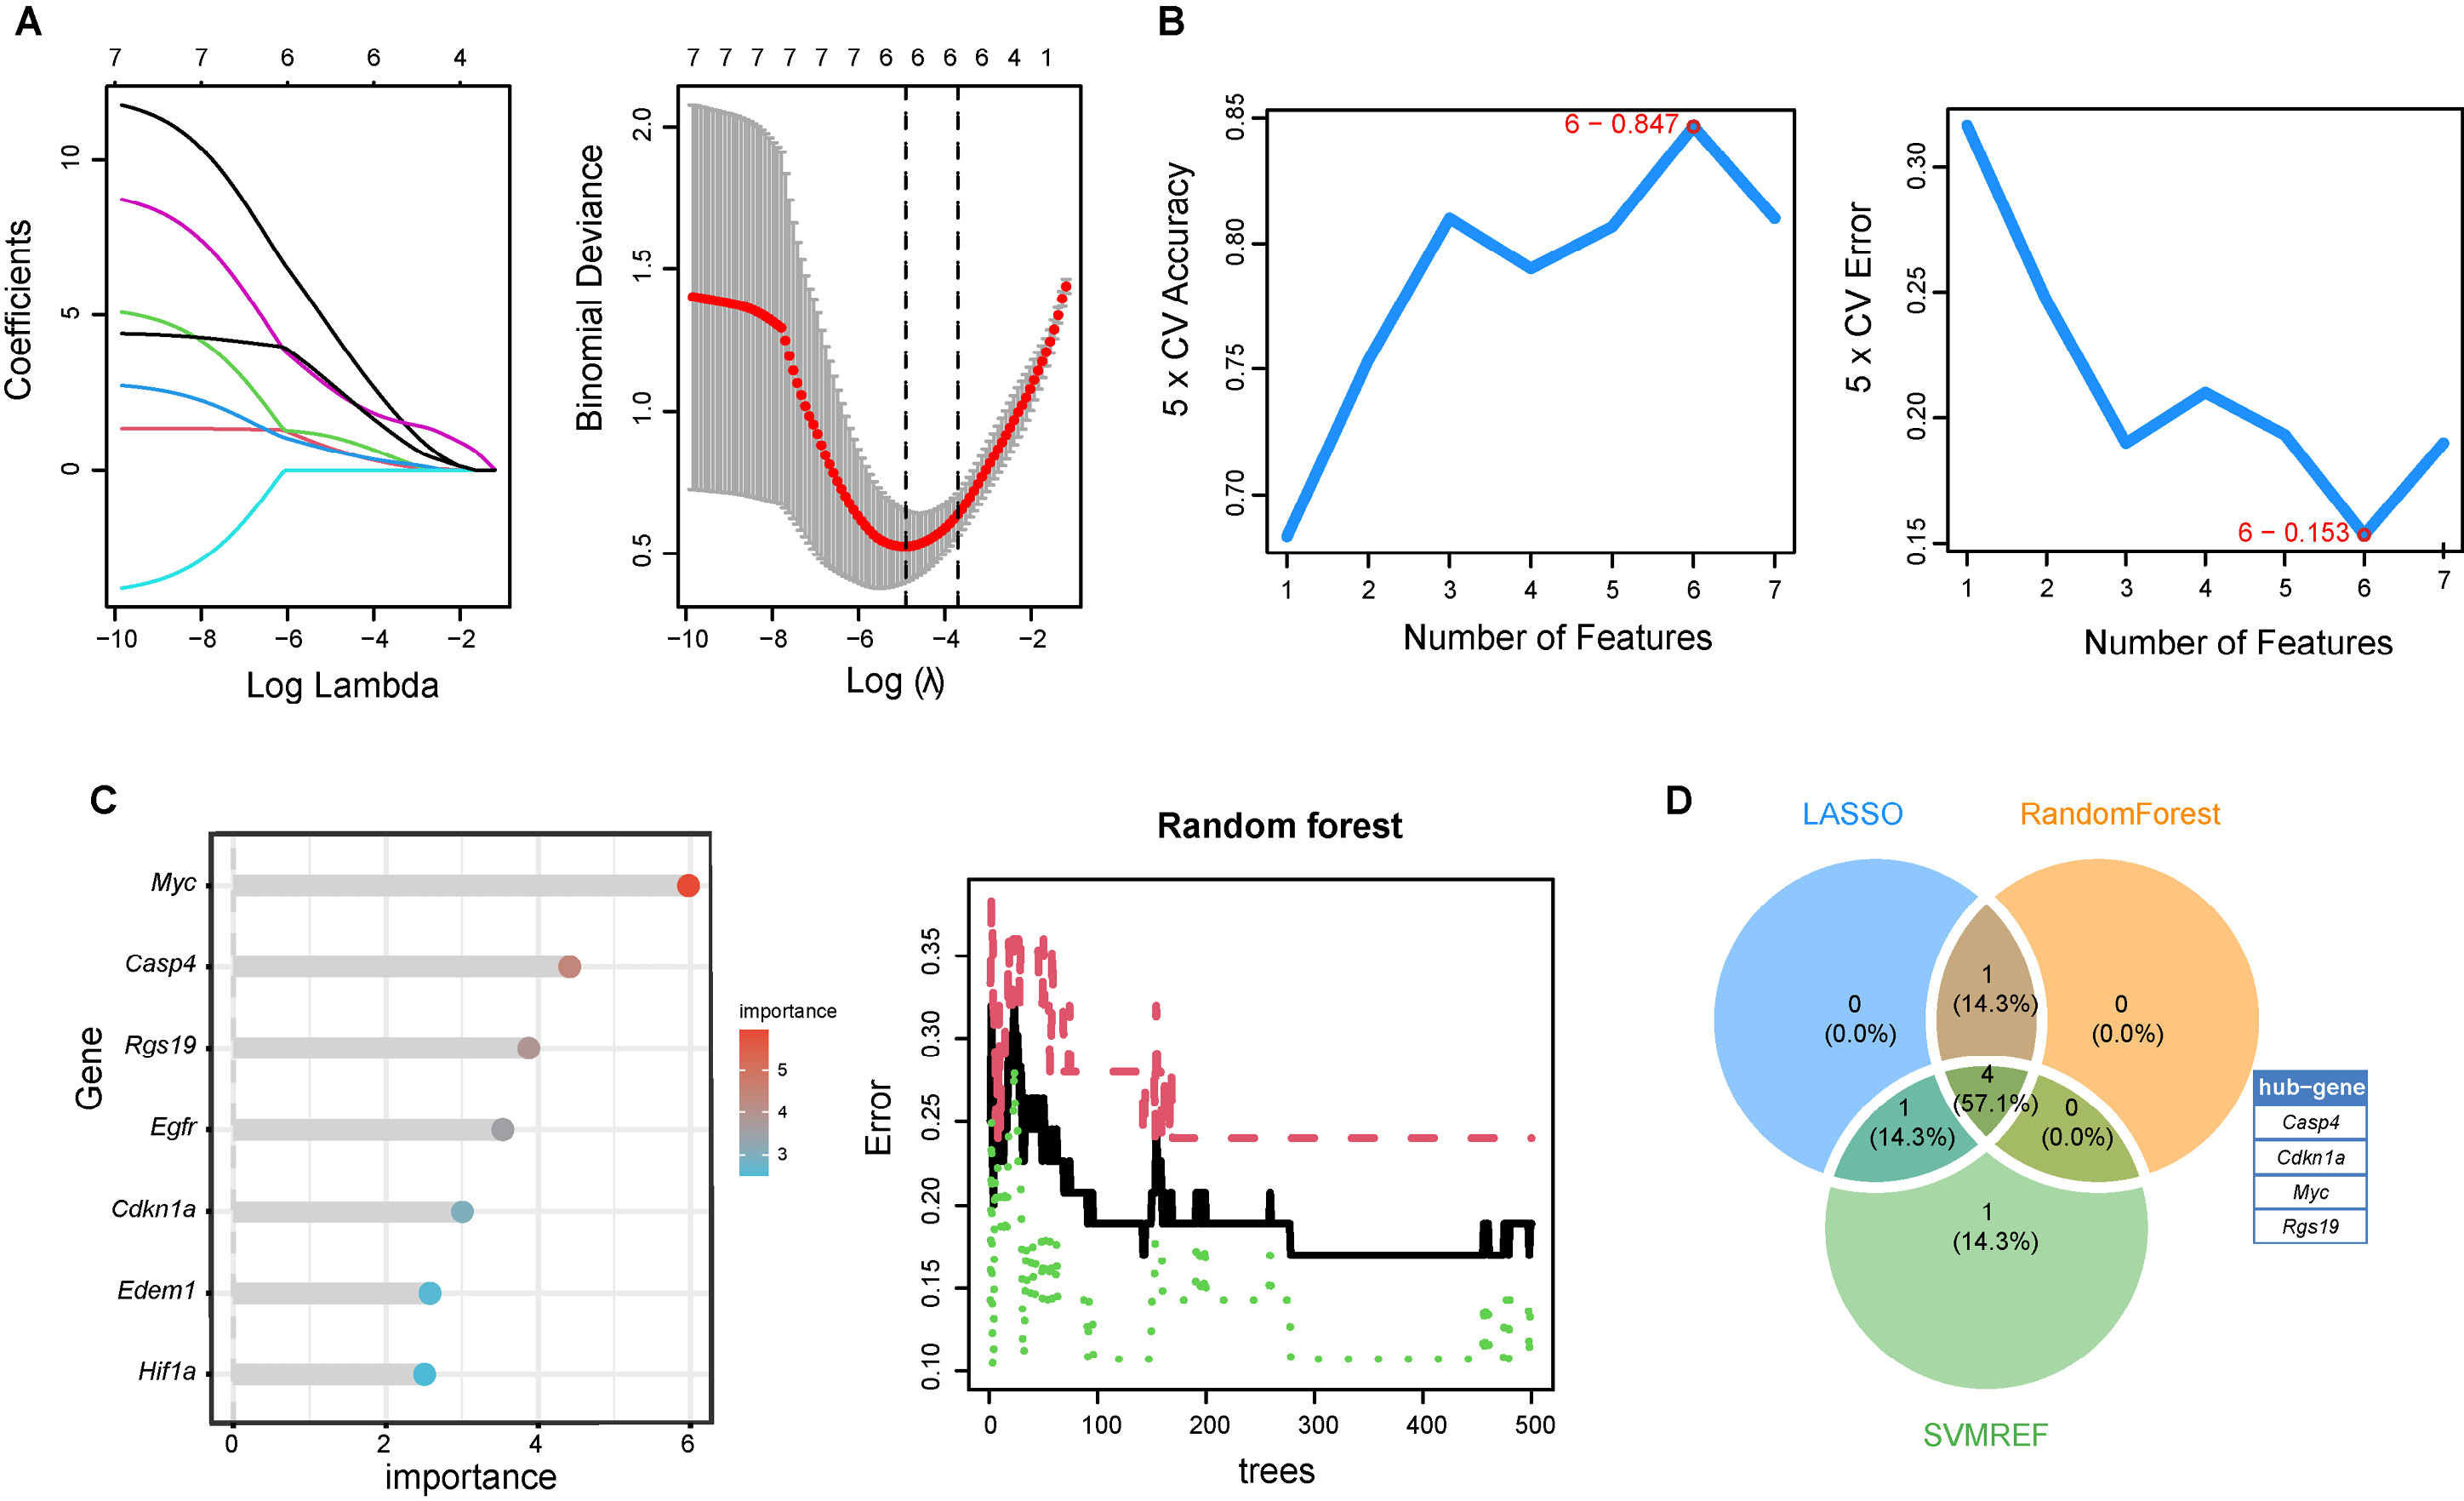
Based on the 7 shared genes, 3 machine-learning algorithms – LASSO, SVM-RFE, and RF – were used to identify the most promising candidate biomarker genes. The LASSO coefficient path plot identified 7 genes with nonzero regression coefficients. Using 10-fold cross-validation, the optimal λ value corresponding to the minimum cross-validation error was selected, resulting in the identification of 6 key feature genes (Figure 3A). The performance of the SVM-RFE model was evaluated using 5-fold cross-validation, leading to the identification of 6 key genes with the lowest error rate and highest classification accuracy (Figure 3B). Subsequently, the RF algorithm identified 7 genes with importance scores >2.0 as potential biomarkers for I/R injury (Figure 3C). Ultimately, 4 hub genes (Casp4, Cdkn1a, Myc, and Rgs19) were consistently identified by all 3 algorithms, as illustrated in the Venn diagram (Figure 3D).
Evaluation of diagnostic efficacy for hub biomarkers via nomogram
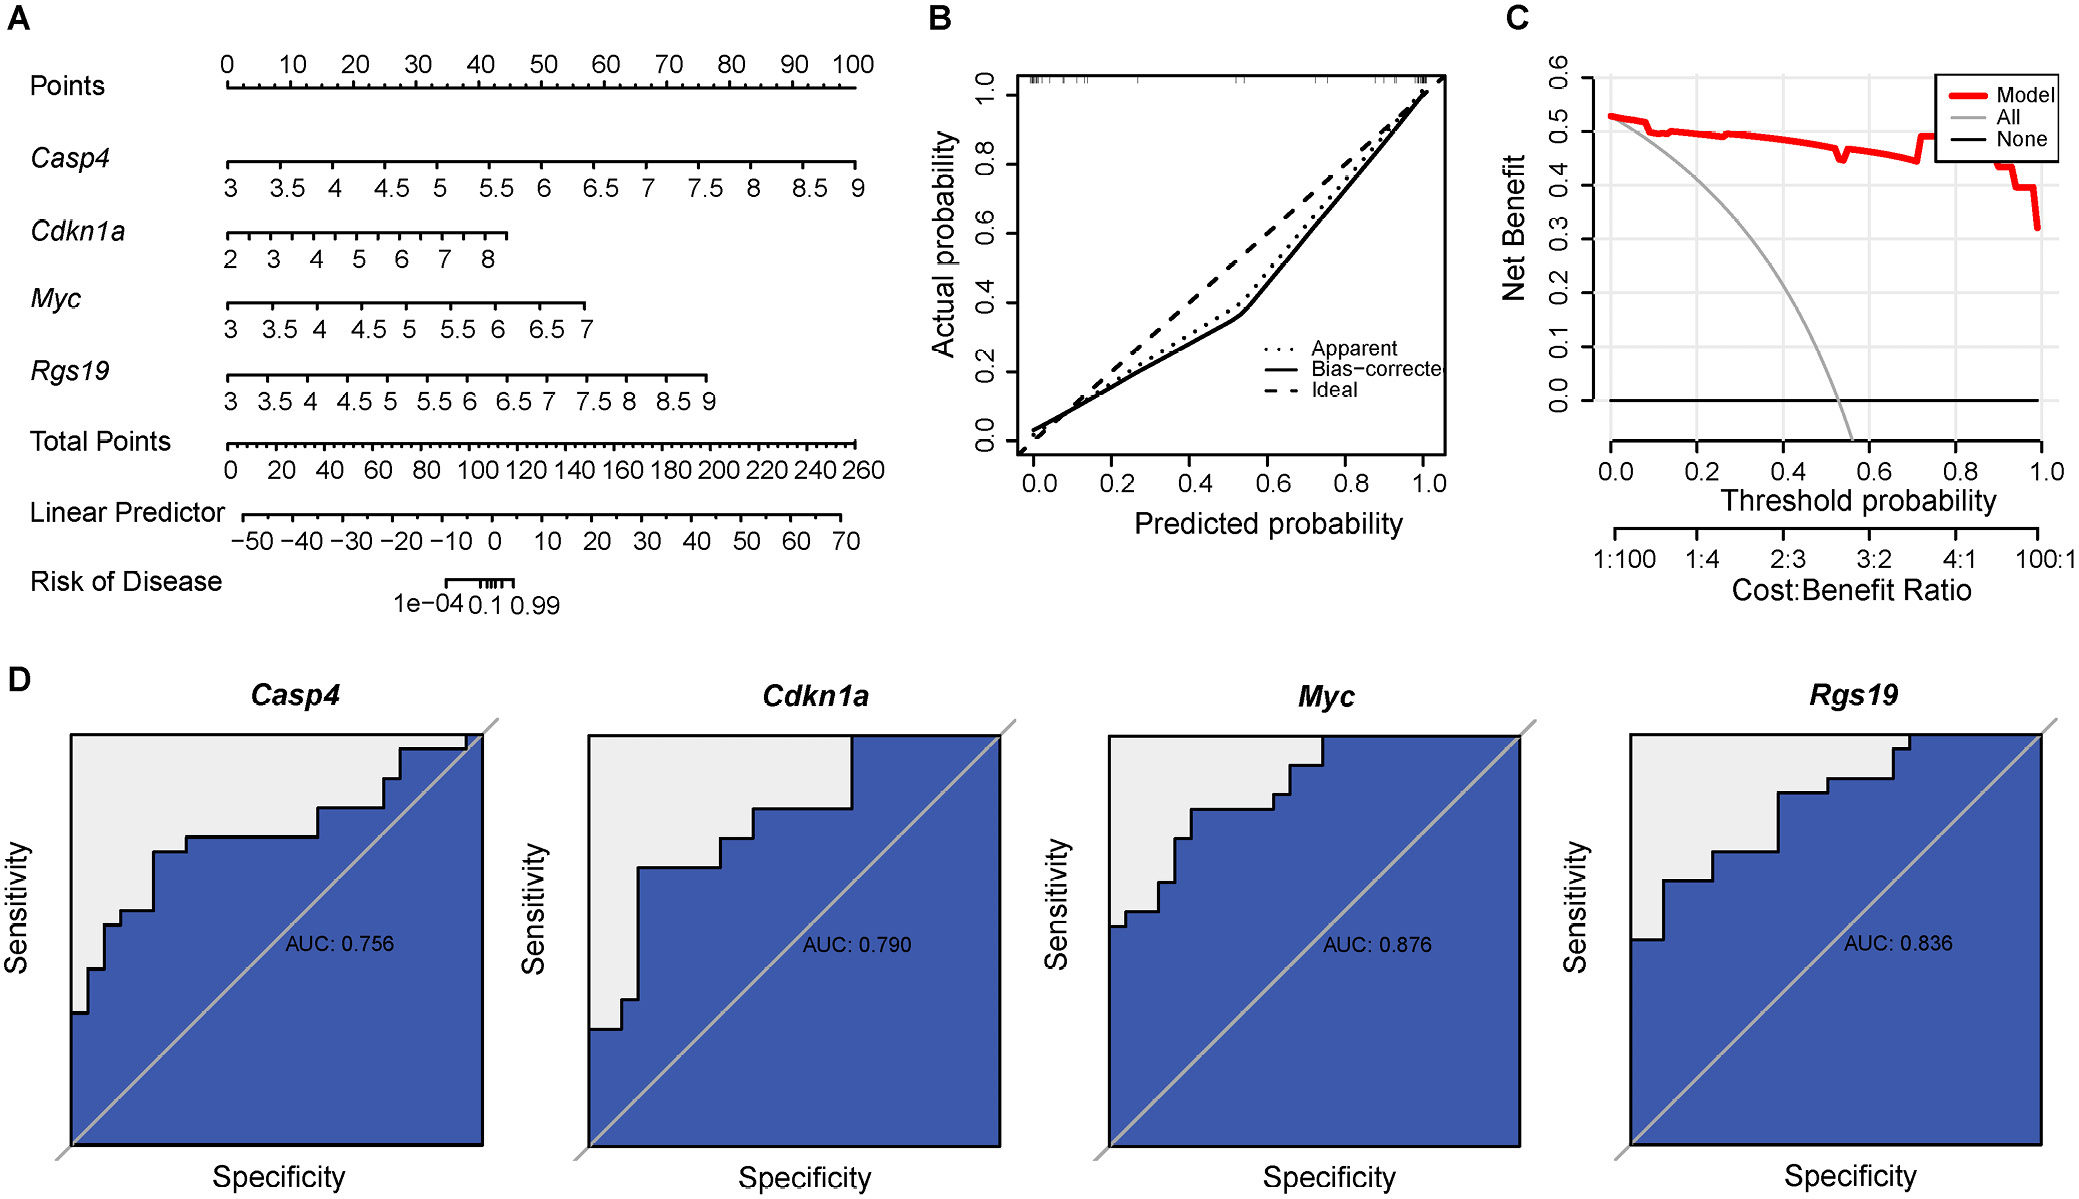
To further evaluate the predictive performance for myocardial I/R injury, a nomogram was constructed using the 4 candidate hub biomarkers (Casp4, Cdkn1a, Myc, and Rgs19), providing a simple and reliable diagnostic tool (Figure 4A). The calibration curve (Figure 4B) demonstrated good agreement between the predicted and observed probabilities, indicating excellent calibration. In addition, decision curve analysis (Figure 4C) demonstrated the potential clinical utility of the nomogram for the diagnosis of myocardial I/R injury. In the development cohort, the AUCs were 0.756 for Casp4, 0.790 for Cdkn1a, 0.876 for Myc, and 0.836 for Rgs19 (Figure 4D), indicating high diagnostic accuracy and strong discriminatory performance.
Single-gene GSEA analysis of hub biomarkers
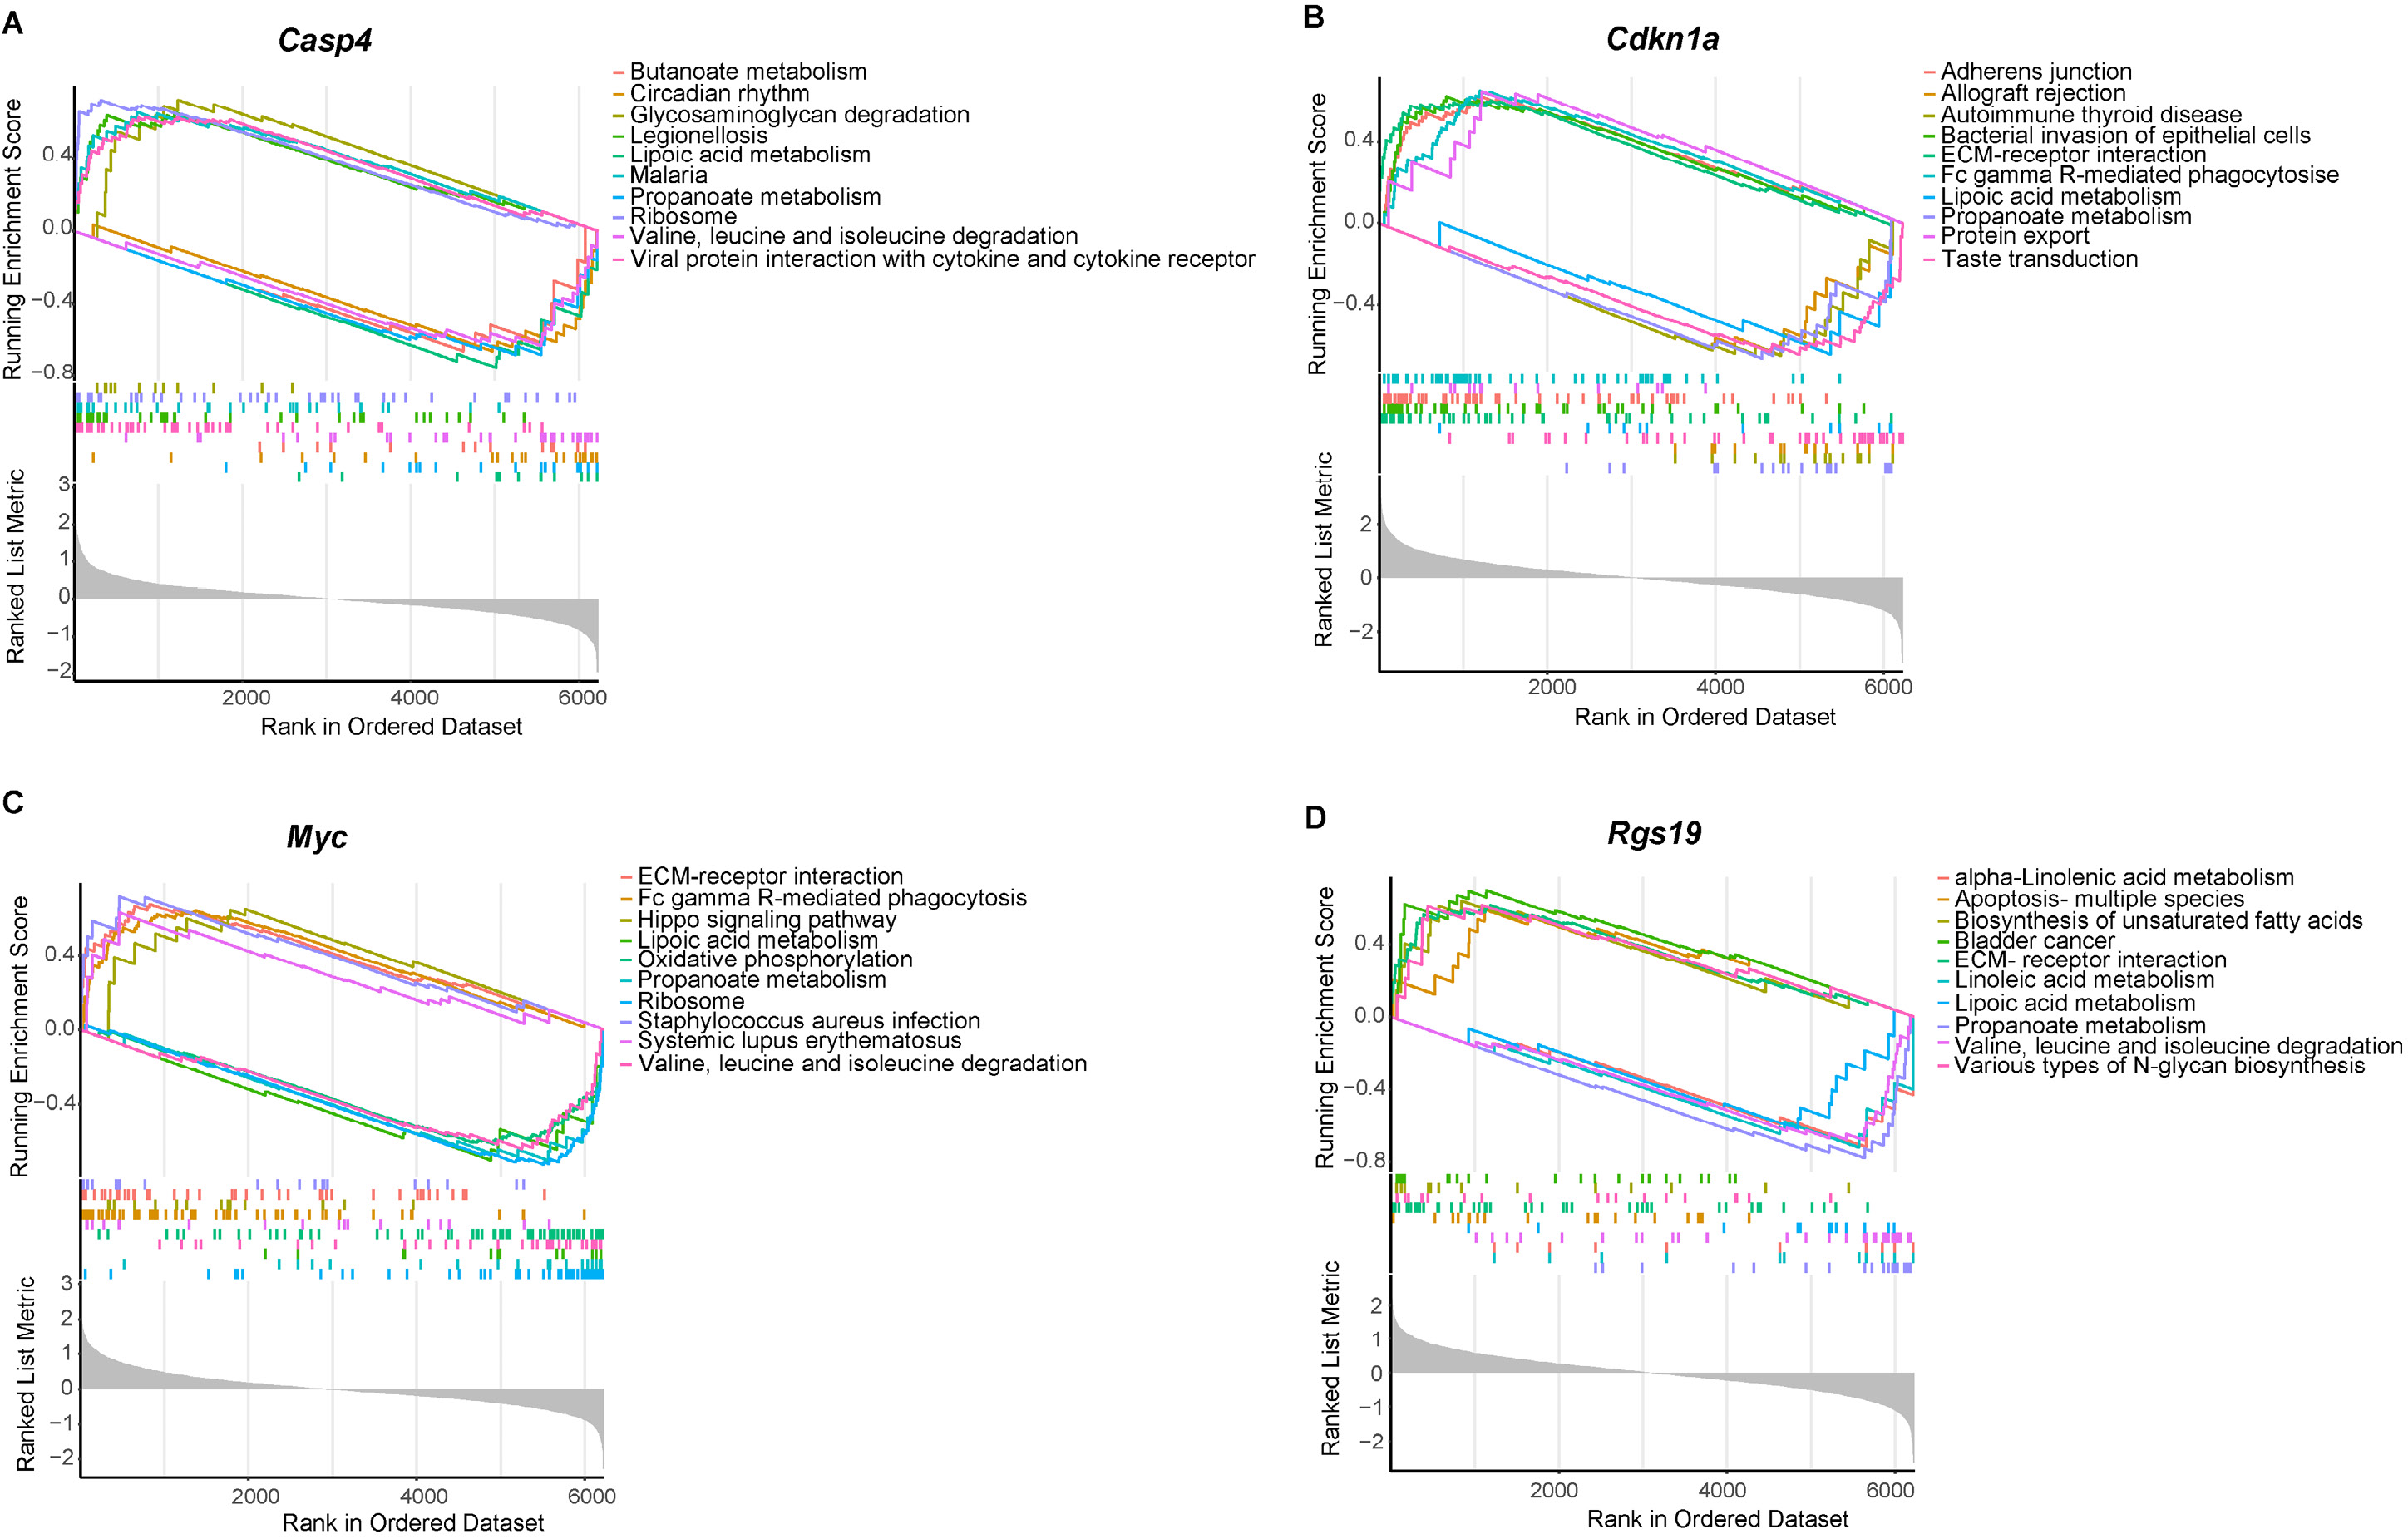
To investigate the potential biological functions associated with the diagnostic biomarkers, single-gene GSEA was performed, and the top 5 positively and negatively enriched pathways were visualized. The analysis demonstrated that the 4 hub genes were predominantly associated with metabolic pathways, including lipoic acid metabolism and propanoate metabolism. In addition, all 4 genes were enriched in pathways related to valine, leucine, and isoleucine degradation, as well as extracellular matrix (ECM)-receptor interaction (Figure 5).
Association between immune cell infiltration and hub genes
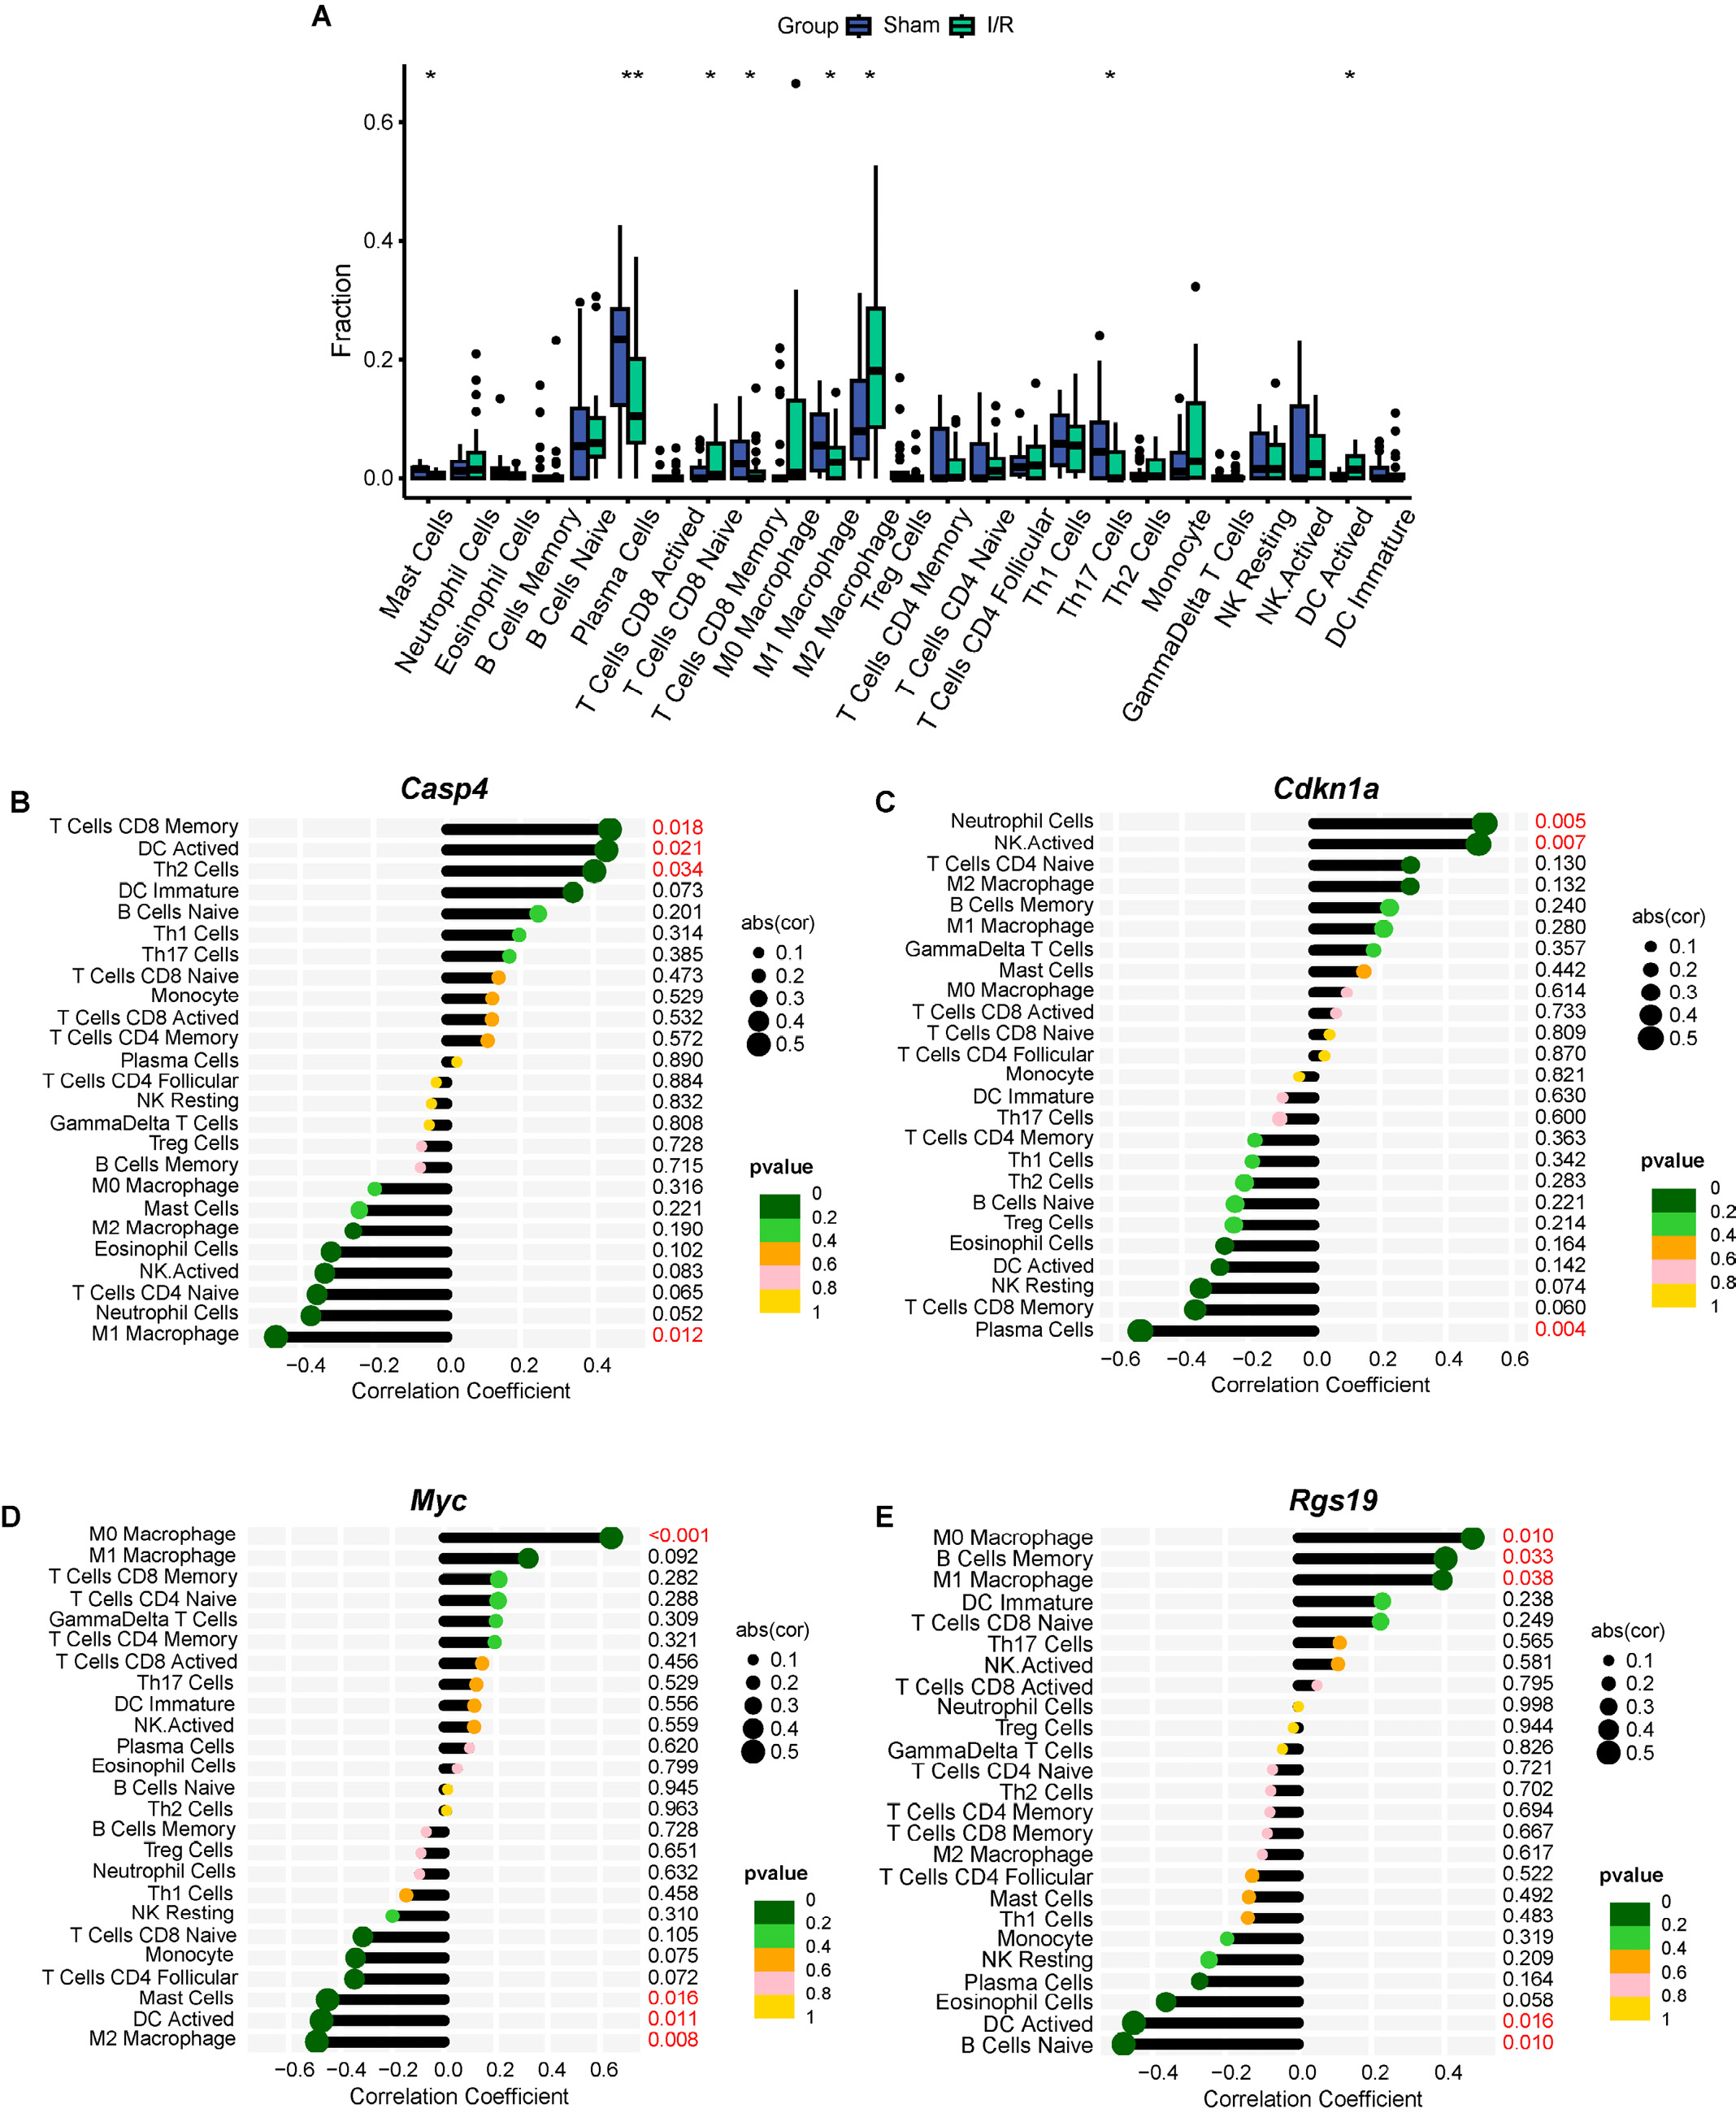
Additionally, the CIBERSORT algorithm was used to estimate immune cell infiltration in the I/R and sham groups. As shown in Figure 6A, significant differences in immune cell composition were observed between the 2 groups. Compared with the sham group, the I/R group exhibited increased infiltration of naïve CD8+ T cells, M2 macrophages, and activated dendritic cells (DCs), whereas the sham group showed higher proportions of mast cells, plasma cells, memory CD8+ T cells, and Th17 cells. Furthermore, correlation analysis suggested that the identified biomarker genes may contribute to the progression of I/R injury through interactions with multiple immune cell populations, including T cells, activated DCs, macrophages, neutrophils, and B cells (Figure 6B–E).
Exploring subtypes of I/R with biological molecular mechanisms
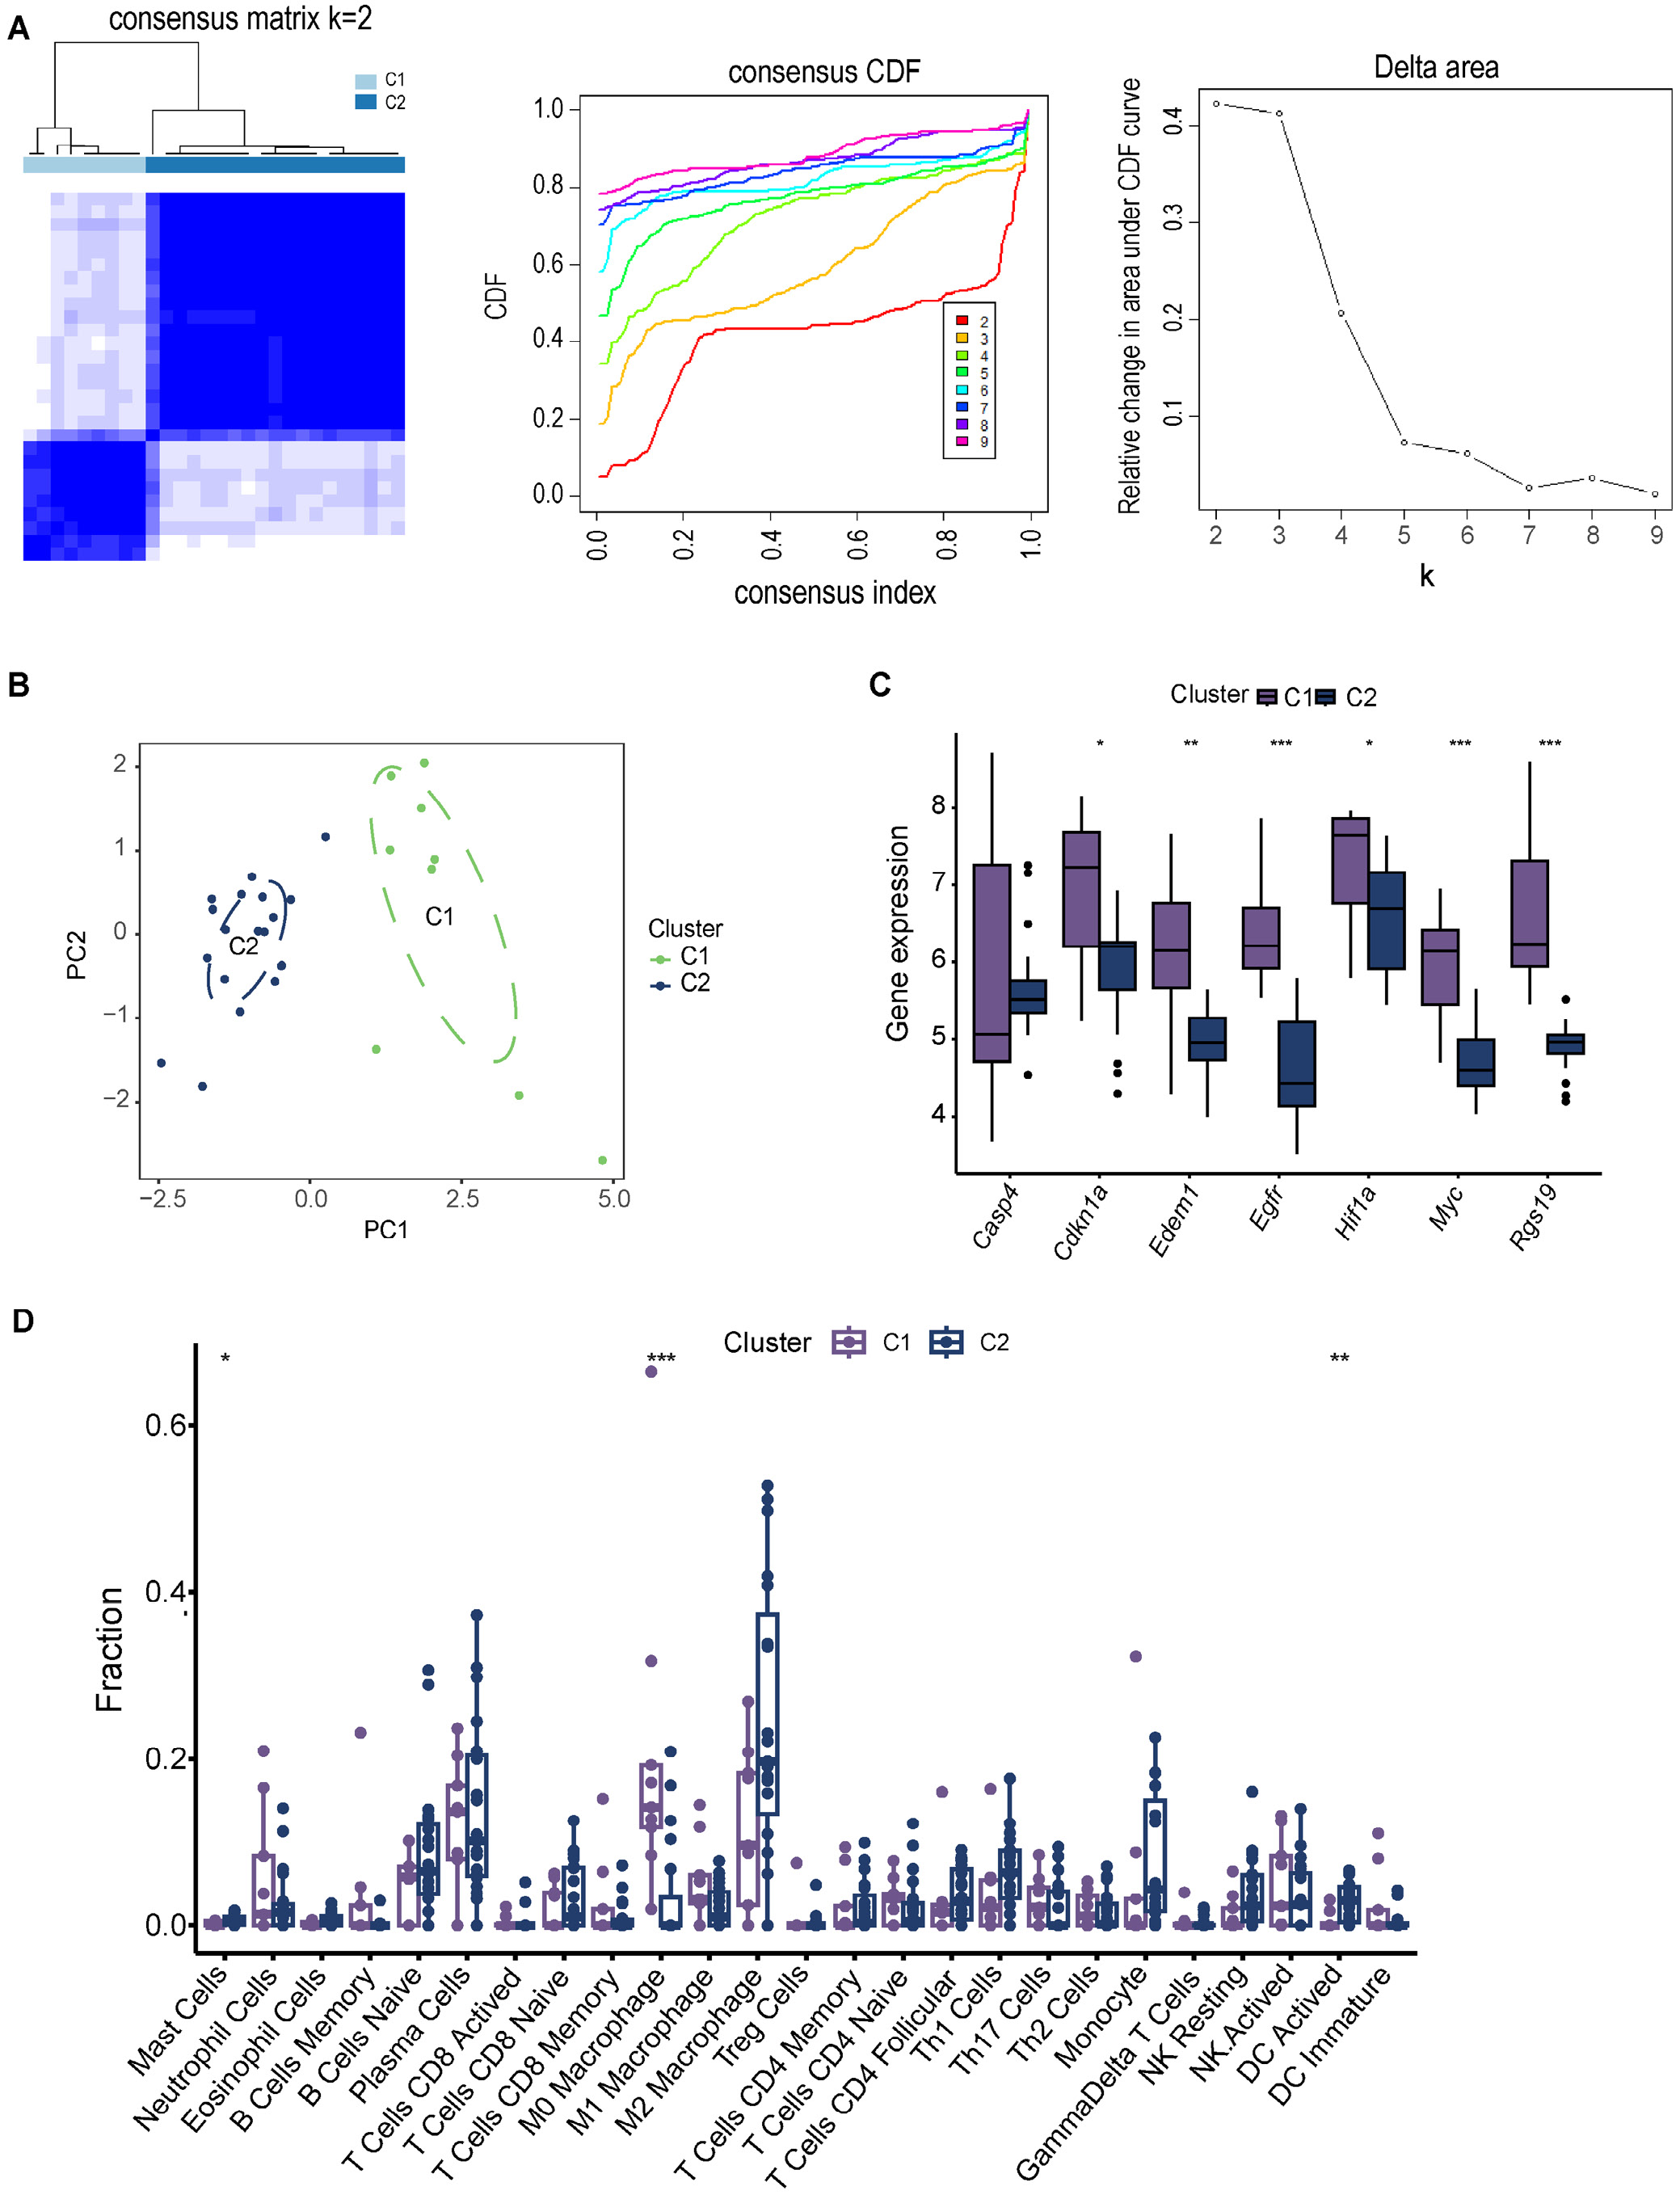
To further characterize heterogeneity within the I/R group, unsupervised clustering analysis was performed to classify I/R samples into distinct molecular subtypes. Using the expression profiles of the 7 shared genes, consensus clustering was applied to 28 I/R samples. Two optimal subtypes were identified based on the consensus matrix, CDF plot, and relative changes in the area under the CDF curve (Figure 7A). After classification into 2 subtypes (C1, n = 9; C2, n = 19), PCA demonstrated clear separation of the C1 and C2 groups based on gene expression profiles (Figure 7B).
Further analysis of the shared genes revealed that, with the exception of Casp4, the C1 subtype exhibited significantly higher expression of Cdkn1a, Edem1, Egfr, Hif1a, Myc, and Rgs19 than the C2 subtype (Figure 7C). In addition, marked differences in immune cell abundance were observed between the 2 subtypes. The C2 subtype showed higher proportions of mast cells and activated DCs, whereas the C1 subtype exhibited greater infiltration of M0 macrophages (Figure 7D).
To investigate functional differences between the 2 subtypes, KEGG and GO enrichment analyses were performed. As shown in Supplementary Fig. 3A,B, the DEGs between C1 and C2 were significantly enriched in pathways related to neurodegeneration, oxidative phosphorylation, Parkinson’s disease, and cardiac muscle contraction. Gene Ontology enrichment analysis further demonstrated significant enrichment of biological processes related to cellular respiration, energy metabolism, mitochondrial protein complexes, structural constituents of the ribosome, and proton transmembrane transporter activity.
Hub genes expression and diagnostics in GSE168610
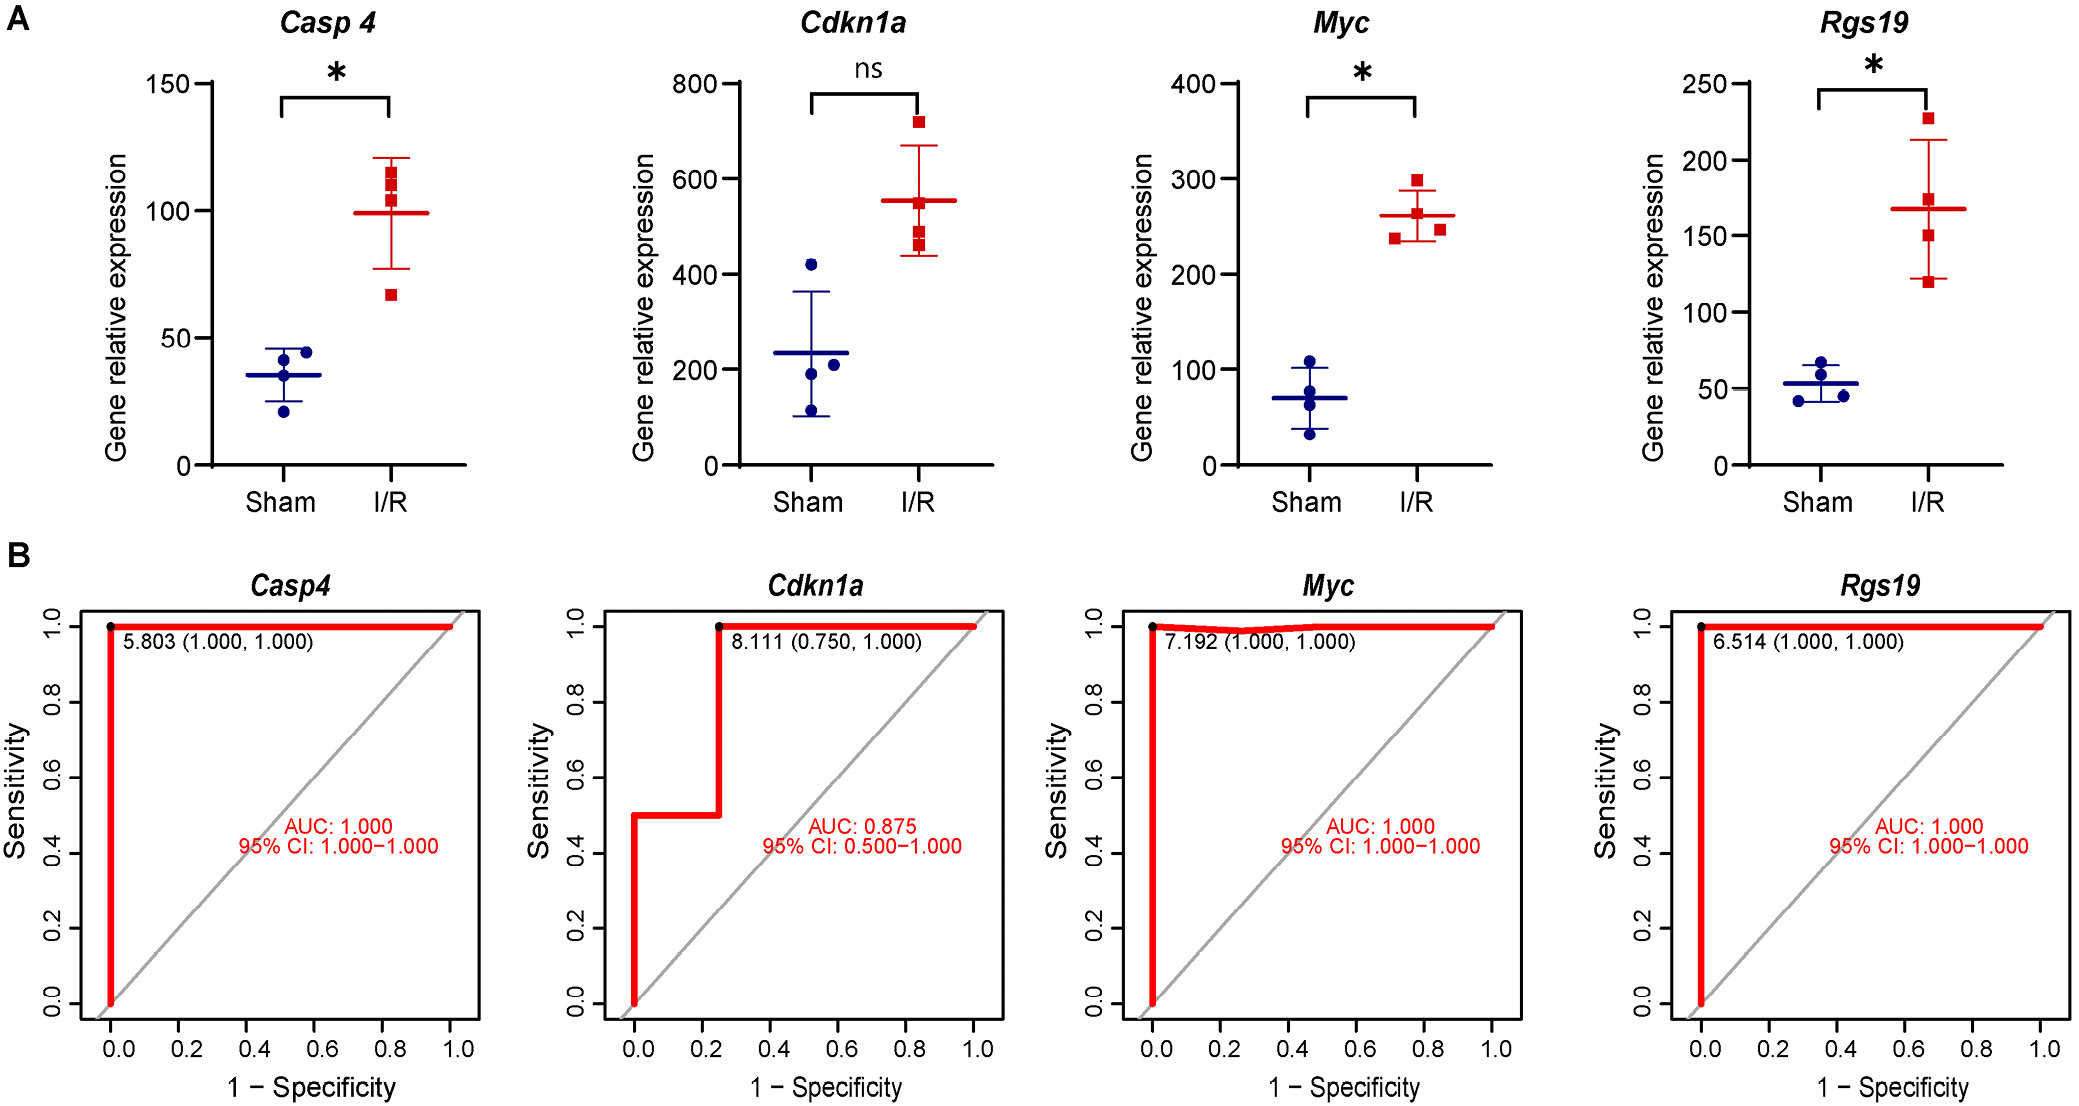
To validate the reliability of the bioinformatics analysis, the 4 key genes were independently evaluated in the external validation cohort (GSE168610). As shown in Figure 8A, the expression levels of Casp4, Myc, and Rgs19 were significantly increased in I/R myocardial tissue compared with sham controls (p < 0.05), whereas Cdkn1a expression did not differ significantly (ns, p > 0.05). Furthermore, ROC curve analysis (Figure 8B) demonstrated that Casp4, Myc, and Rgs19 showed perfect diagnostic performance for distinguishing I/R injury (AUC = 1.000), whereas Cdkn1a also demonstrated excellent diagnostic performance (AUC = 0.875).
Preliminary validation of autophagy-related prognostic genes in myocardial I/R and CMECs H/R model
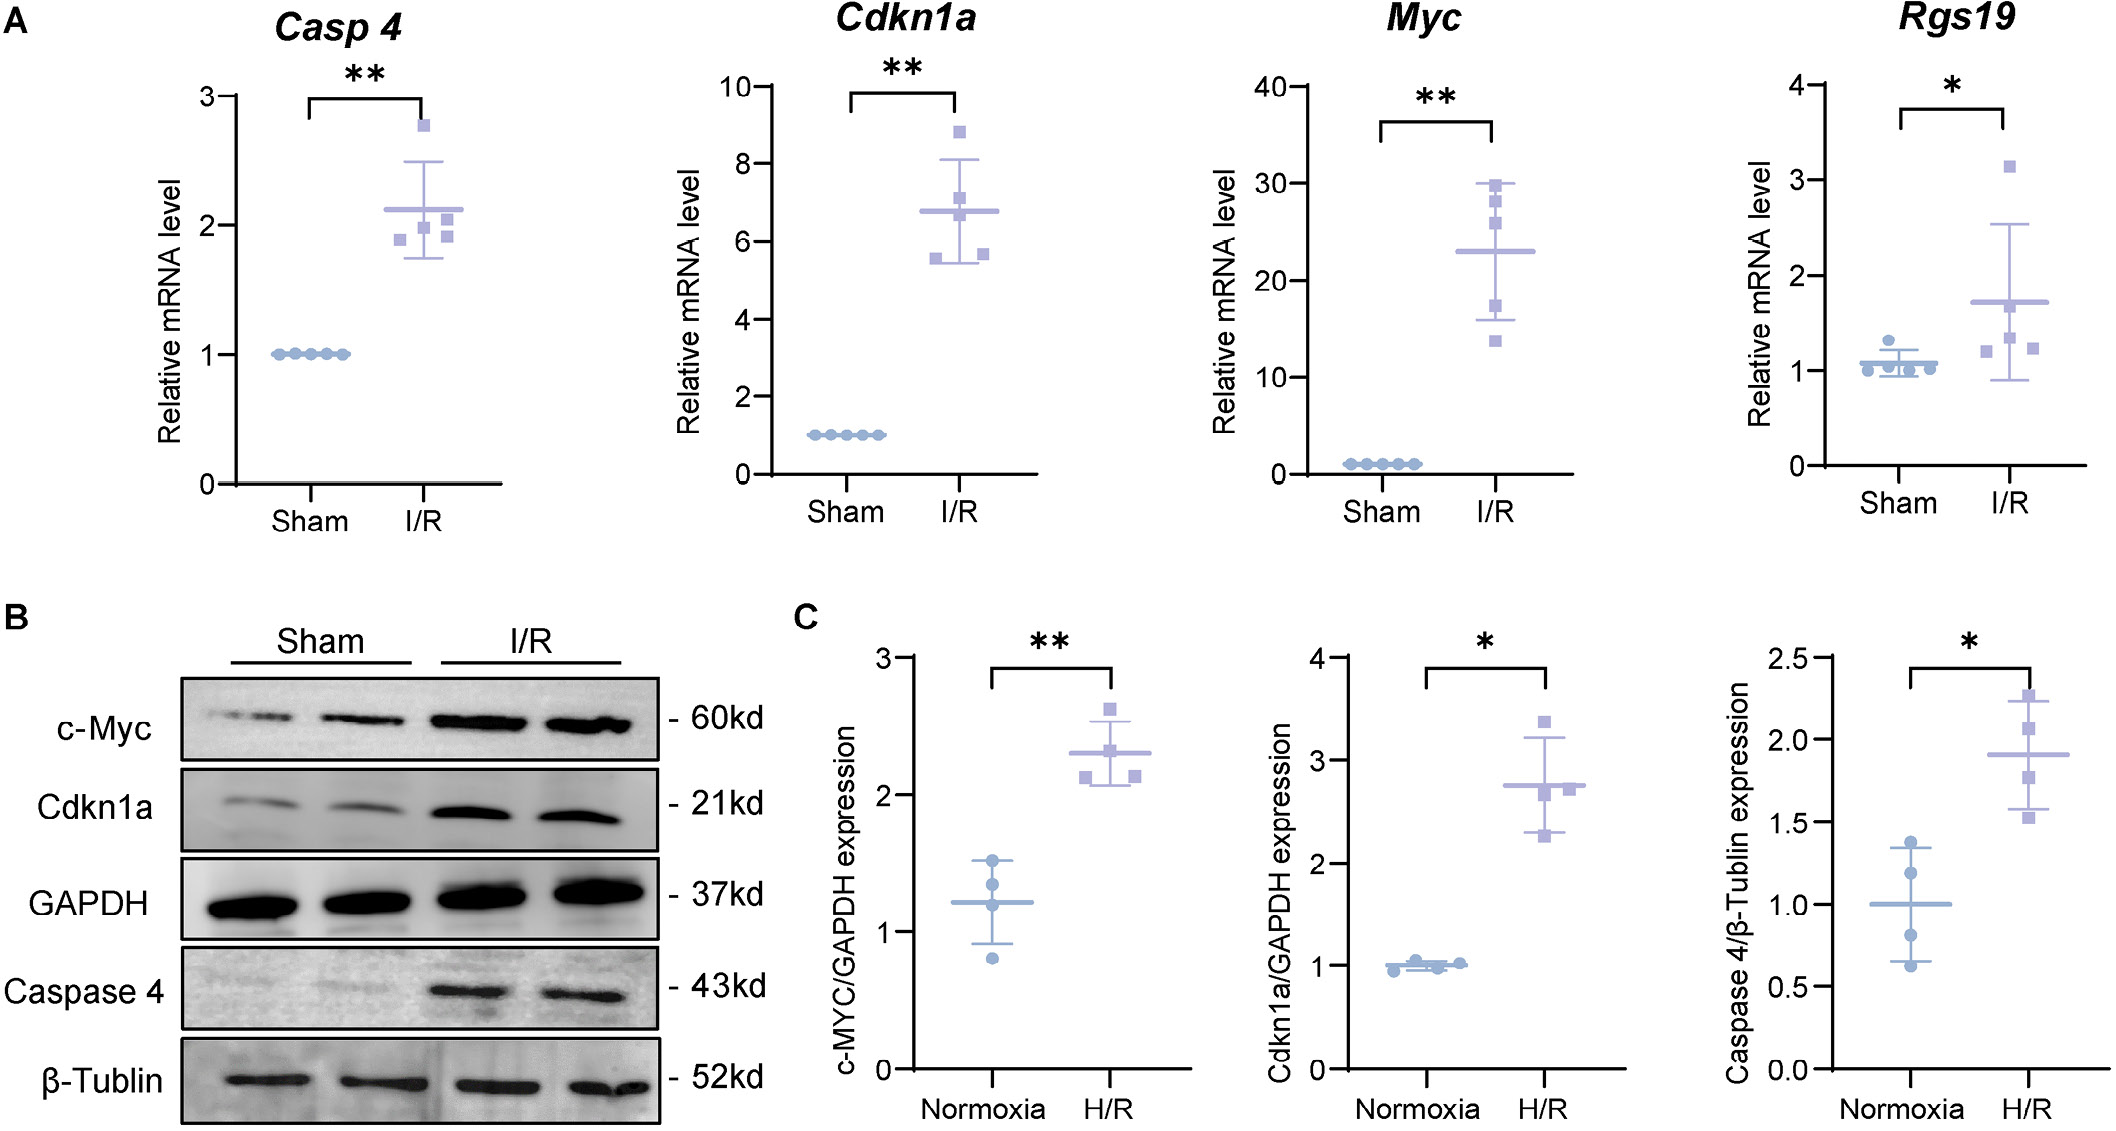
To validate the roles of Casp4, Cdkn1a, Myc, and Rgs19 identified through bioinformatics analysis, an in vivo myocardial I/R-induced microvascular injury model and an in vitro H/R model were established to evaluate the expression of these candidate biomarkers. Electrocardiographic analysis revealed significant ST-segment elevation during myocardial ischemia, which decreased by more than 50% after reperfusion (Supplementary Fig. 1A). TTC/Evans blue staining demonstrated a marked increase in infarct size following I/R injury (Supplementary Fig. 1B and Supplementary Table 6). After I/R, cardiac function was significantly impaired, as evidenced by reduced LVEF and LVFS (Supplementary Fig. 1C,D and Supplementary Table 6). Gelatin–ink staining further confirmed impaired microvascular perfusion in myocardial tissue after I/R (Supplementary Fig. 1E and Supplementary Table 6). Myocardial tissue subjected to I/R exhibited significantly increased mRNA expression of Casp4, Cdkn1a, Myc, and Rgs19 compared with sham controls (Figure 9A and Table 1), together with increased protein expression of caspase-4, p21, and c-Myc (U = 0, p < 0.05; Figure 9B and Table 2). Immunohistochemistry confirmed enrichment of caspase-4 and c-Myc within areas of microvascular injury (Supplementary Fig. 4A,B). In addition, RT-qPCR demonstrated H/R-induced upregulation of Casp4, Cdkn1a, Myc, and Rgs19 compared with normoxic controls, whereas increased protein expression of caspase-4, p21, and c-Myc was confirmed with western blot (WB) analysis (Supplementary Fig. 5A–C and Table 1, Table 2).
Myc knockout reduces apoptosis in H/R-induced CMECs
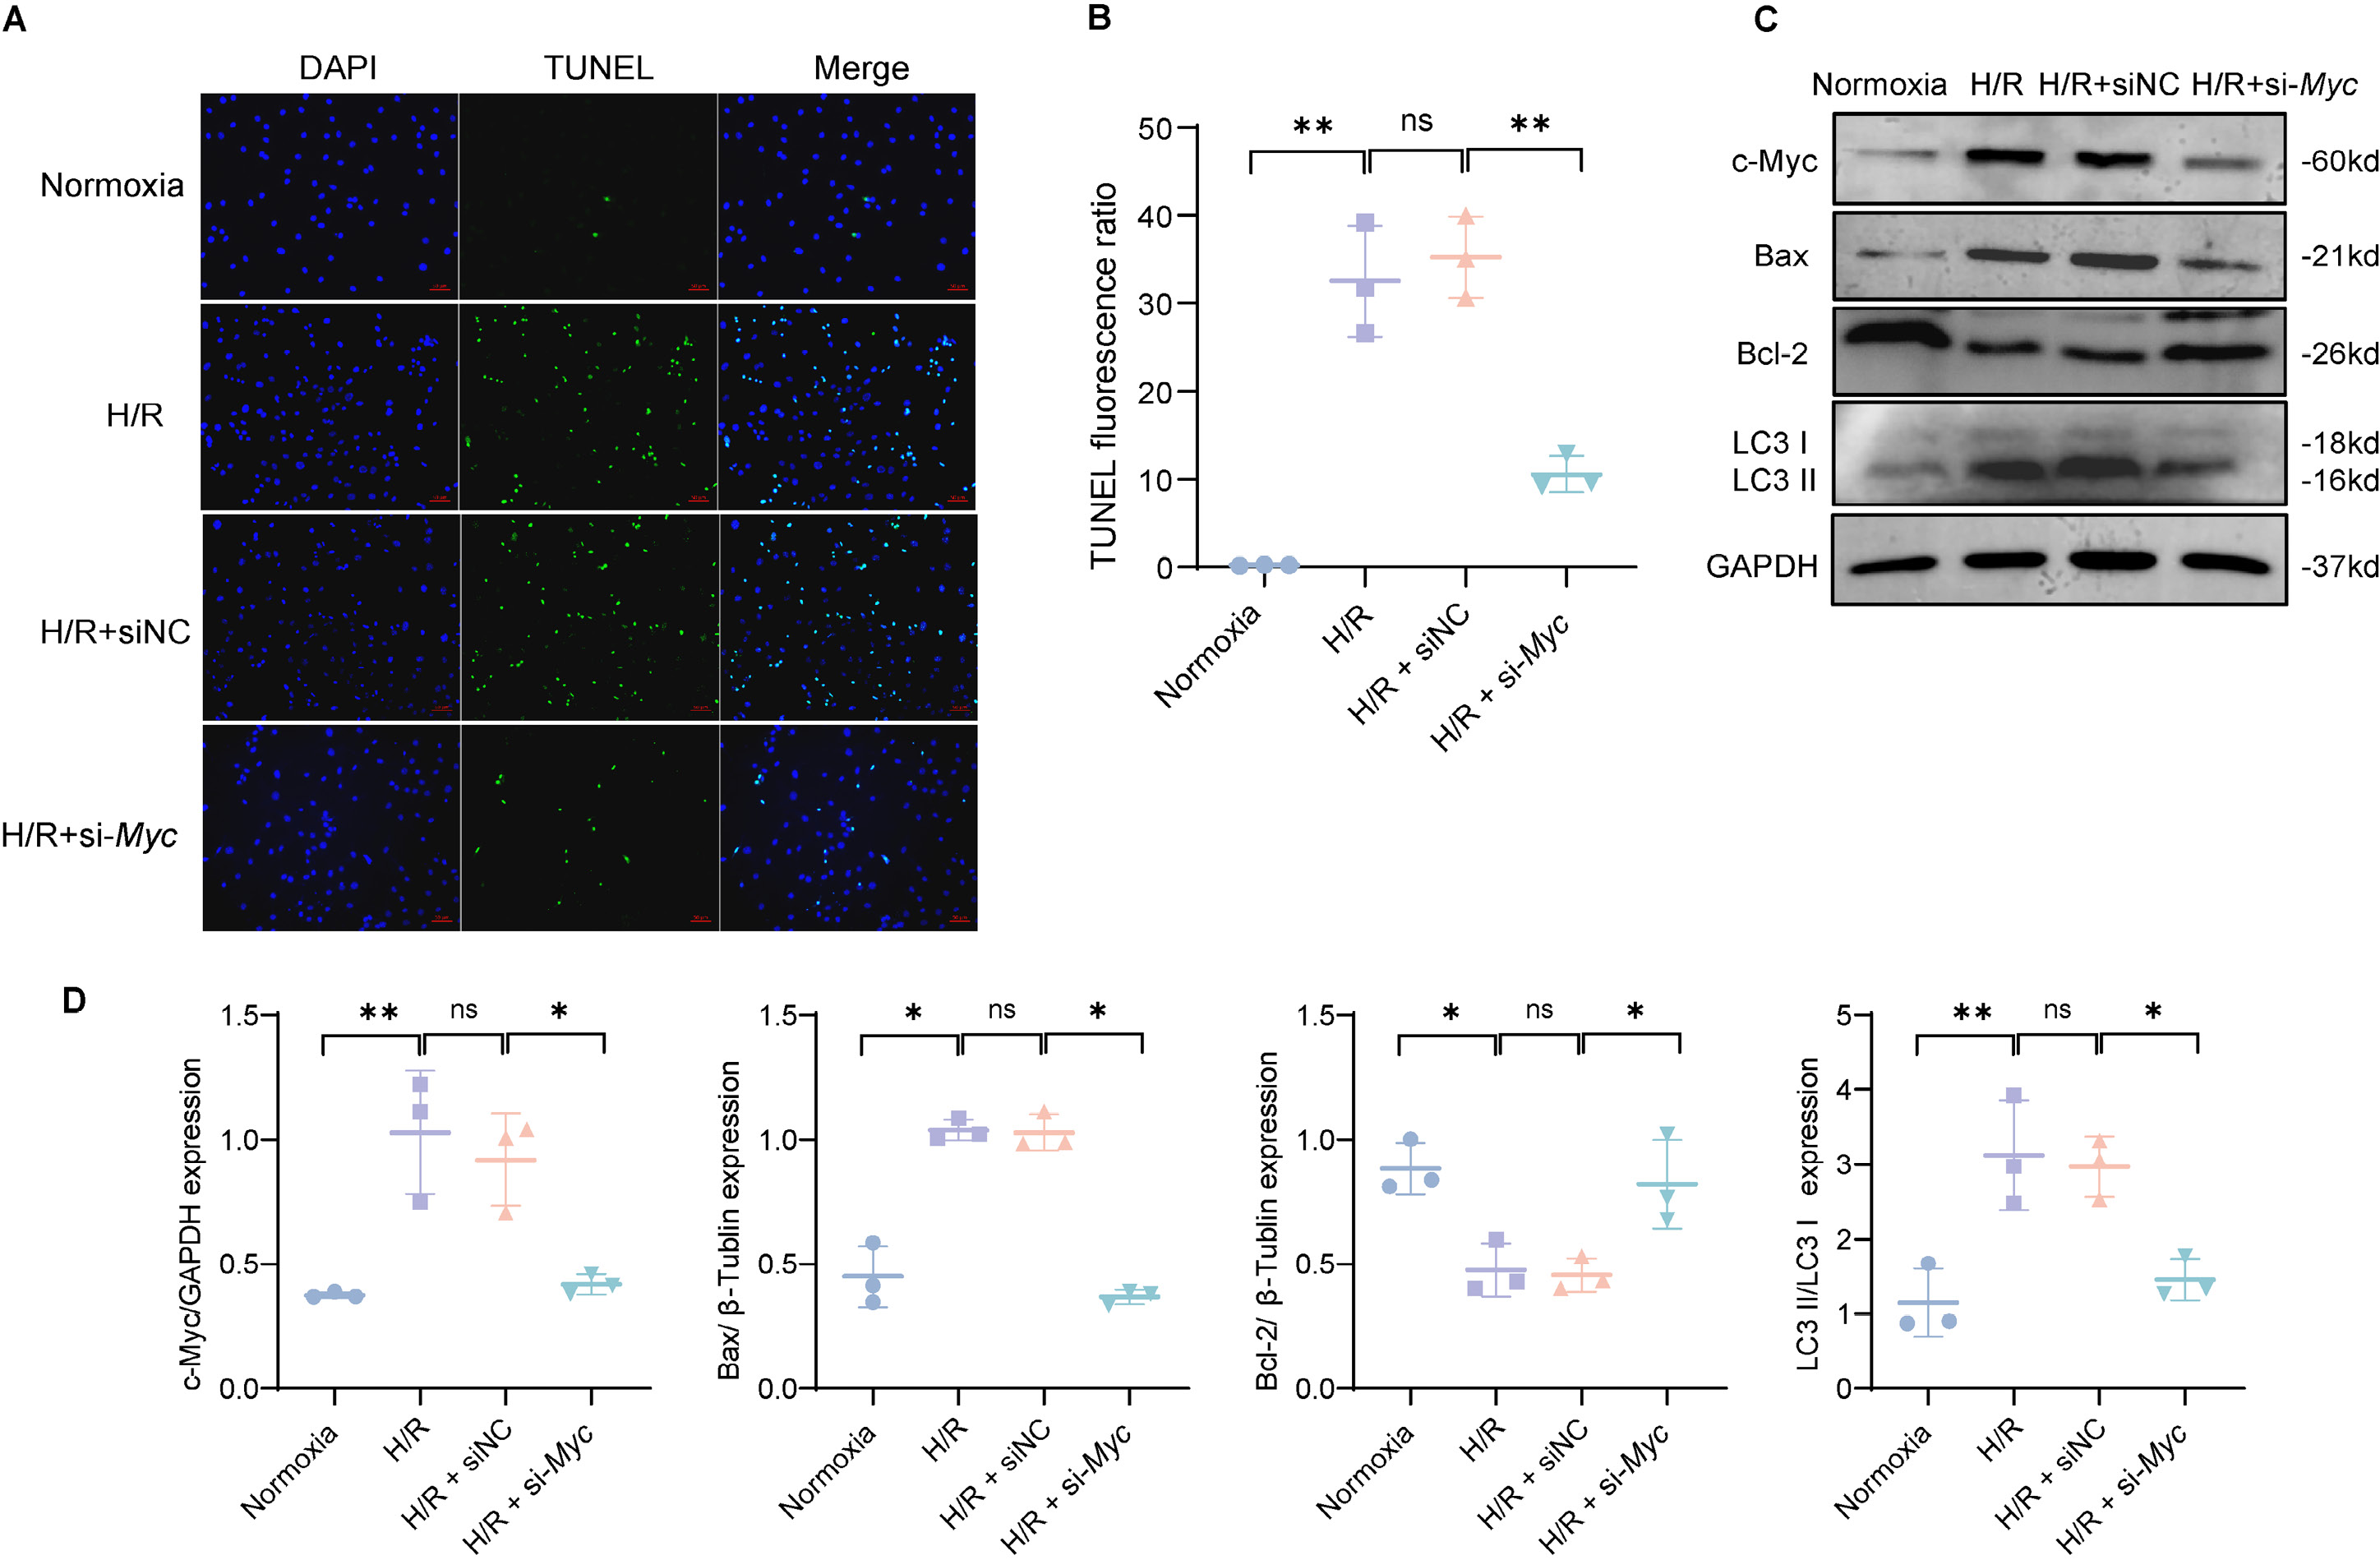
We performed TUNEL staining to detect apoptosis. As shown in Figure 10A,B and Table 3, the apoptotic rate of vascular endothelial cells was significantly higher in the H/R group than in the normoxia group. This increase was almost completely reversed by si-Myc treatment. Western blot analysis demonstrated that H/R injury significantly upregulated Bax expression, downregulated Bcl-2 expression, and promoted LC3-II conversion, whereas Myc knockout largely normalized these alterations in protein expression (p < 0.05; Figure 10C,D and Table 4). Transmission electron microscopy was then used to examine mitochondrial ultrastructure and autophagosome formation. In cells exposed to H/R injury, mitochondria exhibited marked swelling and disruption of the cristae, accompanied by abundant autophagic vacuoles. In contrast, si-Myc treatment markedly ameliorated these ultrastructural alterations (Supplementary Fig. 6).
Discussion
Despite clinical efforts to restore blood flow to the ischemic myocardium and limit myocardial necrosis, myocardial I/R continues to damage both cardiac tissue and the coronary microcirculation.21 Extensive microvascular injury impairs myocardial perfusion and limits the delivery of therapeutic agents to the distal microvasculature, thereby complicating clinical management.22 By integrating machine-learning approaches with multimodal validation, we identified a potential 4-biomarker panel (Casp4, Cdkn1a, Myc, and Rgs19) with high diagnostic accuracy (AUCs of 0.756 for Casp4, 0.790 for Cdkn1a, 0.876 for Myc, and 0.836 for Rgs19; Figure 4D) for microvascular I/R injury. Importantly, c-Myc emerged as a dual-function regulator: beyond its diagnostic value, c-Myc knockout significantly reduced endothelial apoptosis and autophagic dysregulation (Figure 10A–D), highlighting its potential as a therapeutic target. This finding directly addresses a persistent challenge in reperfusion therapy. Although rapid revascularization remains essential for the treatment of ischemic cardiomyopathy, it paradoxically induces microvascular I/R injury that compromises treatment efficacy. The dual protective and detrimental roles of autophagy in cardiac I/R make this pathway an attractive therapeutic target. Our data indicate that dysregulated autophagy, particularly excessive c-Myc-mediated autophagy, is a key mechanism underlying this paradox. This mechanistic insight identifies a potential therapeutic target for mitigating the no-reflow phenomenon, which limits drug delivery and tissue perfusion.
Casp4 has been reported to mediate pyroptosis in microvascular endothelial cells and to play a critical role in the pathophysiology of myocardial I/R.18 Our findings are consistent with previous studies, demonstrating a significant upregulation of Casp4 expression in both the I/R and H/R models. Previous research has also suggested that inhibition of Casp4-mediated cell death through activation of autophagy signaling pathways may represent a promising therapeutic strategy for myocardial reperfusion-related microvascular injury.18 Given its prognostic significance and overexpression in clear cell renal cell carcinoma, Casp4 has also emerged as a candidate biomarker for disease monitoring and a potential molecular target for therapeutic intervention.23 During cardiac I/R, cells are exposed to hypoxia, nutrient deprivation, inflammation, and oxidative stress, resulting in dysregulated cell-cycle progression and subsequent cellular dysfunction and injury. Cdkn1a (p21), a cyclin-dependent kinase inhibitor, plays a protective role in I/R injury by limiting cell-cycle progression and reducing oxidative stress.24 Previous studies have shown that Cdkn1a interacts with the autophagy-related protein LC3B, thereby contributing to the attenuation of cardiac dysfunction.25 Moreover, activation of Cdkn1a-mediated cell-cycle arrest has been shown to alleviate injury in cardiac microvascular endothelial cells.26 Multiomics data derived from human cardiac cells have also identified Cdkn1a as a potential therapeutic target for heart failure.27 Our study demonstrated a marked increase in Cdkn1a expression in myocardial I/R tissue and, to our knowledge, is the first to document significant upregulation of Cdkn1a in H/R-treated CMECs. These findings underscore the pivotal role of Cdkn1a in the progression of myocardial I/R-induced microvascular injury and highlight its potential as a therapeutic target for this condition.
The Myc oncogene encodes a potent transcription factor that regulates nearly every cellular process through interactions with numerous transcriptional regulators and protein complexes.28 The Myc family comprises 3 members: Myc (c-Myc), Mycl, and Mycn, with c-Myc being particularly relevant to cardiomyocytes. Previous studies have indicated that c-Myc overexpression may contribute to cardiomyocyte apoptosis following myocardial I/R.29 Research has also suggested that regulation of Myc expression and its downstream signaling pathways is essential for maintaining cellular integrity and function under cardiac stress.30 Evidence further indicates that selective inhibition of c-Myc overexpression in cardiomyocytes may represent a novel therapeutic strategy for cardiac hypertrophy.31 In our study, c-Myc knockout alleviated H/R-induced microvascular injury, suggesting that c-Myc may represent a promising therapeutic target for myocardial I/R injury. Aberrant Myc expression in cardiac tissue has also been proposed as a potential biomarker for predicting outcomes in patients with septic cardiomyopathy.32
The clinical relevance of Myc expression is further supported by human transcriptomic datasets. Analysis of GSE59867 (peripheral blood samples from 312 patients after myocardial infarction) demonstrated >2-fold upregulation of Myc compared with controls (p < 0.001), whereas GSE60993 (human ischemic myocardium) showed a significant correlation between Myc expression and infarct severity (r = 0.68, p < 0.01).33, 34 These findings support the potential role of Myc as both a diagnostic biomarker and a therapeutic target in ischemic injury. However, previous studies have also shown that Myc downregulation may exacerbate cardiomyocyte apoptosis and oxidative stress, thereby aggravating myocardial I/R injury.35 This apparent discrepancy may reflect differences in animal and cellular models, as well as variations in the duration and experimental protocols of I/R.
Rgs19, a member of the regulator of G protein signaling (RGS) family, modulates G protein-coupled receptor (GPCR) signaling by accelerating GTP hydrolysis of Gα subunits, thereby acting as a negative regulator of intracellular signaling. According to previous studies, Rgs19 influences cardiomyocyte differentiation and cardiac development through the Wnt/β-catenin signaling pathway. Transgenic mice overexpressing Rgs19 exhibit increased expression of heart failure markers, enhanced cell proliferation, and abnormal ventricular repolarization.36 Overexpression of Rgs19 has also been reported in several cancers and is associated with poor clinical outcomes.37, 38 However, little is known about the role of Rgs19 in myocardial I/R-induced microvascular dysfunction. Our study is the first to demonstrate significant upregulation of Rgs19 in myocardial I/R-induced microvascular injury, suggesting that it may play an important role in the pathogenesis of this condition.
Furthermore, we developed a nomogram incorporating the 4 biomarker genes. This integrated model demonstrated a high AUC together with excellent calibration, indicating good diagnostic performance and reliability for detecting myocardial I/R injury. Implementation of this tool in clinical practice may improve the early identification of microvascular complications associated with myocardial I/R.
Further GSEA suggested that the pathogenesis of myocardial I/R may be associated with disturbances in citric acid cycle metabolism involving the 4 diagnostic genes. Substantial evidence indicates that myocardial I/R is closely associated with abnormalities in glucose and lipid metabolism.39 These findings suggest that the 4 hub genes may participate in metabolic regulation during myocardial I/R and provide new insights into potential therapeutic targets. Myocardial I/R is also closely associated with immune regulation. During myocardial I/R injury, infiltration of immune cells, including macrophages and T lymphocytes, contributes to the inflammatory response.40 In the early phase of reperfusion, activated neutrophils markedly increase reactive oxygen species (ROS) production, thereby exacerbating cardiomyocyte necrosis.41 Significant differences in immune cell abundance were observed between the 2 groups, and the expression of the biomarker genes was closely associated with the infiltration of multiple immune cell populations, including T cells, B cells, activated DCs, natural killer (NK) cells, and, in particular, macrophages. Macrophages, which play a pivotal role in the immune response to myocardial I/R, are commonly classified into M0, M1, and M2 subtypes. M2 macrophages exhibit anti-inflammatory and tissue-protective properties, whereas M1 macrophages promote inflammation and tissue injury.42 These findings suggest that the 4 hub genes may play important roles in immune regulation during myocardial I/R injury.
Moreover, an unsupervised clustering approach identified 2 molecular subtypes based on the expression profiles of 7 autophagy-related regulators. Functional enrichment analysis revealed that the C2 subtype was associated with oxidative phosphorylation, ROS generation, and the mitochondrial respiratory chain complex, all of which are involved in the regulation of autophagy.43, 44 These findings suggest that the C2 subtype may be closely associated with autophagy dysregulation, which could have important implications for the early detection and treatment of myocardial I/R injury. Given the poor prognosis associated with the no-reflow phenomenon resulting from myocardial microvascular injury, the upregulation of the 4 autophagy-related hub genes identified in this study may represent potential therapeutic targets. These findings provide new insights into the molecular mechanisms of autophagy in myocardial I/R and may contribute to the development of improved strategies for the early diagnosis and treatment of this condition, ultimately improving patient outcomes.
Limitations of the study
However, this study has several limitations. First, evaluation of the therapeutic efficacy of c-Myc inhibition in animal models that more closely mimic human cardiac pathophysiology is needed. Second, the data analyzed in this study were obtained from the GEO database, and suitable human datasets were not available. Furthermore, the expression profiles of the 4 key genes were validated only in animal models and cell-based experiments and therefore require further validation in human cohorts. Future validation should include prospective studies evaluating serum biomarkers using enzyme-linked immunosorbent assay (ELISA) or Luminex assays in relation to cardiac magnetic resonance imaging (cMRI)-quantified microvascular obstruction (MVO) and the no-reflow phenomenon after percutaneous coronary intervention (PCI) in patients with ST-segment elevation myocardial infarction (STEMI). Such studies would establish the clinical utility of these biomarkers for predicting the no-reflow phenomenon and guiding adjuvant therapies. In addition, further investigation of the molecular mechanisms and signaling pathways involving these genes in myocardial I/R-induced microvascular injury is warranted.
Conclusions
This study is the first to identify autophagy-related biomarkers (Myc, Casp4, Cdkn1a, and Rgs19) associated with microvascular injury in cardiac I/R using integrated machine learning and experimental validation. We identified c-Myc as a pivotal regulator linking autophagic dysregulation to endothelial injury, with c-Myc knockout demonstrating significant therapeutic potential. These findings highlight c-Myc inhibition as a novel treat-to-target therapeutic strategy for reperfusion injury, warranting clinical validation in STEMI cohorts and the development of point-of-care diagnostics. Our findings may also inform the future development of biomarker-guided strategies for the early detection and therapeutic modulation of cardiac microvascular I/R injury.
Supplementary data
The Supplementary materials are available at https://doi.org/10.5281/zenodo.22122481. The package includes the following files:
Supplementary Fig. 1. Cardiac I/R establishment and microvascular injury evaluation.
Supplementary Fig. 2. Bioinformatic analysis of GSE168610: PCA, differential expression, and autophagy gene overlap in I/R model.
Supplementary Fig. 3. GO and KEGG pathway analysis for distinct I/R subgroup.
Supplementary Fig. 4. Immunohistochemical (IHC) staining of c-Myc and Caspase 4 in myocardial I/R.
Supplementary Fig. 5. Changes in mRNA and protein expression levels of the hub biomarkers in the H/R mode.
Supplementary Fig. 6. Observation of cellular autophagosome.
Supplementary Table 1. Specific information of datasets.
Supplementary Table 2. The primer sequences used for RT-qPCR.
Supplementary Table 3. Validation of key gene expression in the dataset GSE168610.
Supplementary Table 4. Power analysis of endpoint assays in myocardial I/R model.
Supplementary Table 5. Assessment of parametric test assumptions and selection of statistical methods for genes expression and TUNEL fluorescence intensity analysis.
Supplementary Table 6. Mann–Whitney U tests performed to compare 4 cardiac and functional parameters between sham and I/R groups (Supplementary Fig. 1B–E).
Data Availability Statement
The datasets supporting the findings of the current study are openly available in Zenodo at https://doi.org/10.5281/zenodo.17137494.
AI and AI-assisted technologies usage
Not applicable.