Abstract
Background. Hip osteoarthritis (HOA) is one of the leading causes of musculoskeletal disability worldwide, yet its etiology remains incompletely understood. Its pathogenesis is multifactorial, involving systemic factors and biomechanical alterations of the hip joint that trigger degenerative changes.
Objectives. The aim of this study was to identify the most informative radiographic views and the key acetabular and proximal femoral parameters for detecting structural abnormalities of the hip joint that may contribute to the development of HOA.
Materials and methods. This observational case-control study included 156 patients older than 55 years who underwent total hip arthroplasty for HOA (osteoarthritis (OA) group) and 61 age-matched controls without clinical HOA, recruited from a single center between 2019 and 2022. Patient demographics, clinical history, and hip-specific functional scores were collected. Standardized anteroposterior (AP), frog-leg lateral (LL), and Dunn 45° radiographs were obtained, and multiple radiographic parameters were measured.
Results. Asymptomatic contralateral hips in patients with OA had significantly more cam-type deformities (higher alpha angles, lower head–neck offset ratios, and a higher prevalence of pistol-grip deformity) than those in the control group (p < 0.001). In contrast, pincer-type features were more common in the control group. Logistic regression analysis identified higher alpha angles, greater femoral neck diameter, and lower head–neck offset ratios as predictors of OA, whereas a larger femoral head diameter was identified as a protective factor (model area under the curve (AUC) = 0.90). Bone quality was superior in the control group, with longer femoral neck axis lengths and higher Singh indices (p < 0.001).
Conclusions. Radiographic markers of cam-type femoroacetabular impingement (FAI) are significantly more prevalent in patients with HOA and may serve as early indicators of disease risk. Dunn and LL views are optimal for detecting these abnormalities. A larger femoral head diameter, as measured on both AP and LL radiographic views, appears to be a protective factor against the development of HOA. Understanding these morphological differences may facilitate earlier diagnosis and support preventive strategies for HOA.
Key words: osteoarthritis, impingement, hip joint shape, radiographic measurements, Dunn view
Background
Hip osteoarthritis (HOA) is a degenerative joint disease and one of the leading causes of musculoskeletal disability in developed countries. Although osteoarthritis (OA) can affect any joint in the body, it most commonly affects the knee and hip joints.1 Hip osteoarthritis has a variable prevalence worldwide, ranging from 1.20% in Africa to 12.59% in Europe.2 Currently, the onset of HOA cannot be reliably predicted, nor can its progression be completely prevented.
Hip osteoarthritis is classified as either primary (idiopathic), accounting for approx. 80% of all HOA cases, or secondary, resulting from conditions such as inflammatory, infectious, or metabolic diseases, trauma, osteonecrosis, or developmental abnormalities of the hip.3 The pathogenesis of HOA is not yet fully understood. It is widely accepted that HOA is a multifactorial disease resulting from the interaction of systemic risk factors, such as age, ethnicity, sex, heredity, and obesity, with local factors related to hip joint biomechanics. Systemic factors increase susceptibility to OA, whereas local biomechanical alterations of the hip joint may trigger a cascade of pathological changes that ultimately lead to the development of HOA.4, 5
Since the pathological process in patients with HOA usually does not involve other joints, it was hypothesized as early as the 1970s that many cases previously considered primary OA are, in fact, secondary to subtle morphological or structural abnormalities of the proximal femur and/or the acetabulum.6, 7 Femoroacetabular impingement (FAI) is now increasingly recognized as a major contributor to HOA.7, 8 It is classified into cam, pincer, and mixed types. Cam-type FAI is characterized by an aspherical femoral head that abrades the acetabular cartilage and labrum, resulting in cartilage damage, labral tears, chronic inflammation at the site of injury, and ultimately the development of HOA.9 In pincer-type FAI, the femoral head is excessively covered by the acetabular rim, resulting in abnormal contact between the acetabular rim and the femoral head–neck junction. This leads to labral tears, progressive ossification, cartilage degeneration, and ultimately OA.10 Murray’s epidemiological study suggested that 25–40% of HOA cases are associated with mild acetabular dysplasia.11 In dysplasia, a shallow and more vertically oriented acetabulum reduces femoral head coverage and increases mechanical stress on the cartilage and labrum, thereby promoting degeneration and the development of OA.12
Early detection of these morphological abnormalities is essential for timely preventive or surgical intervention. Despite the availability of advanced imaging modalities, such as magnetic resonance imaging (MRI) and computed tomography (CT), conventional pelvic and hip radiographs remain the primary diagnostic tool for detecting HOA.13 Several radiographic measurements have been proposed to identify structural abnormalities; however, their reliability remains a matter of debate.14
Objectives
The aim of this study was to determine which radiographic views and specific acetabular and proximal femoral parameters are most effective for detecting structural hip abnormalities associated with the development of HOA.
Materials and methods
This observational case-control study was conducted in accordance with the Declaration of Helsinki, and the study protocol was approved by the National Central Medical Ethics Committee of Latvia (Riga, Latvia; approval No. 4/21-02-17). All participants provided written informed consent before enrollment. Patients who underwent total hip arthroplasty (THA) for HOA between 2019 and 2022 were included in the OA group, whereas volunteers or patients hospitalized for nonarthritic conditions at the same center were included in the control group. The following data were collected for each participant: sex, age, body mass index (BMI), history of sports participation, smoking status, family history of HOA, duration of hip pain (in years), pain intensity assessed using the Numeric Rating Scale (at rest, during walking, and after walking 500 m), and hip function assessed using the American Academy of Orthopedic Surgeons (AAOS) Hip and Knee Questionnaire.
All participants underwent calibrated radiographic imaging in 3 projections: anteroposterior (AP) pelvis, frog-leg lateral (LL), and Dunn 45° views. The severity of OA was assessed using the Tönnis classification: Grade 0 – no radiographic signs of OA; Grade I – mild joint space narrowing, marginal osteophyte formation, and slight subchondral sclerosis; Grade II – subchondral cysts, further joint space narrowing, and moderate loss of femoral head sphericity; and Grade III – large subchondral cysts, obliteration of the joint space, severe deformity, and avascular necrosis.15
The more widely used Kellgren–Lawrence classification was originally developed to grade the severity of knee OA and was subsequently applied to other joints. In contrast, the Tönnis classification was specifically designed for the hip, aligns with hip morphology, and more accurately reflects the radiographic features of hip osteoarthritis on AP pelvic radiographs. Therefore, given our focus on hip pathomorphology, we used the Tönnis classification in this study.
For the OA group, the nonoperated hip was evaluated clinically and radiographically as a surrogate for the predeformity status of the operated hip. Inclusion criteria for the OA group were: 1) planned unilateral THA for primary osteoarthritis; 2) Tönnis grade II or lower OA in the contralateral study hip; 3) no evidence of secondary causes of OA (e.g., posttraumatic osteoarthritis, rheumatic disease, avascular necrosis of the femoral head, or developmental hip dysplasia according to the Crowe classification16); and 4) age older than 55 years. Patients with Tönnis grade III OA of the nonoperated hip were excluded because severe OA is associated with marked joint deformity, making reliable radiographic assessment of morphological parameters impossible. Inclusion criteria for the control group were: 1) no history of hip pain; 2) no radiographic signs of HOA on pelvic radiographs; and 3) age older than 55 years. The age criterion was based on epidemiological data indicating that the incidence of HOA increases after 55 years of age, with a decline after 65 years.17 Individuals younger than 55 years without symptoms or radiographic signs of HOA are less likely to develop the disease.
In total, 156 patients were included in the OA group after the exclusion of 32 patients with bilateral Tönnis grade III HOA, and 61 participants were included in the control group after the exclusion of 7 individuals with radiographic evidence of HOA.
To evaluate hip joint anatomy in multiple planes, pelvic and hip radiographs were obtained in 3 projections. An AP pelvic radiograph was acquired with the patient in the supine position and both legs internally rotated by 15°. For the lateral projection, the LL view was obtained with the patient in the supine position, the knee flexed to 30°, and the hip abducted to 45°, with the heel resting against the medial aspect of the contralateral knee.18 The Dunn 45° view was obtained with the patient in the supine position, the affected hip flexed to 45°, abducted by 20°, and maintained in a neutral rotational position.4 In the OA group, radiographic parameters were analyzed in the nonoperated hip because it was considered to best reflect the morphology of the operated hip before the development of advanced osteoarthritic changes. In the control group, the hip selected for analysis was chosen by randomization. All radiographs were independently evaluated by 2 specialists (a radiologist and an orthopedic surgeon). In cases of disagreement or uncertainty (e.g., regarding the presence of a radiographic feature), the images were reviewed jointly until a consensus was reached. This procedure ensured consistency and minimized measurement variability. Using AGFA IMPAX 6 PACS Client v. 6.6 software (Agfa HealthCare, Mortsel, Belgium), the following parameters and radiographic features were assessed on AP pelvic radiographs: hip axis length, femoral neck axis length, femoral head diameter, femoral neck diameter, neck–shaft angle (NSA), femoral shaft width, acetabular depth, acetabular index (AI), acetabular morphology (normal, coxa profunda, or acetabular protrusion), center-edge angle, crossover sign, alpha (α) angle, pistol-grip deformity, and bone quality assessed using the Singh Index and Cortical Thickness Index (CTI). On Dunn and LL radiographs, femoral head diameter, femoral neck diameter, alpha angle, and the head–neck offset ratio were measured. Statistical analyses were performed using Jamovi software v. 2.5 (https://www.jamovi.org).
Radiological parameters
Hip axis and femoral neck axis length
Hip axis length was measured on AP radiographs as the distance from the inner pelvic brim to the lateral edge of the greater trochanter, measured along the femoral neck axis.19 Femoral neck axis length was defined as the distance from the lateral base of the greater trochanter to the apex of the femoral head on AP radiographs (Figure 1).
Femoral head and neck diameters
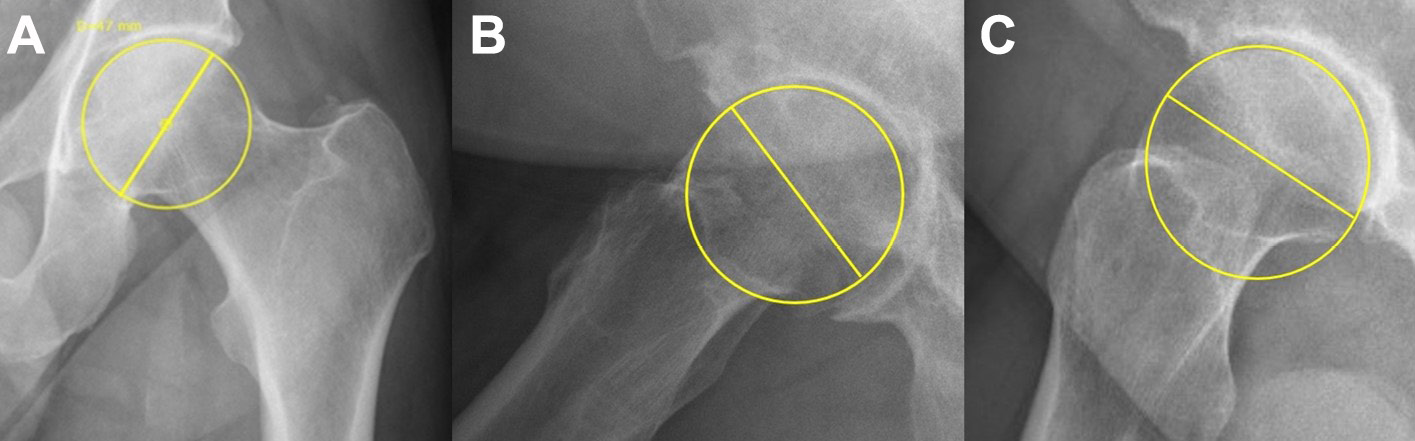
Femoral head and neck diameters were measured on AP, LL, and Dunn 45° radiographs to compare proximal femoral morphology between the study groups (Figure 2, Figure 3). Femoral neck diameter was defined as the minimum width of the femoral neck.
Alpha angle and head–neck offset ratio
The alpha angle was measured on all 3 radiographic views using a best-fit circle of the femoral head. It was defined as the angle between the femoral neck axis and a line extending from the center of the femoral head to the point where the femoral head–neck junction extends beyond the contour of the best-fit circle11 (Figure 4). An alpha angle greater than 50° was considered abnormal.
Femoral head–neck offset ratio
The femoral head–neck offset ratio was measured on LL and Dunn 45° radiographs using 3 parallel lines11 (Figure 5). The first line was drawn longitudinally along the axis of the femoral neck. The 2nd and 3rd lines were drawn parallel to the 1st line: one tangential to the anterior (or posterior) aspect of the femoral neck and the other tangential to the corresponding aspect of the femoral head. The offset was defined as the perpendicular distance between the 2nd and 3rd lines. The head–neck offset ratio was calculated by dividing this distance by the femoral head diameter. This measurement reflects the anterior concavity of the femoral head–neck junction and helps identify cam-type deformities.
Pistol-grip deformity
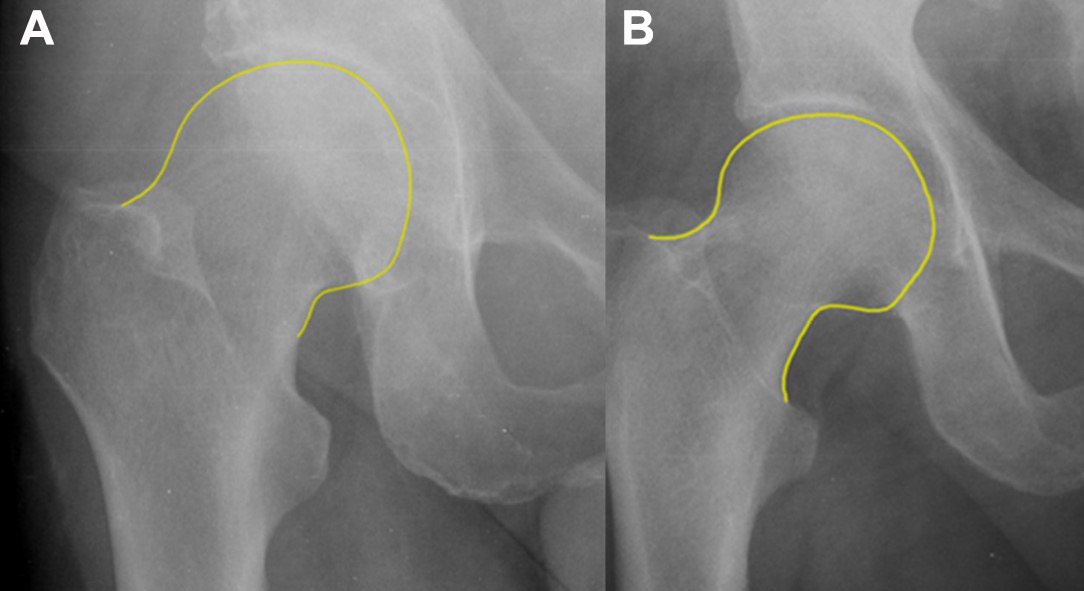
The presence of a pistol-grip deformity on AP radiographs indicates an abnormal morphology of the proximal femur, in which the femoral head–neck junction loses its normal concavity and assumes the appearance of a pistol grip.20 (Figure 6).
Acetabular morphology
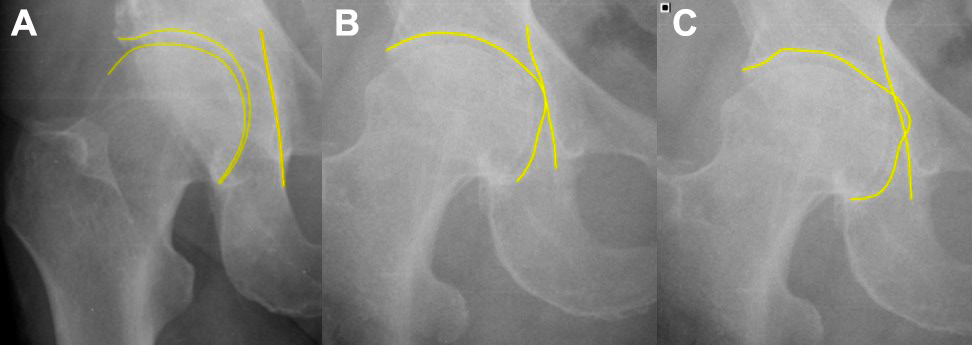
On an AP pelvic radiograph, acetabular morphology was classified by evaluating the relationship between the floor of the acetabular fossa and the ilioischial line.13 A normal acetabulum was defined when the acetabular fossa was located lateral to the ilioischial line; coxa profunda was defined when the acetabular fossa was in contact with the ilioischial line; and acetabular protrusion was defined when the acetabular fossa extended medial to the ilioischial line (Figure 7). Although the severity of acetabular protrusion can be graded using the Sotelo–Garza and Charnley classification, this assessment was beyond the scope of the present study.
Acetabular depth and acetabular index
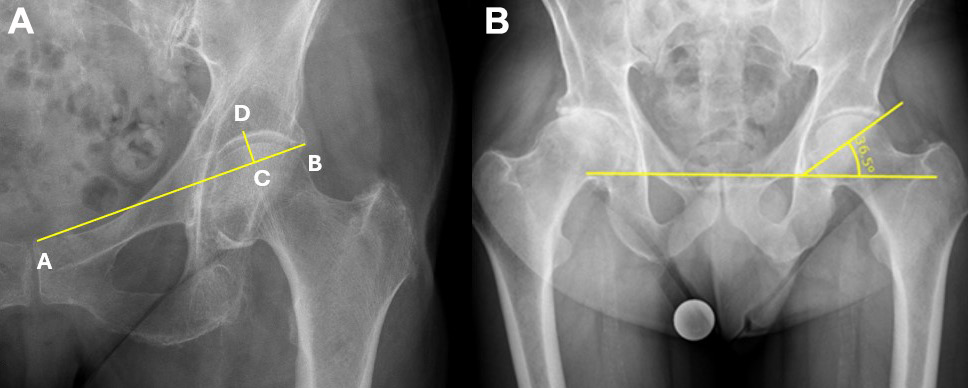
To evaluate acetabular morphology and detect subtle features of hip dysplasia, acetabular depth and the AI were measured on AP pelvic radiographs (Figure 8). First, a reference line (AB) was drawn between the superior margin of the pubic symphysis and the lateral edge of the acetabulum. Acetabular depth was defined as the perpendicular distance from this reference line to the deepest point of the acetabular fossa (CD). The AI was calculated as the angle between a line extending from the lateral edge of the acetabulum to the inferior margin of the teardrop and a horizontal reference line.21 Values greater than 42° were considered indicative of hip dysplasia.
Center-edge angle
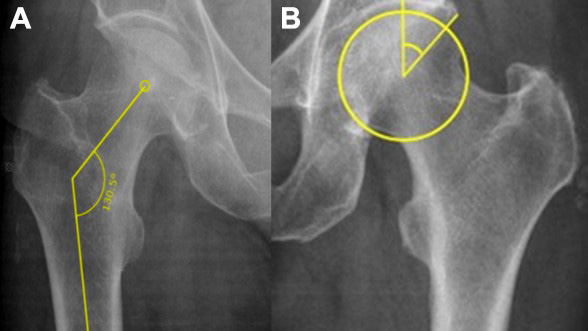
The center-edge angle (CEA) quantifies acetabular coverage of the femoral head on AP hip radiographs. It is measured using 2 lines originating from the center of the femoral head: one extending vertically along the longitudinal axis of the pelvis and the other extending to the lateral edge of the acetabular rim (Figure 9). A normal CEA ranges from 25° to 39°. Hip dysplasia is indicated by a CEA of less than 25°, whereas acetabular overcoverage is indicated by a CEA greater than 39° (Figure 9A).
Neck–shaft angle
The NSA was defined as the angle between the longitudinal axes of the femoral shaft and femoral neck on AP radiographs. The axes were drawn through the midpoints of the femoral shaft and the femoral head–neck axis13 (Figure 9B). The normal femoral NSA ranges from 120° to 140°. Values greater than 140° indicate coxa valga, whereas values less than 120° indicate coxa vara.
Crossover sign
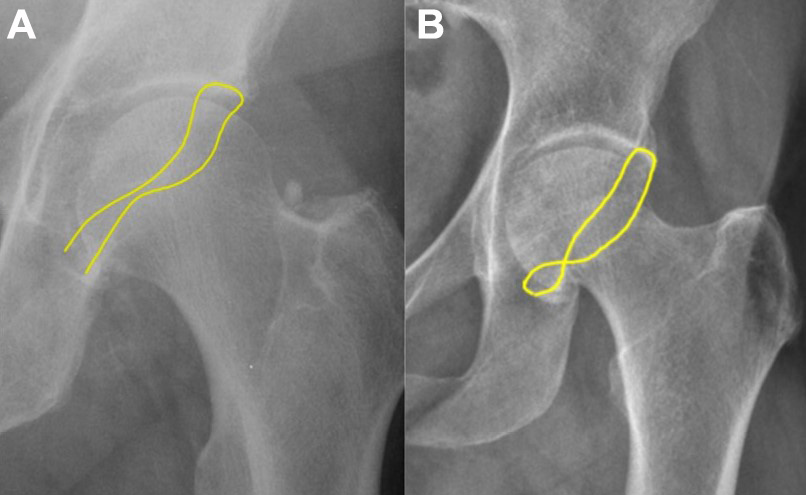
The crossover sign was identified on AP radiographs when the outlines of the anterior and posterior acetabular walls intersected, creating a figure-of-eight appearance indicative of acetabular retroversion and pincer-type femoroacetabular impingement (FAI).13 (Figure 10)
Bone quality and cortical indices
Proximal femoral bone quality was evaluated on AP pelvic radiographs using the Singh Index, the CTI, and measurements of femoral shaft width. The Singh Index is a simple radiographic classification system for assessing osteoporosis on AP pelvic radiographs.22 It evaluates the visibility of trabecular patterns in the femoral neck and proximal femur to estimate bone quality. The index ranges from grade I (loss of nearly all trabecular patterns, indicating severe osteoporosis) to grade VI (all trabecular groups are visible, indicating normal bone structure).
Femoral shaft width was measured 10 cm below the midpoint of the lesser trochanter on AP pelvic radiographs. The CTI was calculated at the same level using the following formula: (femoral shaft width − intramedullary canal width)/femoral shaft width. The CTI reflects the relative thickness of the cortical bone of the femoral shaft.
Statistical analyses
Data distribution was assessed by visual inspection of normal Q–Q plots and the Shapiro–Wilk test. Homogeneity of variances was assessed using Levene’s test. Depending on data distribution and variance homogeneity, the independent-samples t test, Mann–Whitney U test, Welch’s t test, χ2 test of homogeneity, or Fisher–Freeman–Halton test was used to compare demographic, clinical, and radiographic characteristics between the control and OA groups. Binary logistic regression was performed to identify demographic and clinical factors (Table 1) associated with the presence or absence of OA. A best-subset selection approach was used to construct the regression model. All possible combinations of predictor variables were generated and compared using the Akaike Information Criterion (AIC) to identify the model that best balanced explanatory power and parsimony. The model with the lowest AIC value was selected as the final model for interpretation.
The final regression model was validated by assessing the key assumptions of logistic regression. First, the Box–Tidwell procedure was used to test the linearity of the relationship between continuous independent variables and the logit of the dependent variable. No significant violations were detected (all p > 0.05), confirming that this assumption was met. Second, variance inflation factors (VIFs) were calculated for all independent variables to assess multicollinearity; all VIF values were <5. Additionally, receiver operating characteristic (ROC) curve analysis was performed to evaluate the discriminative performance of the model, with the area under the curve (AUC) used as a measure of classification accuracy. AUC values greater than 0.70 were interpreted as indicating good discrimination between patients with and without OA. Youden’s index was used to identify the optimal cutoff point. All statistical analyses were conducted using Jamovi software (v. 2.5) (https://www.jamovi.org). Statistical significance was set at p < 0.05.
Results
Demographic and clinical characteristics of the study population are summarized in Table 1. A total of 217 participants were included, comprising 61 individuals in the control group and 156 in the OA group. The proportion of male participants was higher in the OA group (35.9%) than in the control group (21.3%), whereas women predominated in both groups (64.1% and 78.7%, respectively). Mean age did not differ significantly between the groups (OA group: 65.8 years; control group: 65.3 years; p = 0.708). The prevalence of comorbidities (type 2 diabetes, thyroid disorders, and gout) was similar between the groups (p = 0.802), as was mean body mass index (BMI) (30.6 vs 30.4 kg/m2; p = 0.915). Smoking prevalence was higher in the OA group (28.9%) than in the control group (20.0%), although this difference was not statistically significant (p = 0.215). Among smokers, the median duration of smoking did not differ significantly between the groups. Clinically, the OA group reported significantly greater pain and functional impairment. Median pain scores were higher under all conditions − at rest, during movement, and after walking − for both hips (p < 0.001). The mean AAOS Hip Questionnaire score was significantly higher in the OA group (34.9) than in the control group (20.1; p < 0.001), indicating greater functional impairment.
The distribution of the evaluated hip side was similar between the groups. In the OA group, the mean duration of hip pain before arthroplasty was 4.2 ±2.9 years. The median Tönnis grade was 3 for the hip scheduled for arthroplasty and 1 for the contralateral study hip. No significant difference between the groups was found in the family history of OA (p = 0.443). In the OA group, asymptomatic contralateral hips demonstrated a significantly higher prevalence of cam-type deformities than those in the control group. Detailed findings are presented in Table 2. An alpha angle >50°, used as the diagnostic threshold for cam-type FAI, was observed more frequently in the OA group across all 3 radiographic projections: AP, LL, and Dunn 45° views. The mean alpha angle in the AP view was significantly greater in the OA group compared to controls (60.1° vs 52.8°, p < 0.001), with a moderately strong effect size (Cohen’s d = 0.77). In the Dunn and LL projections, the effect sizes were even stronger (Dunn: 53.5° vs 46.6°, Cohen’s d = 0.95; LL: 58.4° vs 47.9°, Cohen’s d = 1.27; both p < 0.001), indicating that these views most effectively captured cam-type abnormalities. Across all projections, the presence of an alpha angle >50° was strongly associated with the OA group (all p < 0.001; Cramér’s V > 0.35).
Head–neck offset ratios were significantly lower in the OA group than in the control group on both Dunn (p < 0.001) and LL (p = 0.044) radiographs, further supporting the higher prevalence of cam-type morphology in the OA group. In addition, pistol-grip deformity was observed more frequently in the OA group (26.3%) than in the control group (3.3%), with a moderate association (Cramér’s V = 0.26, p < 0.001).
Femoral head and neck diameters were similar between the groups in the LL and Dunn projections. However, the AP view revealed a slightly larger mean femoral head diameter in the control group than in the OA group (46.3 mm vs 44.9 mm; p = 0.034). Femoral neck axis length was significantly greater in the control group than in the OA group (97.9 mm vs 93.2 mm; p < 0.001).
A binary logistic regression model evaluating proximal femoral morphology was statistically significant (χ2(4) = 48.9, p < 0.001) and explained 60% of the variance in OA status (Nagelkerke’s R2 = 0.60). The model correctly classified 82% of cases (AUC = 0.90). A larger alpha angle on the LL view (B = 0.19, p < 0.001, odds ratio (OR) = 1.21), greater femoral neck diameter on the AP view (B = 0.26, p = 0.046, OR = 1.29), and a head–neck offset ratio <0.17 on the Dunn view (B = 1.33, p = 0.037, OR = 3.78) were independently associated with an increased likelihood of OA, whereas a larger femoral head diameter on the LL view (B = −0.33, p = 0.005, OR = 0.72) was independently associated with a lower likelihood of OA (Supplementary Table 1).
These results indicate that a 1° increase in the alpha angle on the LL view was associated with a 21% increase in the odds of OA (95% confidence interval (95% CI): 10–34%). Similarly, a 1-mm increase in femoral neck diameter on the AP view was associated with a 30% increase in the odds of OA (95% CI: 0.5–68%). Patients with a head–neck offset ratio <0.17 on the Dunn view had 3.78-fold higher odds of OA than those with a head–neck offset ratio ≥0.17 (95% CI: 1.09–13.18). In contrast, a 1-mm increase in femoral head diameter on the LL view was associated with a 28% reduction in the odds of OA (95% CI: 9–43%).
Youden’s index identified optimal cutoff values of 52.6 for the alpha angle on the LL view and 29.5 mm for femoral neck diameter on the AP view, above which the likelihood of OA was increased. In contrast, a femoral head diameter of less than 43.5 mm on the LL view was associated with an increased likelihood of OA.
The ROC analysis showed that each 1° increase in the alpha angle on the LL view was associated with a 21% increase in the odds of OA. Furthermore, individuals with a head–neck offset ratio <0.17 on the Dunn view had 3.78-fold higher odds of OA (95% CI: 1.09–13.18) than those with a head–neck offset ratio ≥0.17.
Evaluation of acetabular morphology showed that acetabular protrusion and coxa profunda were more common in the control group on AP radiographs (p < 0.001), both representing features of pincer-type FAI. Acetabular depth and acetabular index, indicative of pincer morphology, were also significantly greater in the control group (p < 0.001 and p = 0.029, respectively). Although the crossover sign, a marker of acetabular retroversion, was more prevalent in the OA group, this difference did not reach statistical significance (p = 0.130).
The mean CEA did not differ significantly between the groups (38.1° in the OA group vs 36.9° in the control group, p = 0.419), nor did the distribution of CEA categories (normal, dysplasia, and overcoverage) (p = 0.055).
The NSA was significantly greater in the OA group than in the control group (130.1° vs 126.7°, p < 0.001), although the overall distribution of NSA categories (normal, coxa vara, and coxa valga) did not differ significantly (p = 0.066).
Bone quality assessment showed a significantly higher Singh Index in the control group (median: 4 vs 3; p < 0.001), indicating better trabecular bone structure. Femoral shaft width was also greater in the control group (31.9 mm vs 29.9 mm; p < 0.001). Despite this, the CTI was slightly but significantly higher in the OA group (0.61 vs 0.59; p = 0.032).
Discussion
Patients undergoing THA have been reported to be at an increased risk of developing HOA in the contralateral hip compared with the general population.23 A prevailing hypothesis proposes that primary HOA arises from structural and/or morphological abnormalities of the proximal femur and acetabulum.6 Based on this hypothesis, we evaluated patients at increased risk of developing HOA to determine the prevalence of such abnormalities.
In our analysis, although female sex has historically been considered a potential risk factor for OA and was evaluated during model development, it was not retained in the final logistic regression model. This finding indicates that sex did not significantly differentiate the OA and control groups, whereas morphological parameters emerged as the primary predictors of OA. In the present study, radiographic features of cam-type FAI were more prevalent in the OA group. Characteristic features of cam-type FAI, including an alpha angle >50°, pistol-grip deformity, a reduced head–neck offset ratio, and a greater femoral neck diameter on AP radiographs, were observed. These findings suggest that radiographic markers of cam-type FAI can be identified in patients at increased risk of developing HOA, offering the potential for early detection before the onset of osteoarthritic changes. In particular, the Dunn and LL views proved to be the most informative for detecting these morphological abnormalities.
Our results are consistent with those of Şahin et al.24 and Tang et al.,25 who also reported that both the alpha angle and the head–neck offset ratio identified a higher prevalence of proximal femoral abnormalities in a comparable population. The larger mean alpha angles observed on the Dunn and LL views, compared with the AP view, further support the concept that cam-type FAI typically involves the anterosuperior region of the femoral head–neck junction, which is best visualized on the Dunn view.26
Previous studies have suggested that repetitive high-magnitude mechanical loading during skeletal development, particularly in athletes, may contribute to the development of cam-type deformities.27, 28 However, in our cohort, the proportion of participants who engaged in organized sports for more than 1 year before the age of 18 did not differ significantly between the OA and control groups (25.3% vs 26.0%, p = 0.954). Likewise, although a positive family history of HOA was more common in the OA group, the difference was not statistically significant (p = 0.443). These findings suggest that additional or interacting risk factors may contribute to the pathogenesis of FAI and HOA.
Radiographic features of pincer-type FAI were less definitive. Indicators such as acetabular protrusion, coxa profunda, and greater acetabular depth were more common in the control group on AP radiographs, suggesting pincer morphology. Although the mean CEA remained within the normal range in both groups, a higher proportion of patients with a CEA > 39° and a positive crossover sign − features indicative of acetabular retroversion and pincer-type FAI − was observed in the OA group; however, these differences were not statistically significant.
The literature presents conflicting evidence regarding the relationship between pincer-type FAI and HOA. Although some population-based studies have suggested an association,7 prospective cohort studies have failed to confirm a causal relationship29 and have reported a high prevalence of pincer-type features in asymptomatic individuals. These findings are consistent with our results, in which several radiographic features of pincer-type FAI were more common in the control group. This may indicate either a potential protective role of pincer morphology against HOA or that additional contributing factors are required to trigger osteoarthritic changes.
Patients in the OA group demonstrated a thicker femoral cortex, reflected by higher CTI values despite a narrower femoral shaft. The increased CTI likely represents an adaptive response to elevated mechanical loading associated with early-stage OA, reflecting compensatory strengthening of the cortical bone. This interpretation is consistent with previous findings suggesting that increased cortical thickness may result from mechanical adaptation to abnormal loading conditions.30
Despite excluding patients with overt femoral head subluxation due to hip dysplasia, 7.7% of patients in the OA group exhibited a CEA < 25°, and 1.3% had an AI >42°, indicating the presence of subtle hip dysplasia. These findings reinforce the concept that even mild dysplasia, characterized by insufficient femoral head coverage, contributes to abnormal joint loading and accelerates cartilage degeneration, thereby promoting the development of HOA.31
Contrary to previous studies linking femoral shaft widening with advanced HOA, our findings demonstrated narrower femoral shafts in the OA group. This may reflect disease-specific bone remodeling or individual biomechanical adaptations, such as localized cortical thickening and proximal femoral shaft narrowing. Furthermore, femurs in the OA group exhibited a more valgus alignment, as evidenced by a greater NSA and reduced apparent bone density, further supporting the role of altered biomechanics in the development of radiographic changes associated with HOA.
Results of this study show that an increased femoral neck diameter in AP projection (p = 0.046, OR = 1.29) was positively associated with OA. Thicker femoral necks may contribute to the development of cam-type FAI, subsequently leading to the onset of HOA. Conversely, femoral head diameter in LL projection (p = 0.005, OR = 0.72) was negatively associated with OA, and control group patients had larger femoral heads in the AP view (p = 0.034), supporting previous findings by Heppenstall et al.,32 who identified a larger femoral head as a protective factor against HOA, potentially due to an increased articular surface area that reduces contact stress.
Youden’s index analysis identified an optimal cutoff of 52.6° for the alpha angle in the LL projection and 29.5 mm for the femoral neck diameter in the AP projection, both indicating a higher risk of OA in patients exceeding these values. Conversely, a femoral head diameter below 43.5 mm in the LL projection was associated with an increased risk of OA. These 3 radiographic parameters may be useful in future studies to validate their effectiveness in identifying patients at high risk for developing HOA. Although CT and MRI are the gold standards for assessing such deformities as cam and pincer FAI, their use as routine screening tools is limited by factors such as cost, accessibility, and radiation exposure (in the case of CT).
Anteroposterior and LL hip radiographs are standard imaging studies for patients presenting with hip pain. This study demonstrates that morphological abnormalities associated with an increased risk of HOA can be reliably identified using these standard radiographic views. In addition, the Dunn view proved particularly effective for measuring the alpha angle and head–neck offset ratio, providing additional diagnostic value for the detection of cam-type FAI. From a clinical perspective, these findings support the inclusion of the Dunn view when evaluating patients with hip pain, as it facilitates earlier detection of cam-type deformities that may predispose patients to HOA. Although routine population screening with radiographs is not currently justified, targeted imaging of individuals at increased risk (e.g., those with a family history of HOA or previous hip injury) may facilitate earlier identification of structural risk factors. Such an approach may support timely interventions before irreversible osteoarthritic changes develop.
Limitations of the study
This study has several limitations. Its observational case-control design prevents causal inference, and recruitment from a single center may limit generalizability. Although standardized protocols were used, radiographic measurements may still involve variability. Although all radiographs were jointly reviewed by a radiologist and an orthopedic surgeon to ensure consistency, inter-rater reliability was not formally assessed. Lastly, the cross-sectional design limits insight into disease progression. Future multicenter, longitudinal studies are needed.
Conclusions
This study demonstrated that morphological abnormalities associated with cam-type FAI are more frequently observed in patients at risk of developing HOA. Increased femoral neck diameter, a reduced head–neck offset ratio, and increased alpha angles, particularly when assessed on Dunn and LL radiographic views, were significantly associated with osteoarthritic changes. Radiographic features of pincer-type femoroacetabular impingement showed a less consistent association with OA, with some features being more prevalent in the control group, suggesting that pincer morphology alone may not be sufficient to initiate degenerative changes without additional contributing factors. Subtle indicators of hip dysplasia, greater valgus alignment, and increased cortical bone thickness were also identified in patients with early-stage OA, supporting the role of altered joint biomechanics in disease development. A larger femoral head diameter, as measured on both AP and LL radiographic views, appears to be a protective factor against the development of HOA. A larger femoral head provides a greater articular surface area, which helps distribute mechanical loads more evenly across the joint, thereby reducing peak contact stresses on the articular cartilage. This mechanical advantage may delay the onset of cartilage degeneration and subsequent joint space narrowing.
Our findings emphasize the value of standard AP and LL hip radiographs, supplemented by the Dunn view, for identifying early structural abnormalities associated with an increased risk of HOA. Recognition of these morphological patterns may facilitate earlier risk stratification and timely intervention before substantial cartilage degeneration occurs.
Prevention of HOA involves reducing risk factors and slowing disease progression once risk factors or early pathological changes are present. Preventive strategies include early detection of structural abnormalities, identification of additional risk factors, prevention of recurrent joint injury, and preservation of long-term joint health. Risk factors may be systemic (e.g., sex, adiposity, and genetic predisposition) or joint-specific (e.g., hip morphology and previous injury). Although nonmodifiable risk factors help identify individuals at increased risk, modifiable factors may be targeted at appropriate stages of life – e.g., preventing knee injuries during adolescence or childhood obesity to reduce the risk of OA in adulthood. Prevention of posttraumatic OA focuses on minimizing the initial injury and optimizing recovery.
Our findings indicate that hip deformities, including cam morphology and acetabular dysplasia, are strongly associated with the development of HOA. Early detection and treatment of developmental dysplasia of the hip through neonatal screening and appropriate orthotic management may promote normal hip development. Clinicians should consider incorporating the Dunn view in addition to standard AP and LL radiographs when evaluating patients with hip pain or suspected FAI. In selected patients with symptomatic FAI, hip arthroscopy – including osteoplasty of the femoral head–neck junction to restore head–neck offset, debridement of damaged cartilage, and repair of labral tears – may provide greater short-term symptomatic improvement than physiotherapy, although its long-term effect on preventing OA remains uncertain. Occupational loading (e.g., farming and construction work) and participation in high-impact sports (e.g., soccer, hockey, and weightlifting) are also associated with an increased risk of HOA, partly through the development of cam deformities during adolescence.33 Modifying training loads in high-risk activities may therefore represent an important preventive strategy. Because multiple risk factors may act synergistically, early identification of coexisting risk factors should be incorporated into preventive strategies. Further studies are needed to clarify how anatomical variations, mechanical loading, and genetic factors interact in the development of HOA.
Supplementary data
The supplementary materials are available at https://doi.org/10.5281/zenodo.17297795. The package contains the following files:
Supplementary Table 1. Top 5 candidate models ranked by their AIC values.
Data Availability Statement
The datasets generated and analysed during the current study are openly available in Zenodo at https://doi.org/10.5281/zenodo.17979427.
Use of AI and AI-assisted technologies
During the preparation of this work, the authors used ChatGPT to assist with language editing and phrasing; after using this tool, the author reviewed and edited the content as needed and takes full responsibility for the content of the publication.
Consent for publication
Not applicable.
.jpg)
.png)
.jpg)
.jpg)