Abstract
Background. Tic disorders (TD) are common neuropsychiatric conditions in children, often accompanied by anxiety and depression. Understanding the associated risk factors and their relationship with TD severity is crucial for effective management.
Objectives. This study investigated risk factors for TD in children and examined the relationship between anxiety, depression, and TD severity using the Screen for Child Anxiety Related Emotional Disorders (SCARED) and the Depression Self-Rating Scale for Children (DSRSC).
Materials and methods. A prospective observational study was conducted in 113 children diagnosed with TD at our hospital between January 2021 and January 2024. Tic disorder severity was evaluated using the Yale Global Tic Severity Scale (YGTSS). Anxiety and depression were assessed using SCARED and DSRSC, respectively. Demographic and clinical characteristics, as well as comorbidities, were analyzed using IBM SPSS v. 25.0.
Results. Children with TD had significantly higher rates of febrile seizures, family history of TD, recurrent respiratory infections, and comorbid attention-deficit/hyperactivity disorder (ADHD). Patients with TD exhibited elevated SCARED and DSRSC scores, which were significantly higher in moderate-to-severe cases than in mild cases. Yale Global Tic Severity Scale scores were positively correlated with both SCARED and DSRSC scores. Key risk factors associated with TD and with moderate-to-severe disease included a family history of TD, higher DSRSC scores, and higher SCARED scores.
Conclusions. This study highlights a strong association between anxiety, depression, and TD severity, with higher SCARED and DSRSC scores observed in moderate-to-severe cases. A family history of TD, along with elevated anxiety and depression scores, were identified as significant associated factors. These findings underscore the importance of psychological assessment and tailored interventions for children with TD.
Key words: risk factors, tic disorders, Yale Global Tic Severity Scale (YGTSS), Screen for Child Anxiety Related Emotional Disorders (SCARED), Depression Self-Rating Scale for Children (DSRSC)
Background
Tic disorders (TD) are neurodevelopmental conditions characterized by involuntary, repetitive motor and vocal tics. These disorders typically emerge in childhood and can significantly affect a child’s daily functioning and quality of life.1, 2 Tic disorders usually manifest between the ages of 3 and 8 years (mean age at onset: 6–7 years), with 93% of patients experiencing symptom onset by the age of 10 years.3 Tic disorders affect approx. 6% of children, making them relatively common in pediatric populations.4 Understanding the prevalence of TD and the factors associated with its development is crucial for identifying vulnerable populations and developing effective intervention strategies.
Children with TD often experience anxiety and depressive symptoms, which may exacerbate sleep disturbances and impair daily functioning.5, 6, 7 Another study reported that 1 in 10 adolescents with chronic TD experienced suicidal thoughts and/or behaviors, which were associated with more complex clinical presentations and frequently occurred during periods of anger and sadness.8 Version 2.0 of the European Tourette Syndrome Guidelines recommends psychoeducation as a first-line intervention across all levels of symptom severity.9 Anxiety and depressive symptoms may further increase the burden experienced by children with TD; therefore, investigating these psychological profiles may contribute to improved clinical management.
Objectives
This study aimed to examine risk factors for TD and to explore how anxiety and depression scores (Screen for Child Anxiety Related Emotional Disorders (SCARED) and the Depression Self-Rating Scale for Children (DSRSC)) relate to TD severity. Through this research, we hope to gain a deeper understanding of the etiology and development of TD.
Materials and methods
Study population
This prospective observational study included 113 children with TD who sought medical care at our hospital between January 2021 and January 2024. All patients with TD (aged 3–18 years) met the Diagnostic and Statistical Manual of Mental Disorders, 5th edition (DSM-5),10 criteria for TD. Exclusion criteria were as follows: 1) transient tic disorder (TTD); 2) comorbid neurological or psychiatric disorders (e.g., Huntington’s disease, epilepsy, intellectual disability, or schizophrenia); 3) severe infections, hematological disorders, malignancies, or abnormal cardiac, hepatic, or renal function; and 4) comorbid autoimmune diseases.
The exclusion of children with autoimmune diseases was intended to minimize potential confounding, as conditions such as pediatric autoimmune neuropsychiatric disorders associated with streptococcal infections (PANDAS) have been linked to neuropsychiatric symptoms, including tics, and could introduce additional variability into the results. By excluding these cases, we aimed to ensure a more homogeneous study population and to focus on the clinical and psychological factors associated with TD.
Additionally, 100 healthy children were included as controls, matched to the TD group by age and sex. The control group had normal liver and renal function, and chest X-ray findings were within the normal range. None of the control children had neurological or psychiatric disorders. Informed consent was obtained from the parents or legal guardians of all participants prior to enrollment. The study was approved by the Ethics Committee of The First Affiliated Hospital of Heilongjiang University of Traditional Chinese Medicine (Harbin, China; approval No. 2021034).
Assessment measures
The severity of TD in all children was assessed using the Yale Global Tic Severity Scale (YGTSS). We used only the 2nd section of the YGTSS (motor/vocal tic severity, score range: 0–50) to quantify tic severity, classifying scores of 0–20 as mild and 21–50 as moderate-to-severe.11 We selected this section because it provides a standardized quantitative assessment of tic severity, whereas the 1st section serves primarily as a symptom checklist without contributing to severity scoring, and the 3rd section reflects overall functional impairment, which may be influenced by subjective factors such as individual coping strategies and environmental support.
Additionally, SCARED was used to assess anxiety symptoms in all participants,12 and DSRSC was used to assess depressive symptoms.13 SCARED is a 41-item questionnaire designed to assess anxiety symptoms in children. Each item is rated on a 3-point Likert scale (0 = not true or hardly ever true; 1 = somewhat true or sometimes true; 2 = very true or often true), yielding a total score ranging from 0 to 82. Higher total scores indicate greater anxiety symptom severity. The DSRSC consists of 18 items, each scored as 0 (no), 1 (sometimes), or 2 (yes), with total scores ranging from 0 to 36; higher scores indicate greater depressive symptom severity. The Chinese versions of the YGTSS, SCARED, and DSRSC have been validated in previous studies, demonstrating good internal consistency, test–retest reliability, and construct validity in Chinese pediatric populations.14, 15, 16
Clinical data collection
In addition to the psychological scales, demographic and clinical data were collected for all study participants. Variables included age, body mass index (BMI), sex, tic subtype (Tourette syndrome (TS), chronic tic disorder (CTD), and chronic vocal tic disorder), preterm birth, cesarean delivery, primiparity, history of febrile seizures, allergies, asthma, sleep disorders, attention-deficit/hyperactivity disorder (ADHD), family history of TD, and recurrent respiratory infections.
Statistical analyses
Data analysis was performed using IBM SPSS v. 25.0 (IBM Corp., Armonk, USA). The normality of data distribution was assessed using the Kolmogorov–Smirnov test. Normally distributed data are presented as mean ± standard deviation (SD), whereas non-normally distributed data are presented as median (range). Group comparisons were performed using Student’s t-test or the Mann–Whitney U test, as appropriate. Differences in proportions were assessed using the χ2 test. Pearson correlation analysis was used to examine associations between YGTSS scores and SCARED/DSRSC scores. Heteroskedasticity was assessed using the Breusch–Pagan test. All clinically relevant variables were included in the logistic regression models based on theoretical considerations to comprehensively evaluate their associations with TD and its severity. A p < 0.05 was considered statistically significant.
Results
Basic characteristics of study participants
This prospective observational study included 113 children with TD (TD group) and 100 healthy controls (HC group). The TD group was categorized as follows: TS (n = 65, 57.5%), chronic motor tic disorder (n = 32, 28.3%), and chronic vocal tic disorder (n = 16, 14.2%). In the TD group, the median age was 10 years (range: 3–18), 59.3% were boys, and the mean BMI was 18.29 ±2.30 kg/m2. In the HC group, the median age was 9 years (range: 3–18), 59.0% were boys, and the mean BMI was 18.10 ±2.12 kg/m2. There were no significant differences between the 2 groups in terms of age, sex, or BMI. However, comparison of demographic and clinical characteristics revealed that the TD group had significantly higher proportions of children with a history of febrile seizures, a family history of TD, recurrent respiratory infections, and comorbid ADHD (Table 1).
Higher SCARED and DSRSC scores indicating increased anxiety- and depression-related symptoms in TD children
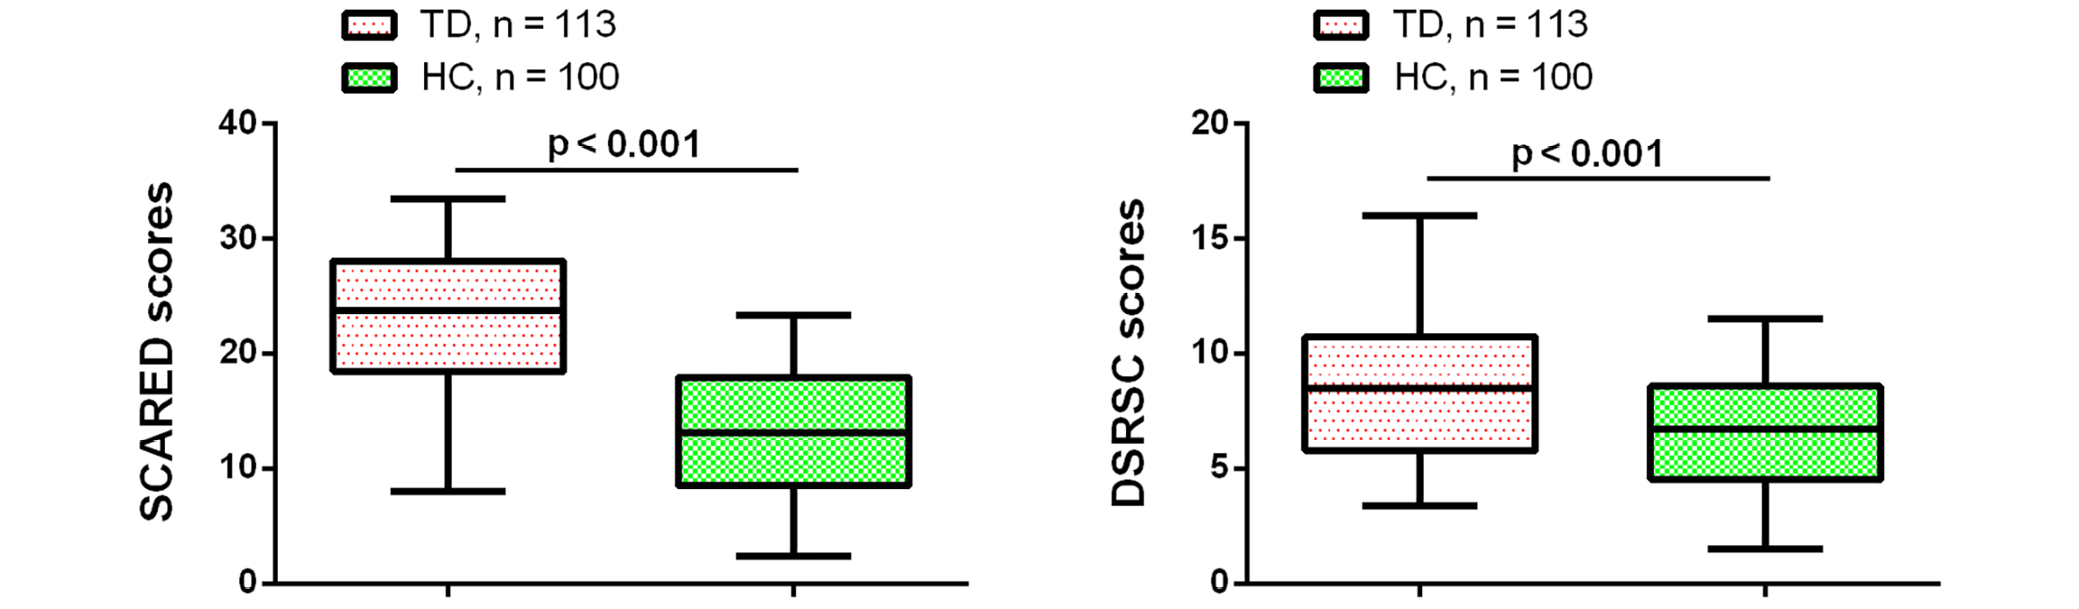
Subsequently, we compared SCARED and DSRSC scores between the 2 groups. As shown in Figure 1, children in the TD group had significantly higher SCARED and DSRSC scores than those in the HC group. These findings suggest that children with TD are more likely to exhibit anxiety- and depression-related symptoms.
Comparison of clinical characteristics in tic disorder children with different severity
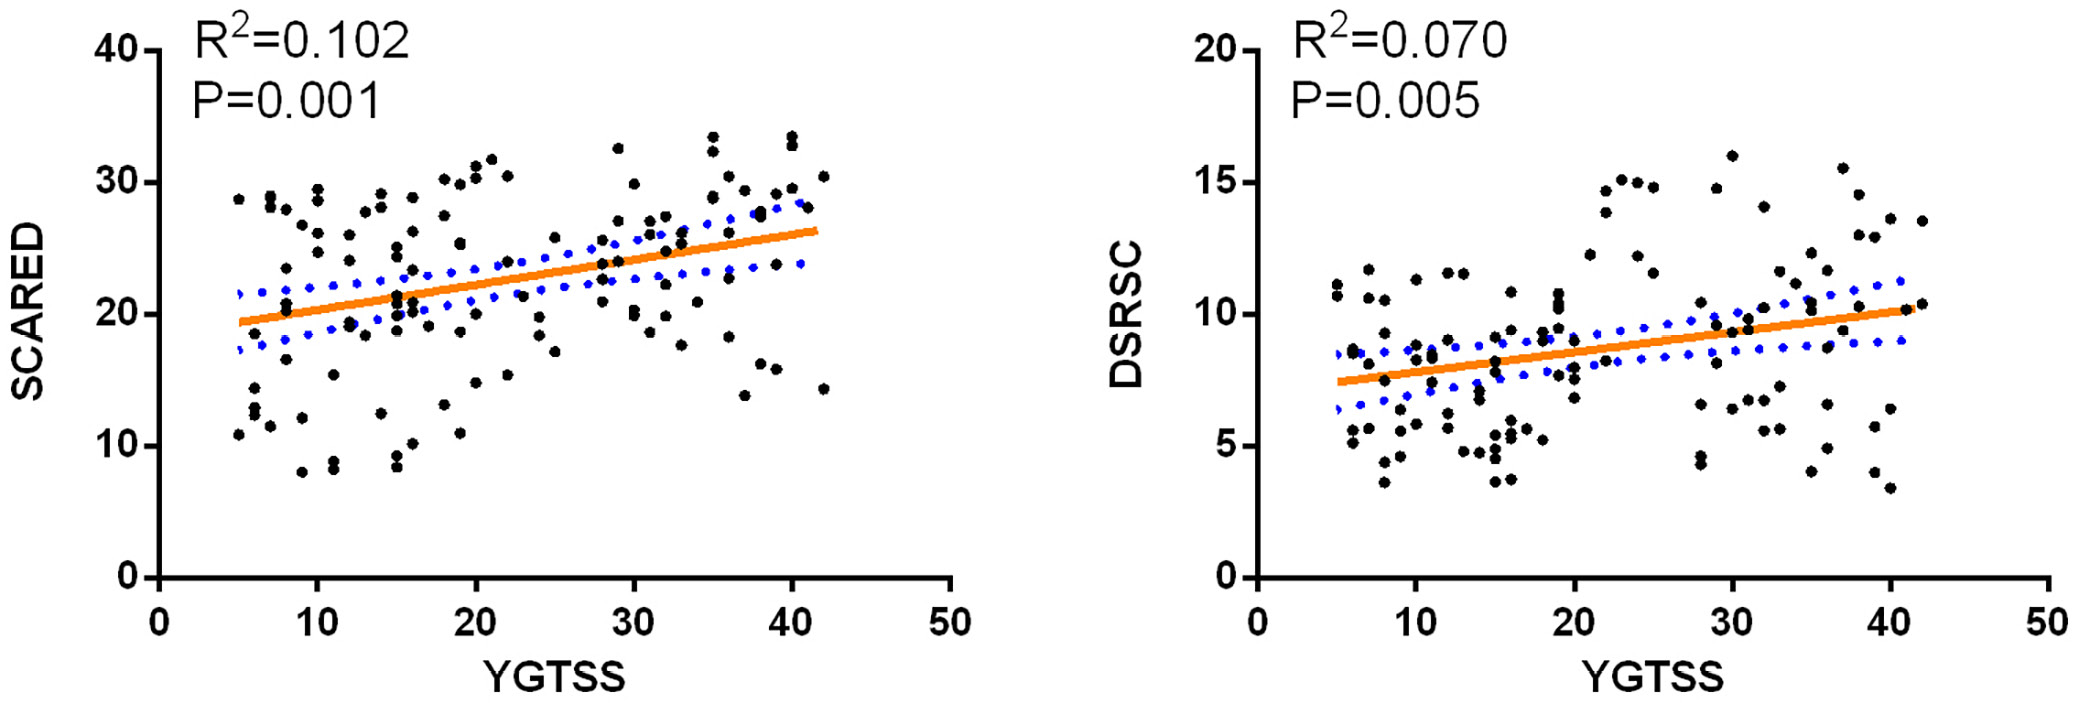
Children with TD were stratified into a mild group (YGTSS score: 0–20, n = 61) and a moderate-to-severe group (YGTSS score: 21–50, n = 52) based on YGTSS scores. Comparison of the clinical characteristics between the 2 groups revealed that the moderate-to-severe group had a significantly higher proportion of children with a family history of TD than the mild group (Table 2). The Breusch–Pagan test indicated no evidence of heteroskedasticity. Pearson’s correlation analysis demonstrated positive correlations between YGTSS scores and both DSRSC and SCARED scores (Figure 2).
Binary logistic regression analysis in tic disorder children
To explore factors associated with TD in children, we performed a multivariable binary logistic regression analysis. As shown in Table 3, the Hosmer–Lemeshow test (p = 0.864) and Nagelkerke R2 (0.671) indicated good model fit. Logistic regression analysis showed that a history of febrile seizures, a family history of TD, higher DSRSC scores, and higher SCARED scores were independently associated with TD.
Binary logistic regression analysis in moderate/severe tic disorder children
Lastly, we performed a multivariable binary logistic regression analysis to investigate factors associated with moderate-to-severe TD compared with mild TD. As shown in Table 4, the Hosmer–Lemeshow test (p = 0.519) and Nagelkerke R2 (0.419) indicated good model fit. Logistic regression analysis showed that a family history of TD, higher DSRSC scores, and higher SCARED scores were independently associated with moderate-to-severe TD.
Discussion
Patients with TD often experience subjective discomfort, social challenges, and emotional difficulties. These problems are particularly prominent in moderate-to-severe TD.17, 18 Therefore, in this study, we investigated factors associated with TD and with moderate-to-severe TD. Logistic regression analysis showed that a family history of TD, higher DSRSC scores, and higher SCARED scores were independently associated with both TD and moderate-to-severe TD.
Previous studies have explored differences in clinical characteristics between patients with TD and typically developing children. Hesapçıoğlu et al. reported that higher parental education was associated with a lower likelihood of TD, whereas a family history of psychiatric disorders was associated with a higher likelihood.19 Brander et al. reported a significant association between TS and CTD and metabolic and cardiovascular diseases.20 Mataix-Cols et al. suggested that comorbid psychiatric disorders and a family history of psychiatric disorders during childhood were major factors associated with the persistence of TD into adulthood.21
Studies investigating the mechanisms underlying TD have suggested that regulation of gene expression through non-coding variants, particularly in cortico-striatal circuits, may represent a fundamental biological mechanism underlying TDs,22 supporting the hypothesis that genetic factors play an important role in TD. Consistent with these findings, our study identified a family history of TD as a factor independently associated with both TD and moderate-to-severe TD, in agreement with the clinical findings reported by Ueda et al.1 and Abdulkadir et al.23
In addition to traditional clinical factors, we found that DSRSC and SCARED scores were significantly higher in patients with TD, with further increases observed in those with moderate-to-severe TD. These findings suggest that patients with TD are more likely to exhibit anxiety- and depression-related symptoms, which are also associated with tic severity. Research has shown that, compared with control groups, adolescents with TD have higher scores on the Multidimensional Anxiety Scale for Children (MASC).5 Another study reported that, in adolescents with CTD, suicidal thoughts and/or behaviors were significantly associated with tic severity, and Child Behavior Checklist (CBCL) anxiety/depression scores mediated the relationship between tic severity and suicidal thoughts and behaviors.8 A recent study on 85 children and adolescents with CTD also found that those with comorbid obsessive-compulsive disorder (OCD) and/or ADHD had a higher prevalence of depressive symptoms compared to those without comorbidities, and that depression played an important moderating role in the relationship between tic severity and functional impairment.11 Furthermore, a review by Hibberd et al. reported that patients with TS or CTD had a higher prevalence of sleep difficulties, with the highest risk observed in those with comorbid anxiety disorders.24 In our study, multivariable logistic regression analysis also showed that higher DSRSC and SCARED scores were independently associated with both TD and moderate-to-severe TD.
While our study identified significant correlations between tic severity (YGTSS scores) and anxiety/depression severity (SCARED and DSRSC scores), it is important to consider the potential bidirectional nature of these relationships. On the one hand, the chronic and often socially stigmatizing nature of tics may lead to increased anxiety and depression in children with TD, particularly as they face challenges in social interactions and daily functioning. On the other hand, pre-existing anxiety and depression may exacerbate tic severity by increasing stress levels, which are known to worsen tic symptoms.25 Although our study design does not allow causal inferences, future longitudinal studies are needed to determine whether anxiety and depression are consequences of tic severity or factors contributing to tic severity. Understanding the direction of these relationships will be crucial for developing targeted interventions addressing both TD and associated psychological symptoms.
Given the high rates of anxiety and depression observed in children with TD, clinicians should adopt a multidisciplinary treatment approach that integrates both medical and mental health support. Early identification of psychiatric comorbidities, such as anxiety and depression, is important for effective management. Clinicians should consider regular psychological screening for children with TD and provide targeted interventions, including cognitive-behavioral therapy (CBT), to address mental health concerns. Additionally, clinicians should be mindful of the potential psychiatric side effects of medications prescribed for TD, as these may contribute to or exacerbate psychological symptoms. By adopting a holistic and proactive approach, clinicians may better support the mental wellbeing of children with TD and improve their overall quality of life.
Limitations of the study
There are several limitations to this study. A major limitation is the potential confounding effect of psychotropic medications commonly used in TD management, as these may independently influence anxiety and depression scores. Medications prescribed to manage TD symptoms, particularly psychotropic drugs such as dopamine antagonists, may affect psychiatric comorbidities, including anxiety and depression, and these effects were not fully accounted for in our analysis. Second, this was a single-center study with a relatively small sample size, which may limit the generalizability of our findings. Third, we did not perform subgroup analyses to further classify patients with TD, which might have provided additional insights into specific clinical patterns or associated factors. Future research should aim to control for these potential confounders and further explore the mechanisms contributing to psychological distress in children with TD.
Conclusions
Our study demonstrated significantly higher DSRSC and SCARED scores in patients with TD, with further increases observed in those with moderate-to-severe TD. Additionally, a family history of TD, higher DSRSC scores, and higher SCARED scores were identified as factors independently associated with both TD and moderate-to-severe TD.
Supplementary data
The supplementary materials are available at https://doi.org/10.5281/zenodo.18236518. The package contains the following files:
Supplementary Table 1. Normality tests for the data presented in Table 1, Table 2, and Figure 1.
Supplementary Table 2. Breusch–Pagan test results for the data in Figure 2.
Supplementary Table 3. Assumption tests for the logistic regression analyses in Table 3 and Table 4.
Data Availability Statement
The datasets supporting the findings of the current study are openly available in Zenodo at https://doi.org/10.5281/zenodo.14505290.
Consent for publication of personal information
Not applicable.
Use of AI and AI-assisted technologies
Not applicable.