Abstract
Background. Kidney transplantation is the optimal method of renal replacement therapy. The EQ-5D-5L is a widely used instrument for assessing health-related quality of life (HRQoL) across different populations.
Objectives. This study aimed to assess HRQoL in kidney transplant recipients (KTRs) compared with the general population and to identify factors associated with impaired HRQoL.
Materials and methods. A total of 156 KTRs (58 women and 98 men) participated in this prospective observational study. All participants completed the EQ-5D-5L questionnaire. Demographic and laboratory data were collected, and physical performance tests were performed. Statistical analyses were conducted using Statistica.
Results. Of the 156 participants, 54 (34.62%) had an EQ-5D-5L health state of 11111, whereas 102 (65.38%) reported impairment in HRQoL in at least 1 domain. No significant differences in sex, age, or Charlson Comorbidity Index (CCI) were observed between the analyzed groups. Compared with Polish population reference values for the EQ-5D-5L, KTRs had similar HRQoL, with a median utility score of 0.970 [Q1–Q3: 0.916–1.000]. In the multivariable Cox regression model, the EQ-5D-5L utility score independently predicted mortality in KTRs (hazard ratio (HR) = 0.007; 95% confidence interval (95% CI): 0.000–0.134; *p* = 0.001). The EuroQol Visual Analogue Scale (EQ VAS) score also independently predicted adverse outcomes (HR = 0.966; 95% CI: 0.935–0.997; p = 0.030).
Conclusions. Assessment of HRQoL should be an integral component of the holistic management of KTRs. HRQoL assessment is associated with long-term outcomes in KTRs. Self-rated HRQoL measured on a 0–100 VAS may help identify patients at increased risk of adverse outcomes.
Key words: kidney transplantation, quality of life, EQ-5D-5L survey, long-term outcomes, health-related quality of life (HRQoL)
Background
The concept of health-related quality of life (HRQoL) emerged in the 1960s and is now considered an important endpoint in clinical trials and medical research. Consequently, improving patients’ quality of life has become one of the principal therapeutic goals. To assess HRQoL, a number of validated instruments have been developed, including the EQ-5D-5L questionnaire.1 It is one of the most widely used instruments for evaluating quality of life across 5 dimensions: mobility, self-care, usual activities, pain/discomfort, and anxiety/depression, each rated on a 5-level scale: 1 (no problems), 2 (slight problems), 3 (moderate problems), 4 (severe problems), and 5 (extreme problems).2, 3 The questionnaire also includes the EuroQol Visual Analogue Scale (EQ VAS), a vertical, thermometer-like self-assessment scale that provides a subjective measure of HRQoL. The results can be used to compare HRQoL across different patient populations.4, 5, 6
The prevalence of chronic kidney disease (CKD) exceeds 9% worldwide. In some patients, CKD progresses to irreversible end-stage renal disease (ESRD), requiring renal replacement therapy (RRT). Kidney transplantation (KTx) is considered the optimal form of RRT.7 It is well established that KTx improves not only clinical outcomes but also patients’ quality of life. According to the Kidney Disease: Improving Global Outcomes (KDIGO) guidelines, living-donor preemptive kidney transplantation should be considered in adults with an estimated glomerular filtration rate (eGFR) <20 mL/min/1.73 m2 and evidence of progressive, irreversible CKD over the preceding 6–12 months.8 The management of kidney transplant recipients (KTRs) remains challenging because they have a higher risk of mortality than individuals without kidney disease.9 Chronic immunosuppressive therapy increases susceptibility to infections and elevates the risk of cardiovascular disease (CVD), diabetes, and malignancy.10, 11 In addition, chronic allograft injury remains a major long-term complication.12 Clinicians must also decide whether and when to ligate a patent arteriovenous fistula (AVF) or remove a Tenckhoff catheter after KTx.13, 14 Furthermore, KTRs are predisposed to hypertension, post-transplant diabetes mellitus, obesity, muscle wasting, sarcopenia, and frailty.15, 16, 17 All of these conditions are strongly associated with poorer clinical outcomes and reduced HRQoL.
According to the European Working Group on Sarcopenia in Older People (EWGSOP), sarcopenia is defined as a progressive and generalized skeletal muscle disorder associated with an increased likelihood of adverse outcomes, including falls, fractures, physical disability, and mortality.18 Sarcopenia is now recognized primarily as a disorder of muscle function rather than merely a change in body composition. Kidney transplant recipients appear to be particularly susceptible to muscle dysfunction and sarcopenia because of the cumulative effects of dialysis, chronic immunosuppressive therapy, low-protein intake during the predialysis stage of CKD, and reduced appetite. The diagnosis of sarcopenia may be supported by physical performance tests,19, 20 including the 30-Second Sit-to-Stand (STS) test, which assesses lower-extremity muscle function.21 Previous studies have shown that sarcopenia adversely affects both clinical outcomes and HRQoL.18, 22
Objectives
The aim of this study was to assess HRQoL in KTRs and compare it with that of the general Polish population. The secondary objectives were to identify differences between patients with good and impaired HRQoL, determine predictors of impaired HRQoL, and identify predictors of adverse outcomes in KTRs.
Materials and methods
Study procedures and obtaining ethical approvals
The study was designed as a prospective observational study. Written informed consent was obtained from all participants. The study was approved by the Institutional Ethics Committee of Wroclaw Medical University (approval No. KB-43/2020) and registered at ClinicalTrials.gov (NCT04478968). The study was conducted in accordance with the ethical principles of the Declaration of Helsinki. The study flowchart and patient cohort have been described previously.23, 24 The inclusion criteria were: age >18 years, KTRs, >12 months after KTx, stable graft function, and provision of written informed consent. The exclusion criteria were: EGFR < 15 mL/min/1.73 m2, mL/min/1.73 m2, severe infection within 3 months before study assessment, an increase in serum creatinine concentration >0.5 mg/dL within 3 months before study assessment, active malignancy, and severe heart failure (New York Heart Association Functional Classification (NYHA) Class IV).
Study procedures
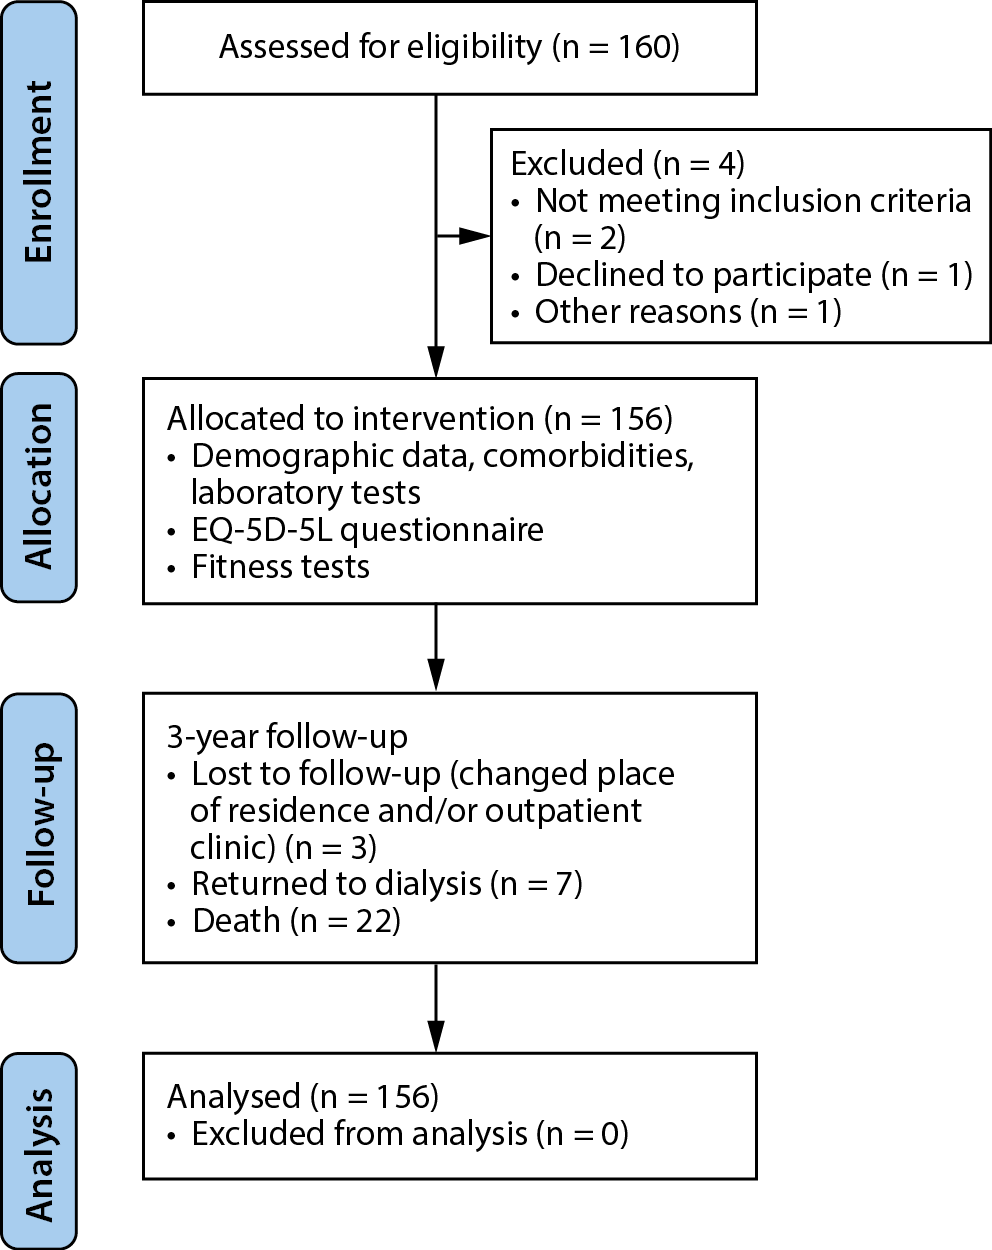
At baseline, 156 KTRs were recruited from the Transplant Outpatient Clinic of the University Clinical Hospital of Wroclaw Medical University (Figure 1). All study visits and assessments were conducted by the same trained investigator. Basic demographic and anthropometric data were collected, together with medical history, including the cause of CKD, Charlson Comorbidity Index (CCI), time since KTx, the presence of a functioning patent AVF, AVF duration (months), and current pharmacological treatment. All participants completed the EQ-5D-5L questionnaire independently in Polish. Responses across the 5 dimensions were combined into a 5-digit health-state code ranging from 11111 (no health problems) to 55555 (extreme problems in all 5 dimensions). Utility values (EQ-5D-5L index) were calculated using the EuroQol Group’s standard valuation protocol, which assigns population-based preference weights to each health state according to time trade-off (TTO) valuations derived from a representative sample of the general population. The utility scores in our study were calculated using the Polish EQ-5D-5L value set developed by Golicki et al.25 Each domain contributes differently to the scoring algorithm. Utility scores were in the range of −0.523 to 1.000.26 The utility value for each health state was calculated as a weighted combination of the 5 dimensions according to the published coefficients of the Polish value set. At the end of the questionnaire, participants assessed their overall health using the EQ VAS by marking a value from 0 (the worst health imaginable) to 100 (the best health imaginable).27 The EQ VAS reflects respondents’ overall perception of their health on the day of assessment. Higher EQ-5D-5L index and EQ VAS scores indicate better health status.
Blood samples were collected, routine laboratory tests and urinalysis were performed, and the eGFR was calculated using the Modification of Diet in Renal Disease (MDRD) equation. Handgrip strength was measured in both hands using a Saehan Smedley Spring Hand Dynamometer (model SH5002; Saehan Corporation, Seoul, South Korea). Subsequently, the 3-Meter Stand and Go (3m SAG) test and the 30s STS test were performed. Finally, lung ultrasound (LUS) was conducted using the 28-zone scanning protocol, and the total number of B-lines was recorded.28 Sarcopenia was defined by the presence of muscle weakness, with cutoff values of fewer than 15 repetitions for women and fewer than 17 repetitions for men on the 30s STS test.21
Utility scores were calculated from the EQ-5D-5L results and compared with those of the general Polish population.25, 29 Patients were divided into 2 groups according to their EQ-5D-5L results: those reporting no limitations in mobility, self-care, usual activities, pain/discomfort, or anxiety/depression (health state 11111), and those reporting limitations in at least 1 domain. A 3-year follow-up period was planned. Adverse outcomes included return to dialysis, loss to follow-up, and death.
Statistical analyses
Statistical analyses were performed using Statistica v. 13.3 (StatSoft, Tulsa, USA) with the Plus 5.0 package. Differences between the study groups were analyzed. Data distribution was assessed using the Lilliefors test. Because the data were not normally distributed, continuous variables are presented as the median [Q1–Q3], whereas categorical variables are presented as frequencies and percentages, as appropriate. Quantitative variables were compared using the two-tailed Mann–Whitney U test, and categorical variables were analyzed using the χ2 test. A p < 0.05 was considered statistically significant.
To identify predictors of adverse outcomes, a multivariable logistic regression model was constructed. The assumption of linearity between continuous predictors and the logit of the dependent variable was evaluated using visual inspection of plots and the likelihood ratio (LR) test. Multicollinearity was assessed using a correlation matrix. Influential observations were identified using Cook’s distance. For survival analysis, Cox proportional hazards regression models were fitted, and Kaplan–Meier survival curves were generated. Before constructing the Cox model, multicollinearity among predictors was assessed using the covariance matrix and the variance inflation factor (VIF). The proportional hazards (PH) assumption was evaluated using Schoenfeld residual-based tests, whereas Martingale residuals were used to assess the linearity of continuous variables. For binary variables, the less prevalent category was used as the reference category. Details of all statistical assumptions are provided in the supplementary data.
Results
Quality of life in KTRs
The results of the EQ-5D-5L questionnaire are presented in Table 1. Overall, 58.34% of patients reported no problems with anxiety/depression, 49.36% reported no pain/discomfort, and 91.67% reported no problems with self-care. Compared with the Polish population reference values for the EQ-5D-5L, KTRs had similar HRQoL, with a median utility score of 0.970 [Q1–Q3: 0.916–1.000], whereas the corresponding value for the Polish reference population was 0.970 [Q1–Q3: 0.922–1.000] (Table 2).25, 29 EQ VAS scores in KTRs were also comparable to the Polish population reference values.30
Group characteristics
For the purposes of this study, patients were divided into 2 groups according to their EQ-5D-5L results: those reporting no health limitations (health state 11111) and those reporting limitations in at least 1 domain (any health state other than 11111). Of the 156 participants, 54 (34.62%) had the health state 11111, whereas 102 (65.38%) reported limitations in at least 1 domain. The characteristics of these 2 groups are presented in Table 3. No significant differences were observed with respect to age, sex, CKD etiology, comorbidities, or laboratory findings. However, a significant difference was found in the use of antihypertensive medications. Specifically, 95.1% of patients with impaired HRQoL were receiving antihypertensive treatment, compared with 81.48% of patients with good HRQoL (p = 0.006).
Patients with impaired HRQoL had poorer performance on the 30s STS test, as shown in Table 3. In addition, KTRs with impaired HRQoL had significantly lower right-hand grip strength than those with good HRQoL (35 kg [Q1–Q3: 27–44] vs 40 kg [Q1–Q3: 28–51], p = 0.028).
Survival analysis
In the multivariable Cox regression model, the EQ-5D-5L utility score independently predicted mortality in KTRs (hazard ratio (HR) = 0.007; 95% confidence interval (95% CI): 0.000–0.134; p = 0.001) (Table 4). Age was also independently associated with mortality (HR = 1.093; 95% CI: 1.033–1.157; p = 0.002) (Table 4).
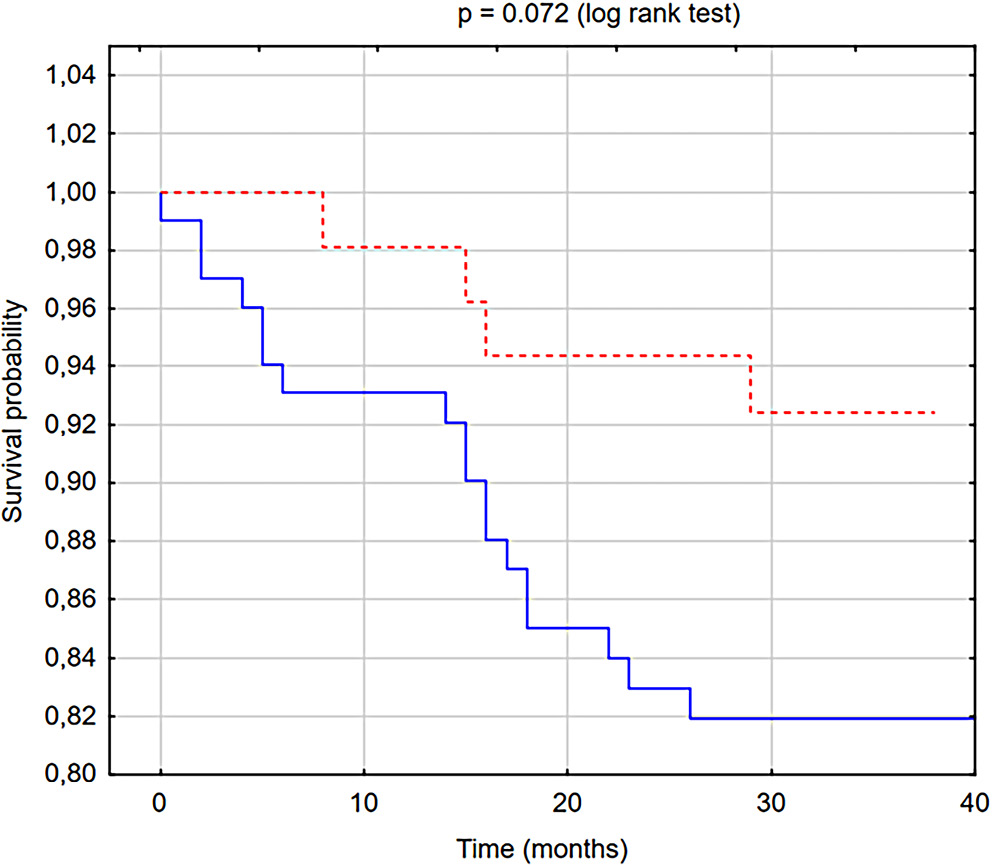
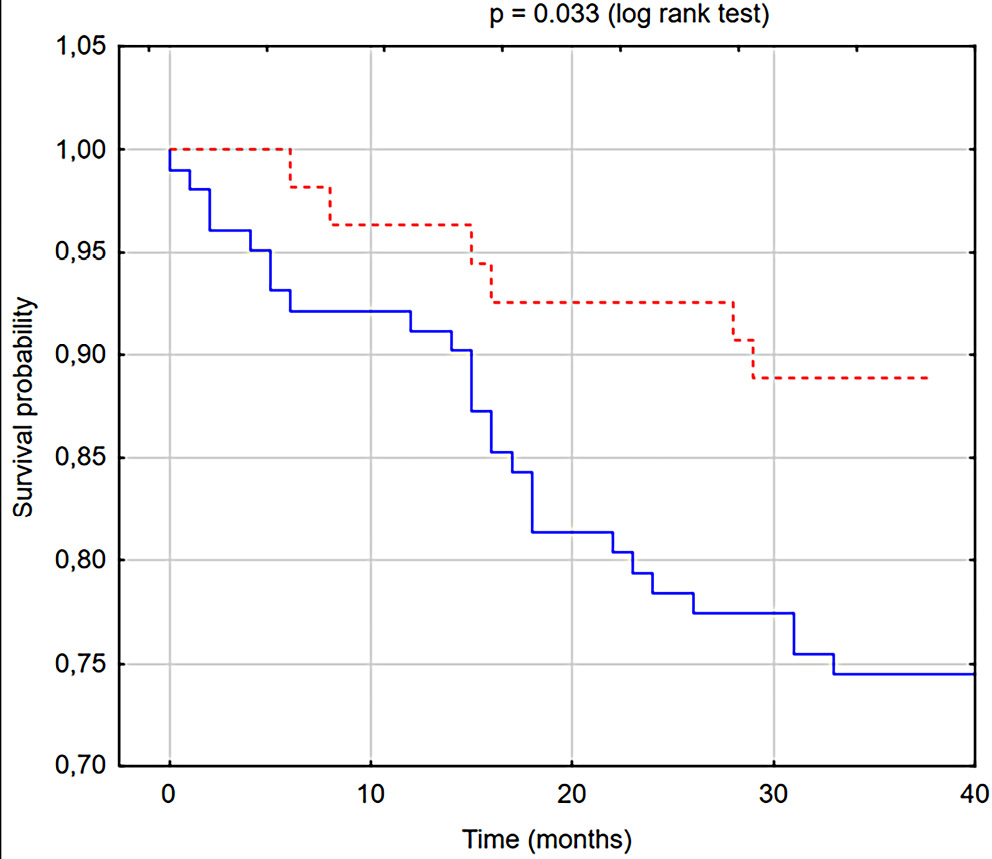
Because heart disease status violated the PH assumption, the Cox model was stratified by this variable. Stratification allowed separate baseline hazard functions to be estimated for each stratum while preserving the estimation of HRs for all other covariates. The 3-year overall survival and event-free survival probabilities of KTRs are presented in Figure 2 and Figure 3. Patients with impaired HRQoL had significantly lower overall survival and event-free survival probabilities than those reporting no limitations in HRQoL according to the EQ-5D-5L (Figure 2, Figure 3).
Regression model
The multivariable logistic regression model revealed that heart disease and the EQ VAS score were independently associated with adverse outcomes in KTRs (Table 5). Age was excluded from the model because of collinearity with the EQ VAS score. The EQ VAS score independently predicted adverse outcomes (odds ratio (OR) = 0.966; 95% CI: 0.935–0.997; p = 0.030) (Table 5).
Discussion
Our study showed that KTRs in Poland reported HRQoL comparable to that of the general Polish population. We also identified differences between KTRs reporting no limitations on the EQ-5D-5L and those reporting limitations in at least 1 domain. Patients with impaired HRQoL had lower overall survival and event-free survival probabilities in the Kaplan–Meier analyses. In addition, both the EQ-5D-5L utility score and the EQ VAS score were identified as predictors of adverse outcomes in KTRs.
The comparable HRQoL observed among Polish KTRs may, in part, be explained by the relatively young age of the study population (median age: 57 years; [Q1–Q3: 47.5–64.0]). Younger age has consistently been associated with better HRQoL.31 It is also possible that self-reported HRQoL is overestimated by KTRs because of their previous experience with the burden of dialysis. Furthermore, KTRs in our cohort reported substantially better HRQoL than patients receiving hemodialysis in a recent UK study (mean utility score: 0.57 ±0.30).32 Similarly, patients undergoing dialysis in Australia reported lower utility scores (mean: 0.719, SD = 0.267) than those observed in our cohort.33 These findings suggest that KTx is not only the optimal treatment for CKD in terms of survival but also provides substantial benefits with respect to HRQoL, likely because recipients can directly compare their quality of life before and after transplantation. Consistent with our findings, Kostro et al. reported that KTx improves HRQoL regardless of the renal replacement therapy modality used before transplantation.34
In our study, KTRs most frequently reported problems related to pain/discomfort, followed by anxiety/depression. Self-care was the domain in which the fewest problems were reported. These observations are consistent with previous studies of the Polish general population, in which pain/discomfort and anxiety/depression were also the most frequently affected EQ-5D-5L domains.30, 35 Likewise, self-care was the least frequently reported problem in the Polish population.35
In our study, patients with impaired HRQoL had poorer results on physical performance and functional tests, suggesting greater muscle dysfunction. Sarcopenia was originally defined primarily by a reduction in muscle mass. However, the concept has evolved, and muscle function, particularly muscle strength and power, is now considered a more important determinant because it is more strongly associated with mortality.36 Furthermore, muscle power has been shown to decline before measurable loss of muscle mass in individuals who develop sarcopenia.37 According to Alcázar et al., the 30s STS test provides a valid measure of bilateral lower-extremity muscle power and is more strongly associated with physical performance than maximal handgrip strength.20 The association between physical performance and HRQoL has previously been demonstrated in several patient populations, including KTRs.38, 39 Our findings further emphasize the importance of early recognition of muscle dysfunction because it is associated with both HRQoL and clinical outcomes.40 Therefore, rehabilitation programs aimed at improving physical performance should be considered for KTRs with developing sarcopenia.
Another important finding of our study was that patients with impaired HRQoL had worse outcomes, including higher overall mortality, than patients reporting no HRQoL limitations according to the EQ-5D-5L. An association between HRQoL and mortality has previously been demonstrated in patients receiving hemodialysis.41 According to Liebman et al., lower HRQoL measured using the Short Form-36 (SF-36) questionnaire is associated with increased mortality among patients undergoing maintenance dialysis.42 In KTRs, HRQoL assessed using the Kidney Disease Quality of Life Short Form (KDQOL-SF) has also been shown to be independently associated with an increased risk of mortality.43 Our findings confirm the association between HRQoL and clinical outcomes in KTRs using the EQ-5D-5L. Moreover, we demonstrate that the EQ VAS is a simple, rapid, and noninvasive tool for identifying patients at increased risk of adverse outcomes. These findings support the use of EQ-5D-5L as part of the routine assessment of KTRs because HRQoL is associated with long-term clinical outcomes.
Limitations of the study
The main limitation of this study is the relatively small sample size, which may have affected the statistical power of some analyses, particularly the comparison of HRQoL with that of other populations. In addition, sarcopenia was diagnosed solely on the basis of physical performance tests.
Conclusions
Assessment of HRQoL should be an integral part of the holistic management of KTRs. The EQ VAS is a simple, rapid, and noninvasive tool for identifying patients at increased risk of adverse outcomes. Assessment of HRQoL using the EQ-5D-5L is associated with long-term outcomes in KTRs.
Supplementary data
The supplementary materials are available at https://doi.org/10.5281/zenodo.17671687. The package contains the following files:
Supplementary Materials A. Logistic regression model assumptions.
Supplementary Materials B. Cox regression.
Supplementary Materials C. Lilliefors test.
Data Availability Statement
The datasets supporting the findings of the current study are openly available in Zenodo at https://doi.org/10.5281/zenodo.17669305.
Consent for publication
Not applicable.
Use of AI and AI-assisted technology
Not applicable.