Abstract
Background. Digital medical imaging is the basis for effective medical diagnostics and is currently part of a dynamically developing field of science. Optical coherence tomography (OCT) allows for in situ imaging of tissues in real time, without the need to perform biopsies, histological procedures, or X-rays. Pirop® Echo-son device measures the tissue ultrasonographically.
Objectives. The aim of this cross-sectional pilot study was to propose a new method of gingival tissue analysis by evaluating the possibility of using OCT and echo-son jointly in periodontal diagnostics and clinical practice for assessing the horizontal mucosal thickness of healthy gingiva in adult patients.
Materials and methods. Thirteen patients were examined using a biometric ultrasound scanner and 3D–OCT camera. The obtained results were compared and analyzed. Comparisons between age groups or sex were made with Kruskal–Wallis analysis of variance (ANOVA) and Mann–Whitney U tests, respectively. A correlation analysis was performed between Pirop® and OCT parameters, also divided into age groups and sex.
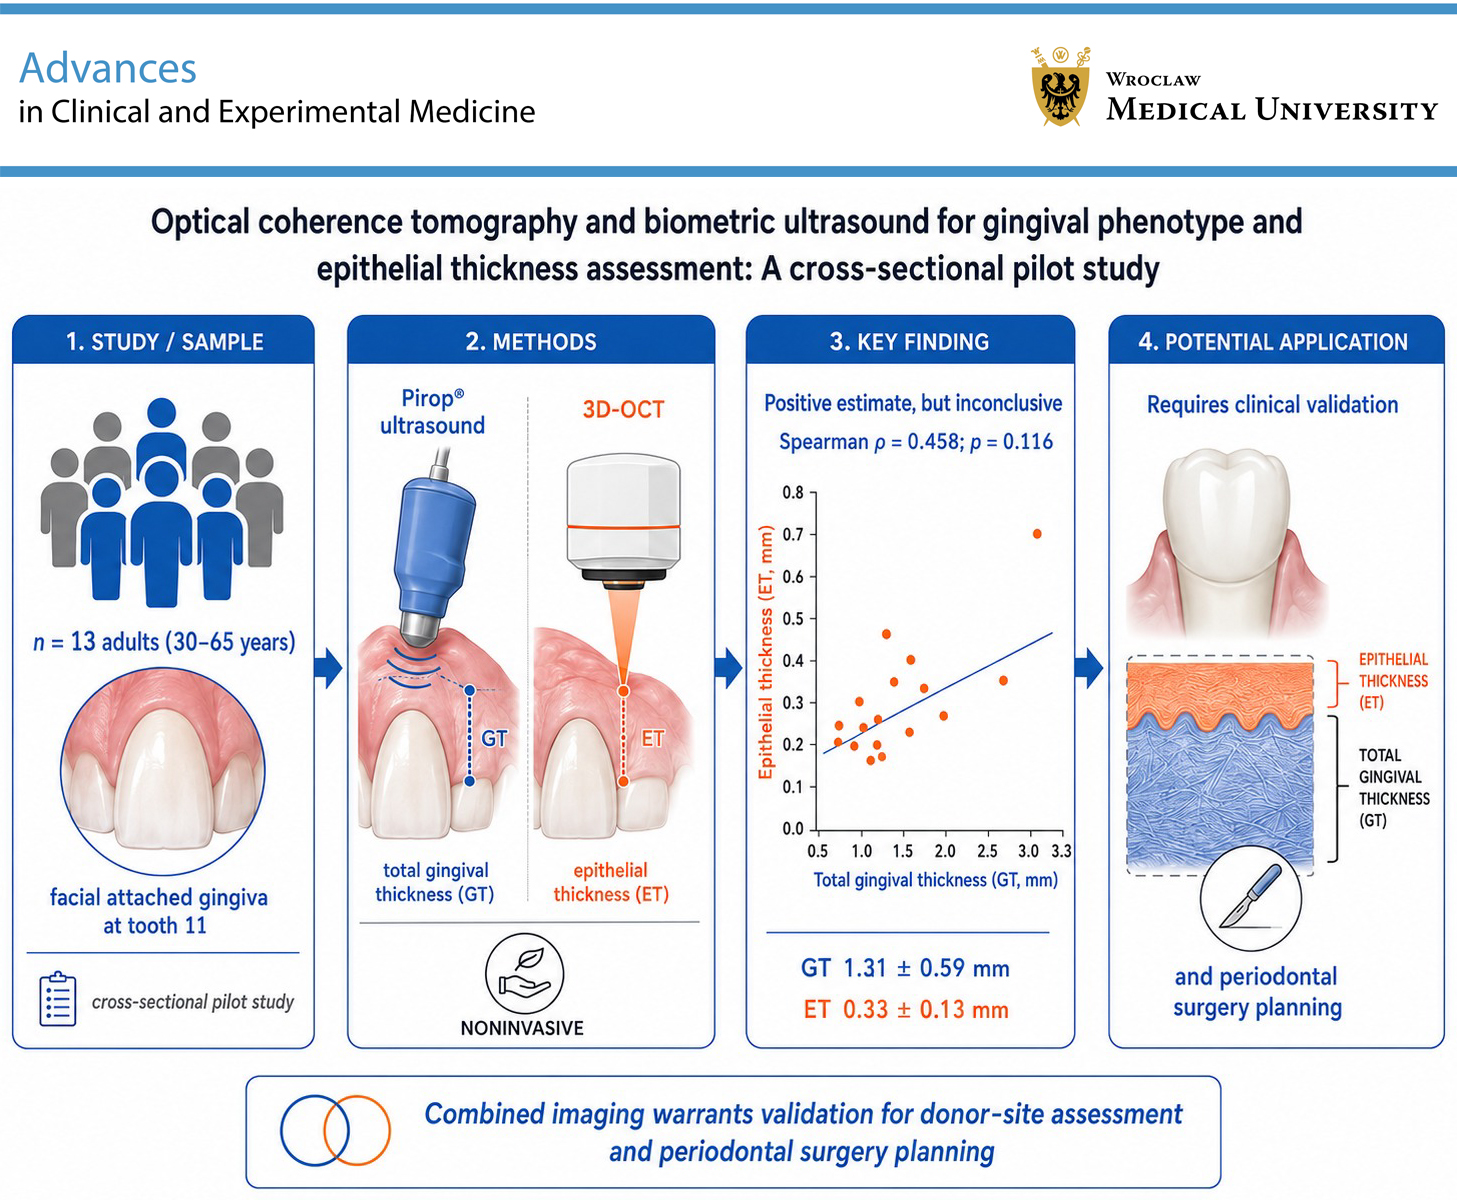
Results. The mean gingival thickness (GT) was 1.31 mm and the mean epithelial thickness was 0.33 mm. There was no statistically significant correlation between epithelial thickness and total GT. The thickness of the gingiva and epithelium did not depend on age or sex. Due to the limited sample size, this pilot study provides exploratory, descriptive findings that warrant confirmation in a larger, adequately powered study. No comparison reached statistical significance (all p > 0.05); effect sizes varied in magnitude and were imprecise.
Conclusions. Optical coherence tomography imaging may complement ultrasonographic measurement of total GT by providing information on epithelial thickness. The combined approach warrants validation as a potential aid for donor-site assessment and periodontal surgery planning.
Key words: gingiva, ultrasonography, optical coherence tomography, periodontics, gingival phenotype
Background
Periodontal phenotype comprises 2 terms: bone morphotype – buccal bone plate thickness, and the overlying gingival phenotype – keratinized tissue width (KTW) and gingival thickness (GT).1, 2 The gingiva extends from the gingival margin to the mucogingival border. It consists of connective tissue and a covering epithelium, which is a keratinized stratified squamous epithelium on the oral cavity side.3 Gingival thickness ranges from 0.7 mm to 1.5 mm,4 whereas its width is more variable, ranging from 1 mm to as much as 9 mm.5 The position of the tooth in the alveolar bone affects GT; therefore, thinner gingiva is often associated with a buccal tooth position, and vice versa.6 The 2017 World Workshop on the Classification of Periodontal and Peri-Implant Diseases and Conditions classified periodontal biotype into 3 categories: thin scalloped, thick flat, and thick scalloped.2, 6, 7 Patients with a thick gingival phenotype are less likely to experience gingival recession. Gingival thickness at a given tooth surface may influence the recession process. Thin gingiva may be more prone to recession caused by trauma or inflammation.8 In clinical practice, proper assessment of the periodontal biotype, particularly GT, is important when planning treatment in the esthetic zone. The presence of keratinized tissue facilitates implantological, prosthetic, and orthodontic treatment. It also helps patients perform oral hygiene procedures at home.
Gingival thickness can be assessed using many methods, both invasive and noninvasive. Visual assessment is the simplest method and relies on knowledge of features typical of various periodontal biotypes. A periodontal probe inserted into the gingival sulcus centrally on the labial surface of the tooth may also be used. However, relying solely on visual or probe-based assessment may lead to underestimation or overestimation of GT, as these methods do not consistently account for subtle variations in soft-tissue density and underlying bone morphology. According to current recommendations of the American Academy of Periodontology and the European Federation of Periodontology, periodontal phenotypes are divided into thin ≤1 mm (visible probe) and thick >1 mm.7, 9 These methods, although simple and minimally invasive, do not allow for actual assessment of GT.10, 11 Measurements of gingival and oral mucosal thickness are most often performed under local anesthesia, which may cause local volume increase.6 This technique uses a periodontal probe or a more precise puncture method using an endodontic instrument or an injection needle with a silicone stop (transgingival probing (TGP) and bone sounding (BS)).12 Cone beam computed tomography (CBCT) can also be used to measure both gingival and labial bone plate thickness.11, 13 Ultrasonic GT measurement (UGTM) is a safe and painless method, but it requires the use of an appropriate device. A device useful in clinical practice for measuring GT is the Pirop® ultrasonic biometer (Echoson, Puławy, Poland).14 It has been suggested in the literature that combining ultrasonic measurements with advanced imaging (e.g., CBCT or optical coherence tomography (OCT)) improves the accuracy and reliability of soft-tissue assessment, especially in regions adjacent to thin buccal bone plates. A similar diagnostic benefit from multimodal imaging has recently been demonstrated in ophthalmology, where OCT, optical coherence tomography angiography (OCT-A), and fundus autofluorescence were correlated for optic disc drusen assessment.15 None of the above-mentioned methods for measuring GT allow selective assessment of epithelial thickness in relation to other gingival layers. A promising device in this context may be OCT.
Objectives
The aim of this pilot study was to evaluate a novel and clinically applicable method for measuring gingival tissue. The primary objective was to assess the correlation between epithelial thickness and total GT using 2 noninvasive methods: OCT and ultrasonographic assessment. The hypothesis regarding the correlation between epithelial thickness and gingival phenotype was reframed as exploratory because of the limited sample size. The goal was to generate preliminary data and provide methodological insights for future investigations. An important assumption of the study was that the research and analysis of the obtained images would be performed exclusively by clinicians, without the involvement of an IT specialist, in order to develop a method that could be practically applied by dentists rather than merely present a theoretical technique. Additionally, measurements were independently performed by multiple clinicians to reduce single-operator dependence.
Materials and methods
Thirteen patients were invited to participate in the study – 7 women and 6 men, aged 30–65 years, with no systemic diseases or medications that could affect periodontal health. The patients provided informed consent for the diagnostics performed at the dental chair during a routine dental check-up, and they voluntarily attended a private ophthalmology clinic to undergo OCT. The study was conducted in accordance with the Declaration of Helsinki and approved by the Ethics Committee of the Pomeranian Medical University in Szczecin (approval No. KB-006/61/2024). All participants were periodontally healthy, with no signs of inflammation, no implants, and no history of periodontal surgery in the examined region. These parameters were verified clinically to ensure homogeneity of tissue conditions and eliminate confounding variables. The sample was selected using purposive sampling, focusing on accessibility and compliance with the inclusion criteria. Given the pilot nature of the study, no formal a priori sample size calculation was performed. This phase aimed to evaluate feasibility and inform the design of a future adequately powered study. Patients were examined using the Pirop® Echo-son device and the Topcon 3D OCT-2000® system (Topcon Corporation, Tokyo, Japan).
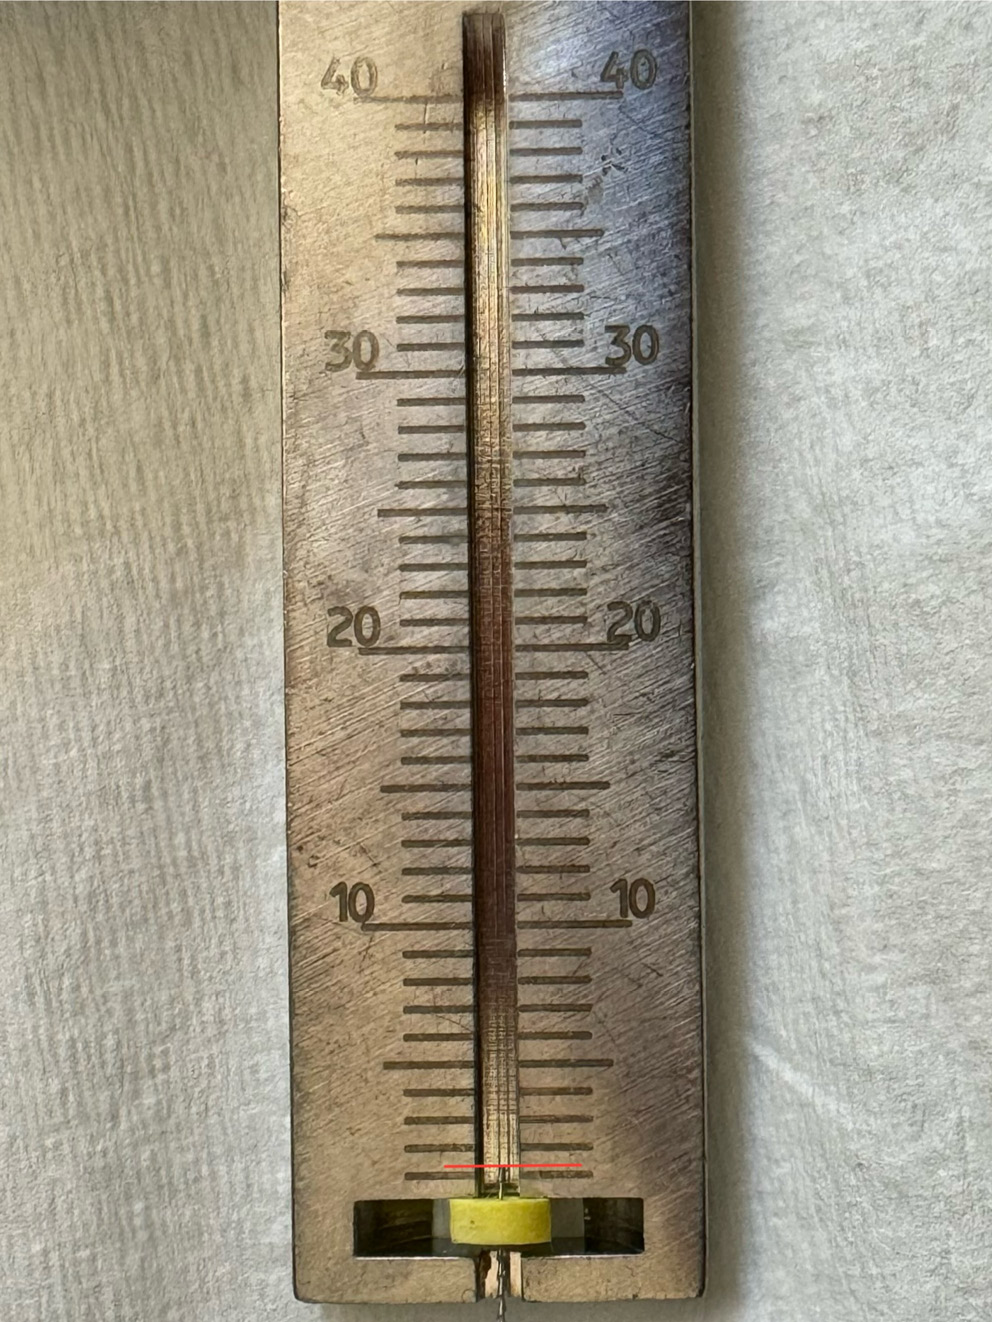
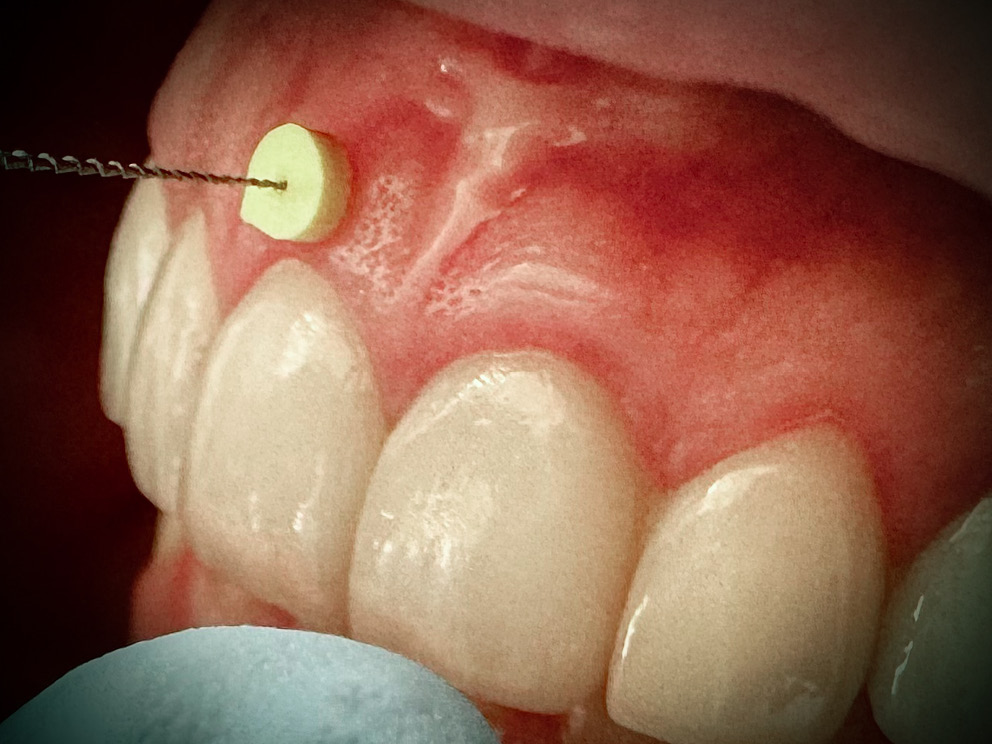
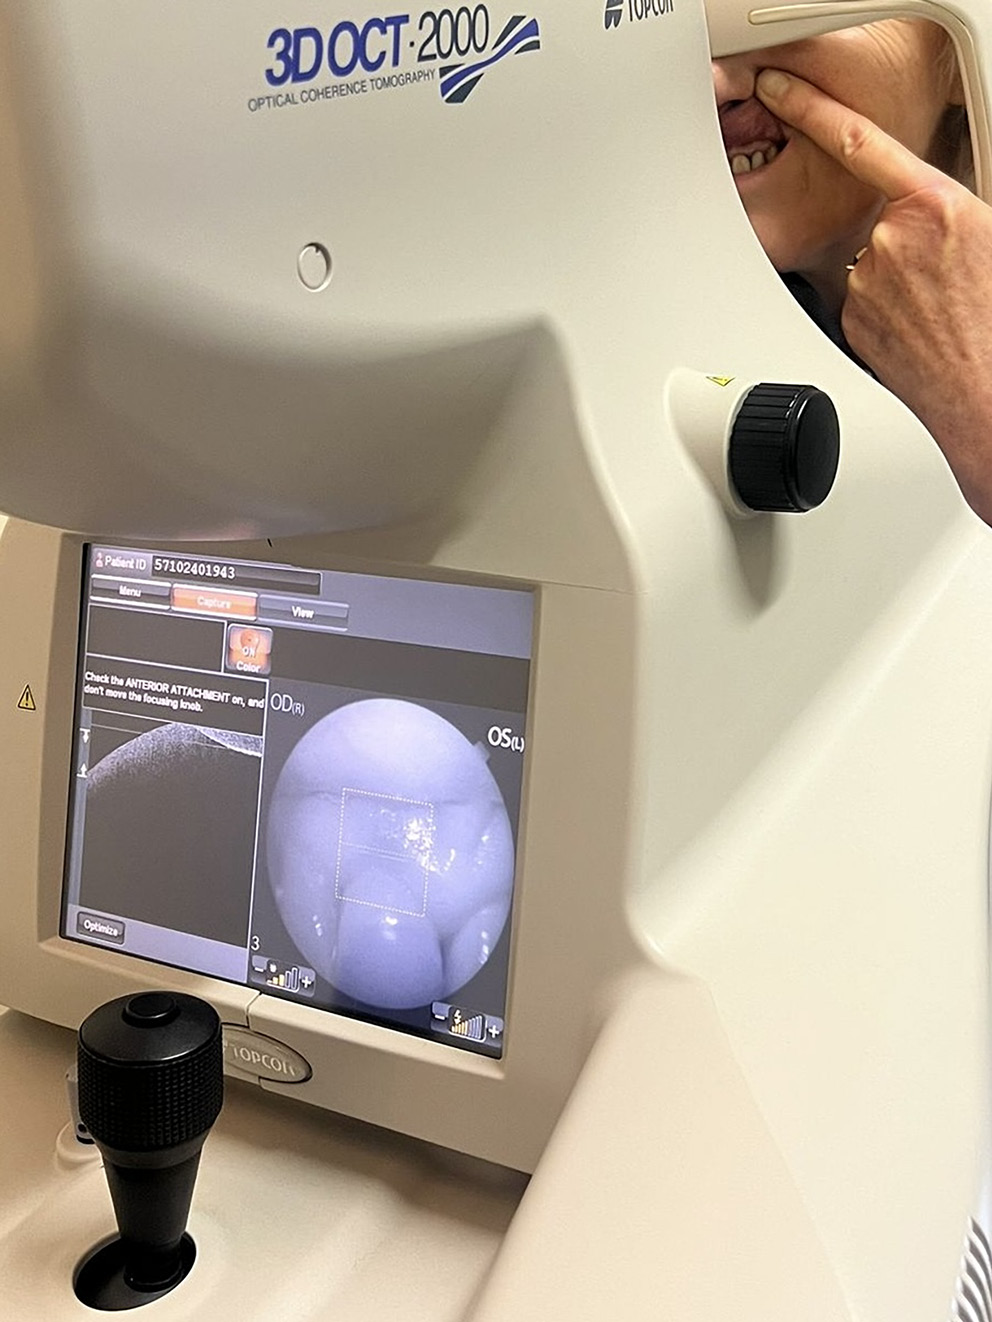
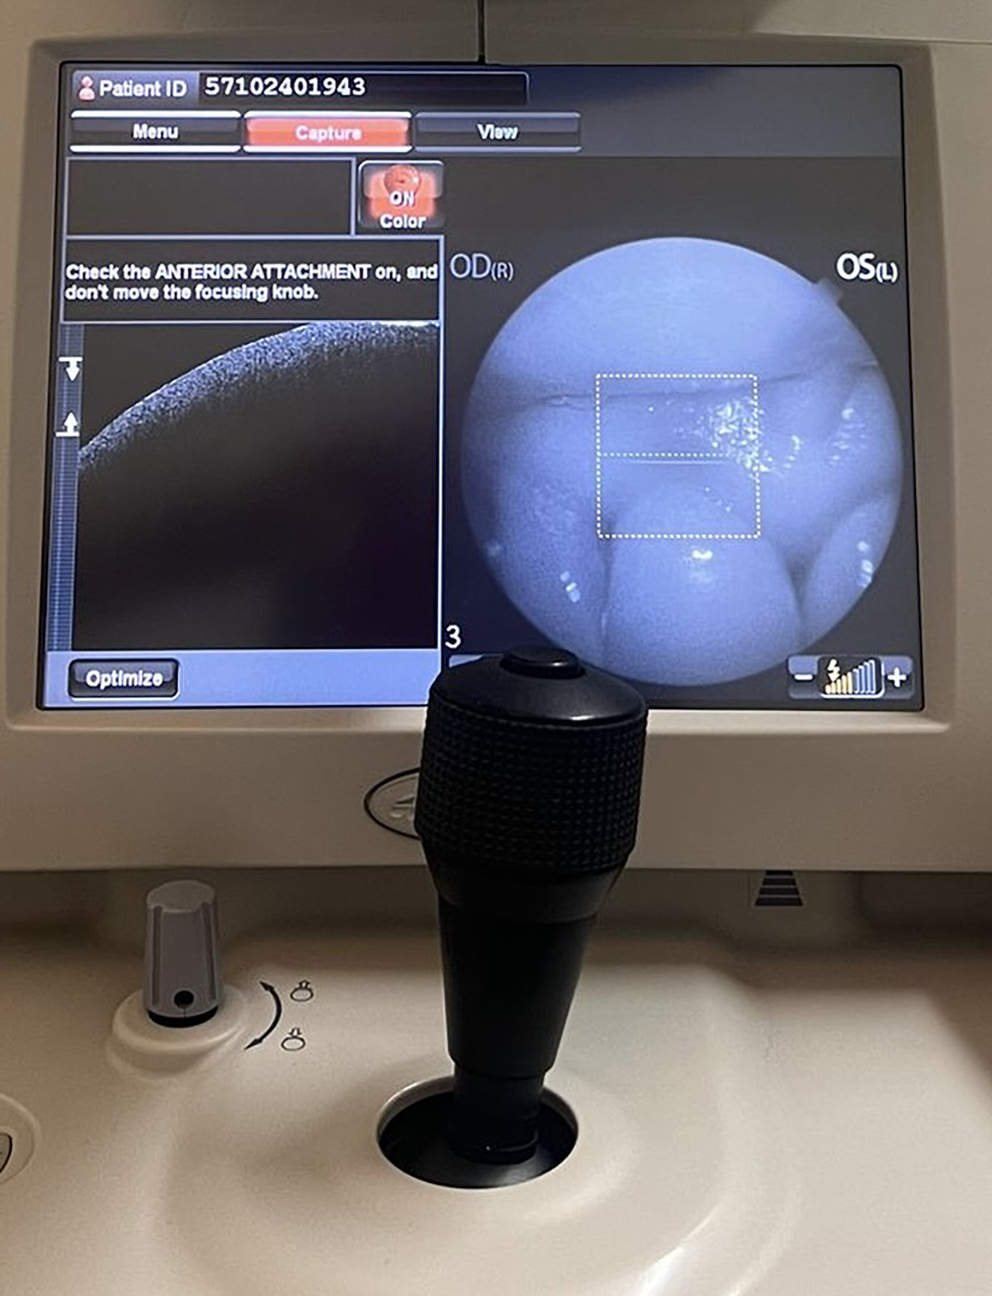
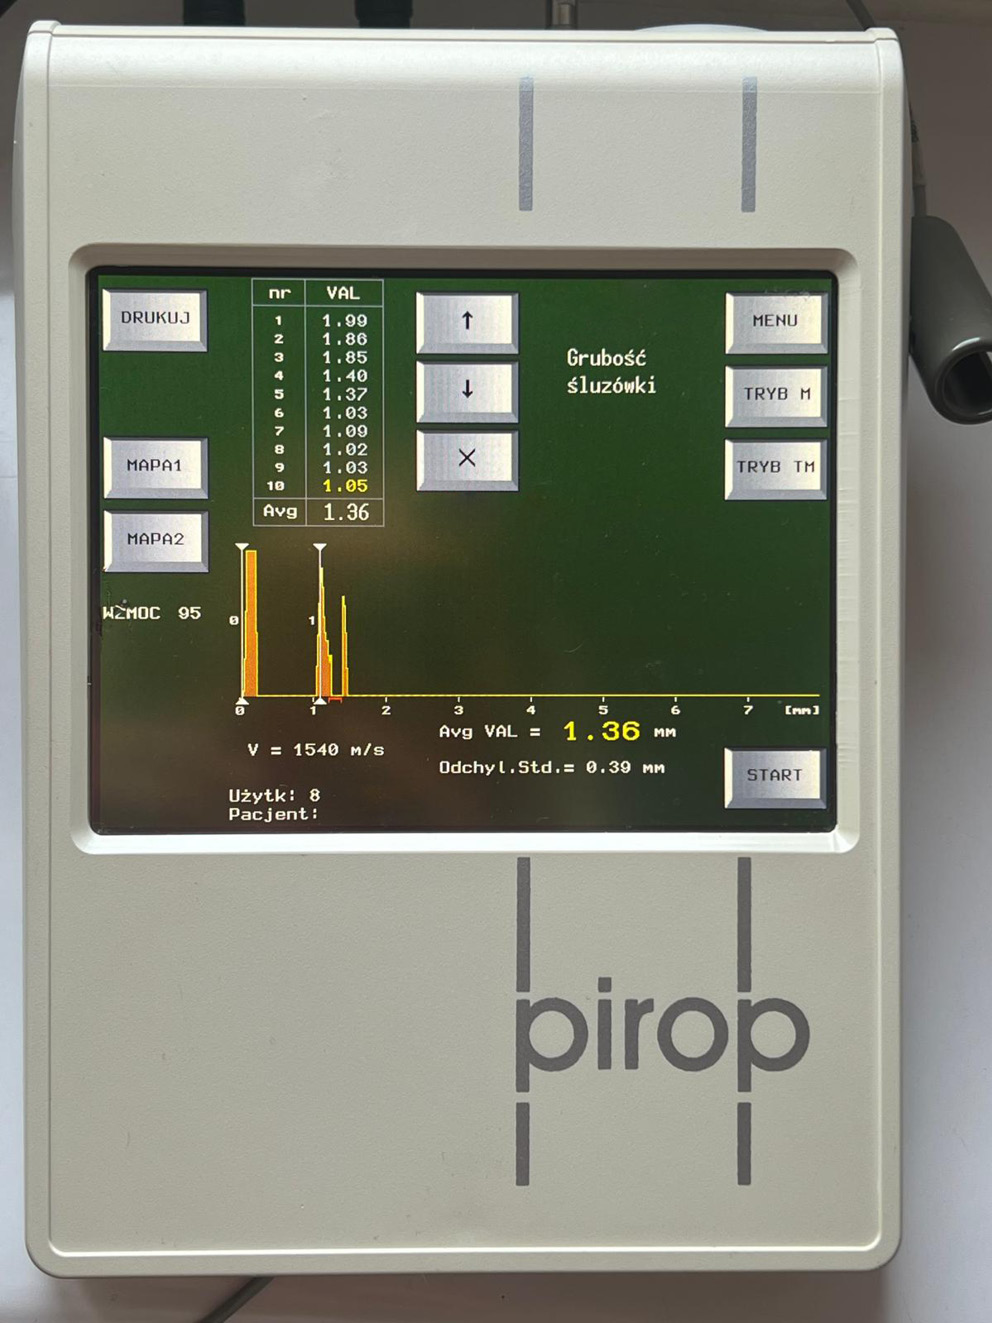
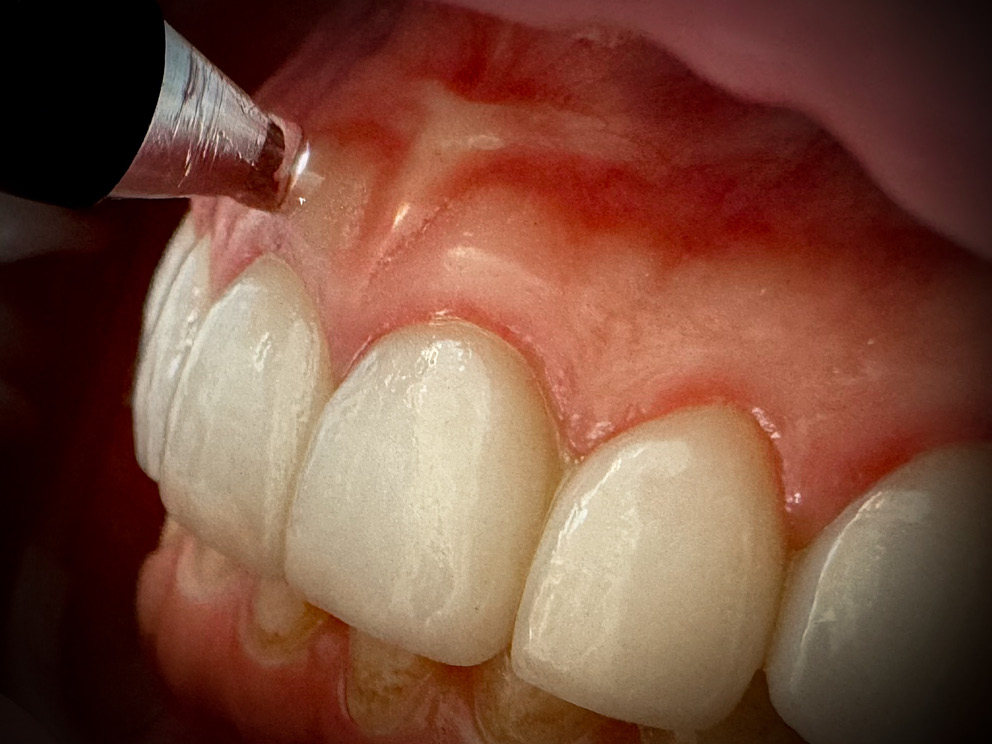
The examined area was the gingival region on the vestibular surface of the maxilla above the right central incisor (tooth 11). To verify calibration of the Pirop® device and measurement accuracy, one researcher assessed the gingival phenotype of another researcher, who also served as the first participant, by measuring tissue thickness using the depth of insertion of an endodontic instrument with a silicone stop (TGP). Penetration depth was read on an endodontic ruler in millimeters (Figure 1). This single-participant comparison served as an initial descriptive agreement check and was not a formal calibration or accuracy validation. The initial comparison using the TGP method in the first participant served as a confirmatory calibration step aimed at verifying the basic accuracy of the Pirop® device. The measurement using the endodontic instrument is shown in Figure 2. The area selected for examination included the attached gingiva centrally above the right central incisor and was defined by a 6 × 6 mm frame (Figure 3). The shape and size of the frame are visible in Figure 4. The tissue thickness obtained from the TGP measurement was compared with Pirop® measurements performed by another physician. Based on this comparison, agreement between the TGP and Pirop® measurements was assessed descriptively in this participant. The Pirop® device and the measurement method are presented in Figure 5 and Figure 6. Pirop® measurements were conducted by 2 operators, whereas OCT imaging and analysis were independently performed by 3 blinded evaluators. To ensure consistency, measurement sets with an standard deviation (SD) > 0.05 mm were repeated. Final values were averaged to improve reliability and minimize operator bias.
The Pirop® device operates at a frequency of 20 MHz, sending a wave at a speed of 1,540 m/s. The wave reflected from the bone or tooth surface returns, and the return path length makes it possible to determine the metric value of GT. The device sends 10 pulses to measure 1 point and calculates the mean value. The device can operate in A-scan mode, which allows measurement of GT at a given point, and in TM mode, which allows recording of GT while moving the probe head. The round probe head, with a diameter of 1.7 mm, enables measurement of GT at several points. The measurement range is from 0.25 to 6.0 mm, with an axial resolution of 0.01 mm (Figure 6).
In the present study, the Pirop® device was used in A-scan mode. The probe head, covered with chlorhexidine gel, was placed on the gingival surface without pressure in a plane perpendicular to the tooth or bone surface. Measurements were performed 3 times above the bone level (subcrestal gingival thickness (SGT)) and on the surface of the bone covering the tooth (crestal gingival thickness (CGT)). At each of these points, the device performed 10 measurements and calculated the mean value. If the SD exceeded 0.05 mm, the measurement was repeated once. The data obtained using the Echo-son device were compared with those obtained using TGP measurements. If the values were similar to the 2nd decimal place, they were considered identical.
Another clinician used an OCT device to image a specific gingival area. The OCT device operated at a wavelength of 840 nm. The acquired OCT images (B-scans) had a resolution of M × N = 884 × 512 pixels (where M denotes the number of rows and N denotes the number of columns), with each pixel covering an area of 5 × 11.7 μm at a color resolution of 8 bits/pixel. For each patient, 128 B-scans (every 47 μm) were obtained, allowing full 3D reconstruction of the gingival image. All data were acquired using the Topcon 3D OCT-2000® system and analyzed in the source formats *.fda and *.fds. Due to technical limitations, raw data could only be accessed and visualized using the proprietary Topcon IMAGEnet software. Therefore, data export in the form of screen-captured images was used to document the results, which accurately represented the acquired scans. The data were anonymized, and the analysis was performed in accordance with the Declaration of Helsinki.
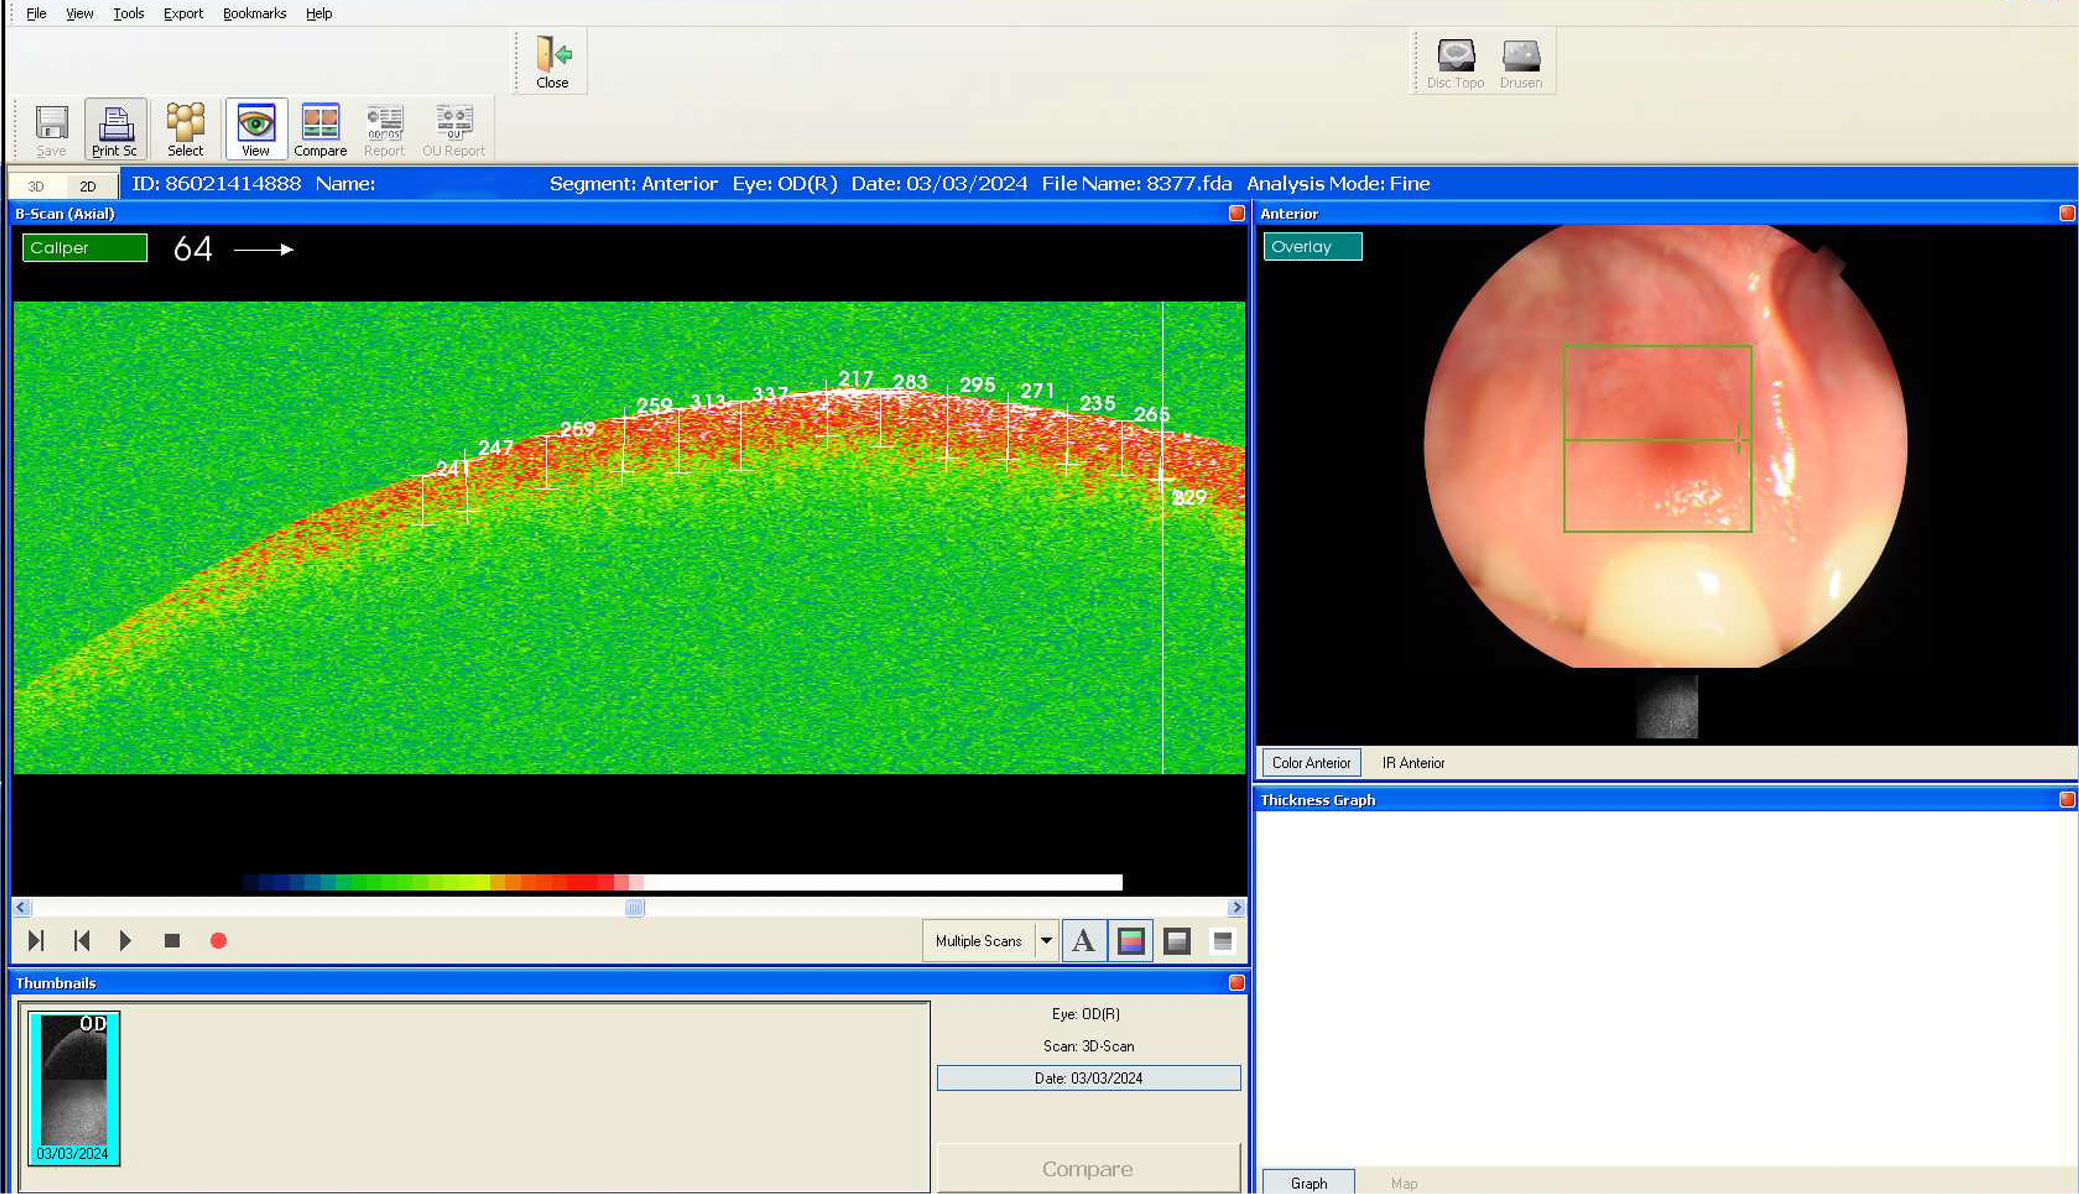
Measurement of epithelial thickness was performed within the measurement area (frame) described above. Within the frame, 2 lines were marked on each scan – upper and lower – along which a minimum of 10 points were selected for epithelial measurements using the Caliper function of the tomography software. The inner surface of the epithelium was considered the boundary between the tissue image and noise, where light did not penetrate deeper and therefore did not produce an image. Examples of the performed measurements are shown in Figure 7. All measurements were averaged, and on this basis the thickness of the gingival epithelium was determined for each patient. Three clinicians independently performed OCT scan measurements to reduce single-examiner dependence. The method of obtaining images with the OCT camera is shown in Figure 4. Three independent examiners, each blinded to the others’ measurements, used the Caliper function of the tomography software to determine epithelial thickness. This approach was implemented to reduce potential inter-operator bias.
Statistical analyses
All analyses were performed using R v. 4.4.0 (R Foundation for Statistical Computing, Vienna, Austria). The statistical strategy followed the Strengthening the Reporting of Observational Studies in Epidemiology (STROBE) recommendations for cross-sectional studies.
Results
Exploratory data screening
Normality of continuous variables (Pirop® thickness and OCT epithelial thickness) was assessed using the Shapiro–Wilk test and confirmed through visual inspection of kernel-density and Q–Q plots. As both variables deviated from normality (p < 0.05) and the sample size was small (n = 13), nonparametric statistical methods were applied throughout.
Descriptive statistics
Continuous outcomes are summarized as medians and interquartile ranges (IQRs) and, where helpful for clinical interpretation, also as means ±SD. Categorical variables are reported as absolute counts and percentages.
Group comparisons
Kruskal–Wallis one-way analysis of variance (ANOVA) by ranks was used to compare Pirop® and OCT thickness across 3 age strata (30–40, 41–50, and 61–70 years). Mann–Whitney U tests were used to assess differences between male and female patients. Effect sizes were reported as η2KW (Kruskal–Wallis) and rank-biserial correlation (rrb; Mann–Whitney), with 95% confidence intervals (95% CIs) estimated through bootstrapping (10,000 resamples).
Correlation analysis
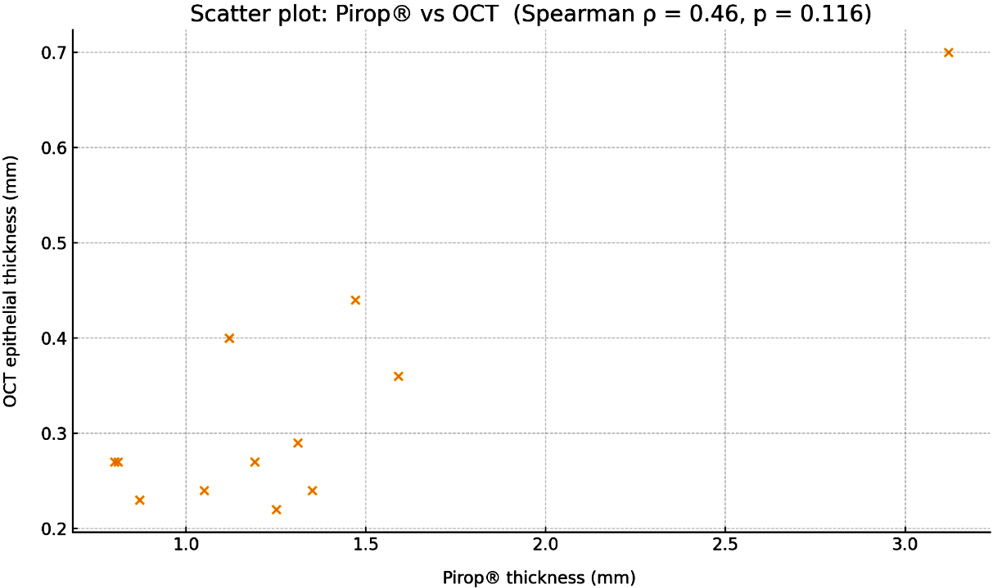
Spearman’s rank correlation coefficient (ρ) was used to examine associations between Pirop® and OCT measures (Figure 8) and their relationship with age (ordinal) and sex (binary coded: M = 0, F = 1). The assumption of monotonicity was verified using locally estimated scatterplot smoothing (LOESS)-fitted scatter plots and inspection of partial residuals. In cases where visual assessment suggested deviation from monotonicity, the correlation results were interpreted cautiously and flagged in the Discussion section. Confidence intervals for ρ were derived using Fisher’s z-transformation.
Statistical significance
Two-sided p-values below 0.05 were considered statistically significant. Given the pilot and exploratory nature of this study, p-values were interpreted in conjunction with effect sizes and CIs.
Sample-size and power considerations
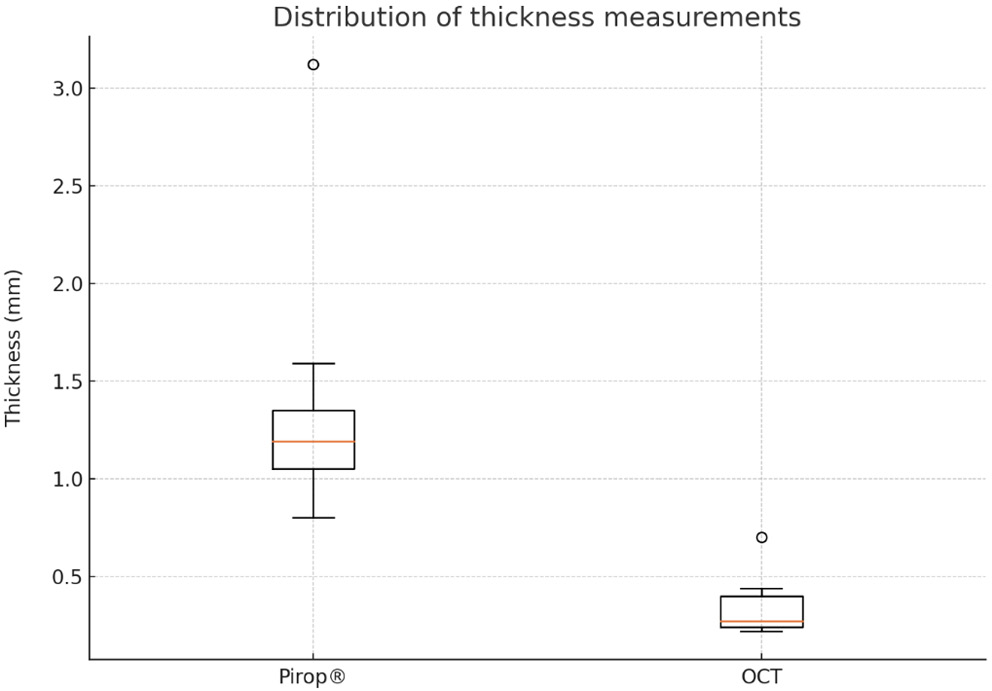
No formal a priori sample-size calculation was conducted because this was a pilot feasibility study. Estimates and CIs should therefore be interpreted as exploratory and imprecise. The thickness of the gingiva and epithelium did not differ significantly by age group or sex (Table 2, Table 3, Table 4, Table 5). Figure 9 shows the overall distribution, whereas Table 2, Table 3, Table 4, Table 5 show age- and sex-based comparisons. Detailed statistical analysis results, including test statistics, p-values, effect sizes, and CIs, are presented in Table 1, Table 2, Table 3, Table 4, Table 5, Table 6, Table 7, Table 8.
Discussion
Given the pilot design and small sample, the results should be interpreted as exploratory and hypothesis-generating rather than confirmatory. The morphometric parameters of the gingiva show significant individual variability. Even within the same patient, they may differ between the maxilla and mandible depending on the tooth type. Previous studies have demonstrated considerable site-related variability in GT. Müller et al. reported that the thickness of the masticatory mucosa varied according to periodontal phenotype, gender, and anatomical location.16 Vandana and Savitha found that facial gingiva in the mandibular anterior region was thinner than that in the corresponding maxillary region.17 Such discrepancies may stem from variations in measurement techniques, the specific sites sampled (anterior vs posterior regions), and ethnic or genetic diversity across populations. Our findings, which did not demonstrate a statistically significant association between epithelial thickness and total GT, could reflect the multifactorial nature of GT determination, encompassing not only epithelial tissue but also connective tissue composition, alveolar bone height, and overall phenotype.
One potential limitation of this study is the small sample size, which reduces the power to detect subtle correlations. In addition, minor differences in operator technique – despite efforts to standardize measurements – could introduce measurement variability. The lack of histological confirmation of epithelial thickness is another limitation. Although OCT has high resolution, its correlation with true histological thickness can be influenced by factors such as signal penetration and scatter.
According to some authors, the thick gingival phenotype is found in approx. 85% of the population, whereas the thin phenotype occurs in 15%.18 Others, however, have demonstrated that a thin phenotype may be present in as many as 30% of individuals.19 Similar results (77% thick and 23% thin) were obtained in our study. It is believed that variability in this respect may be influenced by race, genetic predisposition, age (the younger the individual, the thicker the gingiva), and sex.17 Rasool et al. demonstrated that the thin periodontal biotype is 4.2 times more common in women than in men, and thin gingiva is 5 times more common in the mandibular incisor region.20
In our study, we did not detect statistically significant differences in periodontal phenotype by age group or sex. To date, the correlation between gingival and epithelial thickness has not been investigated; therefore, this issue was addressed in the present study. The above tests were designed to assess the thickness of horizontal gingival tissue around the maxillary incisors and to develop a method enabling precise measurement of gingival epithelial thickness and its percentage relative to the entire tissue. The estimated association between epithelial thickness and total GT was positive but imprecise (Spearman’s ρ = 0.458, 95% CI: −0.125 to 0.806; p = 0.116). Because the CI was wide and included zero, the study cannot establish either independence or a definite association. It can be concluded that within the thin and thick phenotypes, there may be subtypes with greater or smaller epithelial thickness. These preliminary findings suggest that “proportion of epithelial thickness within total GT may vary within both thin and thick phenotypes. We hypothesize that within each phenotype, there may exist subtypes with differing epithelial thickness, a concept that warrants further investigation in larger, histologically validated studies. Histological studies may enable identification of these subtypes. It is known that the thicker the epithelial layer, the greater the tissue resistance to mechanical damage or water loss. This could explain why some patients with a thin phenotype (and similar hygiene habits) experience recessions, whereas others do not. This issue is certainly worth exploring. Given the small sample size, the results should be interpreted as preliminary and descriptive rather than confirmatory. The study was not powered to detect small or moderate effects, which increases the risk of type II error. Additionally, heterogeneity in age and phenotype may further limit the generalizability of the findings to broader populations.
Importantly, OCT provides images of tissue sections in a non-contact and noninvasive manner. The device measures the time delay and intensity of light scattered or reflected from biological tissues, resulting in tomographic imaging of their internal structure. This is achieved by scanning tissues at resolutions ranging from 1 to 15 µm. Therefore, real-time in situ tissue imaging is possible without the need for biopsies, histological procedures, or X-rays, allowing OCT to be used in many fields of medicine. In dentistry, studies using OCT focus primarily on the early diagnosis of caries,21 assessment of dental fillings,22 analysis of enamel thickness,23 and, increasingly, assessment of periodontal tissues.24 The possibility of using OCT in the diagnosis of oral mucosa and epithelium has been described in several studies.25, 26, 27, 28, 29 So far, only imaging capabilities, i.e., lesion screening, have been described. However, correct assessment of the scan requires knowledge of the ultrastructural images of the tissue.30 In normal tissue, the epithelial layer is always hyporeflective (except for the keratinized layer). The lamina propria is always hyperreflective, with various internal non-reflective areas. The difference between these 2 degrees of reflectance allows estimation of the position of the basal membrane.
The authors of the study aimed to assess the feasibility of performing measurements of the examined tissue and to analyze the reliability of the obtained measurements by comparing the results with those obtained using another device. For the authors, it was important to present an innovative approach to oral mucosa diagnostics and measurements. So far, no device has been available that can noninvasively and independently measure epithelial thickness as well as the thickness of the subepithelial connective tissue. To overcome this limitation, fusion of 2 noninvasive methods was proposed. The thickness of the subepithelial tissue is crucial when selecting a donor site during connective tissue transplantation procedures at the recipient site around the tooth, and it varies from person to person. So far, the Pirop® device has been used for noninvasive measurements, and its reliability, demonstrated in the article by Gánti et al.,14 formed the basis of the authors’ methodology. Currently, the main limitation of OCT imaging is the lack of reliable studies analyzing the capabilities of OCT devices, which have limited imaging depth.31 Another limitation is that OCT requires considerable skill and experience from both the operator and the individual analyzing the scans and performing the measurements.
Knowledge of gingival epithelial thickness may be important in diagnostics before mucogingival surgery, particularly in assessing the quality of harvested gingival grafts. Various types of grafts have been described for the surgical treatment of gingival recession, including free gingival grafts (FGG), connective tissue grafts (CTG), and deepithelialized free gingival grafts (DFGG). In a 1-year randomized clinical trial (RCT), Ripoll et al. assessed late complications following the use of CTGs and DFGGs combined with coronally advanced flap procedures (CTG + CAF and DFGG + CAF). The authors identified re-epithelialization of the graft, epithelial bands, cul-de-sac formation, epithelial cysts, and bone exostoses as major late complications associated exclusively with the use of DFGGs. Minor late complications included gingival color changes and superficial revascularization, which were significantly more frequent with the DFGG + CAF method compared with CTG+CAF.32 The use of DFGGs allows for greater width of keratinized gingiva because the connective tissue from the deeper palatal layers used in CTGs does not possess the full potential to induce epithelial cell keratinization.33
The thickness of the gingival epithelium at the recipient site may potentially influence postoperative complications following gingival recession coverage procedures. The possibility of assessing gingival epithelial thickness before surgery using DFGGs may influence appropriate graft preparation immediately after harvesting, including the depth of de-epithelialization and selection of the recipient site. Further research in this area is necessary, and the OCT method may prove helpful. Although the method shows potential, further validation in larger, standardized cohorts is required before clinical applicability can be established. Current findings are preliminary and should be confirmed in adequately powered prospective studies.
Limitations of the study
Study limitations include the small sample size, which yielded imprecise estimates and limited generalizability. However, the small sample size may limit the generalizability of our findings and reduce the power to detect moderate associations or subgroup differences. Another limitation is the use of OCT without a dental head, which would make it possible to examine other gingival areas. In addition, minor differences in operator technique – despite efforts to standardize measurements – could introduce measurement variability. The lack of histological confirmation of epithelial thickness is another limitation. Although OCT has high resolution, its correlation with true histological thickness can be influenced by factors such as signal penetration and scatter. Additionally, the lack of a formal training protocol for interpreting OCT images – despite efforts to standardize measurements – could introduce inter-observer variability, which could influence the accuracy and reproducibility of the measurements. Further studies are needed to address these issues. Moreover, the presence of subclinical inflammation might have affected local tissue thickness. Even though patients did not exhibit any clinical signs of periodontal disease, subclinical edema cannot be entirely ruled out and may slightly alter thickness measurements. Future studies with a larger patient cohort, possibly including multiple tooth regions (anterior vs posterior, maxilla vs mandible), and employing histological validation in cases where tissue samples are available, would help clarify the interplay between epithelial thickness and overall GT.
Although visual inspection using LOESS curves was performed, the possibility of non-monotonic relationships cannot be ruled out because of the small sample size. This may affect the reliability of correlation results and warrants cautious interpretation.
Conclusions
Our pilot study demonstrated the feasibility of obtaining total gingival and epithelial thickness measurements using ultrasound and OCT, respectively. The association estimate was imprecise and does not establish the absence of a relationship between epithelial thickness and total GT. The concept of multimodal imaging has already been clinically validated in other specialties,15 and the combined use of noninvasive ultrasound and OCT in periodontology could be refined and applied on a larger scale to enhance diagnostic accuracy and clinical treatment planning for various periodontal and implantology procedures. Although the combined use of OCT and ultrasound may improve diagnostic insight, its clinical value remains theoretical at this stage. Larger studies are needed before the method can be reliably incorporated into clinical decision-making. The present results serve as a foundation for further investigation.
There was no statistically significant correlation between total GT and epithelial thickness. These findings suggest that future classifications of gingival phenotypes might benefit from considering epithelial and connective tissue components separately, rather than relying solely on overall thickness measurements. Optical coherence tomography imaging of the epithelium may serve as a diagnostic tool complementing the data obtained from the Echo-son device, which measures horizontal tissue thickness over the bone without differentiation into histological structures.
By correlating the results obtained using OCT with those obtained using the Echo-son device, it may be possible to estimate epithelial thickness as a proportion of total GT (ET/GT) and estimate subepithelial thickness as GT−ET, subject to spatial co-registration and validation. This approach may enhance pre-surgical planning by providing a more nuanced understanding of tissue composition, especially when selecting graft donors or evaluating the likelihood of recession relapse.
Combining both imaging methods and using an OCT dental head would make it possible to assess connective tissue on the palate, perform its overall measurement, and, after subtracting the measured epithelial thickness, determine the thickness of the graft that can be harvested from a given donor site. Application of this method, or rather the combination of these 2 diagnostic methods, may improve the predictability of periodontal surgery and assessment of the donor site, which is often a weak point during the procedure.
Further research is important in the context of the development and availability of dental OCT devices that could be implemented in clinical practice. In periodontal surgery, precise data on epithelial thickness would enable the selection or development of new surgical tools appropriately adjusted in terms of blade thickness to epithelial thickness.
Data Availability Statement
We would like to clarify that the OCT data were recorded and processed using the manufacturer’s dedicated software (Topcon IMAGEnet), which generates and stores images in device-specific formats. Unfortunately, export of raw data in this format prevents reading or analysis outside this software and is limited by the technical specifications of the system. During our study, OCT image analysis was performed directly in Topcon’s dedicated software. Screenshots were used as a form of data export to document the results. The images faithfully represent the obtained results and were not edited other than removal of patient-identifying information (first and last names) for anonymization in accordance with the Declaration of Helsinki. The Pirop® device is a manual diagnostic tool designed to measure soft-tissue thickness in dental procedures. Its design does not allow data recording, storage, or digital transmission. Due to the lack of an electronic data-storage function, all measurements must be manually recorded by the operator. As a result, it is not possible to generate or provide measurement records directly from the device. We have included all of this information in the manuscript to improve clarity and provide transparency regarding the limitations of the devices.
Consent for publication of personal information
Not applicable.
Use of AI and AI-assisted technologies
Not applicable.