Abstract
Background. Childhood sleep disorders are common and are associated with family- and diet-related factors, such as parental snoring and unhealthy eating habits. However, culturally relevant studies remain limited, and existing research often overlooks weak correlations in large populations.
Objectives. This study aimed to identify family- and diet-related risk factors for childhood sleep disorders in a Chinese population and to provide insights for prevention.
Materials and methods. A cross-sectional study was conducted in Jinan, China, between January 2022 and December 2023, enrolling 845 children aged 1–7 years through convenience sampling. Sleep disorders were defined based on parent-reported symptoms (mouth breathing, habitual snoring, apnea, or gasping) using a validated questionnaire. Demographic, family, and dietary factors were collected. Associations were analyzed using multivariable logistic regression with stepwise selection based on the Akaike information criterion (AIC), adjusted for age, with subgroup analyses according to age (1–3, 4–5, and 6–7 years). Statistical significance was set at p < 0.05.
Results. Among the 845 children (mean age: 5.2 years), 192 (22.7%) had sleep disorders. Multivariable analysis showed that parental snoring (father: odds ratio (OR) = 2.20, 95% confidence interval (95% CI): 1.44–3.41; mother: OR = 1.76, 95% CI: 1.15–2.66), maternal education at the associate degree level (OR = 2.58, 95% CI: 1.27–5.66) or bachelor’s degree level (OR = 2.44, 95% CI: 1.21–5.29), and children’s preferences for fried foods (OR = 6.49, 95% CI: 2.51–17.40), meat (OR = 2.19, 95% CI: 1.43–3.35), and sweets (OR = 2.15, 95% CI: 1.31–3.51) were significant risk factors. Moderate sweet consumption (1–2 times/week: OR = 0.53, 95% CI: 0.29–0.95; 3–5 times/week: OR = 0.51, 95% CI: 0.27–0.94) was associated with a protective effect compared with daily consumption.
Conclusions. Childhood sleep disorders were significantly associated with parental snoring, higher maternal educational attainment, and children’s preferences for fried foods, meat, and sweets, whereas moderate sweet consumption appeared to have a protective effect.
Key words: risk factors, dietary habits, childhood sleep disorders, parental snoring, maternal education
Background
Childhood sleep disorders are a common and significant health concern, affecting 20–30% of children globally, with even higher rates observed in preschool-aged populations.1 Characterized by symptoms such as snoring, mouth breathing, and difficulty initiating or maintaining sleep, these disorders compromise not only sleep quality but also cognitive, emotional, and behavioral development.2 Sleep disturbances are also associated with physical health risks, including impaired growth, weakened immune function, obesity, and cardiovascular problems.3, 4
Although a growing body of literature highlights the multifactorial nature of childhood sleep disorders, many studies inadequately address modifiable risk factors, particularly within culturally specific contexts. Family environment and dietary habits have emerged as influential determinants. Parental snoring, educational attainment, and psychological health have been consistently associated with childhood sleep outcomes.5, 6 For instance, several large-scale studies have confirmed the association between parental snoring and children’s sleep-disordered breathing (SDB). Kaditis et al.7 identified parental snoring and passive smoking as significant risk factors for SDB in a Greek pediatric population. Similarly, Li et al.8 and Katila et al.9 reported associations between parental snoring and habitual snoring in children across different age groups. Socioeconomic factors, including parental education and household income, have also been implicated in children’s sleep health.10
Dietary behavior plays a similarly important role. High consumption of sweets and fried foods, as well as irregular eating habits, has been shown to negatively affect sleep, whereas healthier dietary patterns rich in vegetables and protein may improve sleep quality.11, 12, 13 However, existing studies are often fragmented, lack a systematic framework, or yield inconsistent findings across different populations.
Moreover, while large sample sizes improve statistical power, they may also increase the likelihood of detecting weak associations with limited clinical relevance. This highlights the need for cautious interpretation of findings derived from large-scale studies.
To address these limitations, the present study draws upon Bronfenbrenner’s Bioecological Model, which emphasizes the interplay between individual biological characteristics and microsystem-level influences, such as family behaviors and daily routines. Within this framework, parental snoring, educational attainment, and dietary practices are considered proximal factors that may influence children’s sleep through both direct and indirect mechanisms.
Objectives
This study aimed to conduct a systematic analysis of family- and diet-related risk factors for childhood sleep disorders among children aged 1–7 years. We hypothesized that parental snoring, parental educational attainment, and children’s dietary preferences (including preferences for meat, sweets, and fried foods) would be associated with an increased risk of sleep disorders. These variables were selected based on existing evidence suggesting their influence on sleep health. By identifying potentially modifiable risk factors, this study sought to provide targeted and culturally relevant insights for early prevention.
Materials and methods
Study design and setting
This cross-sectional observational study was conducted between January 2022 and December 2023 in Jinan, China. Participants were recruited through convenience sampling from the Department of Otolaryngology at the Affiliated Hospital of Shandong University of Traditional Chinese Medicine, a large tertiary-care hospital, and its affiliated community health service center. This region was selected because of its diverse urban population and accessibility to pediatric outpatient services. A cross-sectional design was chosen to examine associations between sleep-related symptoms and family- and diet-related factors at a single point in time.
The study protocol was approved by the Ethics Committee of the Affiliated Hospital of Shandong University of Traditional Chinese Medicine (approval No. AF/SC-08/02.0). Written informed consent was obtained from the parents or legal guardians of all participating children prior to data collection. All procedures were conducted in accordance with the Declaration of Helsinki.
Sample size and sampling method
Convenience sampling was used to enroll children aged 1–7 years who attended outpatient clinics for routine consultations or health check-ups during the study period. The sample size of 845 participants was determined based on the expected patient flow and logistical feasibility. No formal sample size or statistical power calculation was performed due to the exploratory nature of the study. Participants were recruited consecutively to minimize sampling bias. No stratification or matching procedures were applied.
However, the use of convenience sampling introduces the potential for selection bias, as participants were limited to children seeking medical care or attending health check-ups at specific facilities and may therefore not be representative of the general pediatric population. Families with greater health awareness or particular socioeconomic characteristics may have been overrepresented, potentially influencing dietary and sleep-related findings. Furthermore, because recruitment was conducted in a single city, regional cultural and dietary patterns may limit the generalizability of the findings to other areas of China.
Participants
Children were eligible for inclusion if they were aged 1–7 years and were accompanied by a parent or legal guardian who provided informed consent for participation. Exclusion criteria included congenital malformations, neurological or developmental disorders (e.g., epilepsy or autism spectrum disorder (ASD)), chronic respiratory diseases, and any medical conditions that could affect growth or sleep. Eligibility was assessed by trained pediatric clinicians before questionnaire administration.
Children were classified as having sleep disorders if they exhibited 1 or more parent-reported symptoms, including mouth breathing during sleep, habitual snoring, apnea, or gasping for breath. Children without these symptoms were classified as not having sleep disorders. Classification was based on caregiver reports referring to the previous month and was consistent with established pediatric sleep disorder screening protocols.
Data sources and measurement
Data were collected using a structured parent-reported questionnaire developed on the basis of previously validated instruments used in pediatric sleep research. The 34-item questionnaire assessed: 1) demographic characteristics; 2) family environment (e.g., parental snoring and educational attainment); 3) dietary behaviors (e.g., food preferences and consumption frequency); and 4) sleep-related symptoms.
The questionnaire was developed with reference to Chinese dietary recall surveys and pediatric sleep screening tools. A pilot study involving 50 participants yielded a Cronbach’s alpha coefficient of 0.83, indicating good internal consistency. Content validity was assessed and confirmed by 2 pediatric sleep specialists. The questionnaires were completed on-site under the supervision of trained staff to ensure completeness, and any ambiguous responses were clarified in real time.
Statistical analyses
Descriptive statistics were used to summarize all variables. Quantitative data were expressed as mean ± standard deviation (SD) for normally distributed variables and as median (interquartile range (IQR)) for non-normally distributed variables. Qualitative data were summarized as frequencies and percentages.
The normality of continuous variables was assessed using the Kolmogorov–Smirnov test with Lilliefors correction, supplemented by visual inspection of histograms and normal quantile-quantile (Q-Q) plots, in accordance with the journal’s statistical guidelines. Skewness values were also calculated to provide additional confirmation. The results of the normality tests for each variable and subgroup are presented in Supplementary Table 1. For correlation analyses, Pearson’s correlation coefficient (r) was used for continuous variables, whereas Kendall’s tau-b correlation coefficient was applied to ordinal dietary frequency variables (e.g., fruit, vegetable, seafood, fried food, sweet, and beverage consumption frequencies).
Baseline characteristics were reported for the overall study population and further stratified according to sleep disorder status (sleep disorder group vs non-sleep disorder group). Group comparisons were performed using independent-samples t-tests for normally distributed continuous variables and Mann–Whitney U tests for non-normally distributed continuous variables. Categorical variables were compared using the χ2 test or Fisher’s exact test, as appropriate.
To identify independent risk factors for childhood sleep disorders, multivariable logistic regression analysis was performed. All candidate predictors were initially entered into the model, and variable selection was conducted using a stepwise procedure based on the Akaike information criterion (AIC), retaining variables that minimized the AIC to achieve an optimal balance between model fit and parsimony. No predefined AIC threshold was applied. The selection procedure was terminated when neither the addition nor removal of any variable resulted in a further reduction in the AIC. Univariate analyses were conducted for descriptive purposes only (Supplementary Table 2) and were not used for inferential analyses. Given the wide age range of the participants (1–7 years), 2 complementary approaches were applied:
1. Age was included as a continuous covariate in the main multivariable model (Supplementary Table 3), allowing the assessment of independent effects while adjusting for other predictors.
2. Subgroup analyses stratified by age group (1–3, 4–5, and 6–7 years) were conducted as a sensitivity analysis to examine age-specific effects (Supplementary Table 4).
Model assumptions and diagnostics were evaluated as follows:
– Multicollinearity was assessed using the variance inflation factor (VIF), with VIF values >5 considered indicative of collinearity.
– The goodness-of-fit of the final model was assessed using the Hosmer–Lemeshow test, Nagelkerke R2, and Cox and Snell R2. Model discrimination was evaluated using the concordance index (C-index).
Potential confounders, such as screen time, family stress, and housing conditions, were not measured, which represents a limitation of this study. All statistical analyses were conducted using IBM SPSS Statistics v. 24.0 (IBM Corp., Armonk, USA) and R v. 4.2.0 (R Foundation for Statistical Computing, Vienna, Austria), with RStudio 2025.05.1+513 used as the integrated development environment. SPSS was primarily used for descriptive statistics and group comparisons, whereas R was employed for multivariable logistic regression modeling, variable selection using the AIC, and diagnostic testing. Statistical significance was defined as a 2-tailed p <0.05.
Results
Basic characteristics of the sample
Table 1 presents the basic characteristics of the study sample, including age, height, weight, body mass index (BMI [kg/m2]), sex, and sleep disorder status among the 845 participating children. The mean age was 5.24 ±1.13 years, mean height was 111.75 ±9.53 cm, mean weight was 19.99 ±4.78 kg, and mean BMI was 15.89 ±2.39 kg/m2. The sample comprised 476 boys (56.33%) and 369 girls (43.67%).
Regarding sleep disorder status, 192 children (22.72%) were classified as having sleep disorders, whereas 653 (77.28%) were classified as not having sleep disorders. These findings indicate that a substantial proportion of children experienced sleep-related symptoms. No significant demographic differences were observed between the groups.
Group comparisons between children with and without sleep disorders
A total of 845 children were included in the analysis, of whom 192 (22.7%) were classified as having sleep disorders. Associations between family- and diet-related factors and childhood sleep disorders are summarized in Table 2.
Continuous variables
No significant differences were observed in age, height, weight, or BMI between children with and without sleep disorders (all p > 0.05). Correlation analyses likewise revealed only weak associations, with all correlation coefficients close to zero (|r| < 0.06).
For categorical variables, most associations were also weak, with the largest effect observed for dietary preferences (r = 0.132). Similarly, for dietary frequency variables, Kendall’s tau-b correlation coefficients indicated only weak associations (|τb| ≤ 0.11).
Family factors
Among the categorical family variables, child sex was not significantly associated with sleep disorders (odds ratio (OR) = 0.79, 95% confidence interval (95% CI): 0.56–1.11, p = 0.103). A history of COVID-19 infection was also not significantly associated with sleep disorders (OR = 0.64, 95% CI: 0.41–0.99, p = 0.116). Parental obesity showed no consistent association with childhood sleep disorders: paternal obesity was not significant (OR = 0.63, 95% CI: 0.44–0.90, p = 0.159), whereas maternal obesity demonstrated a borderline association (OR = 0.88, 95% CI: 0.57–1.35, p = 0.055). Cohabitant smoking and mode of delivery were likewise unrelated to childhood sleep disorders. Similarly, preterm birth was not significantly associated with sleep disorders (OR = 1.01, 95% CI: 0.49–2.11, p = 0.999).
In contrast, parental snoring emerged as a significant predictor. Paternal snoring was associated with lower odds of childhood sleep disorders (OR = 0.43, 95% CI: 0.28–0.65, p < 0.001), and a similar inverse association was observed for maternal snoring (OR = 0.60, 95% CI: 0.40–0.89, p < 0.001). Moreover, both maternal and paternal educational attainment were positively correlated with childhood sleep disorders (r = 0.080 and r = 0.092, respectively; p < 0.05), suggesting that higher parental education may be associated with an increased likelihood of reporting or identifying sleep disorders in children.
Infant feeding and early nutrition
Feeding method (breastfeeding, mixed feeding, or formula feeding) was not significantly associated with childhood sleep disorders (p = 0.589). Likewise, breastfeeding duration (≤6 months vs >6 months) was not significantly associated with sleep disorders (p = 0.305, r = −0.035).
Dietary preferences and intake frequency
Dietary patterns showed marked differences between children with and without sleep disorders. Children with sleep disorders were more likely to report preferences for meat (28.6% vs 18.8%) and sweets (21.9% vs 13.9%) than children without sleep disorders (p < 0.001, r = 0.132). The frequencies of fruit consumption (p = 0.004, τb = −0.100), seafood/beef/lamb consumption (p = 0.001, τb = −0.094), and vegetable consumption (p = 0.004, τb = −0.109) were significantly associated with sleep disorders, suggesting that lower consumption of these food groups was associated with a higher prevalence of sleep disturbances. In contrast, the frequencies of fried food, sweet, and carbonated drink consumption did not show robust associations with sleep disorders (all p > 0.05, |τb| ≤ 0.064). However, children with sleep disorders tended to consume sweets more frequently (p = 0.011, τb = 0.010).
Multivariate logistic regression analysis
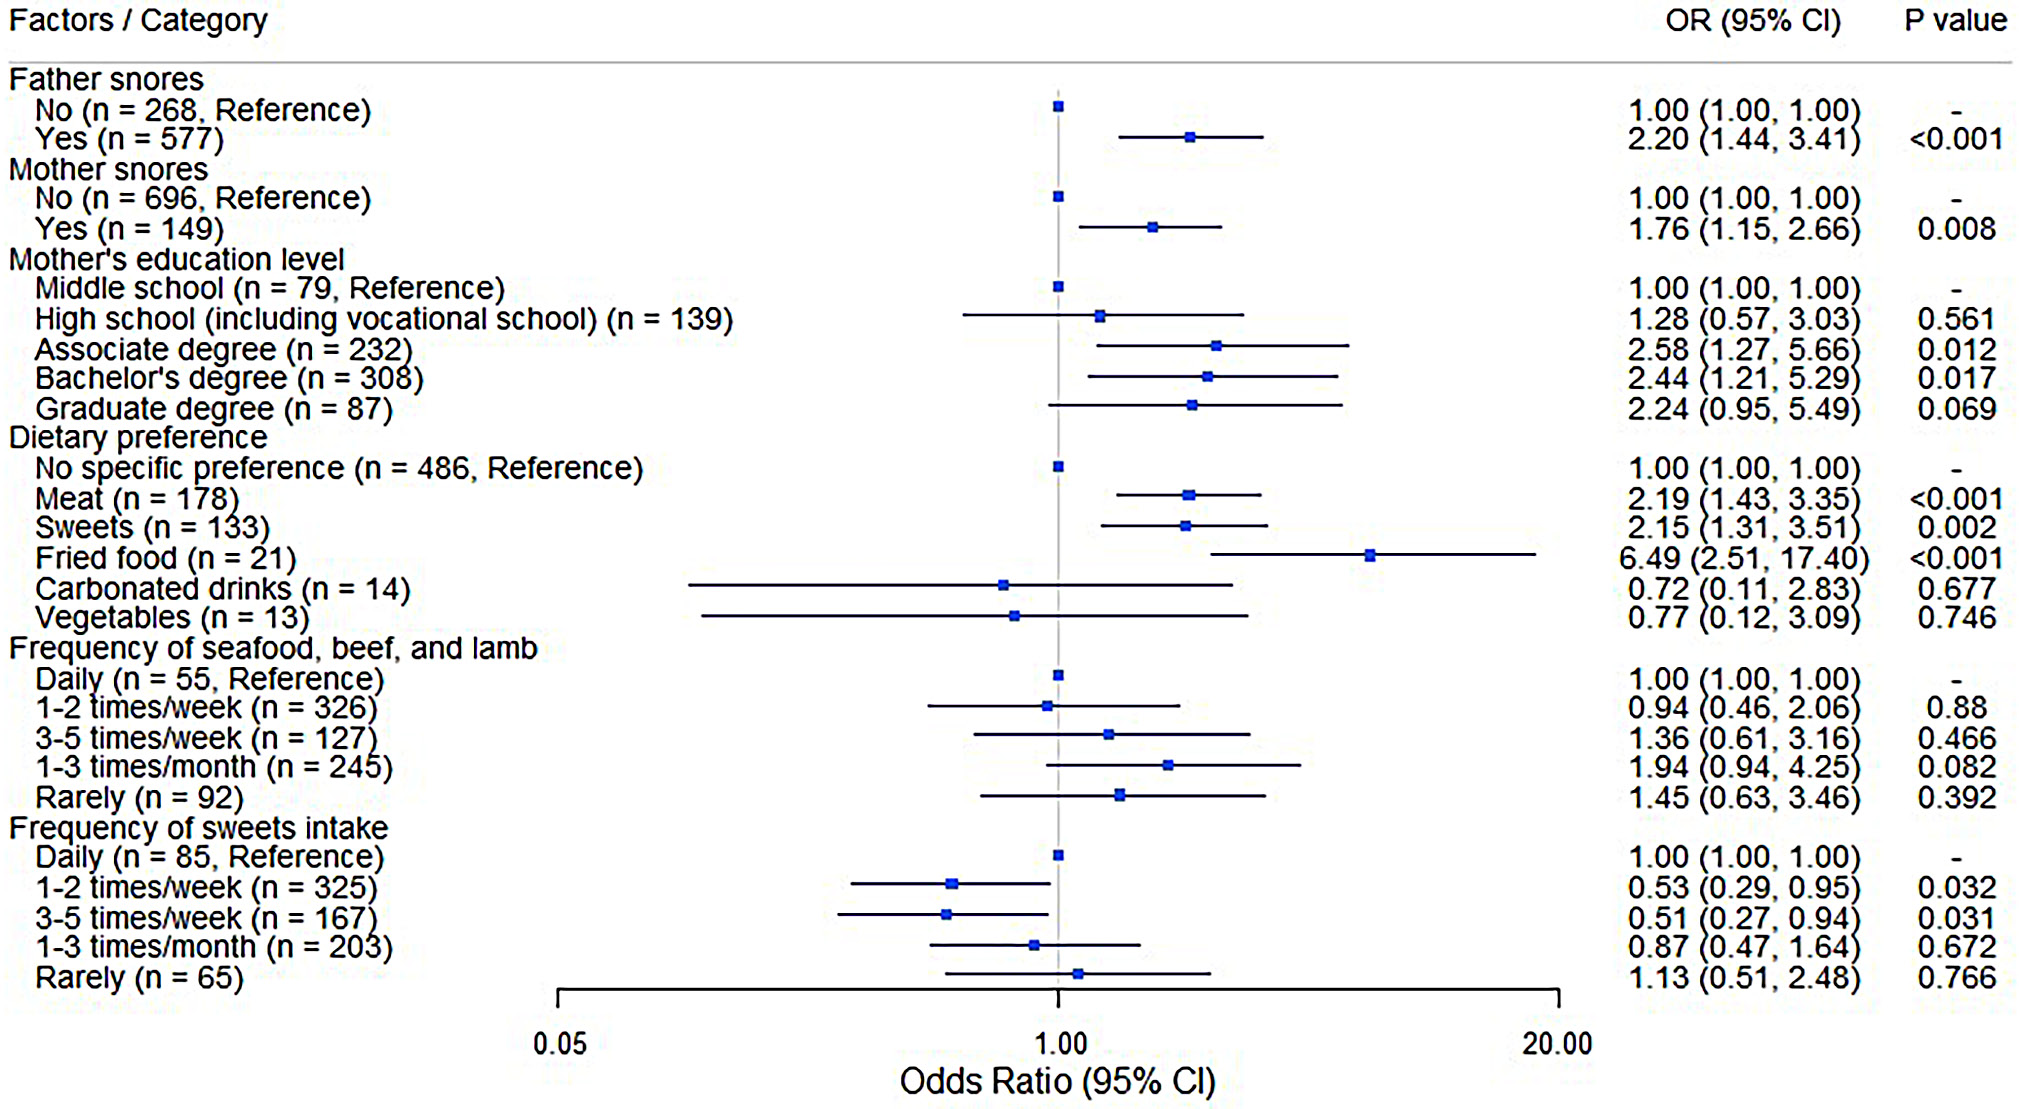
Candidate variables identified in the univariate analyses (Supplementary Table 2) were entered into a multivariable logistic regression model. Variable selection was performed using the AIC. The final model (Table 3, Figure 1) explained 16.7% of the variance in childhood sleep disorders (Nagelkerke R2 = 0.167; Cox and Snell R2 = 0.110).
Parental snoring was independently associated with an increased risk of childhood sleep disorders. Children whose fathers snored had more than twice the odds of developing sleep disorders compared with those whose fathers did not snore (OR = 2.20, 95% CI: 1.44–3.41, p < 0.001). Maternal snoring was also identified as a significant predictor (OR = 1.76, 95% CI: 1.15–2.66, p = 0.008).
Higher maternal educational attainment was associated with an increased risk of childhood sleep disorders. Compared with mothers who had completed only middle school education, a high school education was not significantly associated with sleep disorders (OR = 1.28, 95% CI: 0.57–3.03, p = 0.561). In contrast, children of mothers with an associate degree (OR = 2.58, 95% CI: 1.27–5.66, p = 0.012) or a bachelor’s degree (OR = 2.44, 95% CI: 1.21–5.29, p = 0.017) had more than twice the odds of sleep disorders. A similar trend was observed for graduate-level education (OR = 2.24, 95% CI: 0.95–5.49, p = 0.069), although this association did not reach statistical significance.
Children’s dietary preferences also showed strong associations with sleep disorders. Preferences for meat (OR = 2.19, 95% CI: 1.43–3.35, p < 0.001), sweets (OR = 2.15, 95% CI: 1.31–3.51, p = 0.002), and especially fried foods (OR = 6.49, 95% CI: 2.51–17.40, p < 0.001) were associated with a markedly increased risk of sleep disorders. Preferences for carbonated drinks and vegetables were not significantly associated with sleep disorders (both p > 0.05).
No consistent associations were observed between sleep disorders and the frequency of seafood, beef, and lamb consumption. Although children who consumed these foods 1–3 times per month showed a borderline increased risk of sleep disorders (OR = 1.94, 95% CI: 0.94–4.25, p = 0.082), the overall pattern did not reach statistical significance.
However, moderate sweet consumption appeared to have a protective effect. Compared with daily consumption, children who consumed sweets 1–2 times per week (OR = 0.53, 95% CI: 0.29–0.95, p = 0.032) or 3–5 times per week (OR = 0.51, 95% CI: 0.27–0.94, p = 0.031) had significantly lower odds of sleep disorders. Consumption 1–3 times per month (OR = 0.87, 95% CI: 0.47–1.64, p = 0.672) and rare consumption (OR = 1.13, 95% CI: 0.51–2.48, p = 0.766) were not significantly associated with sleep disorders. These findings indicate that parental snoring and children’s dietary preferences, particularly preferences for fried foods, are independent risk factors for childhood sleep disorders, whereas moderate sweet consumption may exert a protective effect.
Age, sex, and BMI were included as covariates in the multivariable model (Supplementary Table 3). Age (OR = 0.94, 95% CI: 0.82–1.09, p = 0.437) and sex (OR = 0.79, 95% CI: 0.56–1.11, p = 0.167) were not significantly associated with sleep disorders. Body mass index showed a significant association only in the 6–7-year age group (OR = 1.12, 95% CI: 1.01–1.24, p = 0.039) in the age-stratified analysis (Supplementary Table 4).
Subgroup analyses stratified by age group (1–3, 4–5, and 6–7 years) were conducted (Supplementary Table 4). These analyses demonstrated patterns generally consistent with those observed in the main model. Parental snoring and children’s dietary preferences, particularly preferences for fried foods, remained important risk factors across age groups, although effect sizes varied slightly. For example, paternal snoring was significantly associated with sleep disorders among children aged 4–5 years (OR = 0.53, 95% CI: 0.30–0.91, p = 0.021) and 6–7 years (OR = 0.30, 95% CI: 0.15–0.60, p = 0.001), whereas maternal snoring was significant only in the 6–7-year age group (OR = 0.48, 95% CI: 0.26–0.89, p = 0.020). These findings suggest that the identified risk factors were robust and were not solely driven by the age distribution of the study sample.
Model diagnostics
Variance inflation factors for all predictors ranged from 1.06 to 1.33 (all <5), indicating the absence of multicollinearity (Supplementary Table 5). The Hosmer–Lemeshow goodness-of-fit test confirmed an adequate model fit (χ2 = 5.939, degrees of freedom (df) = 8, p = 0.654). The Nagelkerke R2 and Cox and Snell R2 values were 0.167 and 0.110, respectively, suggesting that the model explained a moderate proportion of the variance in childhood sleep disorders. Model discrimination was acceptable, with a C-index, equivalent to the area under the receiver operating characteristic curve (AUC), of 0.728. Collectively, these results support the adequacy, reliability, and discriminative performance of the multivariable logistic regression model (Supplementary Table 6).
Discussion
This study identified significant associations between childhood sleep disorders and several family- and diet-related factors, including parental snoring, maternal educational attainment, and children’s preferences for meat, sweets, and fried foods. These findings provide practical insights into how family behaviors and dietary habits may be associated with pediatric sleep outcomes.
The association between parental snoring and childhood sleep disorders suggests that shared familial sleep behaviors may influence children’s sleep quality. Parental snoring may contribute to nighttime disturbances and may also reflect underlying conditions such as obesity or sleep apnea, which could affect the child’s sleep.14, 15, 16 Our findings are consistent with previous research indicating that children often adopt parental sleep habits, reinforcing the importance of family-based sleep hygiene interventions.17, 18
Maternal educational attainment was also independently associated with childhood sleep disorders. Although higher maternal education is generally associated with improved health literacy, our findings suggest that certain educational levels (associate and bachelor’s degrees) were associated with an increased risk of childhood sleep disorders. This association may reflect indirect factors, such as increased professional responsibilities, highly structured family routines, or academic expectations, rather than a direct causal relationship.19, 20, 21 Therefore, psychosocial factors and parenting practices may mediate the relationship between maternal education and children’s sleep.
Dietary preferences, particularly preferences for meat, sweets, and fried foods, showed strong associations with childhood sleep disorders. These foods are known to influence glucose metabolism and may disrupt circadian rhythms, thereby contributing to poorer sleep quality.22, 23, 24, 25 Our findings support previous studies linking energy-dense, nutrient-poor dietary patterns with shorter sleep duration and more frequent nighttime awakenings.26
Interestingly, moderate sweet consumption (1–5 times per week) was associated with a lower risk of sleep disorders compared with daily consumption. This nonlinear relationship may reflect behavioral or metabolic regulatory mechanisms; however, the wide CIs and the possibility of residual confounding warrant cautious interpretation.27, 28, 29, 30 Similar dose-dependent associations have been reported in previous studies, but further validation using objective measures of dietary intake and sleep is needed.
In the multivariable analysis, parental snoring and children’s dietary preferences for meat, sweets, and fried foods remained independent predictors of childhood sleep disorders. In contrast, associations with maternal educational attainment and fruit consumption were attenuated, suggesting that some associations observed in the univariate analyses may have been confounded by other variables.
Subgroup analyses stratified by age group (1–3, 4–5, and 6–7 years) further supported these findings (Supplementary Table 4). Parental snoring and dietary preferences, particularly preferences for fried foods, remained significant risk factors across all age groups, although effect sizes varied slightly. Specifically, paternal snoring significantly increased the odds of childhood sleep disorders among children aged 4–5 years (OR = 1.89, 95% CI: 1.10–3.33, p = 0.021) and 6–7 years (OR = 3.33, 95% CI: 1.67–6.67, p = 0.001), whereas maternal snoring significantly increased the risk among children aged 6–7 years (OR = 2.08, 95% CI: 1.16–3.85, p = 0.020). These findings indicate that the identified risk factors were robust across age strata and support the predictive value of parental sleep behaviors in relation to childhood sleep disorders.
These findings highlight the importance of adjusting for potential confounding variables and interpreting correlation coefficients with caution. Consistent with this, our correlation analyses revealed only weak Pearson correlations for continuous variables and weak-to-moderate Kendall’s tau-b correlations for dietary frequency variables, suggesting that statistical significance may, in some cases, reflect the large sample size rather than strong practical effects.
Our findings are consistent with Bronfenbrenner’s Bioecological Model, which emphasizes the influence of immediate family environments on child development. Within this framework, parental behaviors, educational attainment, and household dietary practices function as microsystem-level factors that may shape sleep hygiene and daily routines.
This study adds to the limited literature from non-Western populations, particularly China, where pediatric sleep research remains relatively underdeveloped.7, 8, 9 The prevalence of sleep disorders in our sample (22.72%) falls within the range reported globally, highlighting the growing need for culturally adapted, family-based interventions in Asian populations.
Although organizations such as the World Health Organization (WHO) and the American Academy of Sleep Medicine (AASM) provide recommendations regarding pediatric sleep, their implementation remains inconsistent. Our findings support the integration of sleep education into family health promotion strategies, with particular emphasis on dietary guidance and parental role modeling.
The strengths of this study include its relatively large sample size, a multidimensional approach encompassing both family- and diet-related factors, and the use of validated instruments.
Limitations of the study
This study has several limitations. First, its cross-sectional design precludes any inference of causality. Second, all data were based on parent-reported information and are therefore subject to recall and social desirability biases; objective measures of sleep and dietary behavior were not available. Third, although several covariates were included in the analyses, unmeasured confounders, such as genetic predisposition, household stress, and screen time exposure, may still have influenced the observed associations. In addition, the imbalance in group sizes between children with and without sleep disorders may have affected the stability of the regression estimates, despite the use of multivariable and age-stratified analyses. Finally, the sample was drawn from a single urban region in China, which may limit the generalizability of the findings to other cultural or socioeconomic settings.31, 32
Conclusions
This study highlights several potentially modifiable factors associated with childhood sleep disorders in a Chinese population. Parental snoring and unhealthy dietary preferences emerged as independent factors associated with an increased risk of sleep disorders. Although maternal educational attainment was also associated with childhood sleep disorders, its role is likely complex and may be mediated by other psychosocial and environmental factors. These findings may contribute to the development of family-centered strategies aimed at promoting healthy sleep habits among children, particularly through improvements in parental health behaviors and dietary practices.
This study identified statistically significant associations between childhood sleep disorders and several factors, including parental snoring, maternal educational attainment, and children’s dietary preferences. Children whose fathers or mothers snored had significantly higher odds of sleep disorders, with ORs ranging from 1.76 to 2.20 in the overall sample, and these associations remained significant in age-stratified analyses. Children of mothers with an associate or bachelor’s degree had more than twice the odds of sleep disorders, whereas graduate-level education demonstrated a borderline association. Preferences for meat, sweets, and fried foods were also significantly associated with an increased risk of sleep disorders, while moderate sweet consumption (1–5 times per week) appeared to have a protective effect.
However, the overall effect sizes were small. Pearson’s correlation coefficients did not exceed 0.132 for categorical variables, and Kendall’s tau-b coefficients did not exceed 0.11 for dietary frequency variables. Age and sex were not significantly associated with sleep disorders, and BMI showed a significant association only among children aged 6–7 years. These findings suggest that, although statistically significant, the observed associations may have limited practical significance and may partially reflect the influence of the large sample size.
Therefore, the results should be interpreted with caution and regarded as preliminary evidence of association rather than evidence of causality. They may help generate hypotheses for future research and identify potential family- and diet-related factors associated with childhood sleep disorders; however, they do not support strong clinical or public health recommendations at the present stage of evidence.
Supplementary data
The supplementary materials are available in at https://doi.org/10.5281/zenodo.17173852. The package contains the following files:
Supplementary Table 1. Descriptive statistics and skewness for continuous and converted frequency variables (total sample and subgroups).
Supplementary Table 2. Univariate logistic regression analysis of potential risk factors.
Supplementary Table 3. Multivariate logistic regression of childhood sleep disorder risk factors with age as a continuous variable.
Supplementary Table 4. Multivariate logistic regression of childhood sleep disorder risk factors by age group (1–3, 4–5, 6–7 years).
Supplementary Table 5. Multicollinearity assessment (VIF).
Supplementary Table 6. Overall model fit statistics.
Data Availability Statement
The raw data generated and analyzed during the current study are openly available in Zenodo at https://doi.org/10.5281/zenodo.14970151.
Consent for publication of personal information
Not applicable.
Use of AI and AI-assisted technologies
Not applicable.