Abstract
Background. Nanog, a transcription factor, is involved in cancer initiation and progression.
Objectives. To explore the potential regulatory mechanism of Nanog in gastric cancer.
Materials and methods. Immunohistochemistry (IHC) was used to examine E-cadherin, N-cadherin, Nanog, and KDM5B in gastric cancer (Ca), metastatic lymph node cancer (L), and adjacent normal tissues (N). MTT, migration, and invasion assays were used to evaluate cell viability, migration, and invasion of gastric cancer cells SGC-7901 induced by transforming growth factor (TGF)-β1, or with Nanog overexpression/knockdown. Western blot was used to examine the relative protein expression of E-cadherin, N-cadherin, Nanog, and lysine-specific demethylase 5B (KDM5B) in cells. KDM5B was silenced by siRNA in cells, and E-cadherin, N-cadherin, and H3K4me3 were examined with western blot, while the interaction between Nanog and KDM5B was examined using a co-immunoprecipitation (Co-IP) assay. Furthermore, H3K4me3 protein expression was validated in N, Ca, and L tissues using IHC.
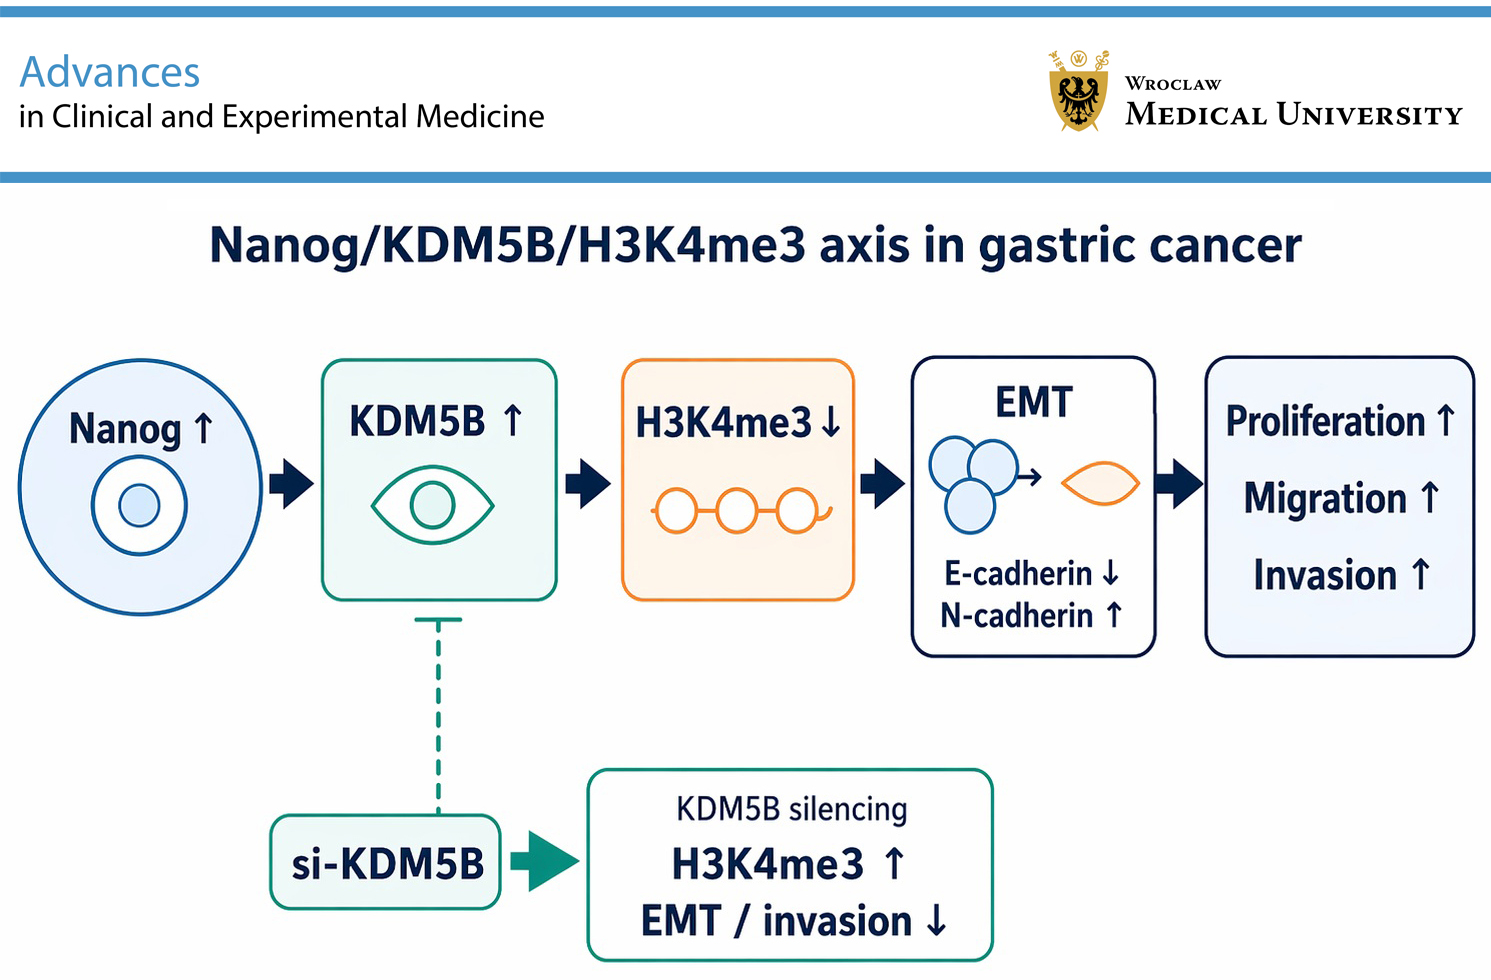
Results. E-cadherin was hypoexpressed, while N-cadherin, Nanog, and KDM5B were hyperexpressed in the Ca and L groups compared with the N group. TGF-β1 and Nanog enhanced cell viability, migration, and invasion by promoting epithelial–mesenchymal transition (EMT). KDM5B was identified to bind to Nanog and was positively regulated by Nanog, and functioned as a negative regulator of histone H3 Lys4 trimethylation (H3K4me3) in SGC-7901 cells. KDM5B knockdown inhibited cell invasion and EMT. The Nanog/KDM5B/H3K4me3 pathway contributes to the proliferation, migration, and invasion of SGC-7901 cells by inhibiting E-cadherin and enhancing N-cadherin.
Conclusions. This study provides new insights into the regulatory role and mechanism of Nanog/KDM5B/H3K4me3 in gastric cancer, which might be potential biomarkers in the diagnosis and prognosis of gastric cancer.
Key words: Nanog, gastric cancer, KDM5B, H3K4me3, epithelial–mesenchymal transition
Background
As one of the most common malignancies worldwide, gastric cancer ranks as the 5th most prevalent cancer and the 3rd leading cause of cancer-related deaths globally, and its development is often linked to various factors, including dietary habits, Helicobacter pylori infection, smoking, and genetic predispositions.1, 2 Surgical resection remains a major treatment despite advances in discoveries related to the pathogenesis and molecular biology of gastric cancer. The optimal extent of lymphadenectomy and the rapid development of screening-based interventional techniques have been the dominant themes.3 Gastric cancer is a phenotypically highly heterogeneous disease. Numerous studies indicate that the development and progression of gastric cancer involve a number of genetic and epigenetic changes, such as c-myc and p21 downregulation4 and epigenetic downregulation of mucin 17.5 However, the molecular mechanisms underlying malignancy in gastric cancer cells are largely unknown.
Nanog is a critical transcription factor involved in the self-renewal and pluripotency of embryonic stem cells (ESCs).6, 7 Similar to ESCs, tumor-initiating cells (TICs) undergo molecular regulation, proliferation, self-renewal, and unlimited differentiation.8 In addition, TICs tend to be more drug-resistant and metastatic than non-TICs.9, 10 Recent evidence has demonstrated that Nanog dysregulation contributes to cancer initiation and progression through TICs,11 and it is enriched in various cancers, including hepatocellular carcinoma (HCC),12 breast carcinoma13 and colorectal carcinoma.14 A recent study indicated that Nanog was overexpressed in gastric cancer tissues and positively associated with lymph node status and advanced clinical stage in patients.15 High Nanog levels in cancer tissues were strongly correlated with 5-year overall survival (OS) in patients.14 The functional and mechanistic roles of Nanog in gastric cancer remain largely unclear and require further exploration.
Epigenetic modulation plays an important role in tumorigenesis. Recent studies have indicated that inhibitors of DNA methyltransferases or histone deacetylases have been applied in clinical epigenetic therapy16, 17, 18 or have been designed as new therapies for human diseases.19 Histone lysine demethylases, on the other hand, are potential therapeutic targets for various diseases. A lysine-specific demethylase 5 (KDM5) inhibitor reduces demethylation of H3K4me3 at transcription start sites and decreases the growth of myeloma cells.20 KDM5 consists of 4 family members: KDM5A, KDM5B, KDM5C, and KDM5D. These proteins can remove di- and trimethylation marks from activated H3K4 and are also involved in the differentiation of hematopoietic stem cells and tumorigenesis.21, 22 Recent studies have reported that KDM5B is highly expressed in cancers, including non-small cell lung cancer (NSCLC) and liver cancer, and that its expression is correlated with tumor size, advanced stage, and poor OS in patients with liver cancer and NSCLC.23, 24 KDM5B is a transcriptional target of Nanog, while Nanog occupies the KDM5B genomic locus and promotes self-renewal of embryonic stem cells.25 However, the specific regulatory mechanism between KDM5B and Nanog in gastric cancer remains to be explored.
Objectives
We examined the effects of KDM5B and Nanog on cell viability and invasion in vitro to investigate the specific regulatory mechanisms of KDM5B and Nanog in gastric cancer.
Materials and methods
Human tissues and cell lines
Twenty pairs of gastric cancer and adjacent non-tumor tissues were obtained from gastric cancer patients undergoing gastrectomy without prior radiotherapy or chemotherapy. Written informed consent was obtained from each patient. This study was approved by the Ethics Committee of Tangshan People’s Hospital (Tangshan, China) and conducted in accordance with the Declaration of Helsinki of 1964 and its subsequent revisions (approval No. RMYY-LLKS-2024026). SGC-7901 cells were purchased from the Chinese Academy of Medical Sciences and Peking Union Medical College (Beijing, China) and routinely cultured in complete medium containing 90% RPMI-1640 and 10% fetal bovine serum (FBS; Gibco, Waltham, USA) at 37°C in 5% CO2.
Plasmid construction and siRNA synthesis
The pEGFP-N1 vector was used to generate plasmids overexpressing Nanog and KDM5B. All plasmids were designed and constructed by Sangon Biotech (Shanghai, China). All siRNAs and primers were synthesized by GenePharma (Suzhou, China). The respective sequences are provided in Table 1.
RNA isolation and RT-qPCR
Total RNA was routinely extracted using the TRIzol method. Complementary DNA (cDNA) was synthesized using the PrimeScript RT Reagent Kit (Takara, Shiga, Japan), and the polymerase chain reaction (PCR) program was set at 94°C for 3 min, followed by 40 cycles of 94°C for 30 s, 60°C for 30 s, and 72°C for 30 s. GAPDH was used as the internal reference. The primers used in this experiment are listed in Table 1.
MTT assay
Cells were initially seeded in 96-well plates at a density of 7 × 10³ cells per well in complete medium. After 24 h, 10 μL of 3-(4,5-dimethylthiazol-2-yl)-2,5-diphenyltetrazolium bromide (MTT) was added to each well. The cells were then incubated for an additional 4 h in a cell incubator. Following the protocol, absorbance was measured at 570 nm using a microplate reader (Bio-Tek, Winooski, USA).
Western blot
Western blotting was used to examine changes in relative protein expression in cells. Total protein was extracted using radioimmunoprecipitation assay (RIPA) buffer containing phenylmethylsulfonyl fluoride (PMSF). The extracted proteins were boiled for 15 min at 100°C, separated using the sodium dodecyl sulfate–polyacrylamide gel electrophoresis (SDS-PAGE) method, and transferred to polyvinylidene difluoride (PVDF) membranes. The membranes were blocked in 5% non-fat milk for 1 h at room temperature. Primary antibodies were diluted in Tris-buffered saline with Tween (TBST) and applied to the membranes for incubation at 4°C overnight. Anti-KDM5B (1:800, CSB-PA295068; Cusabio, Wuhan, China), anti-Nanog (1:2,000, bs-10414R; Bioss, Beijing, China), anti-E-cadherin (1:2000, bsm-60814R; Bioss), anti-N-cadherin (1:2,000, bsm-52389R; Bioss), and anti-H3K4me3 (1:1000, bs-4715R; Bioss) were used in the experiments. The membranes were washed 3 times with a sufficient volume of TBST and then incubated with secondary antibody (1:10,000, bs-0295G; Bioss) for 1 h at room temperature. Blots were visualized using the electrochemiluminescence (ECL; Bio-High, Hebei, China) method on a chemiluminescence imager (Peiqing, Shanghai, China) and quantified using ImageJ (National Institutes of Health (NIH), Bethesda, USA), with normalization to GAPDH.
Immunohistochemistry assay
Immunohistochemistry (IHC) assays were applied to examine the relative protein distribution and expression levels in gastric cancer tissues (Ca) and paired metastatic lymph node cancer tissues (L) compared with adjacent normal tissues (N). Formalin-fixed and paraffin-embedded (FFPE) tissues were cut into 5 µm sections for further IHC analysis. The sections were prepared as described in our previous study.26 The slides were stained with secondary antibodies and diaminobenzidine tetrahydrochloride (ZSGB-BIO, Beijing, China) and then counterstained with hematoxylin.26
The primary antibodies used in this study included anti-E-cadherin (bs-1519R, 1:500; Bioss), anti-N-cadherin (bs-1172R, 1:500 dilution; Bioss), anti-Nanog, anti-KDM5B (bs-6139R, 1:500; Bioss), and anti-H3K4me3 (bs-4715, 1:500; Bioss). The IHC results were evaluated by 2 independent pathologists blinded to the sample groups.
Hematoxylin and eosin staining
The tissue sections were stained with hematoxylin solution for 5 min and then stained with 0.3% eosin solution for 3 min after washing in distilled water. The stained sections were dehydrated using graded ethanol and xylene. The sections were observed under an Olympus IX71 microscope (Olympus Corp., Tokyo, Japan; magnification ×100 and ×600).
Wound healing assay
Sixty-millimeter dishes were used for the wound healing assay. In brief, cells were seeded in dishes containing complete medium and cultured for 12–18 h. Then, a 200-μL pipette tip was used to create a scratch in a straight line. The dishes were then washed twice. Images of the same field were captured after 24 h and 48 h under a microscope (Olympus IX71). ImageJ was used to analyze wound healing.
Invasion ability analysis
Cells (5 × 10⁴/well) were inoculated into the upper chambers of Boyden chamber transwells (8-μm pore size; Corning Company, Corning, USA) containing serum-free medium and pre-coated with 40 μL of Matrigel (BD Biosciences, Franklin Lakes, USA). The lower chamber was filled with complete medium. After 24 h, the cells attached to the lower surface of the inserts were fixed with 4% paraformaldehyde (PFA), stained with 1% crystal violet, and counted.
Co-IP assay
This assay was performed to evaluate the impact of Nanog overexpression on KDM5B in cells. Cells were cultured in 250-mL cell culture flasks and transfected with 15.0 μg of Nanog overexpression plasmid or an empty vector control. Forty-eight hours later, the cells were washed with 1× phosphate-buffered saline (PBS) and then placed on a shaker at 4°C for 30 min with 2 mL of co-immunoprecipitation (Co-IP) buffer. The mixture was centrifuged at 4°C and 12,000 rpm for 10 min. The supernatant was then collected, and the proteins were purified according to the protocol. Next, 50 μL of protein A/G beads was centrifuged at 4,000 rpm for 3 min, the supernatant was discarded, and 500 μL of Co-IP buffer was added (MilliporeSigma, St. Louis, USA). The reactions were incubated for 25 min, followed by western blotting.
Statistical analyses
In the IHC analysis, we first performed the Shapiro–Wilk test and Brown–Forsythe test to examine the normality and variance of the data in each group. Thereafter, Welch’s analysis of variance (ANOVA) with Dunnett’s T3 multiple-comparisons test was conducted to evaluate differences in relative protein expression based on the IHC results. For cellular assays and western blot analyses, because of the small sample size and the limited reliability of distributional testing under these conditions, nonparametric tests were used without assuming normal data distribution. The statistical significance of differences was analyzed using the Kruskal–Wallis test with Dunn’s post hoc test for multiple-group comparisons and the Mann–Whitney U test for comparisons between 2 groups using GraphPad Prism v. 10 (GraphPad, San Diego, USA). Significant associations between Nanog and KDM5B expression were assessed using Pearson’s correlation analysis (p < 0.05).
Results
Nanog and KDM5B are abundantly expressed in gastric cancer tissues and metastatic lymph node tissues
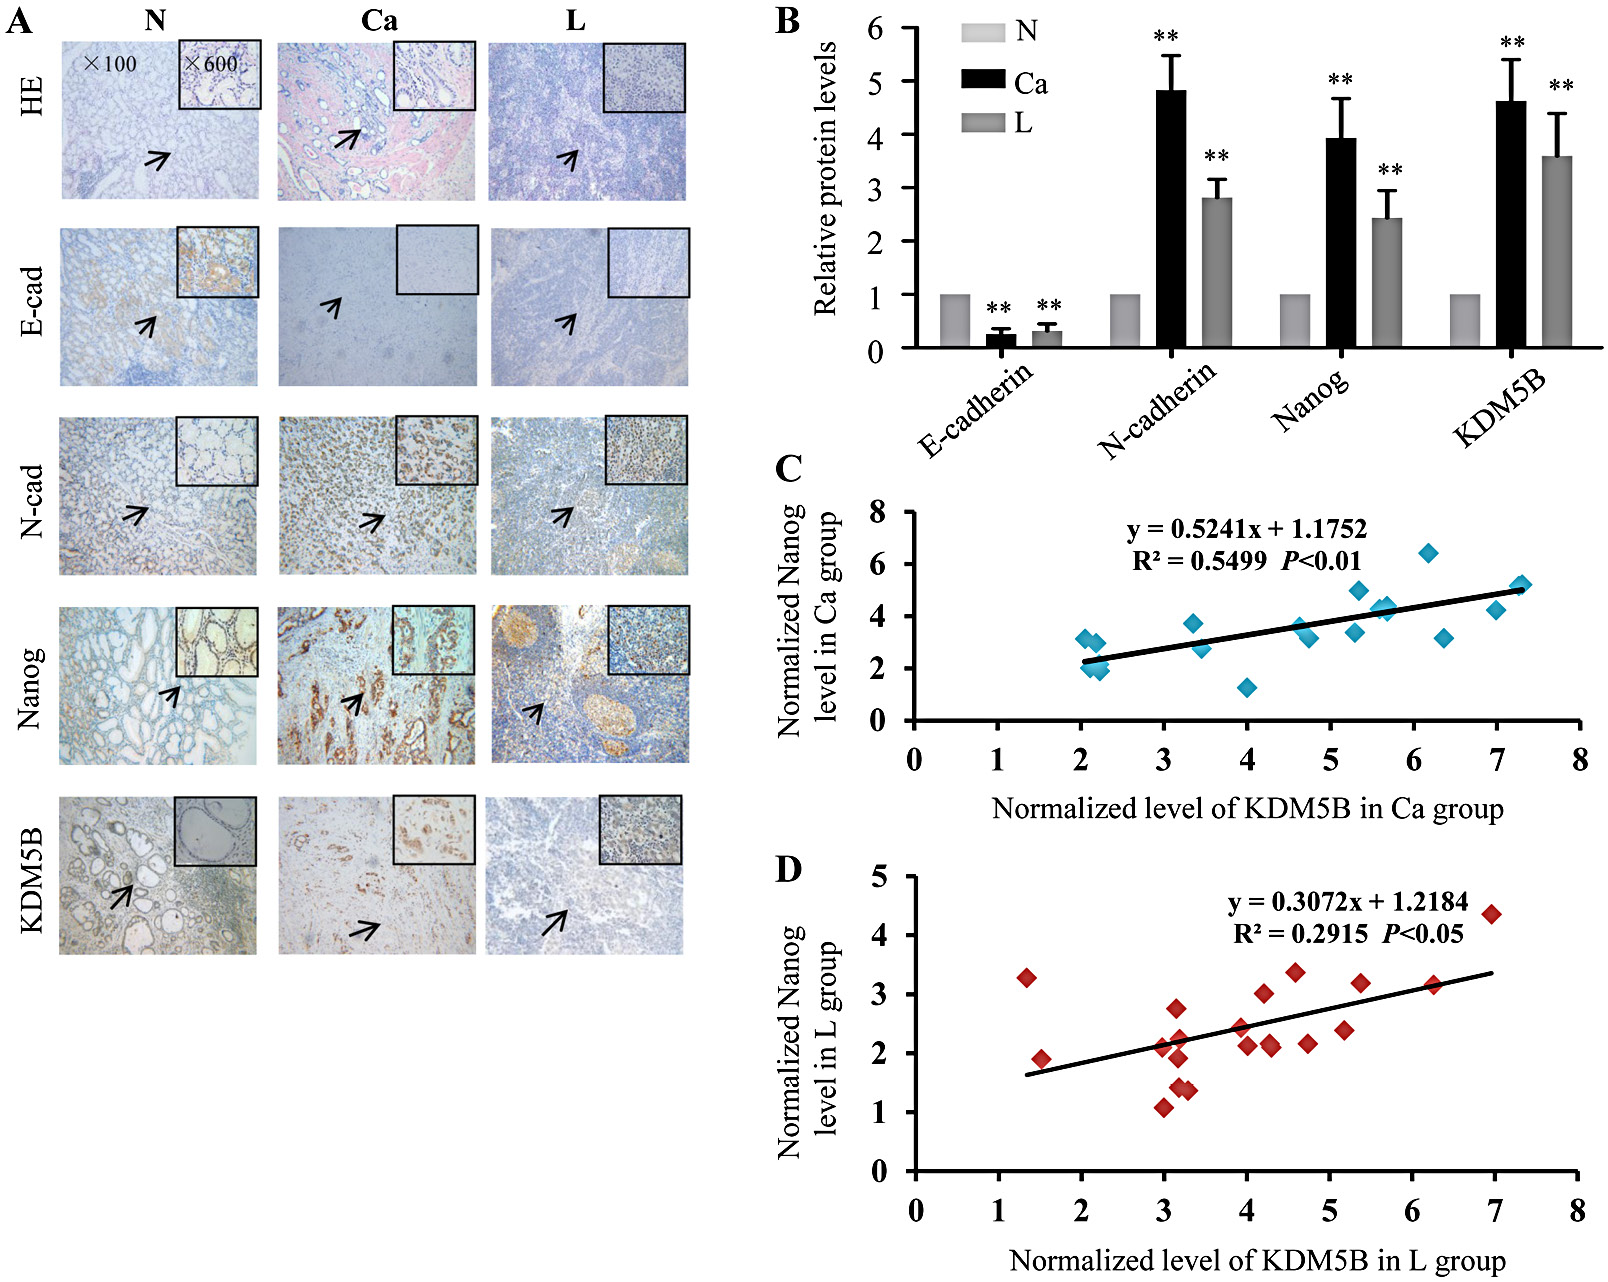
Epithelial–mesenchymal transition (EMT) is one of the key steps in tumor metastasis. As shown in Figure 1A,B, the epithelial marker E-cadherin was hypoexpressed, while the mesenchymal marker N-cadherin was hyperexpressed in gastric cancer tissues (Ca) and paired metastatic lymph node cancer tissues (L) compared with adjacent normal tissues (N). This finding confirmed that cancer cells underwent EMT in both in situ and metastatic foci. In addition, Nanog and KDM5B were upregulated in both Ca and L tissues compared with N tissues. Furthermore, Pearson’s correlation analysis demonstrated that Nanog was positively correlated with KDM5B in the Ca and L groups (Figure 1C,D). These findings suggest that Nanog and KDM5B may be involved in gastric cancer progression.
Nanog and KDM5B are overexpressed in TGF-β1-induced SGC-7901 cells
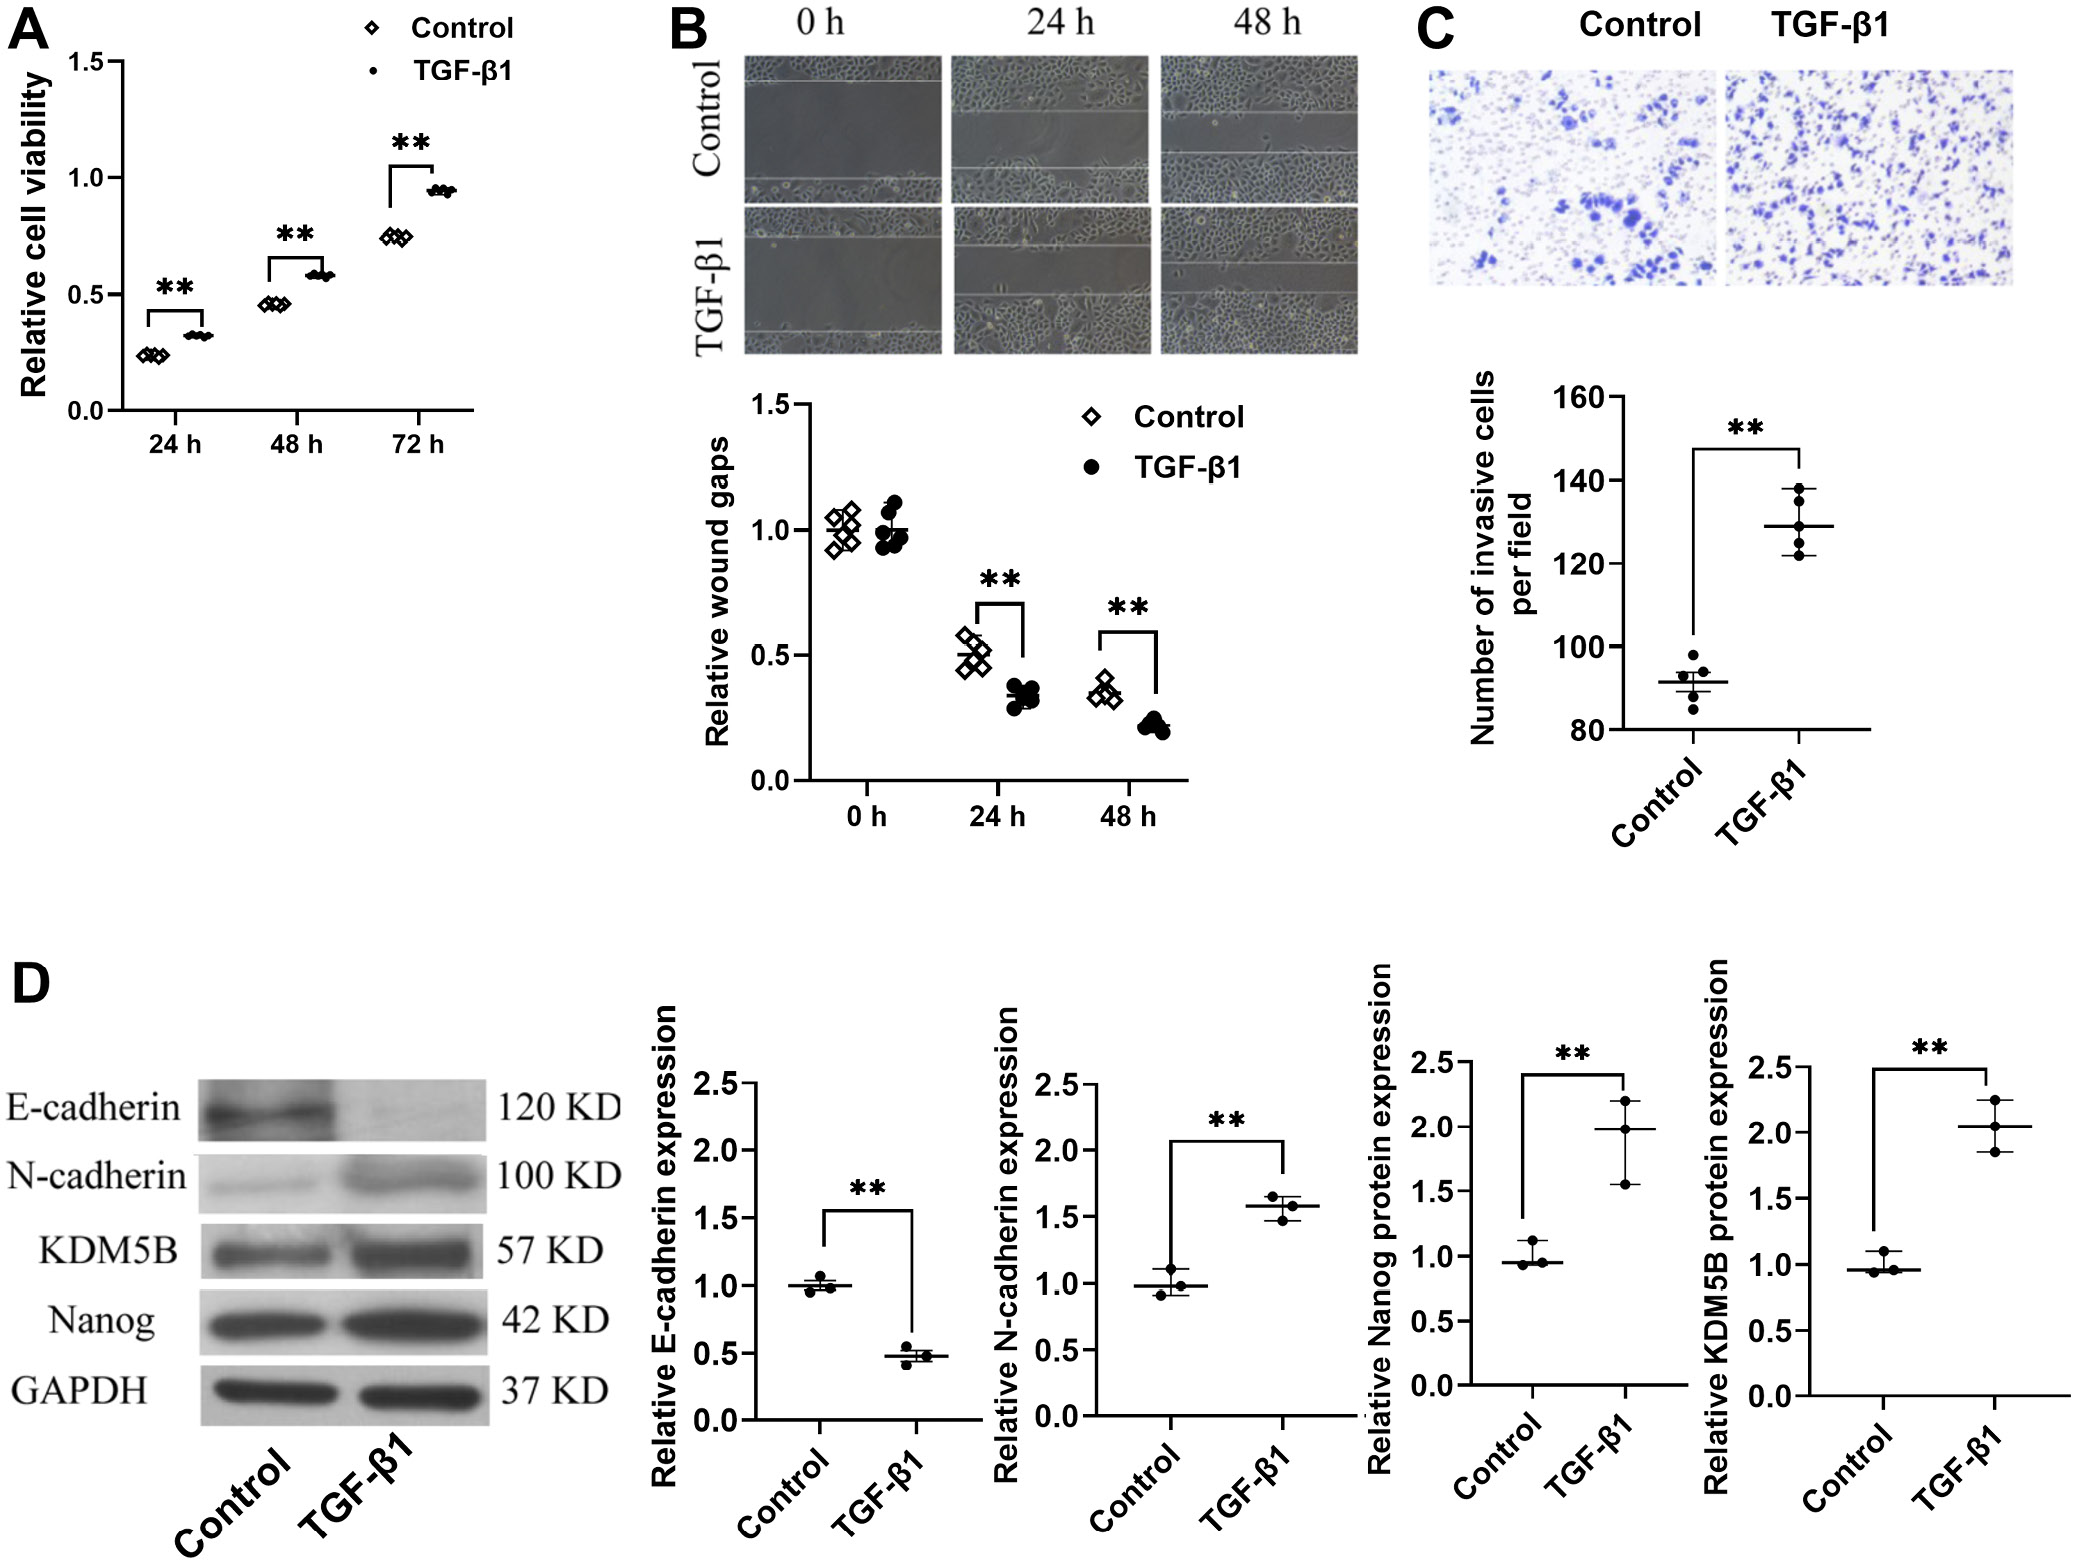
Evidence has indicated that activation of transforming growth factor (TGF)-β1 promotes an epithelial plasticity response that may induce EMT in carcinomas.27 Thus, TGF-β1 was used to establish an EMT model in gastric cancer cells. SGC-7901 cells treated with TGF-β1 exhibited enhanced cell viability and stronger migration and invasion abilities (Figure 2A–C) than non-induced cells. E-cadherin was overexpressed in non-induced cells, while N-cadherin was increased in TGF-β1-induced cells (Figure 2D). These results confirmed that cells treated with TGF-β1 exhibited an EMT phenotype. Moreover, both Nanog and KDM5B were significantly increased in TGF-β1-induced cells (Figure 2D). These results indicated that Nanog and KDM5B were involved in EMT progression in gastric cancer cells, which was in accordance with the results of gastric histology shown in Figure 1.
Nanog overexpression contributes to the proliferation, migration, invasion, EMT, and KDM5B expression of SGC-7901 cells
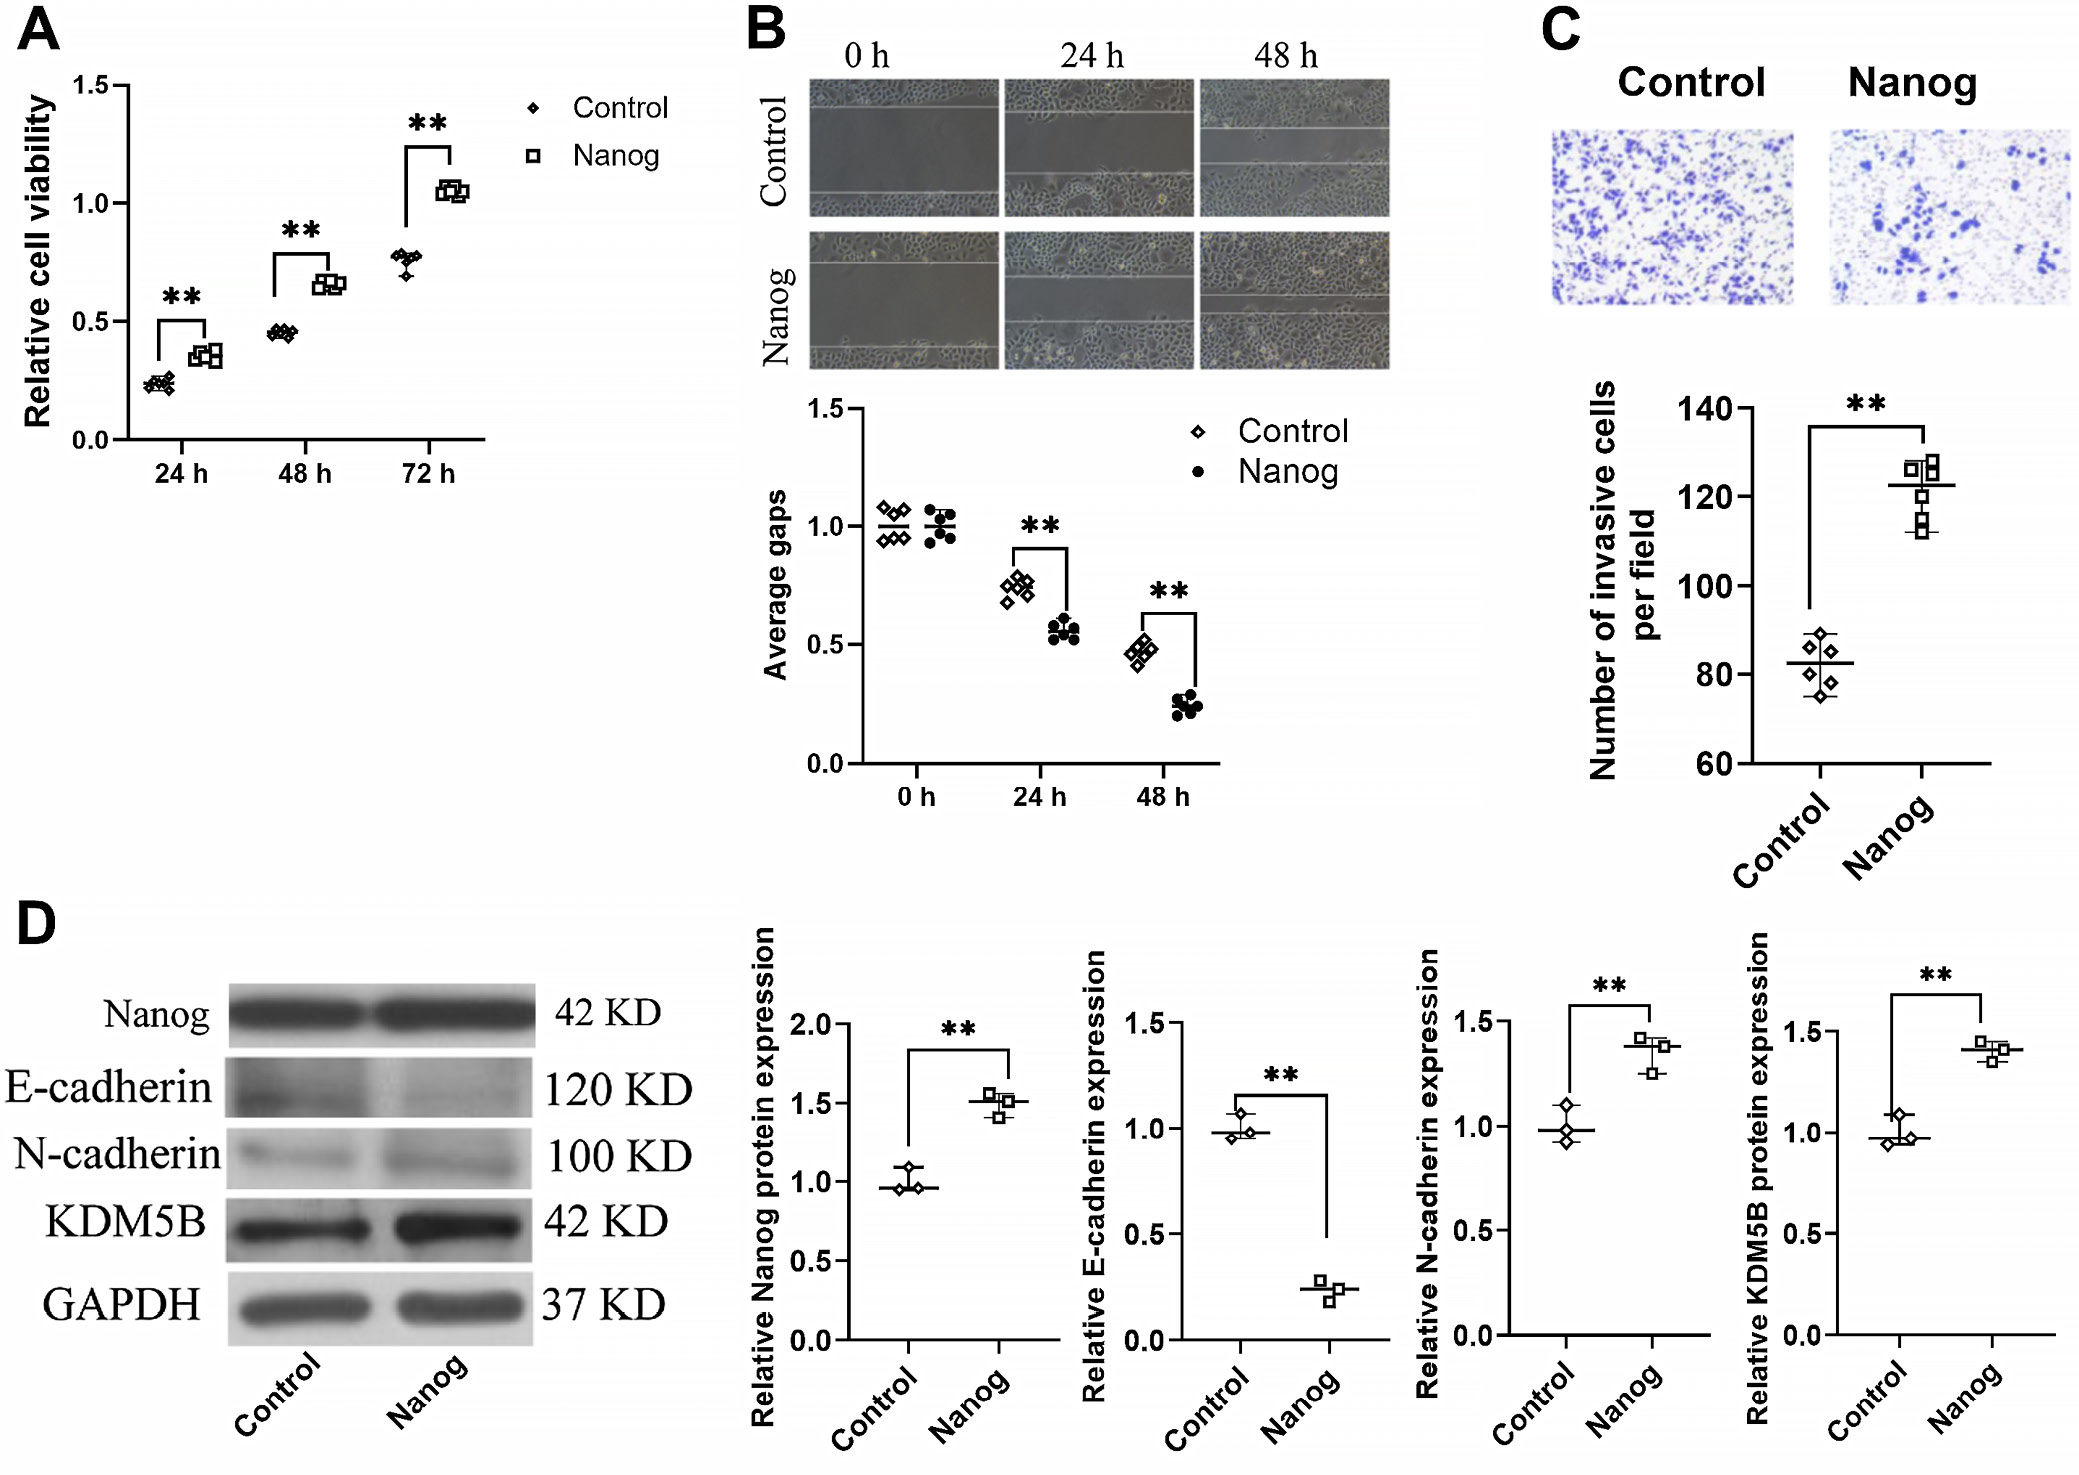
To further investigate the function of Nanog in gastric cancer cells, SGC-7901 cells were transfected with empty pEGFP-N1 plasmids (N1) and pEGFP-N1 plasmids containing the sequence encoding Nanog (N1-Nanog). The viability of SGC-7901 cells was enhanced in the Nanog overexpression group (Figure 3A). The wound-healing and invasion assays showed that Nanog overexpression increased cell migration and invasion (Figure 3B,C). At 24 h and 48 h post-transfection, the protein level of Nanog was enhanced 1.4-fold in the N1-Nanog group compared with that in the N1 group (Figure 3D). Western blot results confirmed that E-cadherin was decreased, whereas N-cadherin was increased in Nanog-overexpressing cells (Figure 3D). KDM5B protein expression was enhanced by Nanog overexpression (Figure 3D). These results suggest that Nanog overexpression promotes proliferation, migration, invasion, and the EMT phenotype of SGC-7901 cells, as well as KDM5B expression.
Nanog knockdown inhibits proliferation, migration, invasion, EMT, and KDM5B expression of SGC-7901 cells
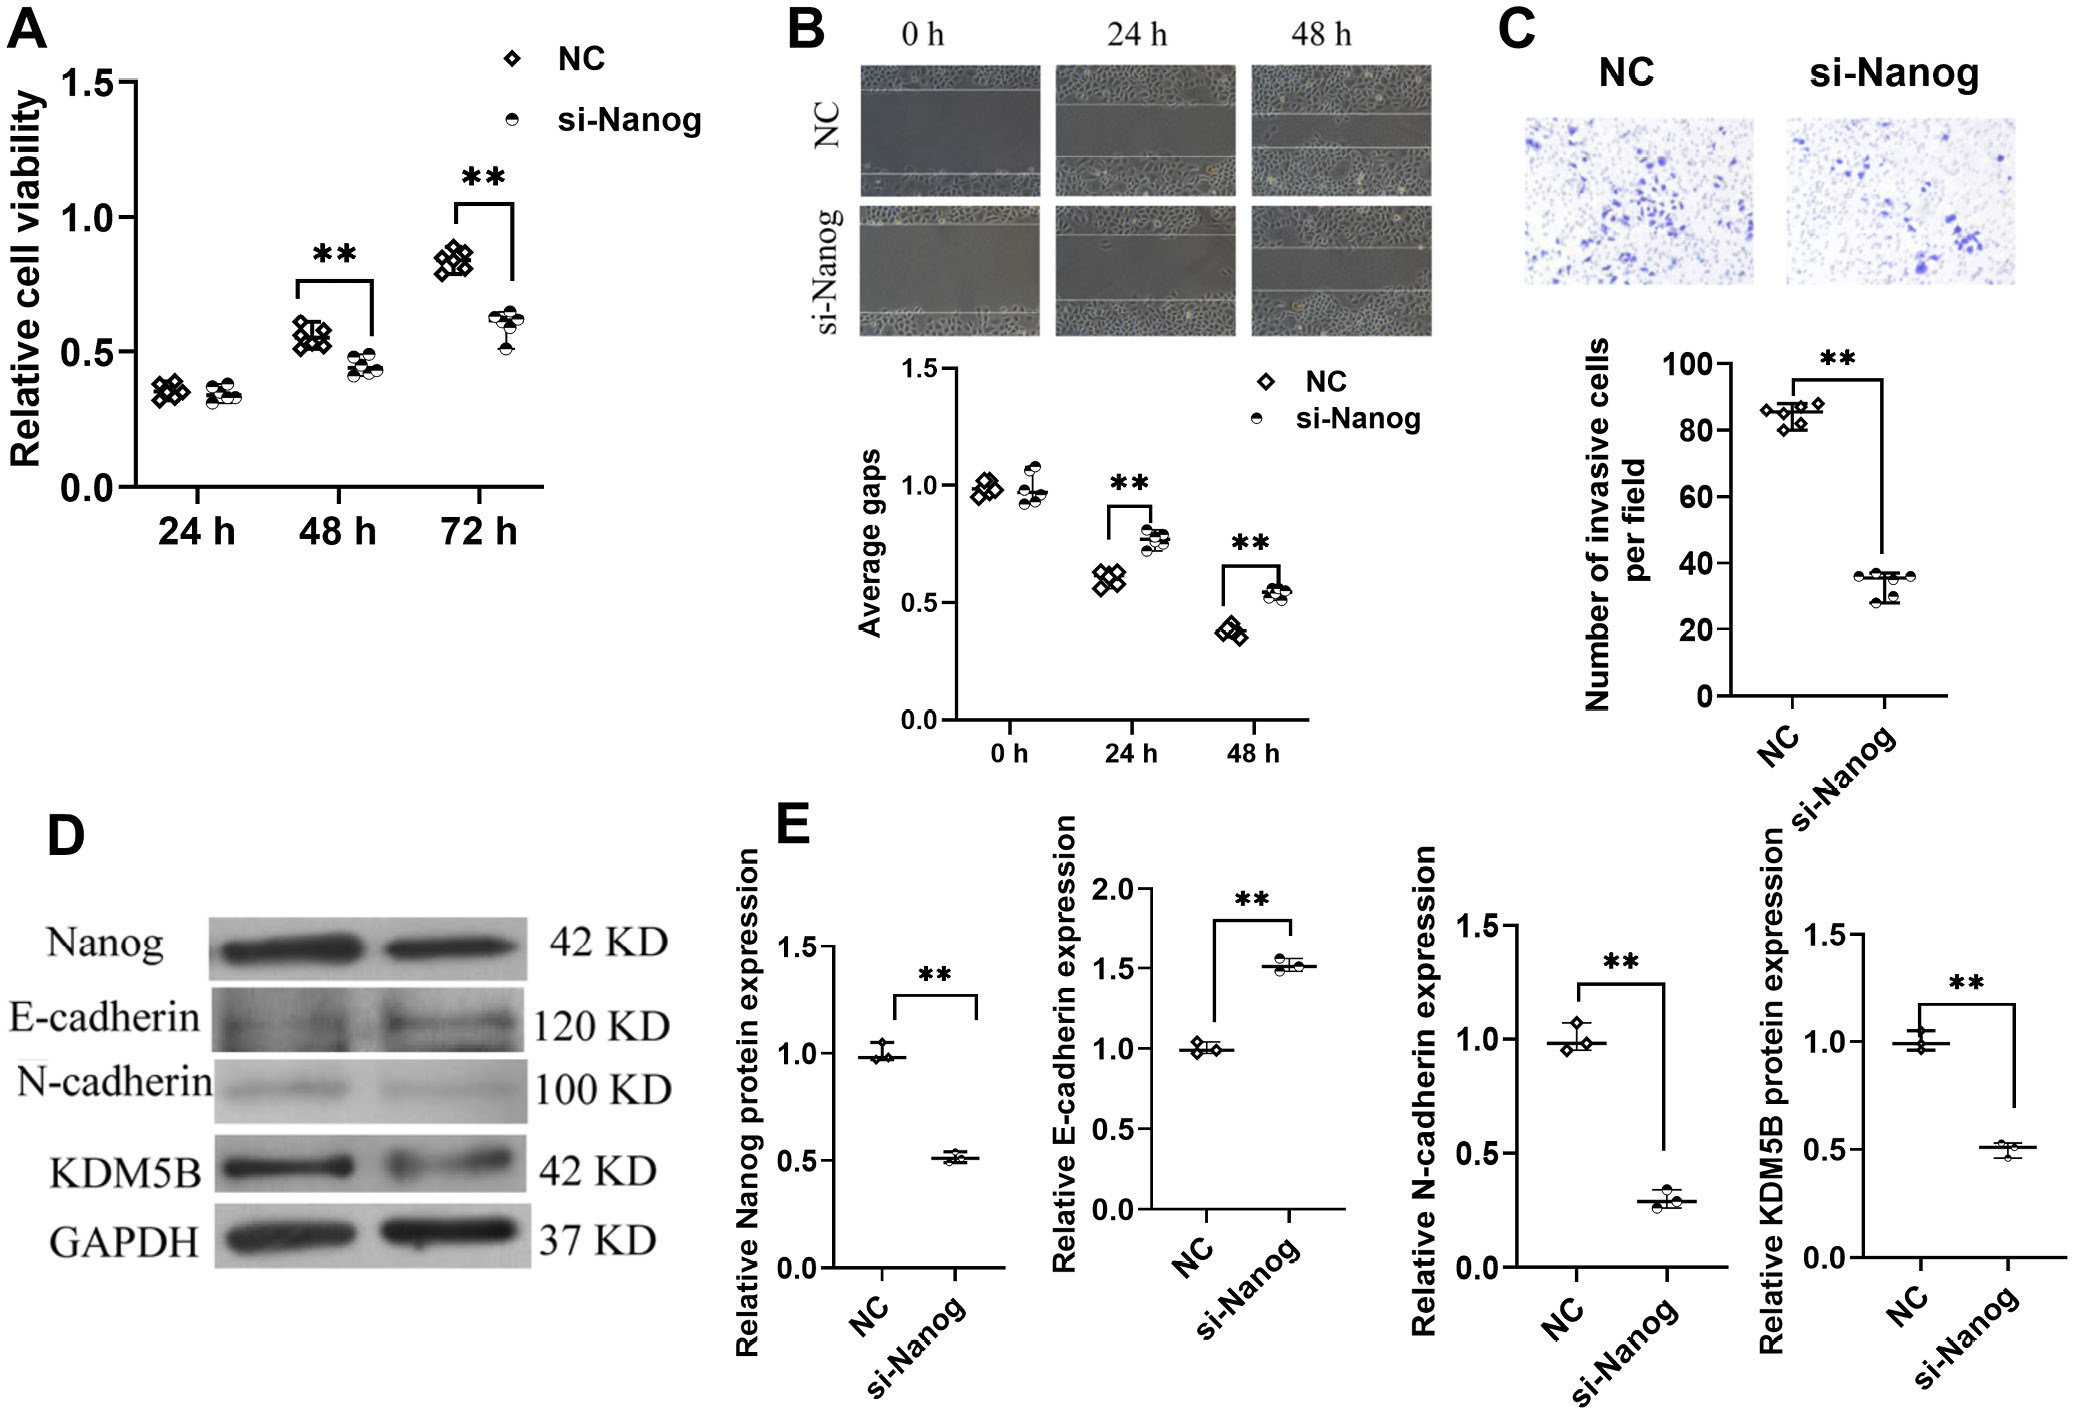
SGC-7901 cells were transfected with small interfering RNA targeting Nanog (si-Nanog) and a negative control (si-NC). The viability of SGC-7901 cells decreased following Nanog knockdown (Figure 4A). The wound-healing assay and in vitro invasion assay indicated that Nanog knockdown reduced cell migration and invasion activities (Figure 4B,C). The efficiency of Nanog knockdown was verified using western blotting (Figure 4D). Western blot assays also indicated that E-cadherin expression increased while N-cadherin expression decreased in the si-Nanog group (Figure 4D), suggesting that Nanog knockdown blocked EMT progression. Moreover, KDM5B expression was markedly downregulated by Nanog knockdown (Figure 4D). These data suggest that Nanog silencing suppresses the proliferation, migration, invasion, and EMT process of SGC-7901 cells, as well as KDM5B expression. Taken together, KDM5B is a downstream gene positively regulated by Nanog in SGC-7901 cells.
Silencing KDM5B inhibits the invasion and EMT of SGC-7901 cells by upregulation of H3K4me3 level
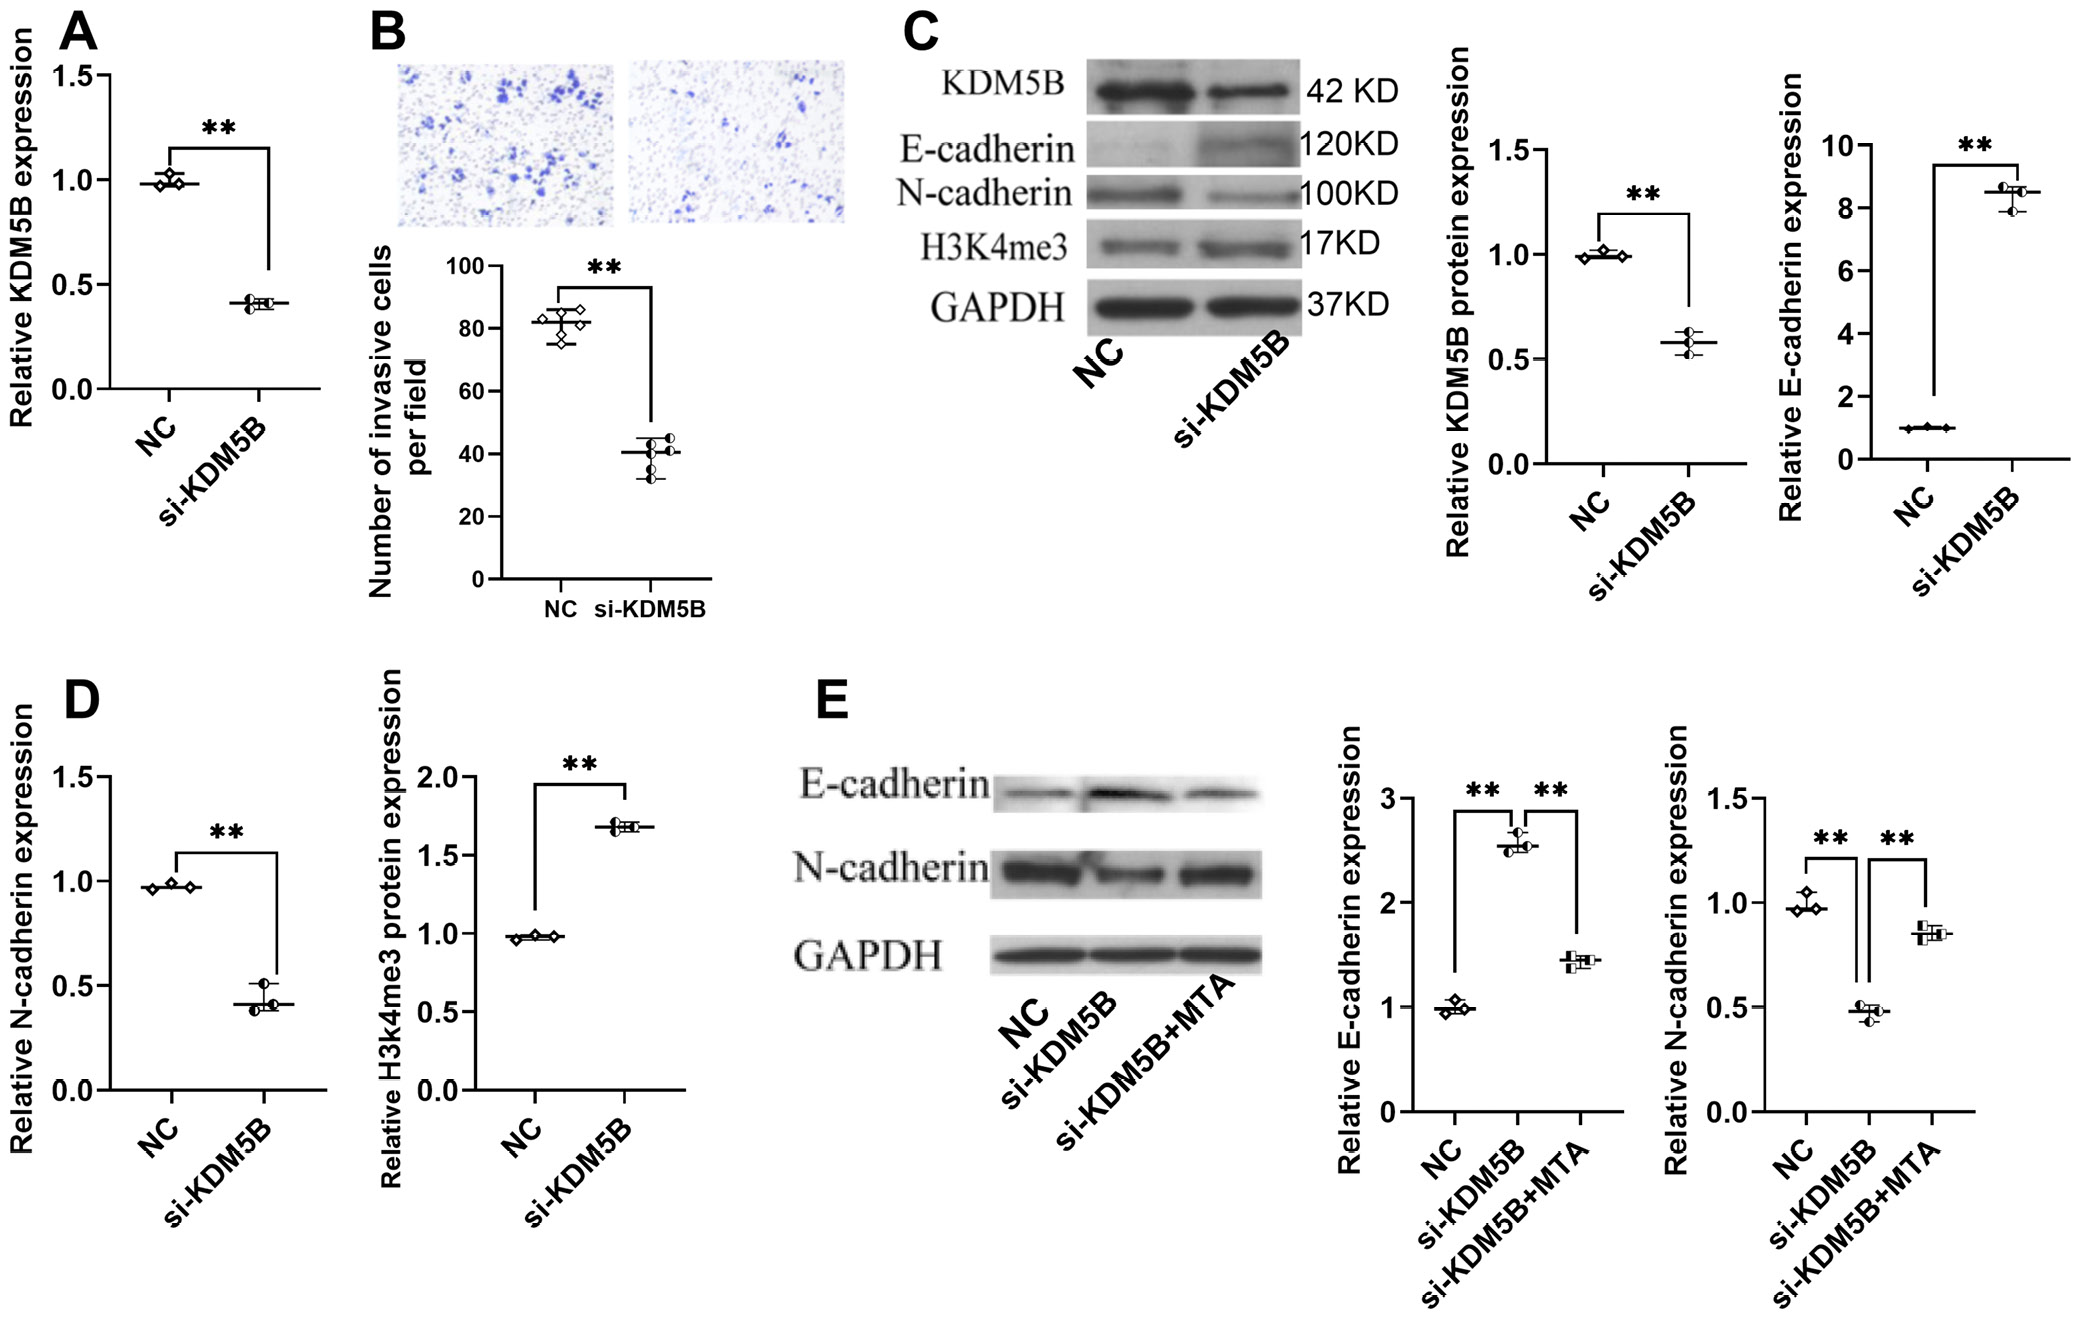
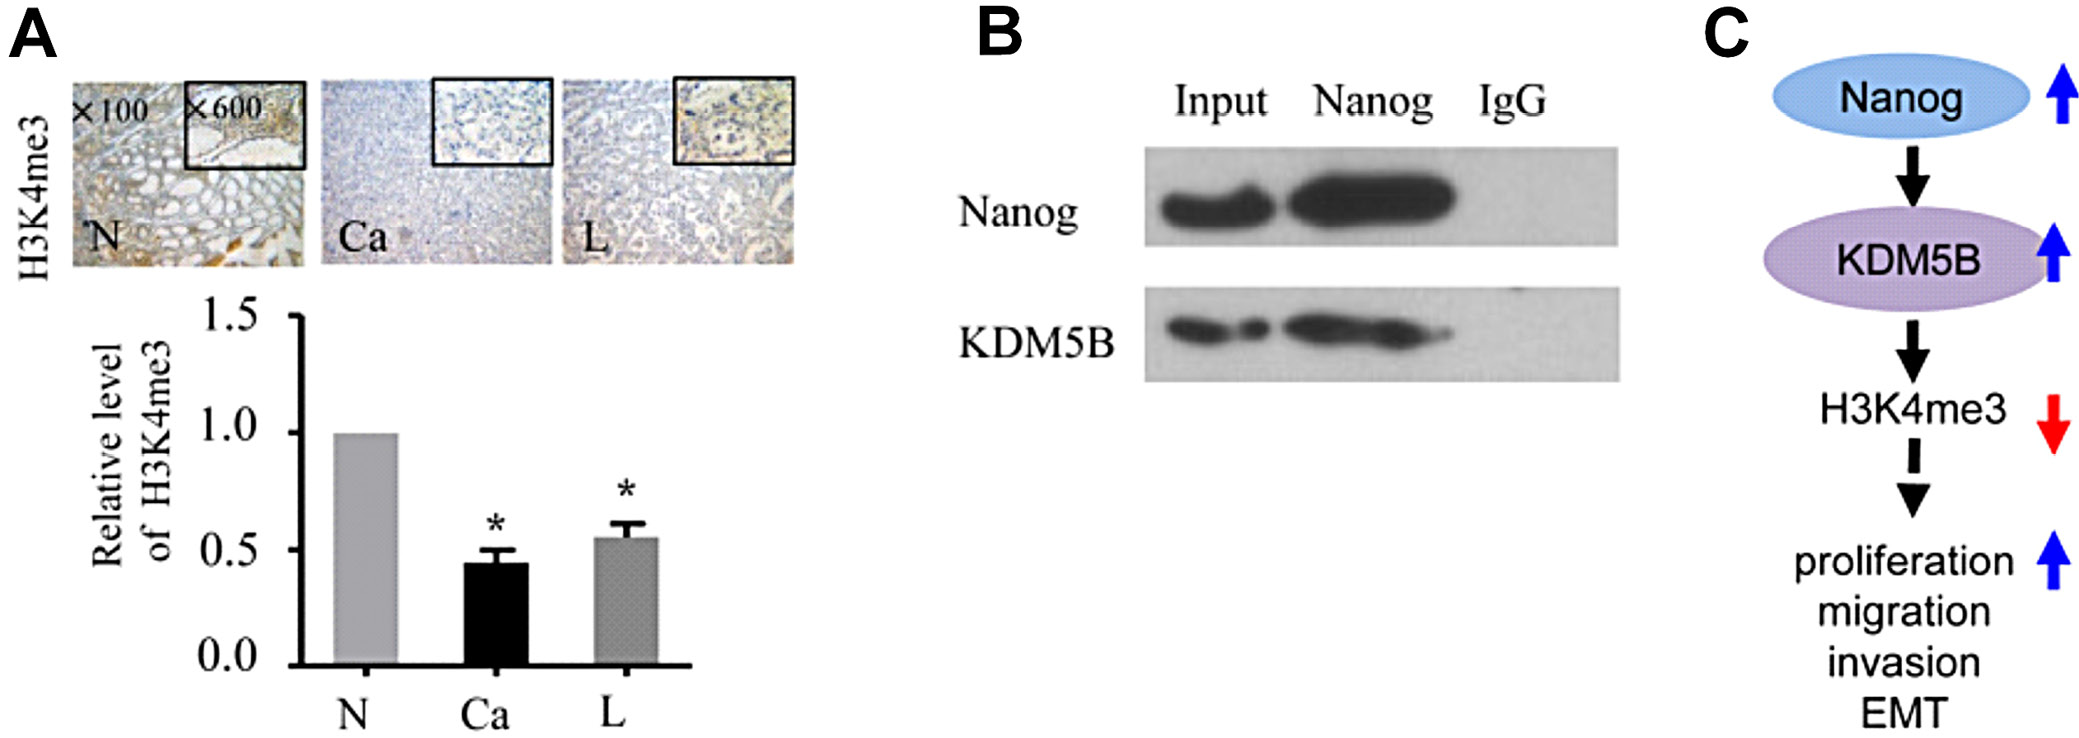
First, the silencing effects of si-KDM5B on KDM5B expression at the mRNA and protein levels were confirmed in SGC-7901 cells (Figure 5A,C). In addition, KDM5B knockdown impaired the invasive capability of the cells, inducing E-cadherin expression and inhibiting N-cadherin expression (Figure 5B–D). Given that KDM5B is recognized as an H3K4me3 demethylase, H3K4me3 levels in SGC-7901 cells following KDM5B knockdown were examined. Western blot results showed that the H3K4me3 level in the si-KDM5B group was significantly increased (Figure 5C,D). Moreover, 5’-deoxy-5’-methylthioadenosine (MTA), an inhibitor of histone arginine and lysine methylation, counteracted the changes in E-cadherin and N-cadherin expression induced by KDM5B knockdown in SGC-7901 cells (Figure 5E). The H3K4me3 levels in both Ca and L tissues were lower than those in N tissues, which was opposite to the KDM5B expression pattern shown in Figure 1A,B (Figure 6A). These data indicated that KDM5B regulates EMT markers by affecting H3K4me3 levels. Co-immunoprecipitation results further confirmed that KDM5B was bound to Nanog and was also upregulated by Nanog overexpression (Figure 6B,C).
Discussion
In the current study, Nanog and KDM5B were both overexpressed in gastric cancer tissues, metastatic lymph node cancer tissues, and TGF-β1-induced gastric cancer cells, suggesting that Nanog/KDM5B might play a role in gastric cancer metastasis in vitro and in vivo. Nanog is recognized as a transcription factor and plays a critical role in maintaining self-renewal and pluripotency in normal embryonic stem cells (ESCs).28, 29 It was previously reported that higher expression levels of Nanog in gastric cancer tissues were significantly associated with tumor size, TNM stage, tumor grade, and shorter OS.30 In this study, we verified in vitro that Nanog positively regulates the proliferation, migration, invasion, and EMT of gastric cancer cells. This study also demonstrated that Nanog could regulate its downstream target KDM5B, while silencing KDM5B inhibited invasion and EMT in gastric cancer cells by enhancing H3K4me3 levels. These results suggest that Nanog might play an important role in gastric cancer development through regulating the KDM5B/H3K4me3 pathway; clinically, targeting Nanog or KDM5B might serve as a promising strategy to suppress metastasis, particularly in patients with high Nanog/KDM5B expression, who may benefit from therapies disrupting this axis. Previously, the KDM5B degrader GT-653 was discovered to increase H3K4me3 levels and activate the type I interferon pathway, facilitating inhibition of immune escape.31 In breast cancer, several KDM5B inhibitors have also displayed anticancer effects, representing promising therapeutic strategies.32 Recently, it was discovered that targeting Nanog inhibited cell migration in gastric cancer, which is in accordance with the findings of this study. In other cancers, such as liver cancer, increased levels of Nanog are correlated with poor patient survival, and Nanog upregulation in cancer cells activates EMT, invasion, and drug resistance.33 Taken together with the functions of Nanog in other cancers,34 Nanog is not only a critical stem cell factor but also contributes to EMT and metastasis development in gastric cancer. Previous studies have shown that Nanog can interact with other canonical pathways, such as the Wnt/β-catenin pathway, JAK/STAT3 pathway, and Smad family proteins, to regulate EMT and cell self-renewal.6, 35, 36 Therefore, future studies can explore the potential interactions between Nanog and other canonical pathways in gastric cancer.
KDM5B is upregulated in many cancers, including lung cancer,24 head and neck squamous cell carcinoma,37 breast cancer,38 and gastric cancer.39 KDM5B is a major target of Nanog in regulating ESC self-renewal in mice, as identified with ChIP-seq screening.25 In this study, we confirmed that KDM5B was a downstream gene positively regulated by Nanog in gastric cancer cells, suggesting a possibly conserved regulatory pattern between Nanog and KDM5B in mammals. In addition, KDM5B was positively correlated with Nanog expression levels in gastric cancer tissues and metastatic lymph node cancer tissues. In HCC, Nanog was also highly expressed in KDM5B-high cases.40 In basal-like breast cancer, the phosphorylated KDM5B level at Ser1456 inhibited KDM5B occupancy on the promoter regions of the Nanog gene, leading to suppression of Nanog due to decreased H3K4me3 levels.41 Therefore, the function of KDM5B in different cancers and molecular subtypes needs to be specifically analyzed. For the first time, this study unveiled an interaction between Nanog and KDM5B at the protein level in gastric cancer. These data suggest that not only the expression but also the post-transcriptional modification and protein interaction of KDM5B in gastric cancer should be investigated
in the future.
Specific histone methylation is involved in gene reprogramming during EMT and the associated malignant features in primary prostate cells.42 In general, methylation of H3K4 around the transcription start site (TSS) is associated with active transcription. KDM5B specifically demethylates H3K4, thereby repressing gene transcription, and in the pluripotency of ESCs, KDM5B promotes H3K4 methylation at gene promoters and enhancers.43 In our study, KDM5B was verified to promote invasion and EMT of gastric cancer cells by decreasing H3K4me3 levels. We also found that H3K4me3 levels were lower in gastric cancer and metastatic lymph node cancer tissues than in normal gastric tissues. Enkhbaatar et al.44 reported that KDM5B overexpression could decrease H3K4me3 levels at the TSS of microRNA-200 (miR-200) and facilitate miR-200 transcription, which downregulates the transcription factors ZEB1 and ZEB2 and results in hypoexpression of E-cadherin in lung and colon cancer cells. Wang et al.39 reported that KDM5B expression is abnormally high in gastric cancer tissues and is entailed for the proliferation and metastasis of gastric cancer cells via regulation of the Akt pathway. It can be speculated that demethylation of H3K4me3 mediated by KDM5B in gastric cancer probably promotes EMT by affecting microRNAs, at least partially.
Limitations of the study
While our findings identify the Nanog/KDM5B/H3K4me3 pathway as a promising therapeutic target, 2 limitations should be noted. First, the restricted clinical sample size may limit the statistical power of subgroup analyses, although consistent trends were observed in the functional assays. Second, potential intratumoral heterogeneity could lead to sampling bias in the IHC results despite evaluation by 2 independent pathologists.
Conclusions
In the current study, we identified that Nanog and KDM5B were enriched in gastric cancer tissues (including metastatic lymph node cancer tissues) and TGF-β1-induced gastric cancer cells. The expression levels of Nanog in gastric cancer tissues and the corresponding metastatic lymph node cancer tissues were both positively associated with the levels of KDM5B. Loss- and gain-of-function experiments demonstrated that Nanog facilitated the progression of SGC- 7901 cells. KDM5B was a downstream gene positively regulated by Nanog. Silencing KDM5B inhibited invasion and EMT of SGC-7901 cells mediated by changes in histone H3 Lys4 trimethylation (H3K4me3) levels. Together, these findings reveal that Nanog plays a regulatory role in cell mobility by upregulating KDM5B in gastric cancer cells, which might provide new strategies for gastric cancer therapy. These data suggest that not only the expression but also the post-transcriptional modification and protein interactions of KDM5B in gastric cancer should be investigated in the future.
Supplementary data
The supplementary materials are available at: https://doi.org/10.5281/zenodo.15068902. The package contains the following files:
Supplementary Table 1. Normality assessment (Shapiro–Wilk test) for Figure 1B and Figure 6A.
Supplementary Table 2. Variance assessment (Brown–Forsythe test) for Figure 1B and Figure 6A.
Supplementary Table 3. Welch’s ANOVA with Dunnett’s T3 multiple-comparisons test.
Supplementary Table 4. Mann–Whitney statistical analysis.
Supplementary Table 5. Kruskal–Wallis test with Dunn’s multiple-comparisons test.
Supplementary Table 6. Two-way repeated measures (RM) ANOVA with Geisser–Greenhouse correction and Šídák’s post hoc test.
Data Availability Statement
The datasets supporting the findings of the current study are openly available in Zenodo at https://doi.org/10.5281/zenodo.17398533.
Consent for publication
Not applicable.
Use of AI and AI-assisted technologies
Not applicable.