Abstract
Background. Acute myeloid leukemia (AML) is a malignancy characterized by abnormal myeloid proliferation. Despite therapeutic advances, relapse is frequent. Understanding the tumor microenvironment (TME), particularly the dysfunction and interactions of natural killer (NK) cells, is essential for improving immunotherapeutic strategies such as chimeric antigen receptor T-cell (CAR-T) and chimeric antigen receptor natural killer cell (CAR-NK) therapies.
Objectives. This study aimed to characterize the AML TME using single-cell RNA sequencing (scRNA-seq), focusing on NK cell dysfunction and their interactions with immunosuppressive cell populations.
Materials and methods. We investigated single-cell RNA sequencing data from 59 samples, comprising 40 AML and 19 healthy donor (HD) samples, obtained from public sources and processed using standard methods. After quality control and doublet removal, 284,687 high-quality cells were retained. Acute myeloid leukemia malignant cells were identified using cluster-specific occupancy scores and inferred copy number variations. Batch effects were corrected with Harmony, followed by clustering and cell-type annotation using SingleR and established markers. We performed pathway activity profiling with gene set variation analysis (GSVA), explored intercellular communication using CellChat, and inferred cellular trajectories with Monocle3. Functional characteristics of NK cell subsets were evaluated using curated gene sets, and transcriptional regulation was assessed with pySCENIC.
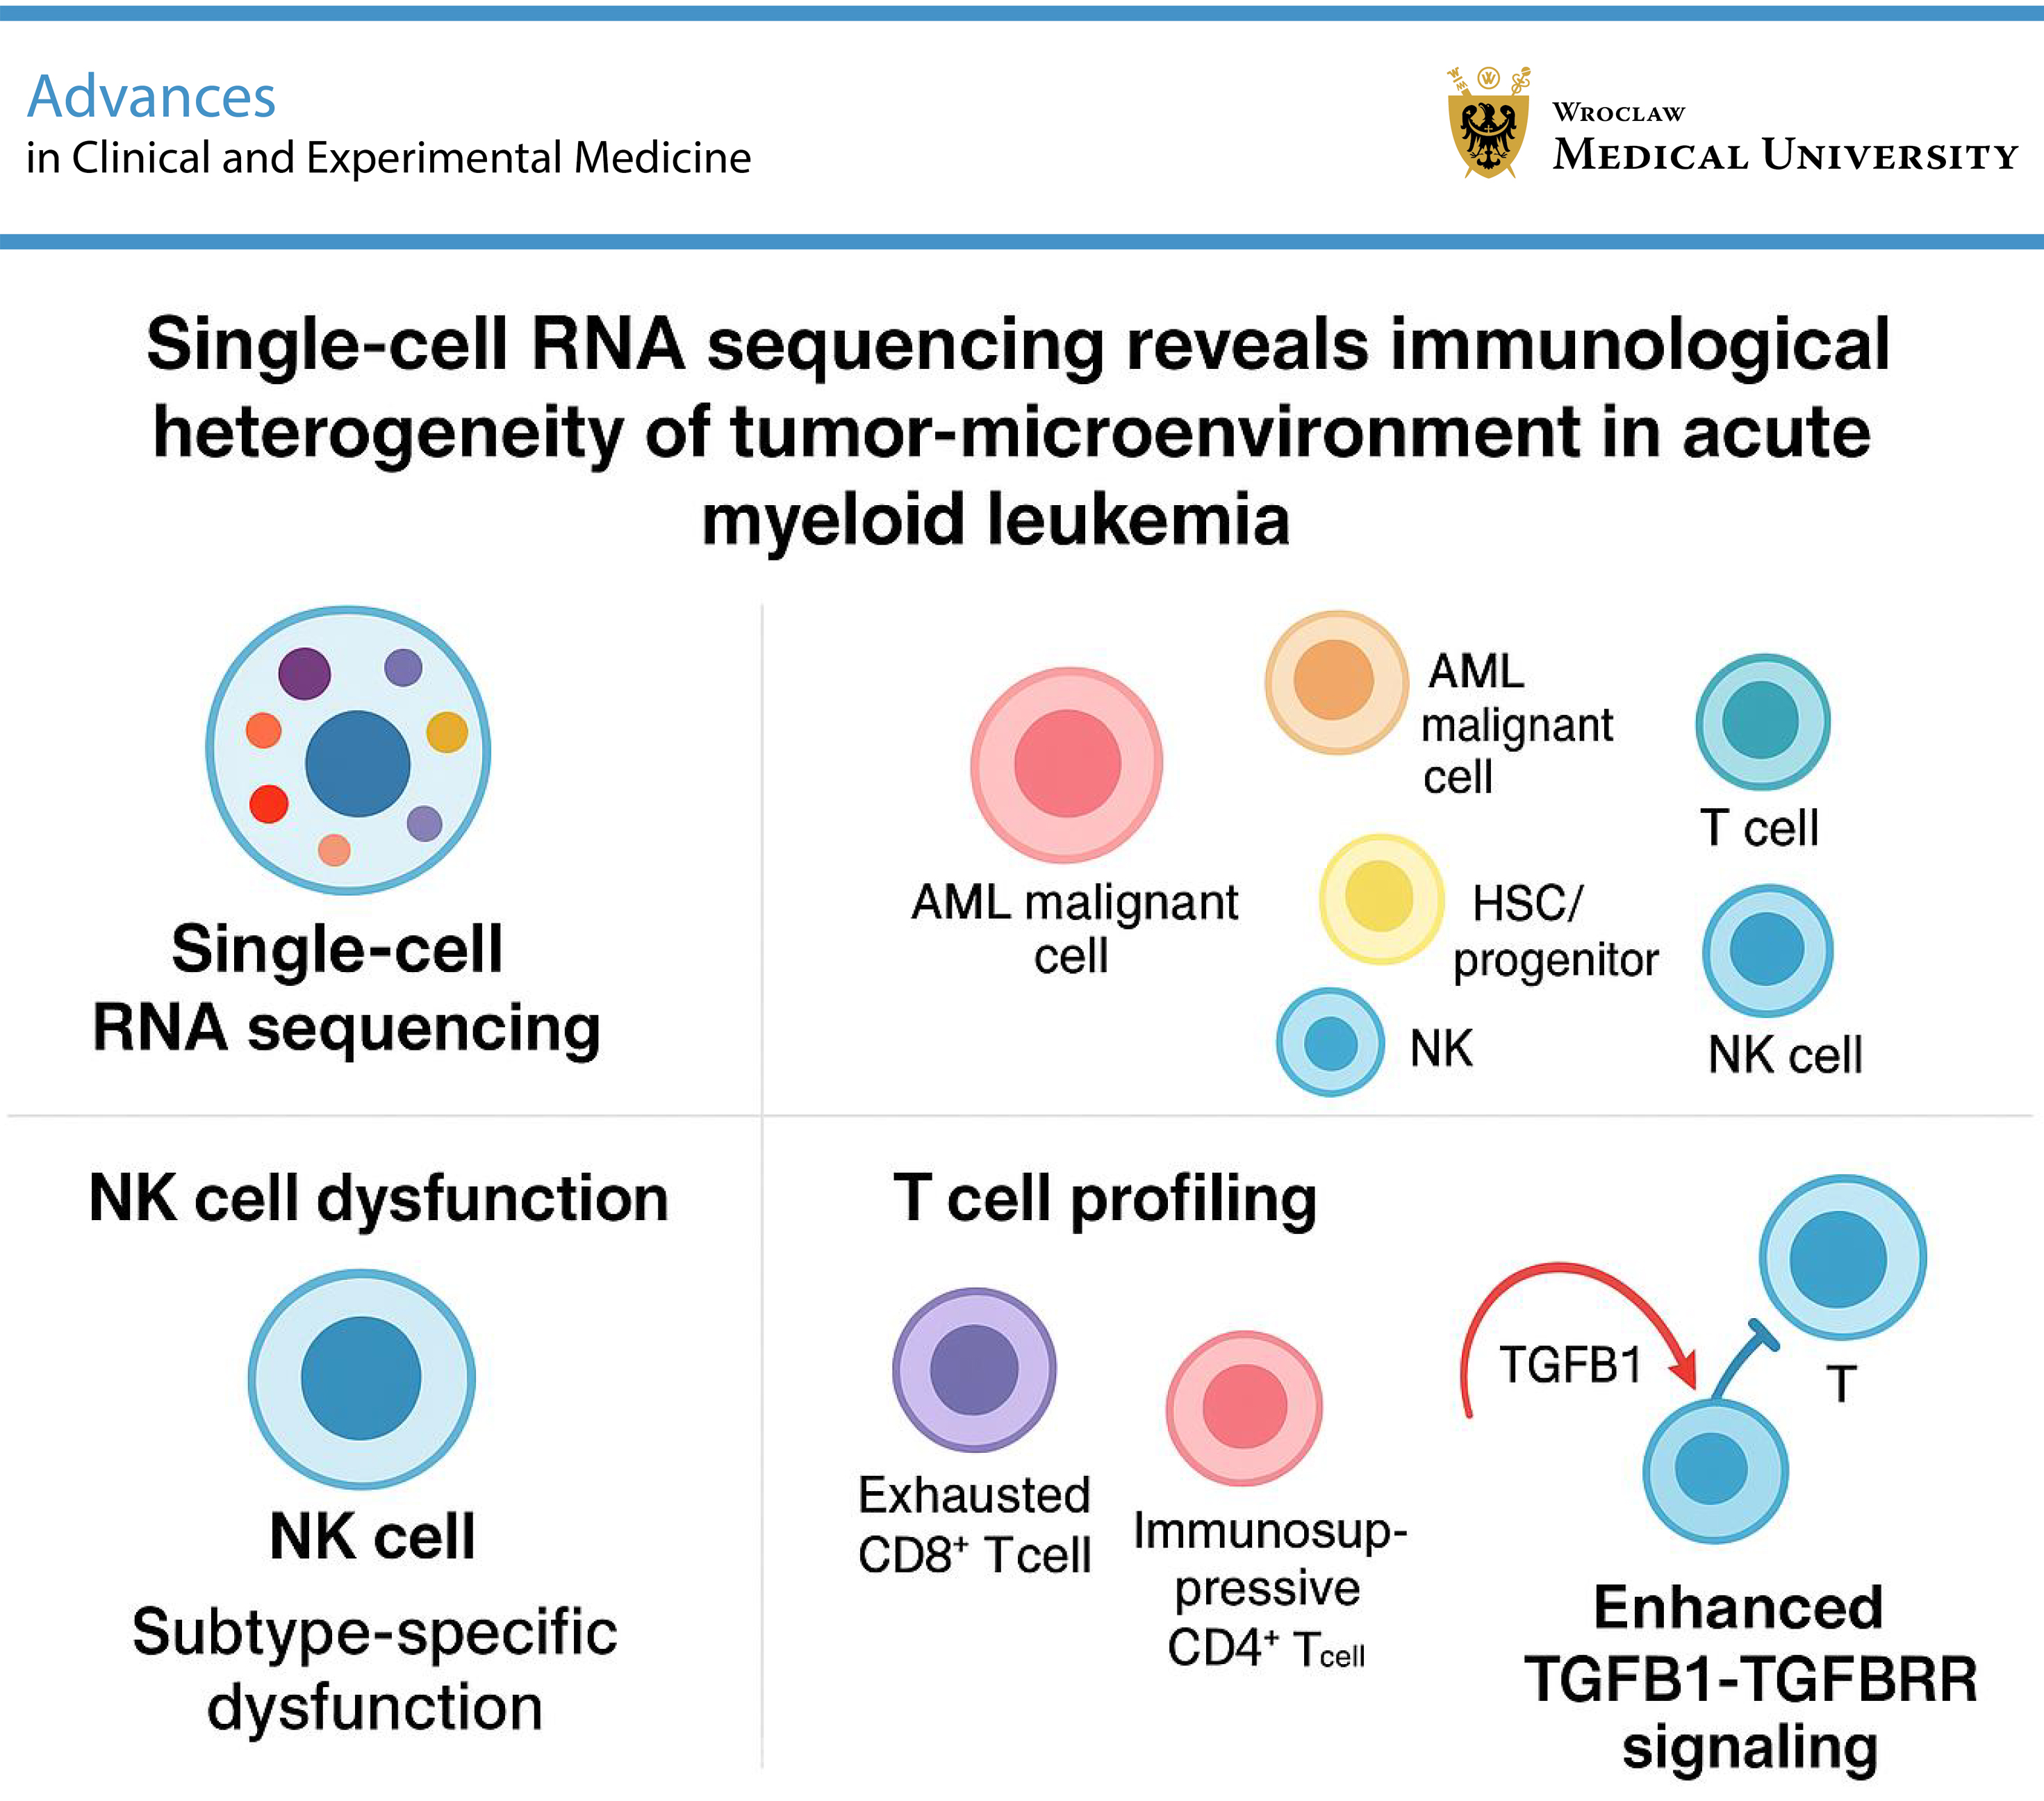
Results. Single-cell RNA sequencing of 40 AML and 19 HD samples identified 76 cell clusters, including patient-specific malignant cells with elevated copy number variations (CNVs). Acute myeloid leukemia samples showed altered immune composition, with increased plasma cells and hematopoietic stem cell (HSC)/progenitor populations. T-cell analysis revealed higher proportions of exhausted CD8+T_LAG3 and immunosuppressive CD4+T_FOXP3 cells in AML, while CD4+T_GZMK cells were more abundant in HD samples. Natural killer (NK) cells exhibited AML-specific subtypes, notably NK_CD56dim_DNAJB1, characterized by terminal exhaustion and high stress scores. Myeloid analysis showed elevated LAMP3+ dendritic cells and macrophages in AML. Notably, enhanced interactions between NK_CD56dim_DNAJB1 and CD8+ T cells via TGFB1-TGFBR signaling suggest key immunoregulatory mechanisms in AML progression.
Conclusions. This study highlights the cellular heterogeneity and complex immune interactions within the AML microenvironment, offering insights into immune evasion and informing future immunotherapeutic and targeted treatment strategies.
Key words: tumor microenvironment, NK cell, T cell, acute myeloid leukemia, scRNA-seq
Background
Acute myeloid leukemia (AML) is a type of blood cancer caused by the unregulated growth of myeloid progenitor cells in the bone marrow.1 Despite the high incidence and mortality rates associated with AML, advancements in chemotherapy, hematopoietic stem cell transplantation, and targeted therapy have significantly improved complete remission and disease-free survival (DFS) rates. However, the overall survival (OS) rate remains low due to the high risk of relapse.2 Immunotherapy has emerged as a viable alternative for AML treatment. Among these therapies, CAR-NK therapy, which employs natural killer (NK) cells instead of T cells, has demonstrated impressive clinical outcomes.3, 4 These therapies leverage the concept of the tumor microenvironment (TME).5 However, a limited understanding of the AML TME poses a significant challenge to the development of effective immunotherapies.
The AML TME is a complex network consisting of various components, including the vascular system, stromal cells, immune cells, extracellular matrix (ECM), and molecular signals.6 Natural killer cells are key components of the innate immune system that play an important role in tumor immunotherapy.7 These cells are categorized into 2 primary subgroups based on the expression of surface markers CD56 (NCAM1) and CD16 (FCGR3A): CD56bri and CD56dim. CD56bri NK cells predominantly produce antiviral pro-inflammatory cytokines such as interferon gamma (IFN-γ) and tumor necrosis factor alpha (TNF-α), whereas CD56dim NK cells exhibit potent cytotoxic capabilities due to higher levels of perforin and granzyme B.8, 9, 10 Additionally, CD56dim NK cells express CD16, enabling them to perform antibody-dependent cell-mediated cytotoxicity (ADCC) to target and eliminate antibody-marked cells.11
Despite their crucial role, NK cell function is often impaired within the TME due to factors such as hypoxia-induced limitations on NK cell activity and mitochondrial fragmentation, as well as the immunosuppressive effects of soluble factors like transforming growth factor beta (TGF-β).12, 13, 14 Various cell types in the TME, such as regulatory T cells (Tregs), myeloid-derived suppressor cells (MDSCs), and LAMP3+ DCs, decrease NK-cell immune responses, demonstrating the intricate relationship between NK cells and the TME.15, 16 Tregs suppress NK-cell cytotoxicity by downregulating NKG2D through membrane-bound TGF-β and by secreting interleukin (IL)-10, IL-35, and TGF-β to induce functional exhaustion.17, 18 MDSCs, via high arginase 1 (ARG1), inducible nitric oxide synthase (iNOS), and reactive oxygen species (ROS), deplete L-arginine and generate oxidative stress.19 The IL-6/TGF-β/programmed death-ligand 1 (PD-L1) axis they deploy further attenuates activating receptor expression and cytotoxic activity in NK cells,20 while indoleamine 2,3-dioxygenase (IDO)-mediated tryptophan catabolism exacerbates NK dysfunction. Additionally, LAMP3+ dendritic cells (DCs) secrete CCL17 and CCL22, recruiting CCR4+ Tregs into the tumor niche.21, 22, 23
Recently, single-cell RNA sequencing (scRNA-seq) technology has emerged as a powerful tool for analyzing gene expression patterns at the single-cell level, greatly improving our understanding of the functional states of distinct cell types. This technology has made substantial progress in the study of various tumors, including glioma,24 endometrial carcinomas,25 and colon cancer.26 In the context of AML, scRNA-seq has provided a comprehensive landscape by detecting a variety of malignant cell types using single-cell genotyping.27 Furthermore, a study by Van et al., using paired scRNA-seq and T-cell receptor (TCR) repertoire profiling data, demonstrated that T-cell plasticity and genomic modifications are important in determining responses to programmed cell death protein 1 (PD-1) inhibition.28
Objectives
Our prior research focused on the microenvironment, emphasizing the dysfunctional status of T cells in AML.29 However, little attention has been paid to NK-cell dysfunction and its interactions with other immunosuppressive cell types. To further understand the association between the TME and AML progression, this study used scRNA-seq expression data from the current literature to create a comprehensive tumor ecosystem. We then investigated the dysfunction of tumor-infiltrating NK cells and their cell–cell interactions with other cell types. These findings offer valuable insights for the development of effective immunotherapies. This study aimed to construct a comprehensive map of the AML TME using single-cell RNA sequencing, with a particular focus on NK-cell dysfunction and interactions with immunosuppressive cell types. By doing so, we hoped to gain a better understanding of how the TME contributes to AML development and immune evasion, resulting in more effective immunotherapeutic strategies.
Materials and methods
Data collection
In this study, we collected expression matrices from a total of 59 samples for analysis. Nine samples were obtained from Petti et al.30 using 10X Genomics technology, including 5 AML and 4 healthy donor (HD) samples. Additionally, we acquired expression matrices from GSE116256 for 20 samples, including 16 AML and 4 HD samples sequenced using Seq-Well (https://shaleklab.com/resources/seq-well). It is important to note that only the 16 AML samples collected at diagnosis were included in our analysis. Furthermore, we retrieved the original sequencing data from GSE185381, which included 19 AML and 11 HD samples. The raw sequencing reads were processed using the Cell Ranger Software Suite (10× Genomics, v. 7.2.0) (https://www.10xgenomics.com) and refdata-gex-GRCh38-2020-A as the reference, yielding unique molecular identifier (UMI) matrices.
Ambient RNA correction and doublet removal
Ambient RNA contamination was estimated and corrected using the SoupX package v. 1.6.2.31 For each sample, a SoupChannel object was initialized, and the contamination fraction was estimated with the autoEstCont function. When automatic estimation was unsuccessful, a fixed contamination fraction of 0.2 was applied using the setContaminationFraction function, as recommended by the developers. Doublet detection was performed using the DoubletFinder package v. 2.0.4.32 Parameter optimization was conducted via the paramSweep function and the summarizeSweep function, and the optimal pK value was selected using the find.pK function based on the BCmetric. The expected doublet rate was estimated as nCells × 8 × 10⁻⁶, in line with platform-specific loading guidelines. To account for homotypic doublets, we applied the modelHomotypic function and adjusted the expected doublet number accordingly. Predicted doublets were excluded from all subsequent analyses.
Preprocessing, integration, and clustering of scRNA data
Filtered count matrices for each sample were imported into Seurat v. 5.0.233 for downstream analysis. Genes expressed in fewer than 10 cells were excluded using the CreateSeuratObject (min.cells = 10) function. Cells were filtered based on standard quality control criteria: those with fewer than 300 detected genes, fewer than 1,000 UMIs, or >20% mitochondrial UMI content were excluded as low-quality cells. Additionally, cells with more than 8,000 genes or 20,000 UMIs were removed to eliminate likely doublets. Standard Seurat preprocessing steps were applied, including NormalizeData, FindVariableFeatures, ScaleData, RunPCA, FindNeighbors, and FindClusters. Clustering was performed across multiple resolutions (0.2, 0.5, 0.8, 1.0, 1.2, and 1.5), and the results were assessed based on silhouette width and biological interpretability. A resolution of 0.8 was selected for final clustering, as it provided optimal granularity and biological coherence. To address batch effects arising from the use of different platforms (10× Genomics and Seq-Well), we implemented a 2-step integration strategy. First, Seurat objects were constructed separately for each platform, retaining only the intersecting gene set to ensure consistency. Batch correction was then performed using the Harmony (v. 1.2.0; https://github.com/immunogenomics/harmony)34 algorithm via the RunHarmony function, specifying group.by.vars = c(“Sample”, “Plate”) and theta = c(2, 2) to account for both sample- and plate-specific variation. Post-integration, the datasets demonstrated high concordance in joint low-dimensional embeddings, validating the effectiveness of batch correction and enabling unified downstream analyses. After stringent quality control and integration, a total of 284,687 high-quality cells were retained for further analysis, comprising 175,335 AML cells and 109,352 HD cells.
AML malignant cells identification
Given the scarcity of chromosome gains or losses in AML malignancies, as well as the lack of reliable and highly repetitive markers for identifying malignant cells in AML, 2 techniques were used in this investigation to distinguish malignant cells from healthy counterparts. Initially, 59 samples were combined without removing batch effects between them. Using a resolution of 0.8 in the “FindClusters” function, the cells were divided into 77 clusters. Each cluster’s occupancy score was then determined. For each AML patient and cluster, we divided the patient’s cell count by the total number of patient and control cells. If the occupancy score surpassed 0.75, we classified the cluster as AML patient-specific and likely malignant.35 First, immune cell markers were used to annotate the clusters, identifying T/NK and B cell populations. Subsequently, T/NK and B cells from normal samples were extracted to serve as reference cells. The sliding window size was set to: window_length = 101, smooth_method = “pyramidal”. Furthermore, inferCNV was run on each cluster with normal cells as references. InferCNV was ran with the default options, which included setting de-noise to TRUE, HMM to TRUE, and analysis_mode to “subclusters”. Through these approaches, only clusters demonstrating AML patient-specificity and distinct copy number variations (CNVs) were identified as AML malignancies.
Clustering and cell type annotation
After excluding malignant AML cells, the remaining non-malignant cells were re-clustered using the same analytical pipeline. Batch effects across samples were corrected using the Harmony algorithm (RunHarmony v. 1.0), ensuring improved alignment across datasets. Cluster-specific marker genes were identified using the FindAllMarkers (only.pos = FALSE, min.pct = 0.15, logfc.threshold = 0.2) function. To refine marker selection, only genes with higher expression in the target cluster (pct.1 > pct.2) were retained. Cell type annotation was performed using the SingleR tool v. 1.4.1 in combination with the CellMarker database (http://www.bio-bigdata.center) and curated marker sets from Zhang et al.36
Statistical analysis of cell-type proportions
To quantify and compare cell-type composition between AML and HD samples, we performed a sample-level proportion analysis. Each individual cell was annotated by cell type and grouped by sample identity and disease group. The relative proportion of each cell type per sample was calculated by normalizing the number of cells of that type to the total number of cells within the same sample. Differences in cell-type proportions between AML and HD groups were statistically assessed using 2-sided unpaired Student’s t-tests, as implemented by the stat_compare_means function from the ggpubr R package v. 0.4.0 (https://cran.r-project.org/package=ggpubr). Group comparisons were performed independently for each cell type using a faceted boxplot representation. For each comparison, individual samples were treated as independent observations (n = number of samples per group), and each point on the plot corresponds to a single patient/sample. To control the false discovery rate arising from multiple testing across cell types, p-values were adjusted using the Benjamini–Hochberg (BH) method. Adjusted p-values (FDR) were reported in scientific format directly in the figures. Significance was determined at a threshold of adjusted p < 0.05.
Gene set variation analysis
To evaluate pathway activity at the single-cell level, we performed gene set variation analysis (GSVA) using the single-sample gene set enrichment analysis (ssGSEA) method, implemented via the GSVA R package v. 1.26.0 (https://bioconductor.org/packages/release/bioc/html/GSVA.html). The analysis was conducted on a log-normalized gene expression matrix, with genes as rows and individual cells as columns. The gsva function was used with the following parameters: method = “ssgsea” to specify the ssGSEA algorithm, kcdf = “Gaussian” to accommodate continuous log-transformed input data, and abs.ranking = TRUE to enable absolute gene ranking, which enhances the robustness of ssGSEA scoring.
Receptor-ligand interaction analysis
To better understand the interactions between NK cells and other immune cells, we used CellChat (https://github.com/sqjin/CellChat) to compute ligand–receptor communication networks. CellChat is a computational tool for statistically inferring and analyzing cell–cell communication networks using scRNA-seq data, allowing the prediction of important signaling relationships and their coordination in cellular activity. It accomplishes this by incorporating prior knowledge about signaling molecules, receptors, and their cofactors.
Monocle trajectory analysis
We used the Monocle3 tool (https://cole-trapnell-lab.github.io/monocle3) to determine the transition states between CD8+ T-cell and CD56dim NK-cell subtypes. For CD8+ T cells, we designated CD8T_CCR7, representing naive T cells, as the root. Similarly, for CD56dim NK cells, we set NK_CD56dim_CCL3 as the root.
Definition of cytotoxicity, inflammatory, and stress gene sets
To assess functional differences between NK-cell subsets, we compiled a comprehensive list of cytotoxicity-, inflammatory-, and stress-related gene sets, as well as activating and inhibitory receptors from prior studies. The gene sets described by Tang et al.37 (Supplementary Table 1) were included. We calculated the scores for each gene set using Seurat’s AddModuleScore function (https://www.rdocumentation.org/packages/Seurat/versions/2.3.4/topics/AddModuleScore).
Single-cell regulatory network analysis
A cis-regulatory analysis using pySCENIC v. 0.11.2 (https://github.com/aertslab/pySCENIC) was performed to identify important transcription factors (TFs) across different cell types. The analysis concentrated on 5 types of tumor-associated macrophages (TAMs). Transcription factors were identified using GENIE3 (https://github.com/aertslab/GENIE3), organized into modules known as regulons, and evaluated using RcisTarget (https://github.com/aertslab/RcisTarget) with default gene–motif rankings. The regulon activity of each cell in the dataset was then analyzed using AUCell (https://github.com/aertslab/AUCell).
Statistical analyses
Statistical analyses were performed using R v. 4.1.2 (R Foundation for Statistical Computing, Vienna, Austria). Data are presented as mean ± standard deviation (SD). Student’s t-test was applied for statistical analyses of differences between 2 groups. In the receptor–ligand interaction analysis, the statistical significance of interaction pairs was determined using a one-sided Wilcoxon rank-sum test. Differences with p < 0.05 were considered statistically significant.
Results
Single-cell RNA landscape of AML and HD
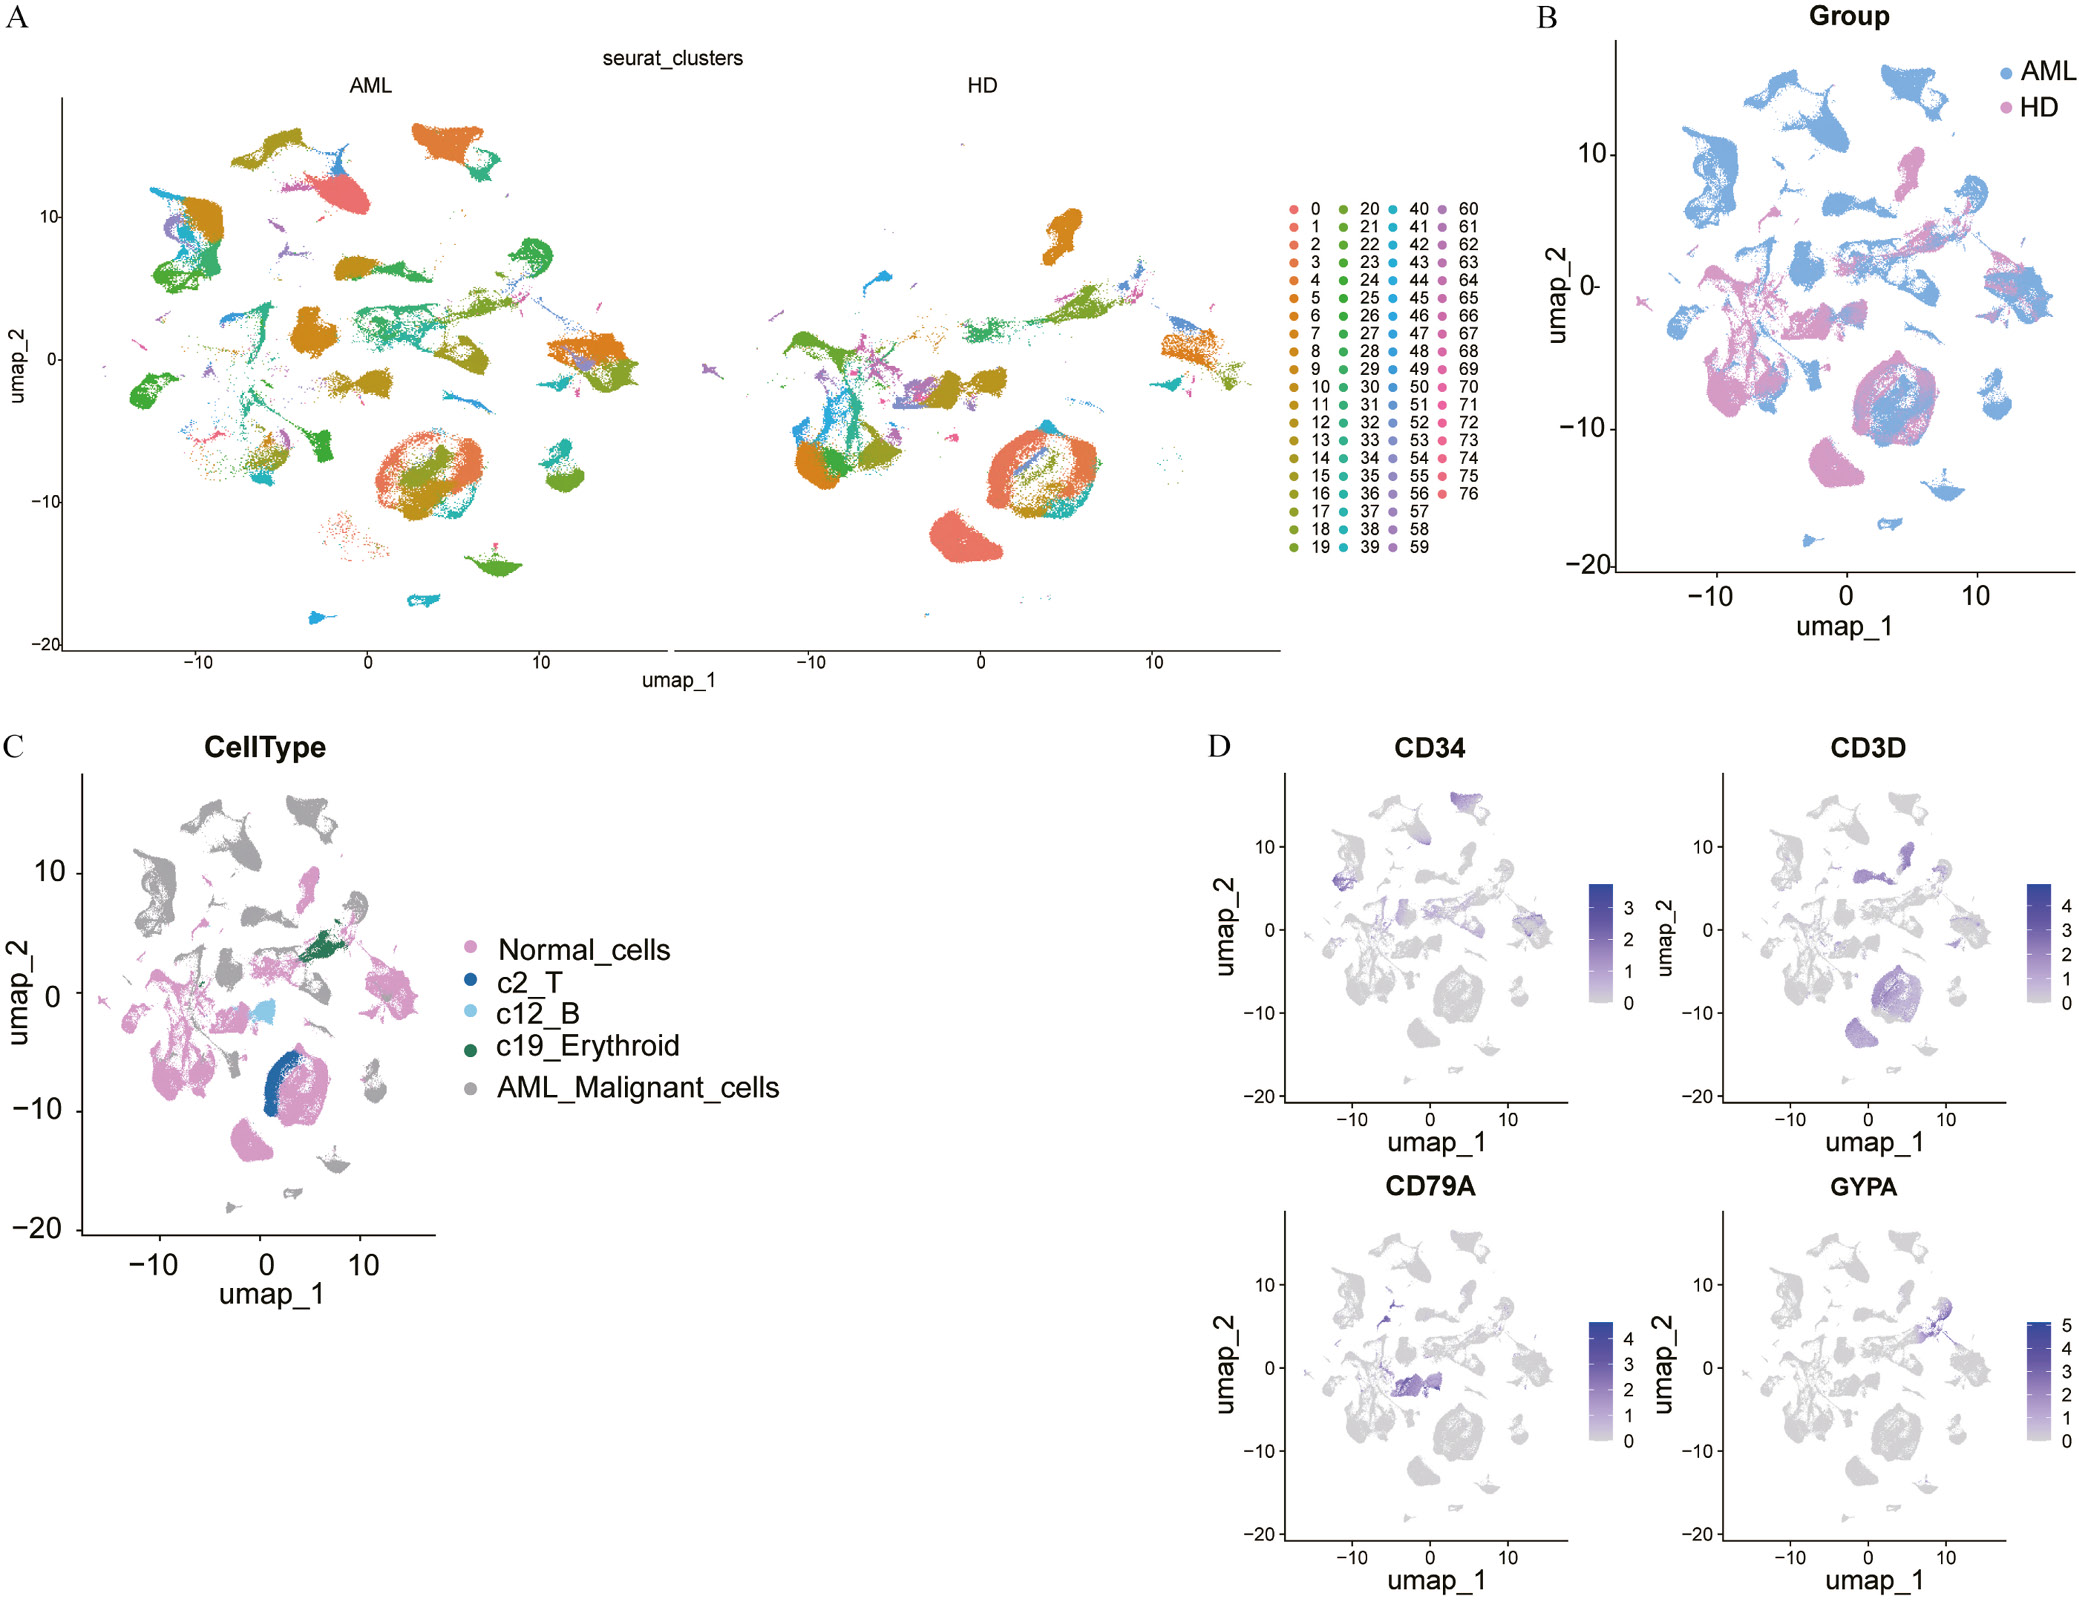
To study the cellular components in AML, we performed scRNA-seq analysis on 40 AML and 19 HD samples collected from public datasets. Following standard processing and quality screening of the raw sequencing data, 284,687 cells were selected for analysis. Unsupervised clustering was then carried out, resulting in the identification of 76 cellular subpopulations (Figure 1A). We grouped all cells and assigned an occupancy score to each cluster, which represents the proportion of cells from a particular patient within that cluster. Clusters with an occupancy value greater than 0.75 were classified as patient-specific clusters. These patient-specific clusters were then identified as malignant cells unique to a given patient with AML (Figure 1B–D). We validated the malignant cells by inferring aneuploidy status using inferCNV (https://github.com/broadinstitute/infercnv), which estimates CNVs. Acute myeloid leukemia malignant cells had higher CNV levels than AML B cells, T cells, and erythroid cells (Supplementary Fig. 1).
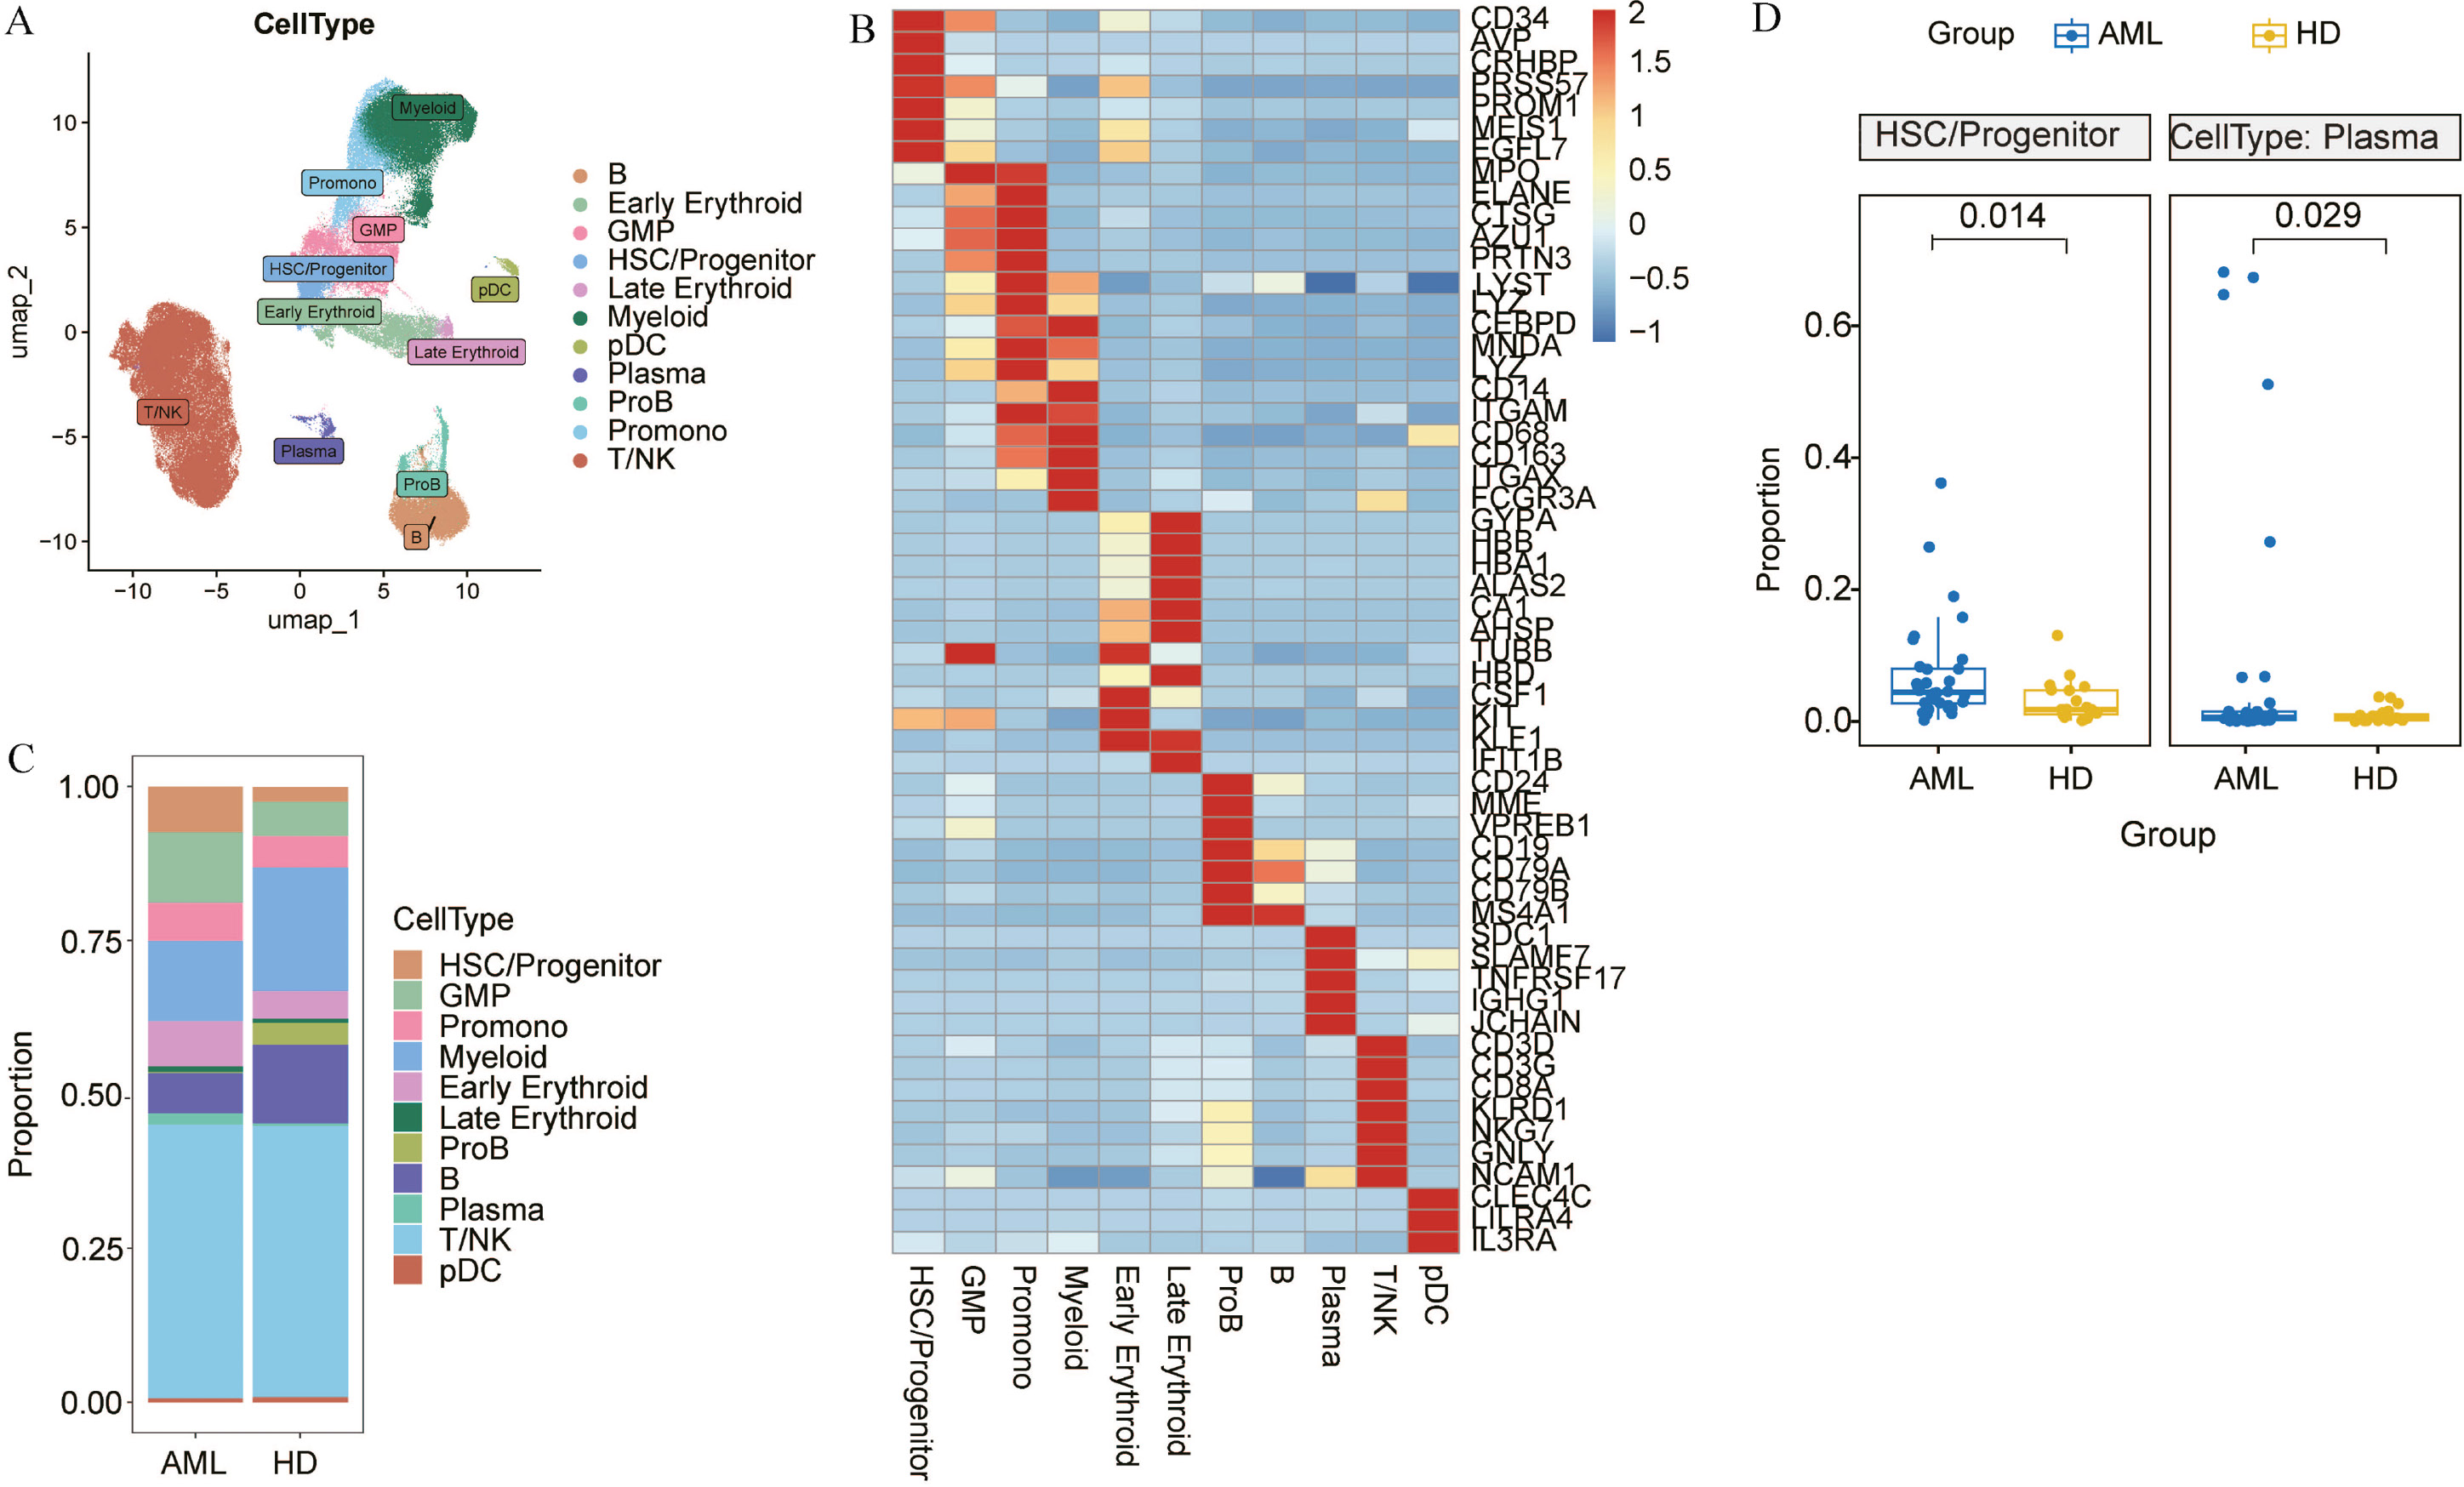
After excluding the identified malignant cells, we performed unsupervised clustering of immune cells and annotated these clusters into the following main cell types: B cells, Early Erythroid, granulocyte-monocyte progenitors (GMPs), hematopoietic stem cell (HSC)/progenitors, Late Erythroid, Myeloid, plasmacytoid dendritic cells (pDCs), Plasma, Pro-B cells (ProB), Promon, and T/NK cells (Figure 2A,B). We next explored differences in cell-type proportions between AML and HD samples. The results showed that the distribution of cell subtypes differed between the 2 groups, with significantly enriched Plasma and HSC/Progenitor populations in AML compared with the HD group (p < 0.05) (Figure 2C,D).
Re-clustering of T cells and functional analysis in AML
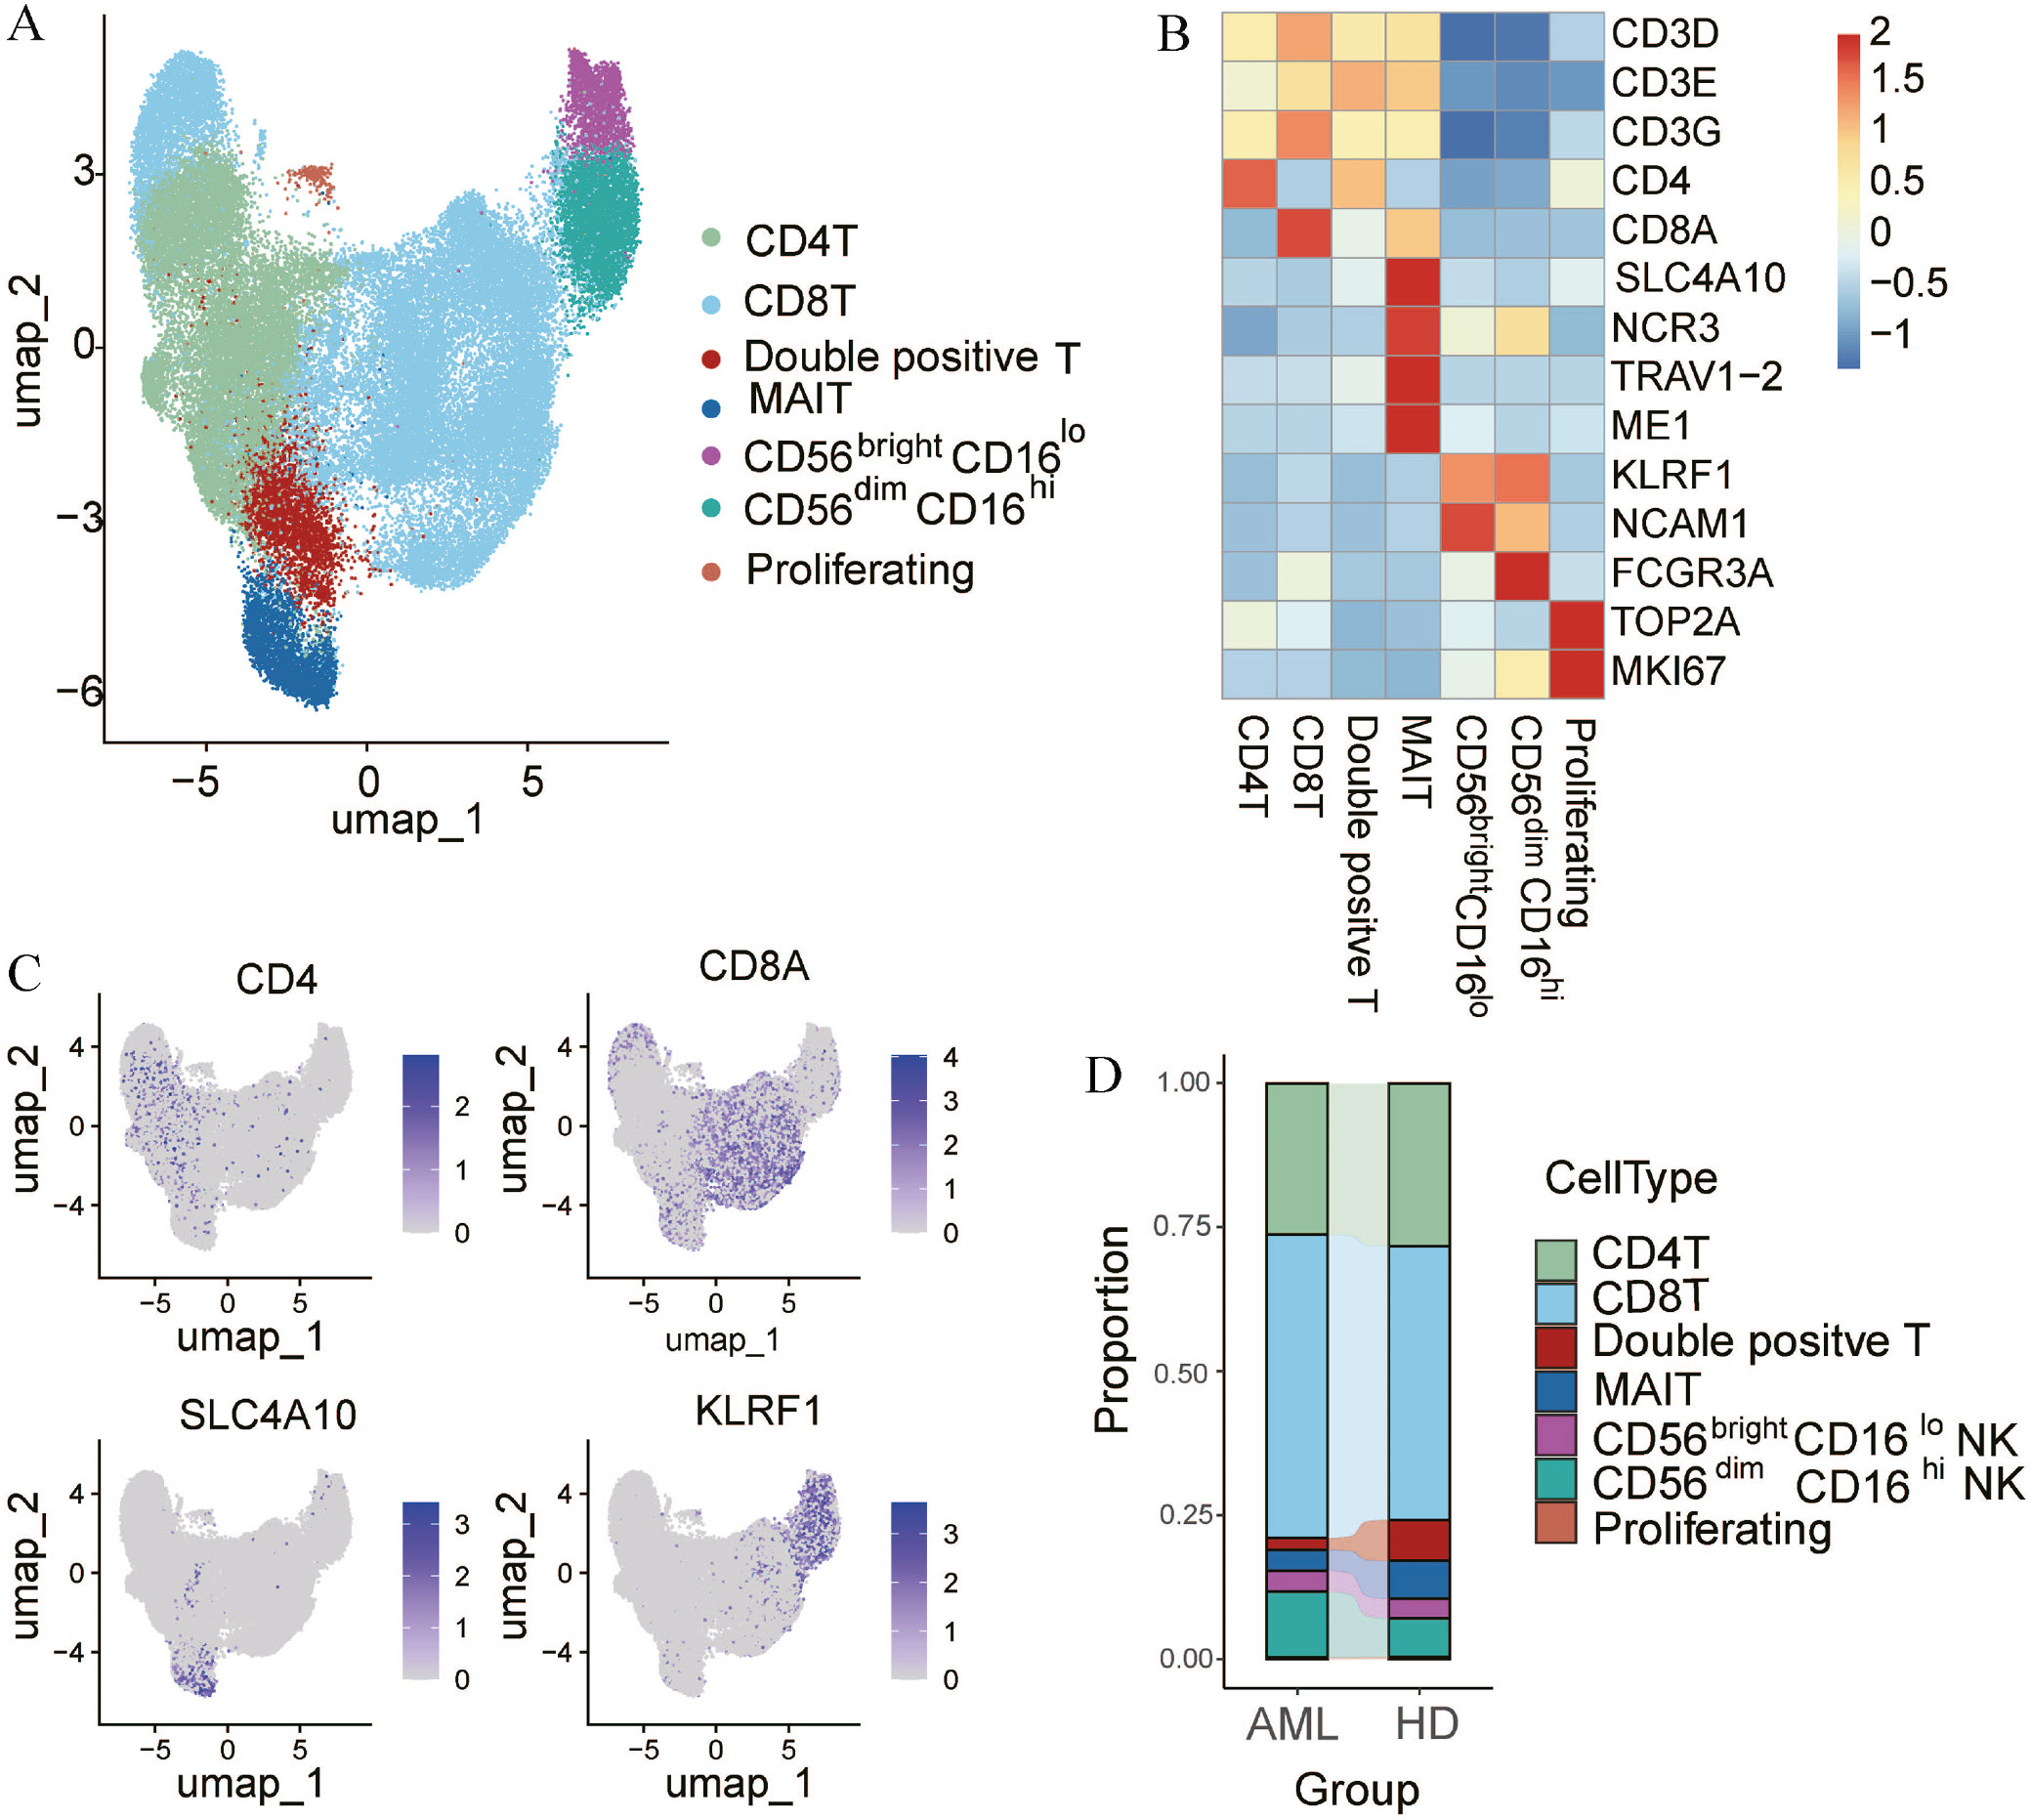
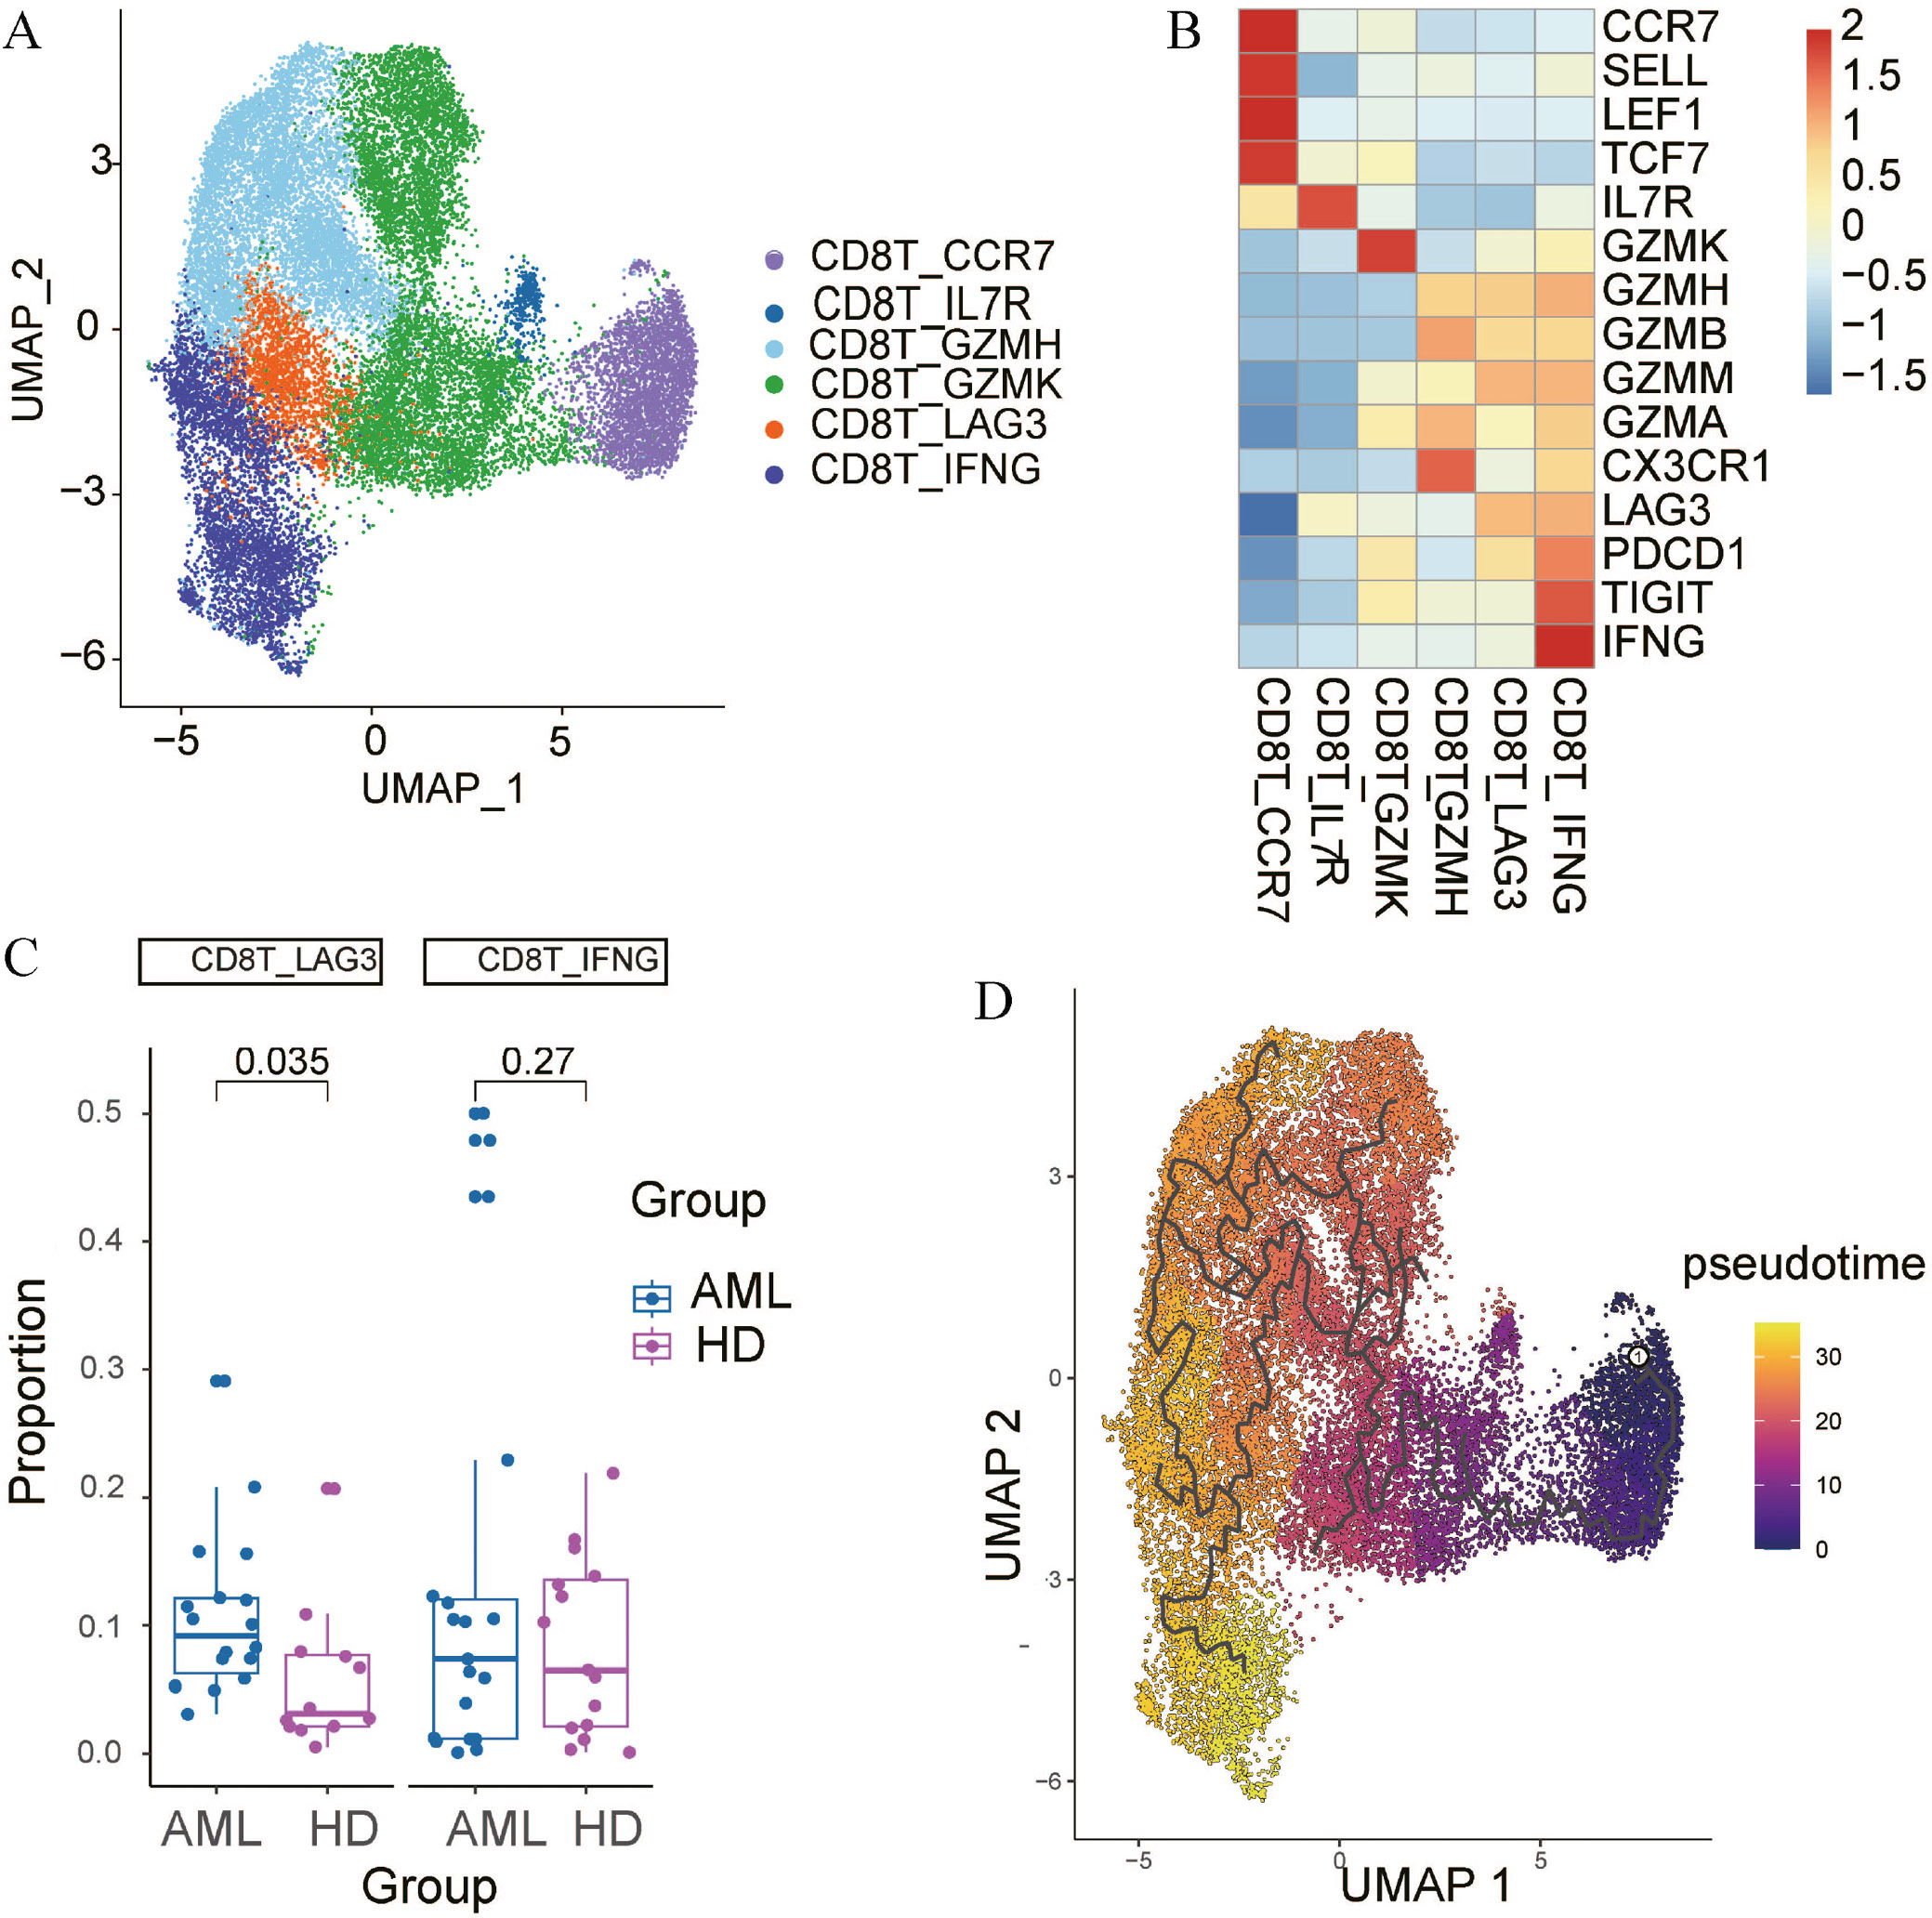
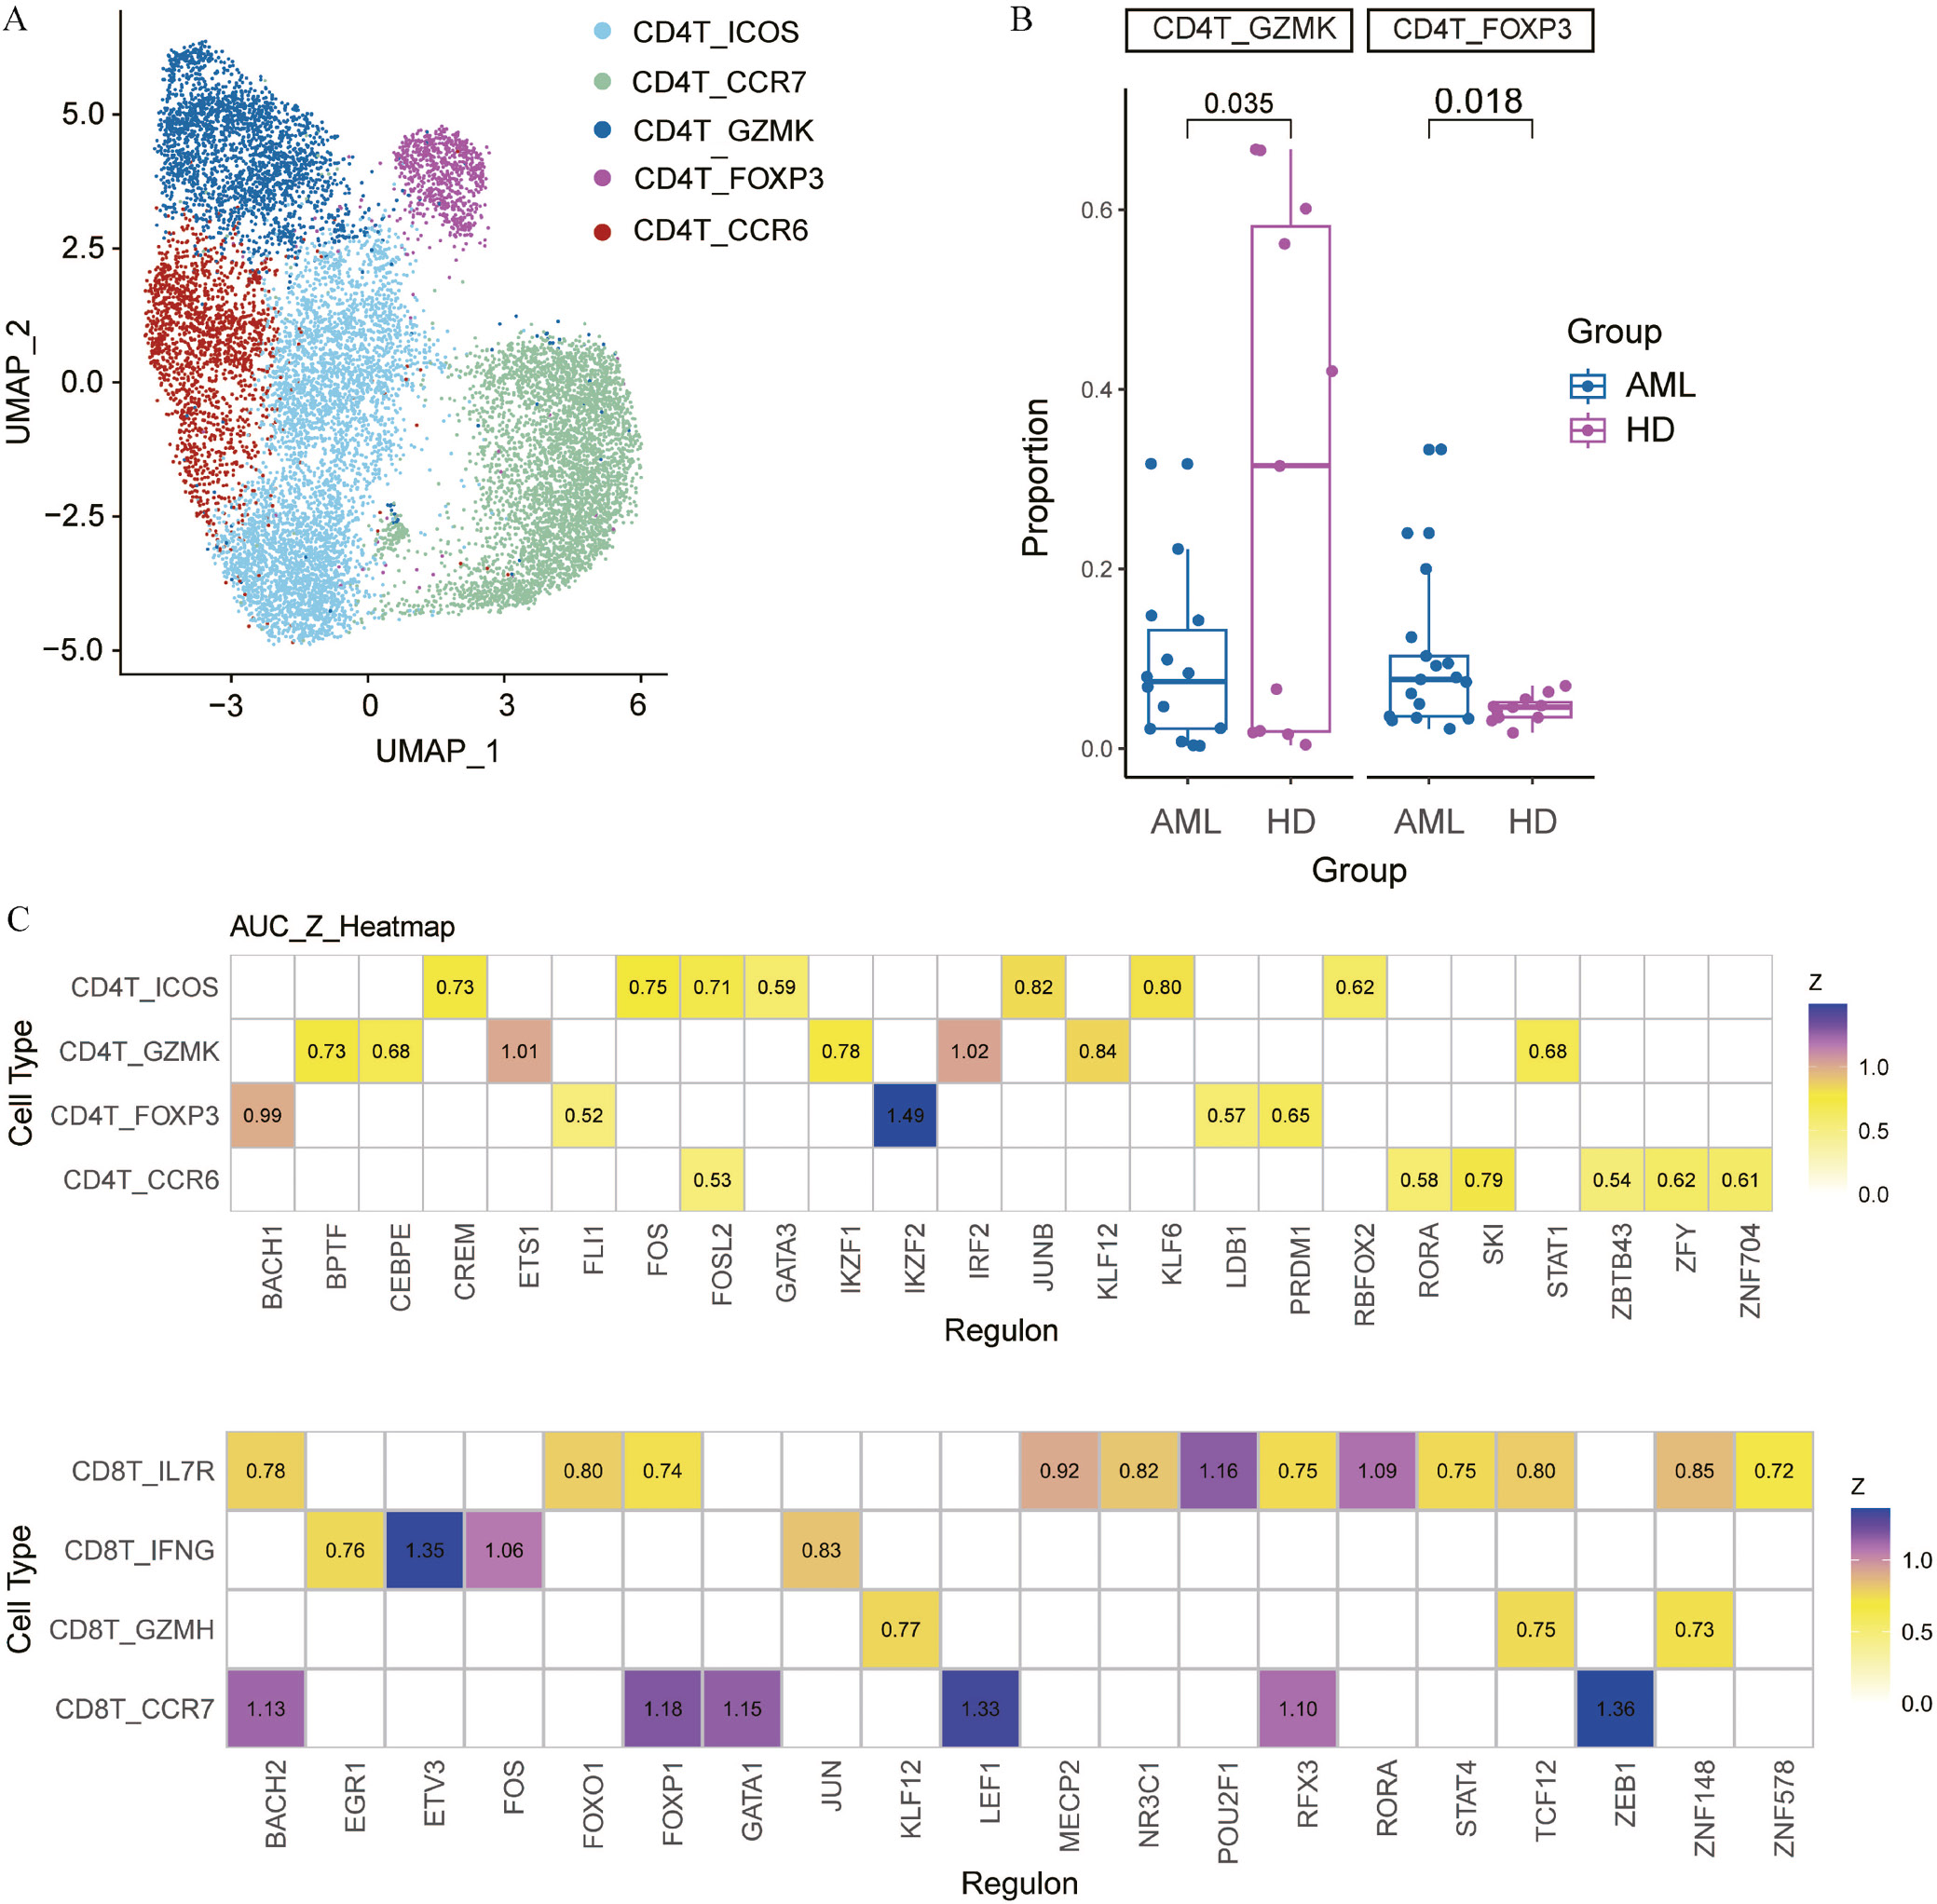
Because T cells play an important role in the evolution of AML, we performed unsupervised clustering of T cells and identified 7 cell subtypes using conventional markers. CD4+ and CD8+ T lymphocytes accounted for the majority of cell subtypes in these clusters (Figure 3A–C). We compared the cell proportions in HD and AML samples, and the results showed that AML had a greater proportion of CD8+ T cells, whereas HD had a higher proportion of CD4+ T cells (Figure 3D). We then performed a re-clustering analysis of CD8+ T cells, and 6 cell subsets were identified based on marker genes (Figure 4A,B). CD8+T_LAG3 cells had a substantially larger proportion in AML than in HD (p < 0.05) (Figure 4C). This finding implies that CD8+ T cells in AML are likely to become exhausted as the disease progresses. In addition, pseudotime analysis of CD8+ T cells revealed that CD8+T_CCR7 represents an early stage and CD8+T_LAG3 corresponds to a later stage in the pseudotime sequence (Figure 4D).In addition, we performed a re-clustering analysis of CD4+ T cells and identified 5 subtypes based on canonical T-cell marker genes (Figure 5A). Notably, the proportion of CD4+T_GZMK was significantly higher in HD than in AML (p = 0.035), while CD4+T_FOXP3 was prominently present in AML (p = 0.018) (Figure 5B). GSVA revealed that CD4+T_ICOS is mainly associated with MYC_TARGETS, MYOGENESIS, and P53_PATHWAY, while CD4+T_CCR7 is predominantly enriched in NOTCH_SIGNALING. CD4+T_CCR6 is primarily involved in HALLMARK_SPERMATOGENESIS and TGF_BETA_SIGNALING. CD4+T_GZMK is enriched in HALLMARK_PANCREAS_BETA_CELL, ALLOGRAFT_REJECTION, and APOCAL_JUNCTION. CD4+T_FOXP3 is notably enriched in HALLMARK_HEME_METABOLISM (Supplementary Fig. 2).
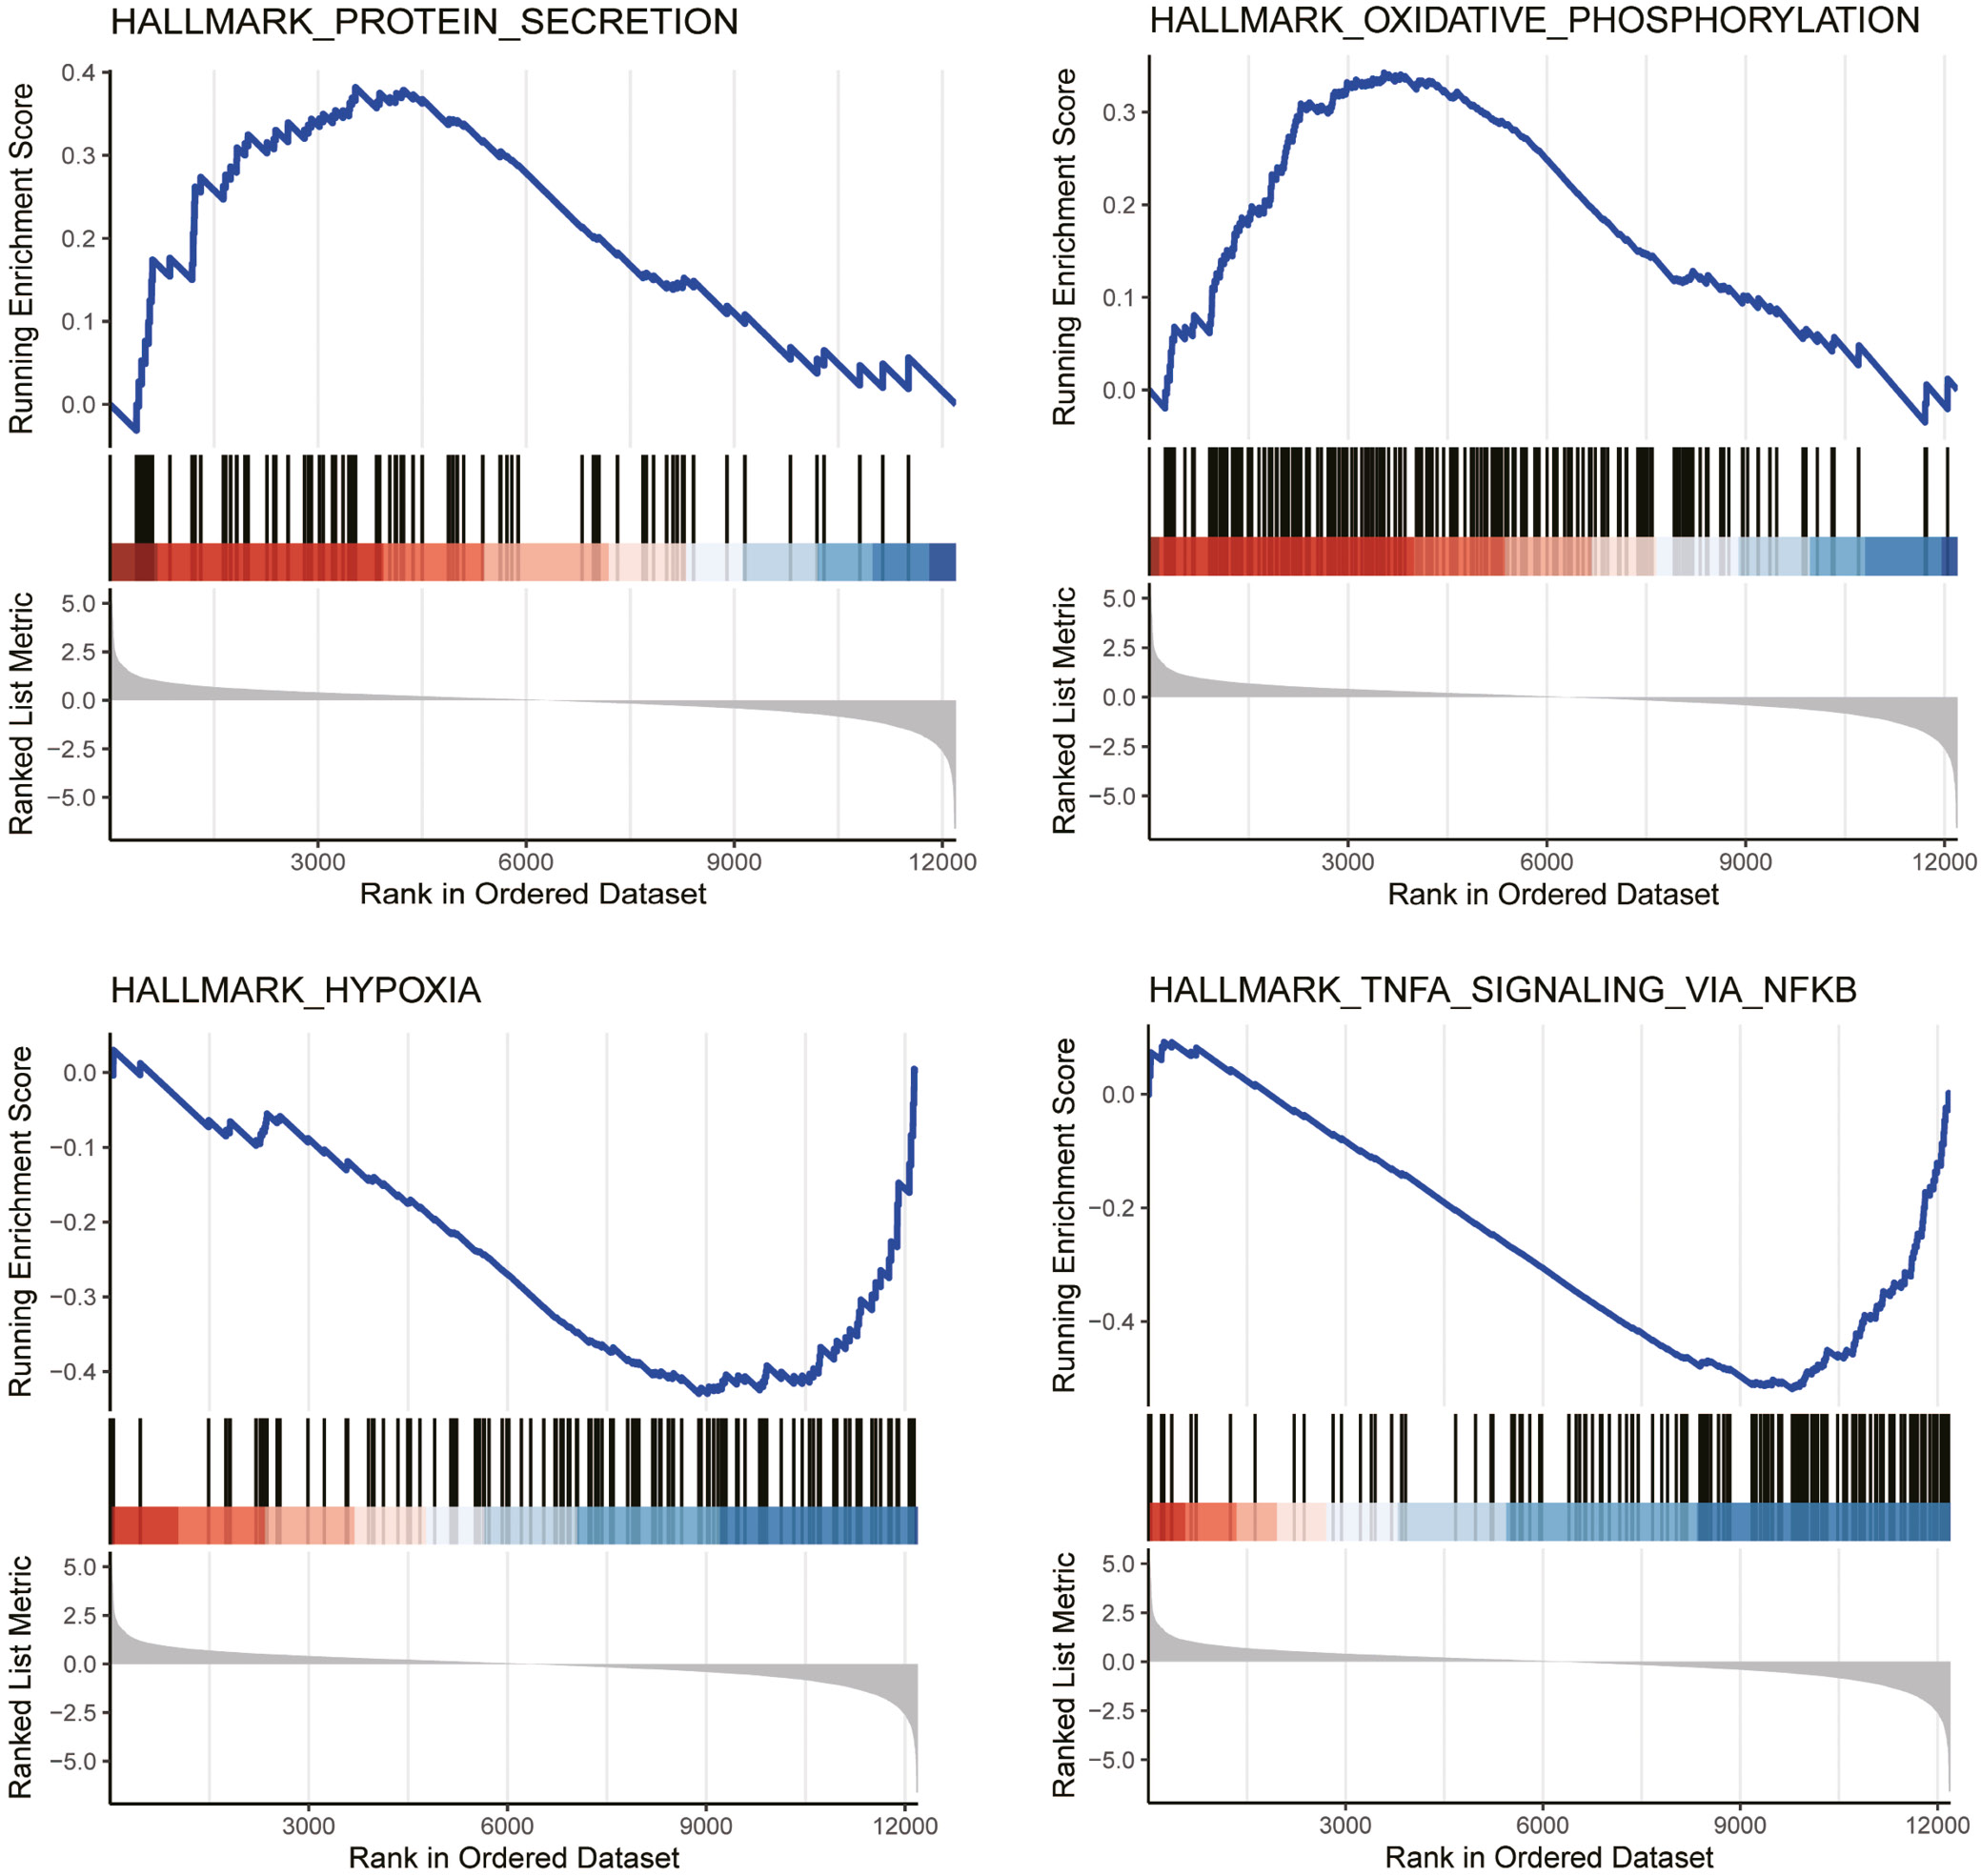
We then performed GSVA on genes that were highly and lowly expressed in CD4+ T cells. The results revealed that highly expressed genes in CD4+ T cells were primarily enriched in HALLMARK_PROTEIN_SECRETION and HALLMARK_OXIDATIVE_PHOSPHORYLATION. Lowly expressed genes in CD4+ T cells were concentrated in HALLMARK_HEDGEHOG_SIGNALING, HALLMARK_MYOGENESIS, and HALLMARK_KRAS_SIGNALING_DN (Supplementary Fig. 2).
Additionally, the expression differences of TFs among CD4+ T and CD8+ T subtypes were analyzed. We found that IKZF2 and IRF2 were highly expressed in CD4+T_FOXP3 cells. ETV3 and FOS were highly expressed in CD8+T_IFNG cells, with ZEB1 also showing higher expression in CD8+T_IFNG (Figure 5C and Supplementary Fig. 3).
Identification and analysis of NK-cell subtypes
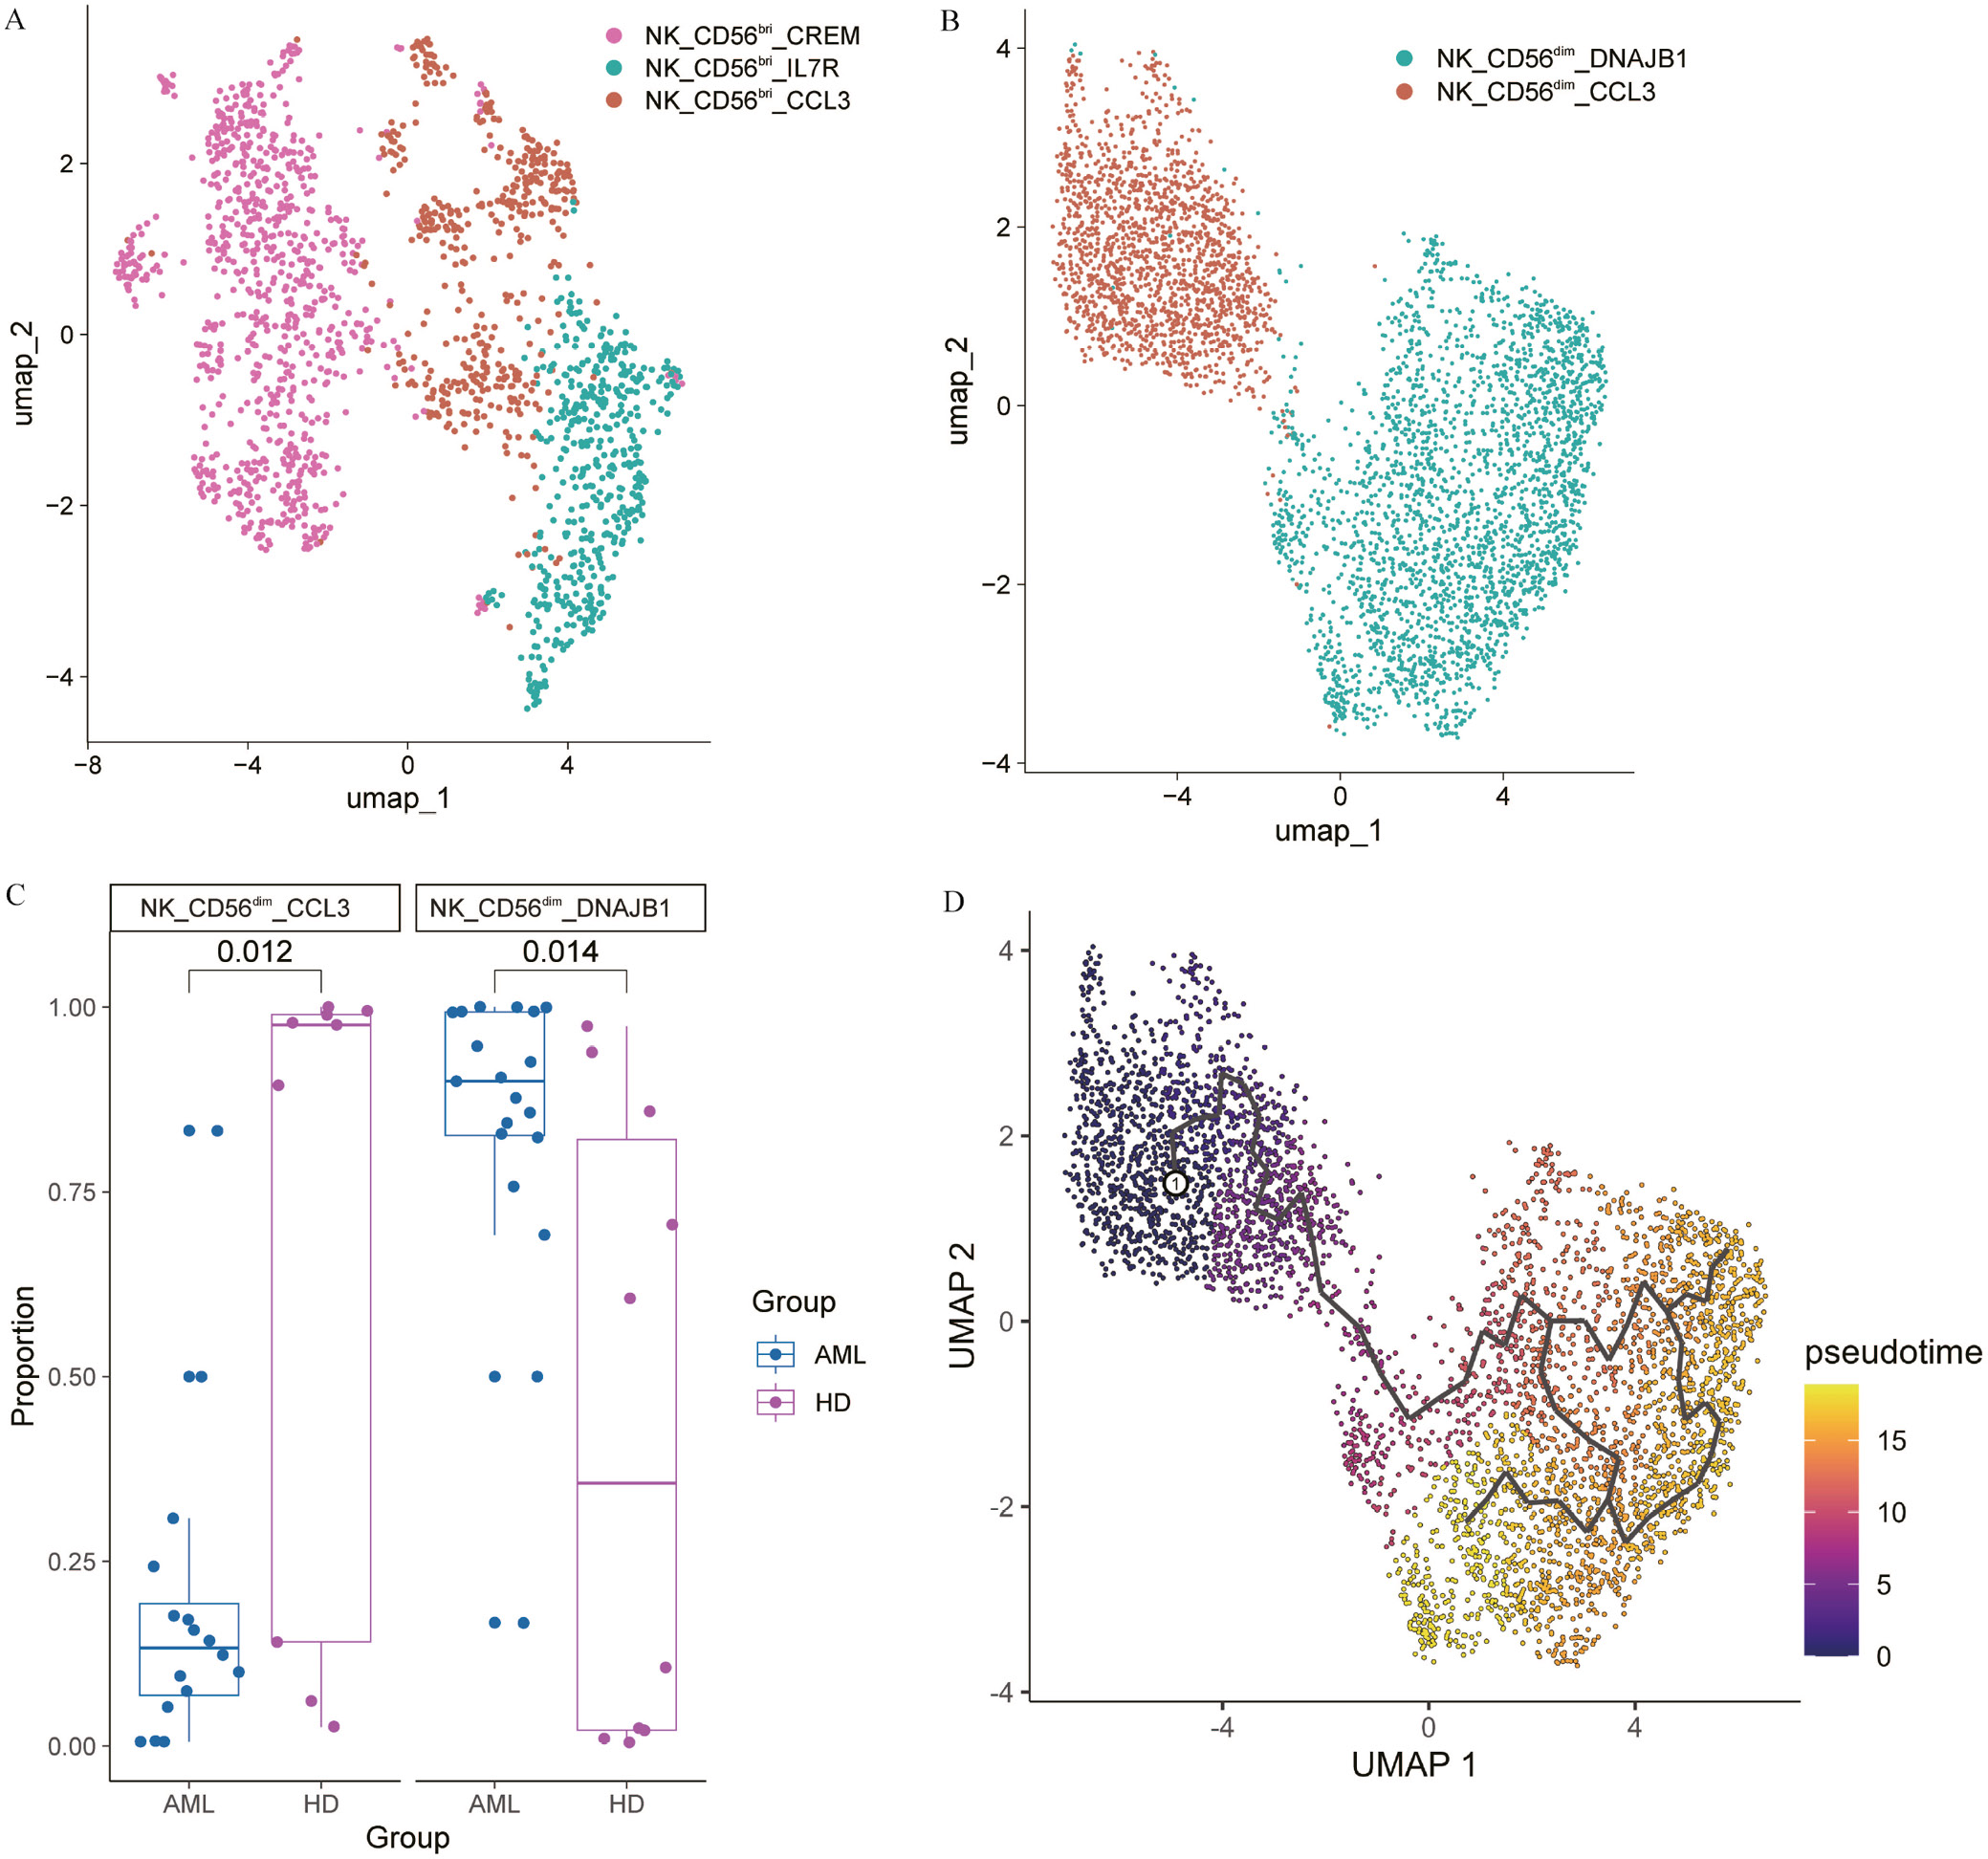
Natural killer cells were further re-clustered. We identified 3 subtypes within NK_CD56bri, including NK_CD56bri_CREM, NK_CD56bri_CCL3, and NK_CD56bri_IL7R (Figure 6A). NK_CD56dim cells were classified into 2 subtypes: NK_CD56dim_CCL3 and NK_CD56dim_DNAJB1 (Figure 6B). We analyzed the proportions of the 2 NK_CD56dim subtypes between AML and HD, and the results indicated that NK_CD56dim_CCL3 was significantly more highly represented in the HD group (p = 0.012), whereas NK_CD56dim_DNAJB1 was significantly more highly represented in AML (p = 0.014) (Figure 6C).
Pseudotime analysis indicated that NK_CD56dim_CCL3 represents an earlier stage, while NK_CD56dim_DNAJB1 corresponds to the terminal stage of the pseudotime trajectory (Figure 6D). GSVA analysis was applied to investigate pathway variation between AML and HD. The GSVA data showed that the KRAS_SIGNALING pathway was enriched in NK cells of the NK_CD56bri_CCL3 subtype. HALLMARK_COAGULATION was enriched in NK_CD56dim_CCL3, and HALLMARK_INTERFERON_ALPHA_RESPONSE was enriched in NK_CD56bri_IL7R (Supplementary Fig. 4A).
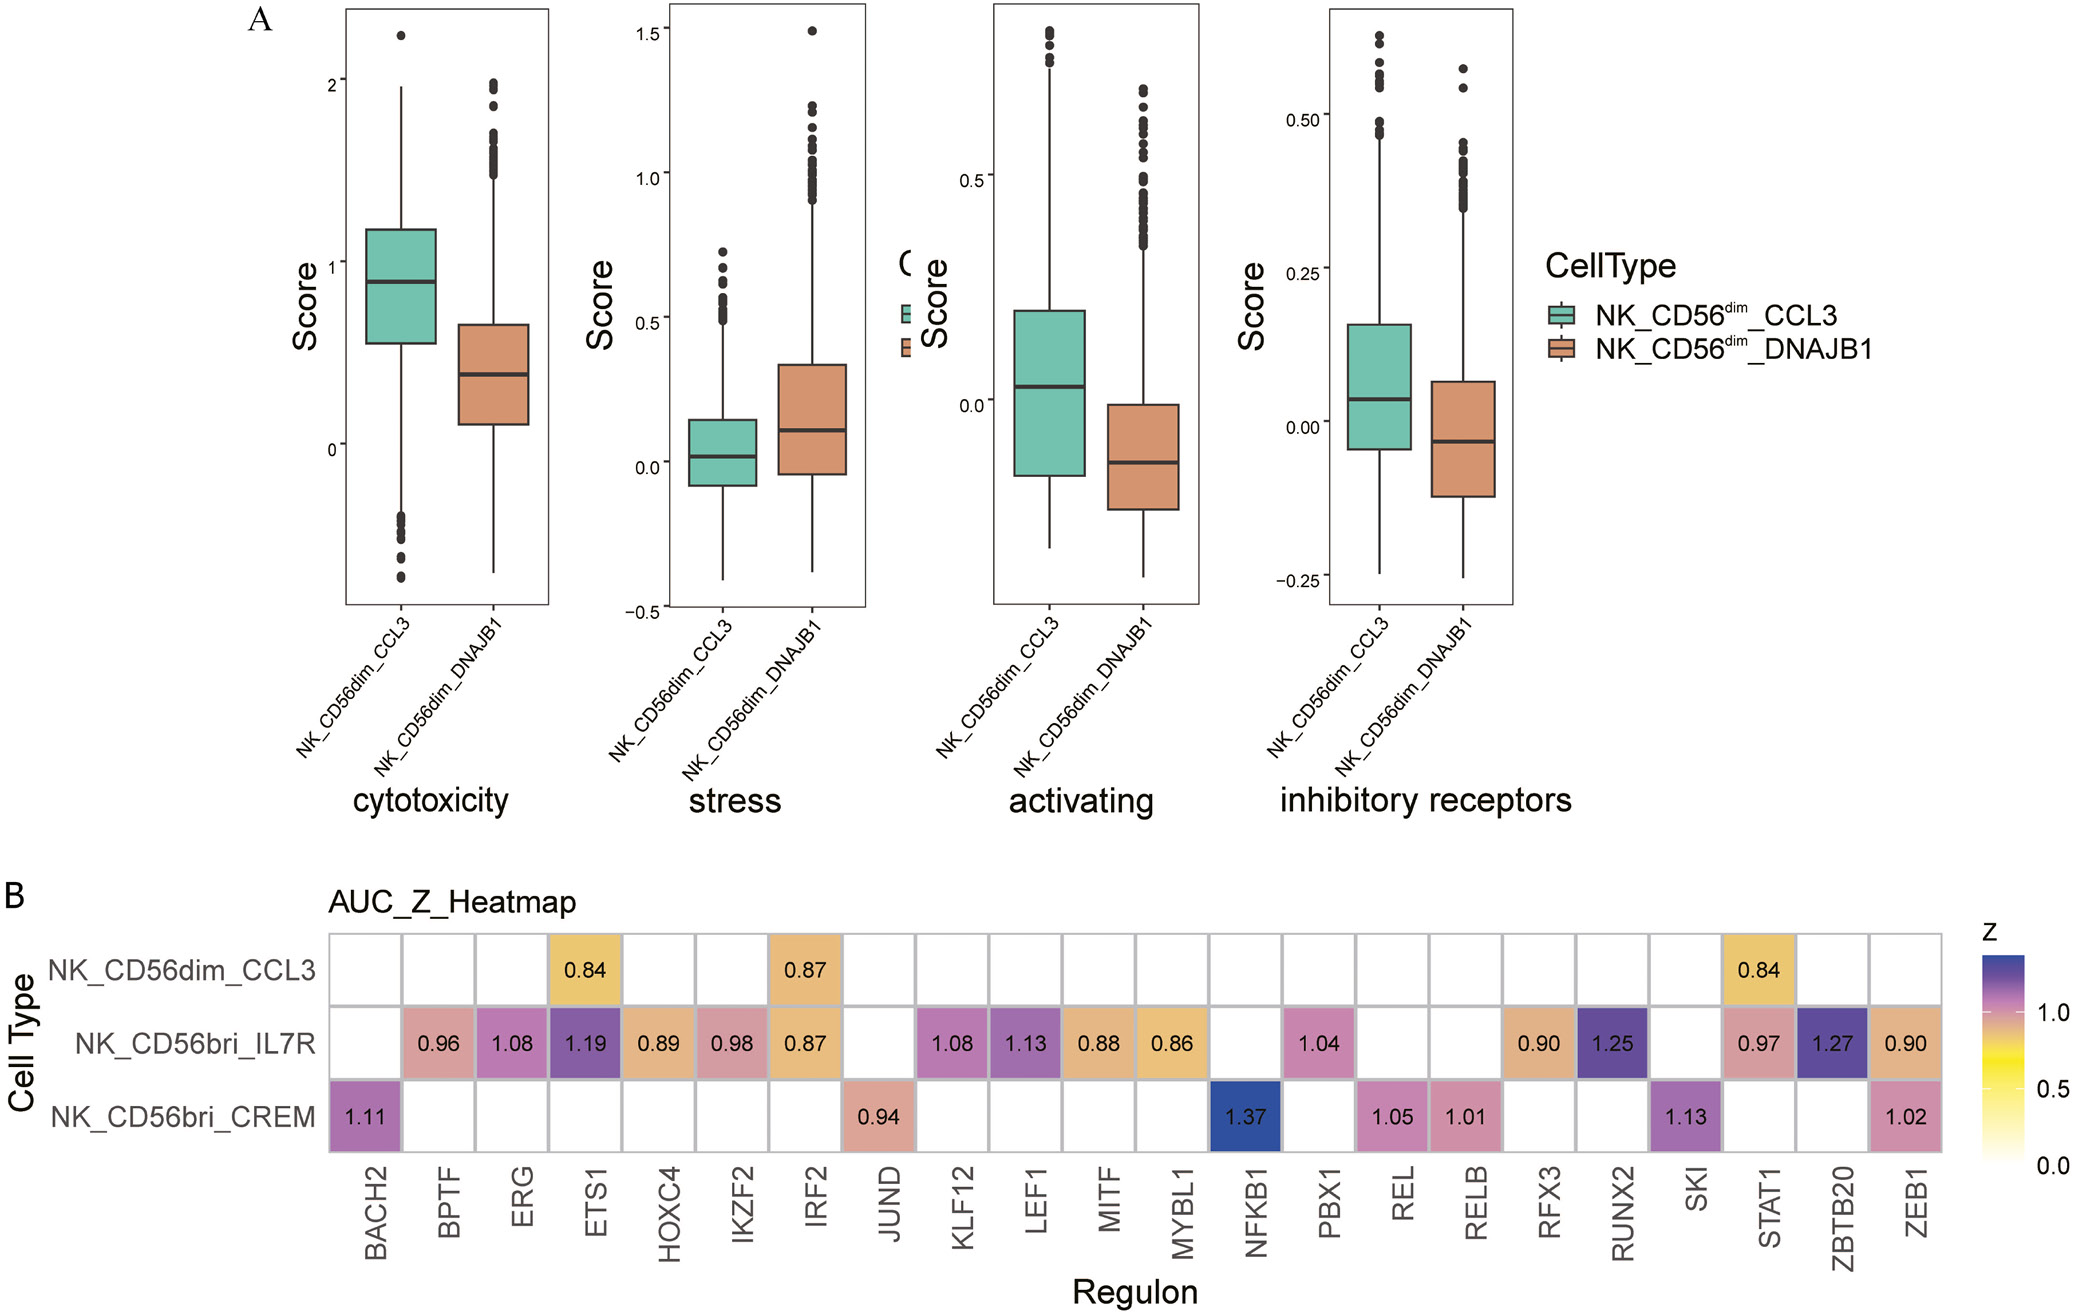
Differential gene enrichment analysis between the AML and HD groups indicated significant enrichment of HALLMARK_PROTEIN_SECRETION and OXIDATIVE_PHOSPHORYLATION in AML, while HYPOXIA and HALLMARK_TNFA_SIGNALING_VIA_NFKB were more active in HD (Figure 7 and Supplementary Fig. 4B). Additionally, compared to NK_CD56dim_DNAJB1 subtype, NK_CD56dim_CCL3 exhibited higher scores for cytotoxicity, activating, and inhibitory receptors, whereas NK_CD56dim_DNAJB1 had a higher stress score (Figure 8A–C and Supplementary Fig. 5A).
We also analyzed differences in TF expression between AML and HD. The results revealed that BCLAF1, NFKB1, and BACH2 were more highly expressed in AML than in HD, while ZSCAN2, DRAP1, IRF2, and IKZF2 were more highly expressed in HD (Supplementary Fig. 5B). The results of TF expression analysis among NK_CD56dim subtypes showed that BCLAF1 and JUND were more highly expressed in NK_CD56dim_DNAJB1, whereas STAT1 and KLF12 were more highly expressed in NK_CD56dim_CCL3 (Figure 8D and Supplementary Fig. 5C).
Analysis of myeloid cell subtypes and intercellular interactions in AML
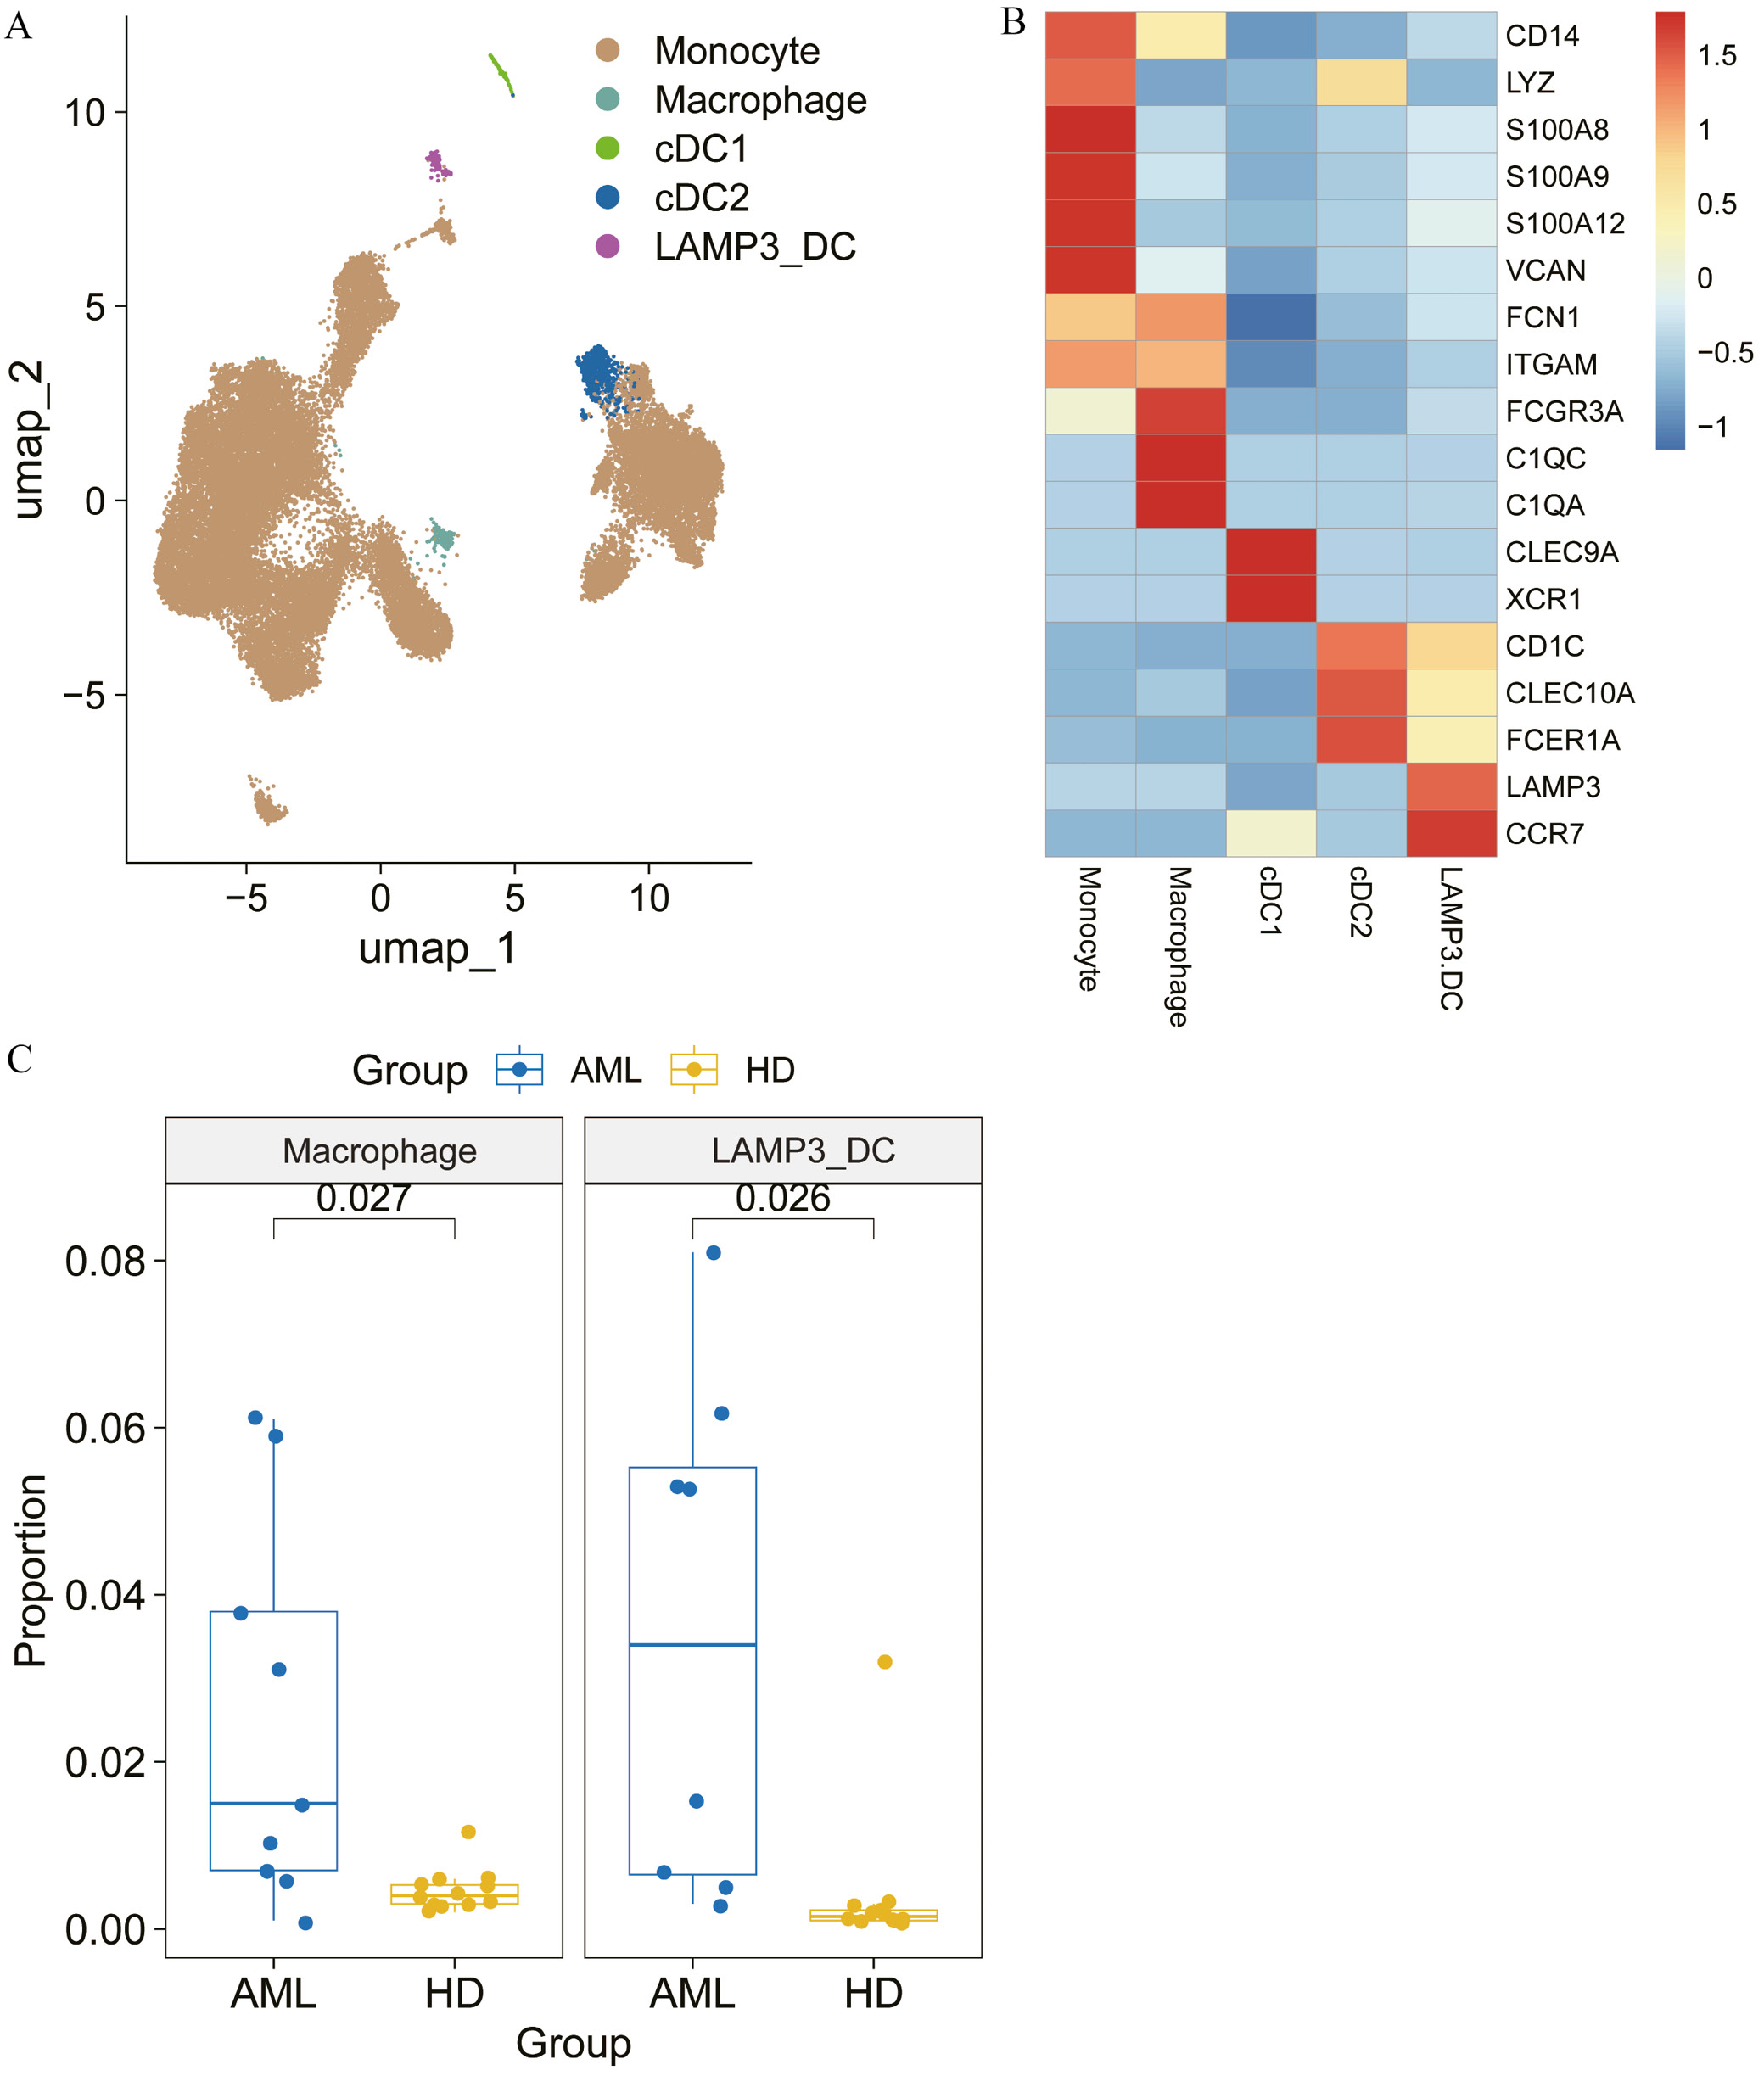
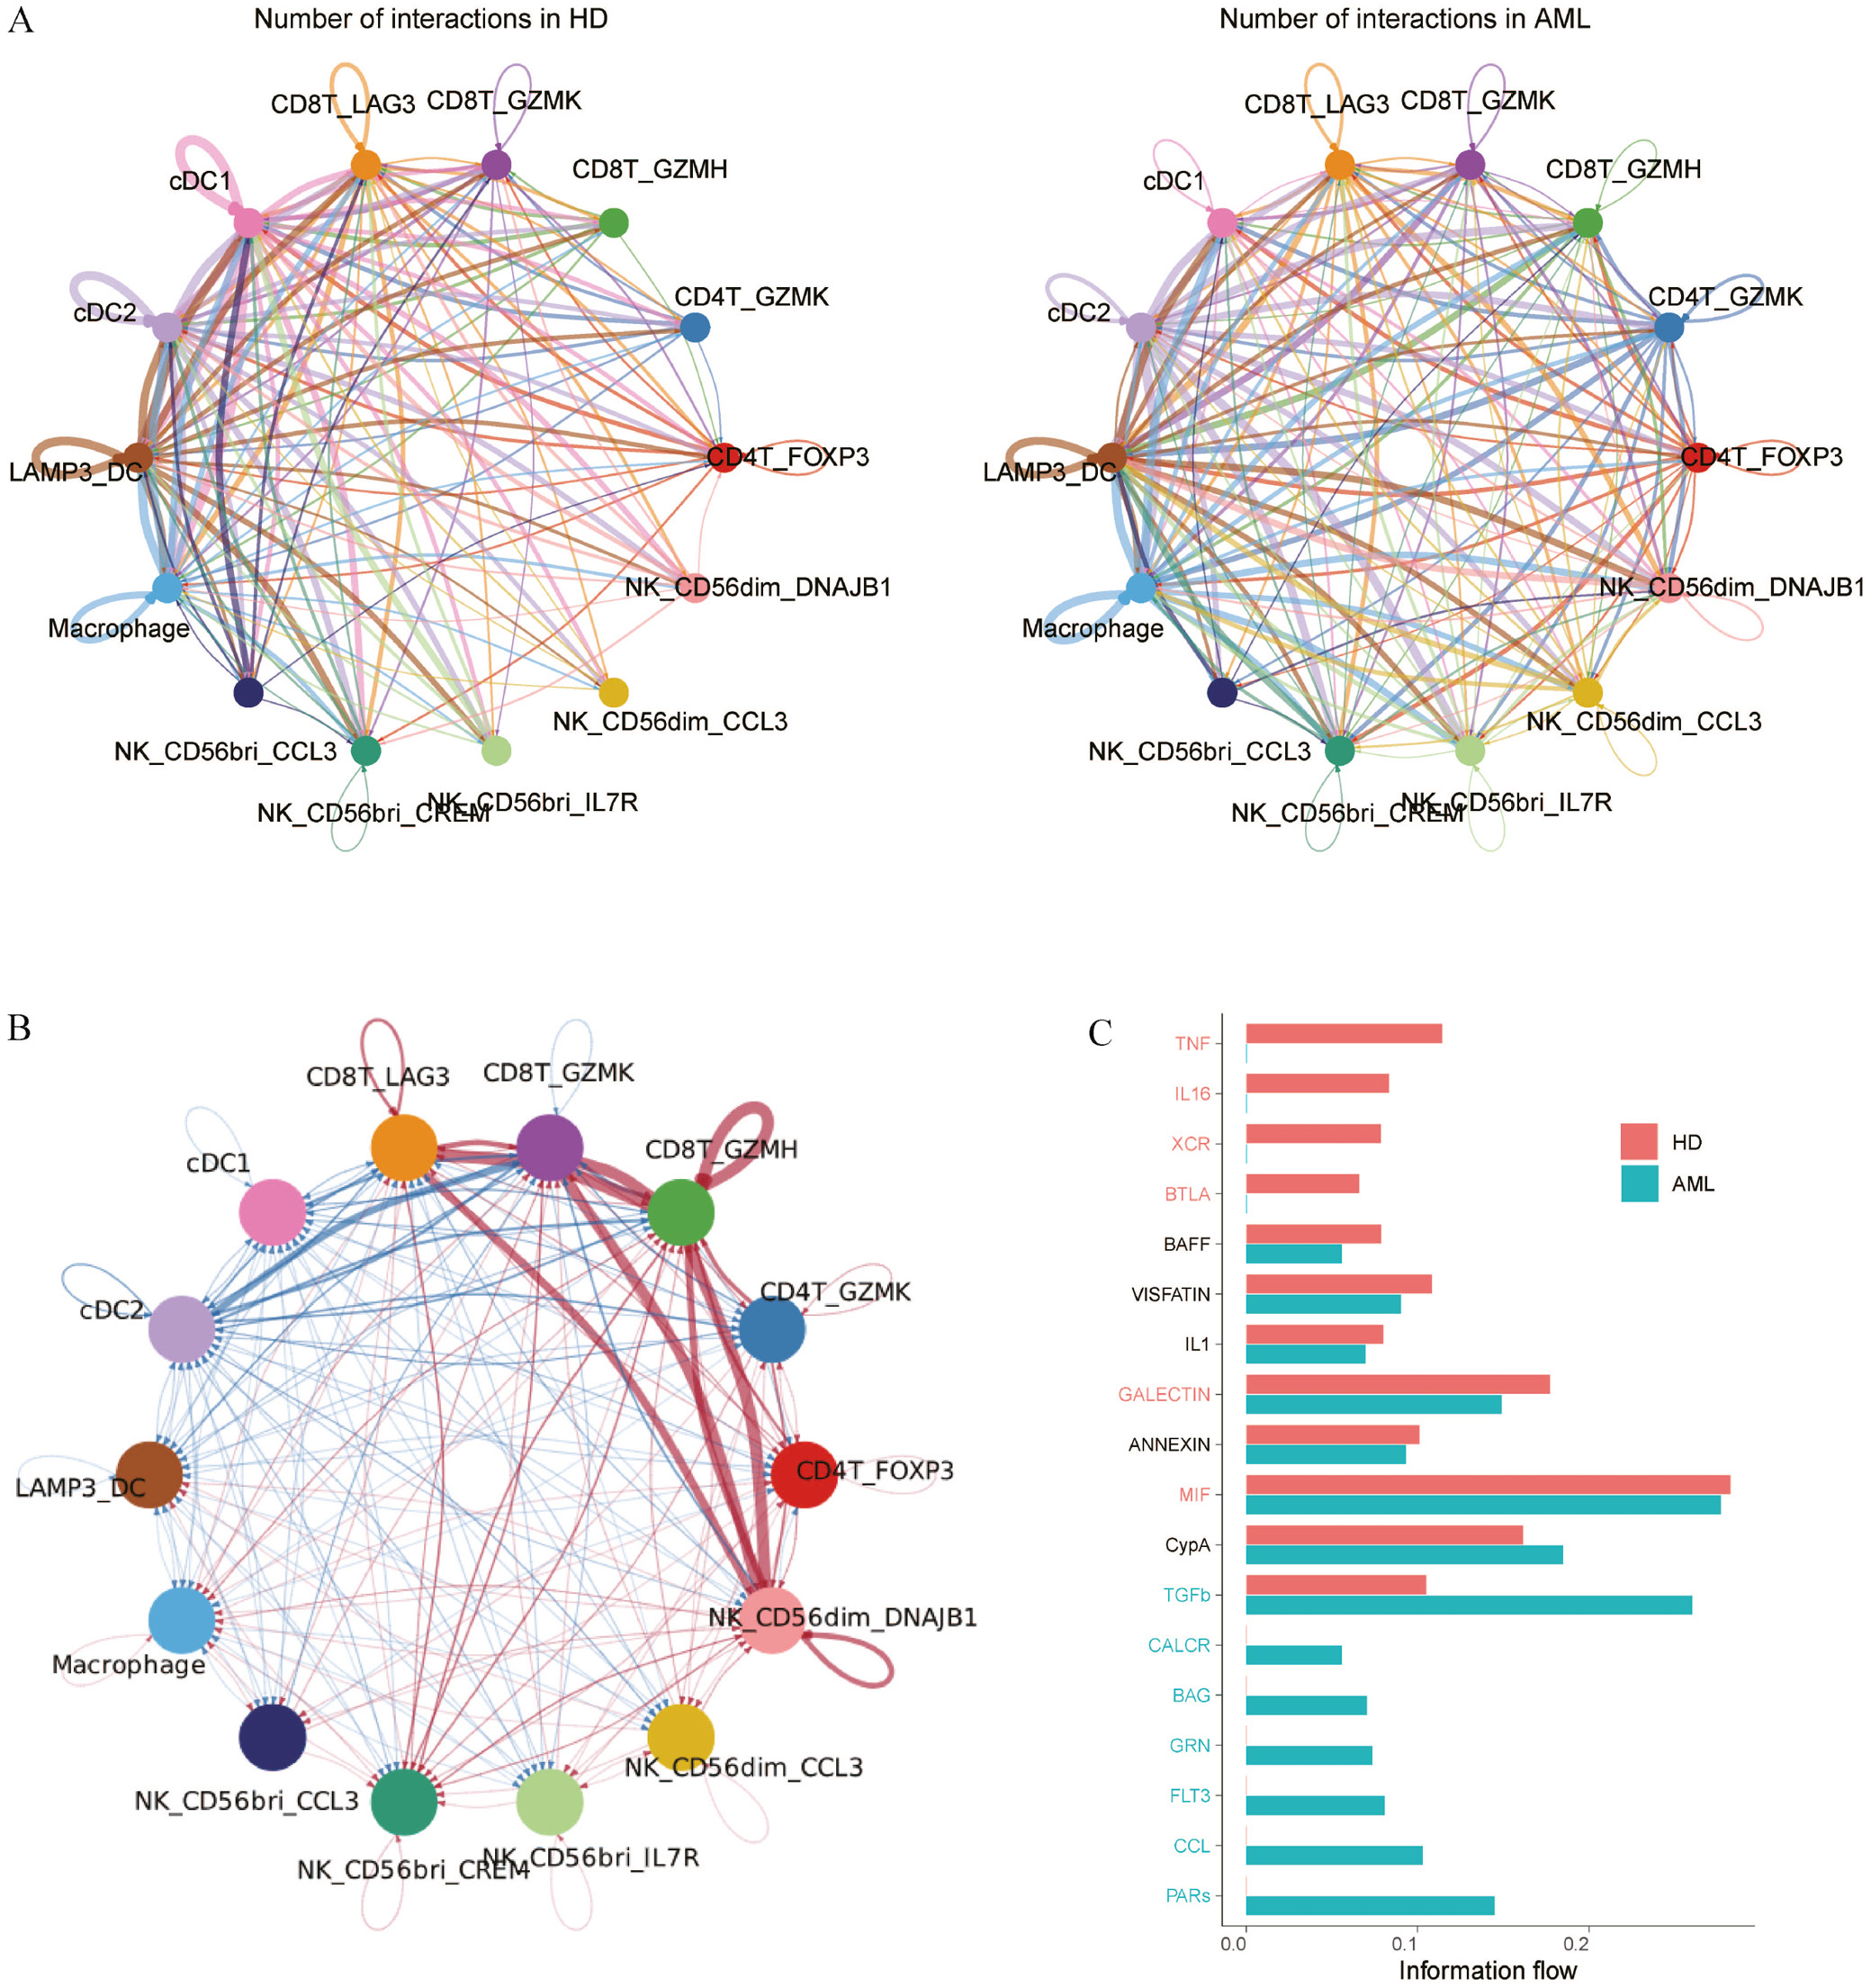
We next performed a re-clustering analysis of myeloid cells, resulting in their classification into 5 cell subtypes (Figure 9A). Monocytes exhibited high levels of VCAN, S100A8, S100A9, and S100A12. Macrophages could be recognized by the expression of genes such as FCGR3A, C1QA, and C1QC. cDC1 cells exhibited significant expression of the hallmark genes XCR1 and CLEC9A. CLEC10A, FCER1A, CCR7, and LAMP3 were all substantially expressed in cDC2 and LAMP3_DC cells (Figure 9B). Among these subtypes, the proportions of LAMP3_DC and Macrophages were significantly higher in AML compared with HD, with no significant differences observed in the other subtypes (Figure 9C). To investigate cell–cell interactions in the TME, we examined interactions among T cells, NK cells, and myeloid cells in AML and HD. In the HD group, NK_CD56bri_CCL3 showed a higher interaction strength with cDC1, whereas in AML there was increased interaction strength between LAMP3_DC and NK_CD56dim_CCL3HI, as well as between LAMP3_DC and NK_CD56dim_DNAJB1 (Figure 10A). Compared with the HD group, AML exhibited a greater number of ligand–receptor communication pairs and stronger intercellular communication intensity between cell clusters (Supplementary Fig. 6A). In addition, cell–cell interaction networks indicated enhanced communication between NK_CD56dim_DNAJB1 and CD8+T_GZMK, NK_CD56dim_DNAJB1 and CD8+T_GZMH, and NK_CD56dim_DNAJB1 and CD8+T_LAG3 (Figure 10B and Supplementary Fig. 6B).
We analyzed the metabolic pathways between the AML and HD groups. We found that TNF, IL6, XCR, and BTLA were significantly upregulated in HD. TGFβ, CALCR, BAG, GRN, FLT3, CCL, and PARs showed significantly higher expression in AML (Figure 10C). We also analyzed the signal strength of receptor–ligand interactions in AML with NK-cell subsets as the source cells (Supplementary Fig. 7). We found that NK_CD56dim_DNAJB1 and CD8+T_GZMH exhibited the highest interaction strength in AML through TGFB1-(TGFBR1+TGFBR2). Consistent with the above findings, the results of cell–cell interactions with NK cells as the target cells indicated that NK_CD56dim_DNAJB1 and CD8+T_GZMH had higher interaction strength in AML through TGFB1-(TGFBR1+TGFBR2) and PPIA-BSG. In addition, these results suggest that NK_CD56dim_DNAJB1 plays an important role in AML.
Discussion
Acute myeloid leukemia is a malignant hematologic disease characterized by the expansion of aberrant myeloid blast cells in the bone marrow, blood, and other tissues, resulting in impaired hematopoiesis.38 It is the most frequent type of acute leukemia in adults, and its pathogenesis is characterized by a wide range of genetic and molecular abnormalities.39 The TME of AML plays an important role in disease progression, therapeutic response, and drug resistance. The TME is a complex network comprising various cell types in AML, including tumor cells, immune cells, stromal cells, and others.3 These cells interact through the secretion of diverse signaling molecules, collectively influencing AML development and treatment outcomes. We present a detailed characterization of the TME in AML, finding significant variations in cellular composition and intercellular interactions between AML and HD. Our findings not only improve our understanding of the complexity of AML but also reveal prospective targets for future therapeutic strategies.
This study discovered that plasma cells and HSC/progenitor cells were considerably more prevalent in AML than in the HD group, implying that these cell subtypes may play an important role in the course of AML. Notably, the marked enrichment of HSC/progenitor cells may be associated with the proliferation of AML cells and the maintenance of their stemness characteristics. Consistent with a previous study,40 this research indicates that AML often originates from clonal abnormalities in HSC/progenitor cells, which acquire specific genetic or epigenetic alterations, leading to uncontrolled proliferation and the suppression of normal hematopoiesis.
Moreover, some researchers have confirmed a dysfunctional state of CD8+ T cells in AML patients. However, some studies have reported no significant differences in T-cell populations between HD and AML patients.41 In this study, CD8+ T cells were identified as a major cell type in AML, but there were no significant differences between the AML and HD groups, indicating mechanisms of exhaustion and dysfunction beyond typical immune checkpoint receptors. As a result, additional research on T-cell subsets is critical for understanding AML.
LAG3, an inhibitory receptor found on activated T cells, NK cells, and DCs, is frequently associated with T-cell exhaustion and impaired immune responses in AML.42 Our findings revealed a considerable increase in the CD8+T_LAG3 cell subtype in AML compared with the HD group, indicating the potential for T-cell exhaustion in AML. Recent single-cell studies have likewise reported that ST2+ Tregs in AML bone marrow highly express LAG3 and TIM3 and display an inverse correlation with CD8+ T-cell abundance. In a Foxp3Cre-ST2 conditional knockout model, blockade of this pathway restored CD8+ T-cell functionality and significantly prolonged survival.43 These results are consistent with the pseudotime trajectory, which shows that CD8+ T cells become exhausted in AML.
CD4+T_FOXP3 cells are an important T-lymphocyte subpopulation involved in negative immune regulation. They are necessary for self-tolerance and immune homeostasis.44 CD4+T_FOXP3 cells can interfere with immune system function, promoting tumor immune evasion and tumor growth.45, 46 Several studies have demonstrated a significant increase in CD4+T_FOXP3 cells in various types of cancer.47, 48 Similar to previous findings,49 we discovered that the proportion of CD4+T_FOXP3 cells was considerably higher in AML patients than in HDs, implying that CD4+T_FOXP3 cells may contribute to AML progression. Consistent with these findings, a recent study monitoring peripheral blood lymphocyte subsets in AML patients found that Treg frequencies are significantly elevated at diagnosis and correlate with poor therapeutic response; multivariate analysis further identified an elevated Treg/Teff ratio as an independent risk factor for AML relapse.50 Transcription factors are important in AML because they contribute to its development and progression. IKZF2, a member of the Ikaros TF family, is considerably overexpressed in AML relative to healthy HSCs.51 In this study, our results confirmed that IKZF2 is significantly overexpressed in CD4+T_FOXP3 cells, which may be related to the development and progression of AML.
Natural killer cells are typically divided into NK_CD56dim and NK_CD56bri subtypes. High expression of CD56 identifies NK cells as NK_CD56bri, whereas NK_CD56dim cells exhibit higher cytotoxicity. In the NK_CD56dim subtypes, we observed that NK_CD56dim_CCL3 is significantly overexpressed in HDs, while NK_CD56dim_DNAJB1 is significantly overexpressed in AML. This difference may indicate varying activation states and functions of NK cells in AML. GSVA revealed distinct biological pathways active in different NK-cell subtypes. The KRAS signaling pathway, which is crucial in AML and related to its occurrence and progression, was found to be active in the NK_CD56bri_CCL3 subtype, while the NK_CD56dim_CCL3 subtype was associated with the coagulation pathway. These findings indicate complex biological processes in which NK cells may participate within AML. KLF12 (Krüppel-like factor 12), a member of the Krüppel-like factor family of TFs, is involved in multiple physiological and pathological processes, including the development of various cancers.52 This study identified significant overexpression of KLF12 in the NK_CD56dim_CCL3 cell subtype, suggesting that KLF12 may play a role in immune regulation and disease progression in AML and other cancers, offering a potential molecular target for the development of novel therapeutic strategies.
Myeloid cells, particularly DCs and monocytes, are critical in immune regulation through cytokine secretion and surface molecule expression.53 In AML, these cells may be influenced by the TME, thereby affecting immune cell activity and contributing to tumor immune escape.54 This study observed a significant increase in LAMP3+ DCs in AML, underscoring the important role of this cell subtype in the disease. The interactions between different immune cell subsets in the AML microenvironment are crucial for disease progression. Previous studies have shown that the interaction strength between LAMP3+ DCs and NK-cell subtypes is high in AML, potentially impacting immune surveillance and tumor escape.55 Consistent with these findings, this study found that the interaction strength between LAMP3+ DCs and both NK_CD56dim_CCL3HI and NK_CD56dim_DNAJB1 was the highest, highlighting the significant role of NK-cell subtypes in AML. Furthermore, compared with HD, the AML tumor immune microenvironment exhibited a greater number of ligand–receptor communication pairs and stronger intercellular communication intensity. This suggests a more complex intercellular communication network in AML, which may facilitate immune escape and suppression by tumor cells.
Limitations of the study
While we observed changes in immune cell composition, particularly in plasma cells and HSC/progenitors, the functional roles of these subtypes require further validation. Although our findings highlight CD8+ T-cell exhaustion and increased CD4+T_FOXP3 cells, some previous studies reported no significant differences in T-cell populations between AML and HD, pointing to potential heterogeneity among cohorts. Additionally, while we identified disease-specific NK-cell subtypes and their distinct signaling pathways, the complexity of NK-cell function in AML remains only partially understood. Lastly, the observed increase in intercellular communication in AML suggests immune evasion mechanisms, but the precise functional implications warrant further investigation. Moreover, inherent limitations of single-cell RNA sequencing, such as batch effects, platform variability, and detection sensitivity, can amplify or obscure true differences among cell subsets. Although Harmony was employed to correct batch effects, disparities in capture efficiency and gene dropout between the 10× Genomics and Seq-Well platforms may still influence the results. Prospective, multicenter cohort studies are warranted to validate our findings and further elucidate their functional and clinical significance.
Conclusions
We conducted an in-depth analysis of the TME in AML and HD by using recently published scRNA-seq data. The findings revealed the heterogeneity of cellular composition and the complexity of intercellular communication within the AML. These findings provide important insights into the processes of immune evasion in AML and lead to the development of new immunotherapeutic techniques, as well as the identification of prospective targets for future targeted treatments.
Supplementary data
The supplementary materials are available at https://doi.org/10.5281/zenodo.17591557. The package contains the following files:
Supplementary Table 1. Gene sets defining functional states of NK cells. This table lists the curated gene sets used to characterize different NK-cell functional states: naïve, exhausted, cytotoxic, inflammatory, effector, and regulatory.
Supplementary Fig. 1. Heatmap of CNA profiles inferred from the scRNA-seq data of malignant cells from AML patients. Red indicates genomic amplifications and blue indicates genomic deletions. The x-axis shows all chromosomes in numerical order. T cells, B cells, and erythroid cells were used as a reference.
Supplementary Fig. 2. A. GSVA pathway analysis of CD4+ T-cell subtypes; B. GSVA pathway analysis of CD4+T_FOXP3.
Supplementary Fig. 3. UMAP showing the expression of TFs in CD4+ T-cell subsets.
Supplementary Fig. 4. A. GSVA pathway analysis of NK_CD56dim subsets. Significant differences were determined using Student’s t-test; B. GSEA analysis of differentially expressed genes between the AML and HD groups.
Supplementary Fig. 5. A. UMAP showing the expression of cytotoxicity-, activating-, and inhibitory-receptor genes in NK_CD56dim subsets; B. Heatmap visualizing the differential expression of TFs across distinct NK_CD56dim subsets; C. UMAP showing the expression of TFs in NK_CD56dim cell subsets.
Supplementary Fig. 6. A. Number and strength of cell–cell interactions between AML and HD; B. Heatmap showing the number of potential ligand–receptor pairs among cell subtypes in AML and HD. A deeper red color indicates stronger cell–cell communication.
Supplementary Fig. 7. Increased cell–cell communication signaling in AML with subsets as sources (A) and targets (B).
Data Availability Statement
All data generated or analyzed during this study are included in this published article. The expression profiles and clinical information of the patients analyzed in this study were downloaded from public databases (https://www.ncbi.nlm.nih.gov/geo).
Consent for publication
Not applicable.
Use of AI and AI-assisted technologies
Not applicable.