Abstract
Background. Transcriptional repressor 1 of the Snail family (SNAI1) and miR-145 play crucial roles in the development of colon cancer. Tumor invasiveness and epithelial–mesenchymal transition (EMT) are associated with SNAI1, whereas miR-145 is considered a tumor suppressor. Although cAMP/PKA signaling is critical for regulating cell survival and invasiveness, the precise mechanisms through which SNAI1 and miR-145 influence tumor cell behavior via this pathway remain unclear.
Objectives. To examine the mechanisms by which SNAI1 and miR-145 regulate colon cancer cell invasion and survival through the cAMP/PKA signaling pathway and to assess their functional relationship.
Materials and methods. SNAI1 and miR-145 were overexpressed in the colon cancer cell lines DLD1 and HCT116, respectively, and cAMP and PKA activity was assessed using quantitative real-time PCR (qPCR) and western blot analysis. In addition, a luciferase reporter assay and application of the PKA inhibitor H89 were used to further investigate the roles of SNAI1 and miR-145 in regulating cell invasion and survival.
Results. Overexpression of SNAI1 significantly increased cAMP and PKA activity and promoted cell survival and invasion. However, overexpression of miR-145 decreased cell invasion and survival by blocking the cAMP/PKA signaling pathway. When both were overexpressed, miR-145 further decreased cAMP/PKA activity and inhibited the tumor-promoting effects of SNAI1. Use of the PKA inhibitor H89 also reduced the tumor-promoting effect of SNAI1.
Conclusions. By activating the cAMP/PKA signaling pathway, SNAI1 promotes colon cancer cell survival and invasion, whereas miR-145 suppresses tumor progression by inhibiting this pathway. These findings suggest that SNAI1 and miR-145 may represent viable therapeutic targets for colon cancer treatment and that targeting the cAMP/PKA pathway may provide a novel therapeutic strategy.
Key words: colorectal neoplasms, microRNA-145, Snail family transcription factors, cyclic AMP-dependent protein kinases, signal transduction
Background
With the acceleration of globalization, population aging and urbanization, global public, health challenges have become more complex. Among these challenges, the high incidence and mortality rates of malignant tumors are particularly concerning. Colorectal cancer (CRC) is a typical representative among them. It ranks 3rd in terms of new cases and 2nd in terms of mortality among all malignant tumors, with around 1.88 million new cases and 920,000 deaths, according to the 2020 global cancer statistics.1 Although advancements in screening and treatment technologies have led to a decline in CRC incidence and mortality in several high-income countries, the rates continue to rise in many developing nations, particularly in China.1
About 60% of patients receive an advanced diagnosis of CRC because of the disease’s complicated molecular features and the absence of clear early signs.2 Colorectal cancer is characterized by significant molecular heterogeneity, which contributes to its varied clinical presentation and delayed diagnosis. This complexity is driven by a high frequency of genetic mutations, such as alterations in APC, KRAS, TP53, and PIK3CA, that promote tumor initiation and progression. In addition to genetic changes, epigenetic modifications – such as DNA methylation abnormalities and histone modifications – further disrupt the regulation of gene expression. Moreover, multiple signaling pathways, including Wnt/β-catenin, MAPK, PI3K/AKT, and tumor growth factor beta (TGF-β), are frequently dysregulated, enhancing tumor cell proliferation, invasion, and metastasis. The interplay of these molecular alterations results in substantial tumor heterogeneity, complicating early detection and the development of standardized treatment strategies. Together with the absence of apparent early symptoms, these molecular features contribute to the high proportion of CRC patients diagnosed at advanced stages.
Currently, the primary treatment options for CRC treatments remain conventional approaches such as radiotherapy, chemotherapy, and surgical resection. However, the effect of these treatments is restricted by many factors, especially the existence of cancer stem cells (CSCs), which seriously affects the therapeutic effect. These cells are a small fraction of cells within a tumor with high self-renewal ability, which can re-establish the tumor after treatment, and may acquire stronger malignant properties after radiotherapy and chemotherapy, leading to cancer recurrence and metastasis.2, 3
In addition, the epithelial–mesenchymal transition (EMT) is a significant contributing factor to the development of CRC. The process of EMT gives tumor cells the capacity to invade and migrate, which significantly increases the likelihood that the tumor will spread.4 In this process, transcription repressor 1 of Snail family (SNAI1, or Snail) is an important regulatory factor.5 It enhances tumor cells’ capacity to migrate, which in turn facilitates their invasion, by suppressing the expression of adhesion molecules on the surface of epithelial cells.5
MicroRNAs (miRNAs) are a class of small noncoding RNAs that play a key role in regulating the expression of genes associated with malignancies at the molecular level.6 Among these, miR-145 has been shown to suppress tumor growth in a variety of cancers.7 By downregulating the expression of genes associated with tumor proliferation and metastasis, such as IGF1R, fascin-1, and paxillin, miR-145 can inhibit CRC growth and metastasis.7, 8 Furthermore, miR-145 regulates the p53 tumor suppressor gene network, which may significantly increase tumor responsiveness to treatment and improve therapeutic outcomes.9
Although previous studies have provided some understanding of the roles of CSCs, EMT, and miR-145 in CRC, the mechanisms through which these molecules and cellular processes interact, and how they jointly drive tumor progression and treatment resistance, remain incompletely understood.
Objectives
The aim of this study was to explore the regulatory roles of SNAI1 and miR-145 in CRC cell survival and invasion, as well as their potential significance for therapeutic strategies, in order to identify new targets and strategies for CRC treatment.
Materials and methods
Mining of data
To explore the expression levels of EMT transcription factors in human rectal cancer, the colorectal adenocarcinoma dataset from The Cancer Genome Atlas (TCGA) was analyzed using cBioPortal for Cancer Genomics (https://www.cbioportal.org) to determine the frequency of SNAI1, SNAI2, ZEB1, and ZEB2 gene alterations. Simultaneously, the public dataset available in Research Edition Oncomine 4.4 (Compendia Bioscience, Ann Arbor, USA; https://www.oncomine.org) was used to extract the expression values of SNAI1, SNAI2, ZEB1, and ZEB2 specifically in rectal cancer. The following filtering criteria were applied to identify the relevant datasets: genes: ZEB1, ZEB2, SNAI1, and SNAI2; analysis type: cancer vs normal; cancer type: rectal cancer. The datasets selected for analysis and visualization were the largest complete datasets available and were ranked according to overexpression p-values.
Cell lines
Human CRC cell lines (e.g., HCT116 and DLD1) were obtained from the American Type Culture Collection (ATCC; Manassas, USA). Cells were cultured in Dulbecco’s modified Eagle’s medium (DMEM; Gibco, Waltham, USA) supplemented with 10% fetal bovine serum (FBS; Gibco) and 1% penicillin–streptomycin (Gibco). Cultures were maintained at 37°C in a humidified atmosphere containing 5% CO2. All procedures were performed in accordance with ATCC guidelines.
Overexpression of SNAI1
As directed by the manufacturer, stable cell lines overexpressing SNAI1 were generated using Lipofectamine 3000 (Invitrogen, Carlsbad, USA). Empty vectors (pCMV-3Tag-1) and pCMV-SNAI1 were transfected into HCT116 and DLD1 cells to generate the stable cell lines HCT116-SNAI1 and DLD1-SNAI1, respectively. Transfected cells were selected using medium containing G418 at a final concentration of 400 mg/mL (Invitrogen). SNAI1 expression was verified with western blot analysis.
Overexpression of miR-145
HCT116 and DLD1 cell lines were separately seeded in 6-well plates and cultured to 70–80% confluence. Colorectal cancer cells were transfected using Lipofectamine 3000 (Invitrogen) transfection reagent in accordance with the manufacturer’s instructions, using either miR-145 mimics (synthetic miR-145 RNA molecules) or negative-control mimics (NC mimics). Following transfection, the cells were cultured in fresh medium for an additional 48 h to assess miR-145 expression levels and their impact on the biological properties of the cells. To confirm successful transfection and efficient overexpression of miR-145 mimics, quantitative real-time polymerase chain reaction (qPCR) was used to evaluate miR-145 expression levels in the transfected cells.
Transwell assay
Cell migration was assessed using 24-well Transwell (Boyden) chambers with 8-μm pore-size inserts (Corning Company, Corning, USA), and the assays were performed according to the manufacturer’s protocol. Cells adhering to the underside of each insert membrane were stained with crystal violet and subsequently counted using a low-power Leica microscope (M50 stereomicroscope; Leica Camera AG, Wetzlar, Germany).
Colony formation
After seeding into 6-well plates, DLD1-SNAI1 and HCT116-SNAI1 cells were compared with empty-vector control cells. The plates received 0, 2, 4, and 6 Gy X-ray radiation, respectively, delivered using a Precision X-ray irradiator (Model X-RAD 320; Precision X-Ray, Inc., North Branford, USA). In a 2nd experiment, DLD1-SNAI1 and HCT116-SNAI1 cells were transfected with 2.5 µg of pEZX vector (Genecopoeia, Rockville, USA) containing either a scrambled control (SCR) sequence or a miR-145 expression construct. Lipofectamine 3000 (Invitrogen) was used for transfection.
After irradiation, the cells were replated in triplicate in 6-well plates at densities of 400, 800, 1000, and 1200 cells per well to determine survival scores. Following incubation for 10 days, the cells underwent 3 washes with phosphate-buffered saline (PBS), fixation in 70% ethanol, and staining with 0.5% crystal violet. After staining, the number of colonies in each well was counted under a light microscope (M50; Leica Microsystems) and recorded for subsequent analysis.
Luciferase promoter detection
Yin-Yuan Mo, PhD, from the University of Mississippi (Oxford, USA) kindly donated a luciferase reporter plasmid containing a putative 1.4 kb miR-145 promoter cloned into the pGL3 basic vector (Promega, Madison, USA). Luciferase activity was assessed in stable empty-vector-transfected cells, DLD1-SNAI1 cells, and HCT116-SNAI1 cells. The miR-145 promoter construct and the Renilla luciferase plasmid were co-transfected into cells cultured in 12-well plates. Briefly, 48 h after transfection, the cells were lysed for the luciferase assay. The luciferase assay was performed using a dual-luciferase assay kit (Promega) in accordance with the manufacturer’s instructions.
cAMP assay
HCT116 and DLD1 cells were cultured to logarithmic growth phase. The cells were transfected with either miR-145 mimics or NC mimics. To evaluate changes in cAMP levels, miR-145-overexpressing cells were treated with cAMP activators (e.g., forskolin) or cAMP inhibitors (e.g., IBMX). Intracellular cAMP levels were measured using a cAMP enzyme-linked immunosorbent assay (ELISA) kit in accordance with the manufacturer’s instructions. The ELISA method was used to quantify cAMP levels based on a colorimetric reaction, and the data were converted to specific concentrations using a standard curve.
Determination of PKA activity
HCT116 and DLD1 cells were transfected with either miR-145 mimics or NC, as described for the cAMP assay. Following a 24-h treatment period, the cells were stimulated with agents such as IBMX or forskolin to induce an increase in cAMP levels. Intracellular PKA activity was measured using a PKA (Protein Kinase A) Colorimetric Activity Kit (cat. No. EIAPKA; Thermo Fisher Scientific, Waltham, USA). The absorbance was measured using a 96-well microplate reader at 450 nm, with 650 nm as the reference wavelength. PKA activity based on the kit standard curve. To further confirm activation of the PKA signaling pathway, CREB phosphorylation levels and other downstream PKA markers were analyzed using western blot analysis.
Quantitative PCR and RNA extraction
Total RNA was extracted from cultured cells using the RNeasy Plus Mini Kit (Qiagen, Valencia, USA). Total RNA (0.8 μg) was reverse transcribed using iScript (Bio-Rad, Hercules, USA) in a 20-μL reaction volume. Quantitative real-time PCR was performed using the Roche LightCycler 480 system and the Universal Probe Library (UPL) monochrome probe system (Roche Diagnostics, Basel, Switzerland), with 5 μL of 1:16 diluted cDNA from each cell-line sample. After 10 min of pre-incubation at 95°C, each gene underwent 55 cycles consisting of 15 s of denaturation at 95°C and 30 s of amplification/extension at 60°C. After completion of the cycling protocol, samples were cooled at 40°C for 30 s. Each cDNA sample was analyzed in triplicate. GAPDH was used as the reference gene for data normalization, and multiple samples were analyzed for validation. Primer sequences are shown in Table 1.
Enzyme-linked immunosorbent assay
GRIK5-overexpressing CT26/HCT116 cells or vector control cells (1 × 10⁶) were collected and lysed using cell lysis buffer. The cAMP Detection Kit (Abcam, Cambridge, UK) was then used to measure cAMP levels in the supernatant in accordance with the manufacturer’s protocol. Each experiment was performed in at least 3 independent runs.
Western blot analysis
A protease inhibitor cocktail (Sigma-Aldrich, St. Louis, USA) was added to the radioimmunoprecipitation assay (RIPA) lysis buffer in which the cells were suspended (Thermo Fisher Scientific). Protein concentration was determined using the bicinchoninic acid (BCA) protein quantification kit (Thermo Fisher Scientific). Total protein (50 μg) was separated using sodium dodecyl sulfate–polyacrylamide gel electrophoresis (SDS-PAGE) on a 10% polyacrylamide gel and transferred onto a nitrocellulose membrane (GE Healthcare, Marburg, USA). Primary antibodies against E-cadherin (BD Biosciences, San Diego, USA), SNAI1, SNAI2, c-Myc, Nanog, Vimentin, KLF4, Sox2, Oct4, and actin (Cell Signaling Technology (CST), San Diego, USA), as well as horseradish peroxidase (HRP)-conjugated secondary antibodies (Jackson ImmunoResearch Laboratories, West Grove, USA), were used for membrane detection. Immunoblots were visualized using enhanced chemiluminescence (GE Healthcare) and the LI-COR Odyssey imaging system (LI-COR BioSciences, Lincoln, USA).
Statistical analyses
GraphPad Prism v. 8.0.2 (GraphPad Software, San Diego, USA) and IBM SPSS v. 25 (IBM Corp., Armonk, USA) were used for statistical analysis of the data in each group. When the sample size was 10–50, the Shapiro–Wilk test was used to assess normality of the correlation data. When the sample size was >50, the Kolmogorov–Smirnov test was used to assess normality of the correlation data, and the relevant results are detailed in Supplementary Table 1. For data conforming to a normal distribution, means and standard deviations (SDs) are presented in the tables. When the results conformed to a normal distribution, homogeneity of variance was further assessed using the Brown–Forsythe test, and the specific results are listed in Supplementary Table 2. Next, when the sample size was greater than 10 and the results were consistent with normal distribution and homogeneity of variance, one-way analysis of variance (ANOVA) was used to detect overall differences among multiple groups, followed by Tukey’s post hoc test to determine which groups differed significantly. When the sample size was less than 10, the Mann–Whitney U test was used for nonparametric comparisons between 2 groups. Nonparametric comparisons among multiple groups were performed using the Kruskal–Wallis test followed by Dunn’s post hoc test with Bonferroni correction. The number of corrections corresponded to the total number of pairwise group comparisons, and the specific results are listed in Supplementary Table 3. Statistical significance was defined as p < 0.05.
Results
Expression and genetic variation of SNAI1 and SNAI2 in patients with colon cancer
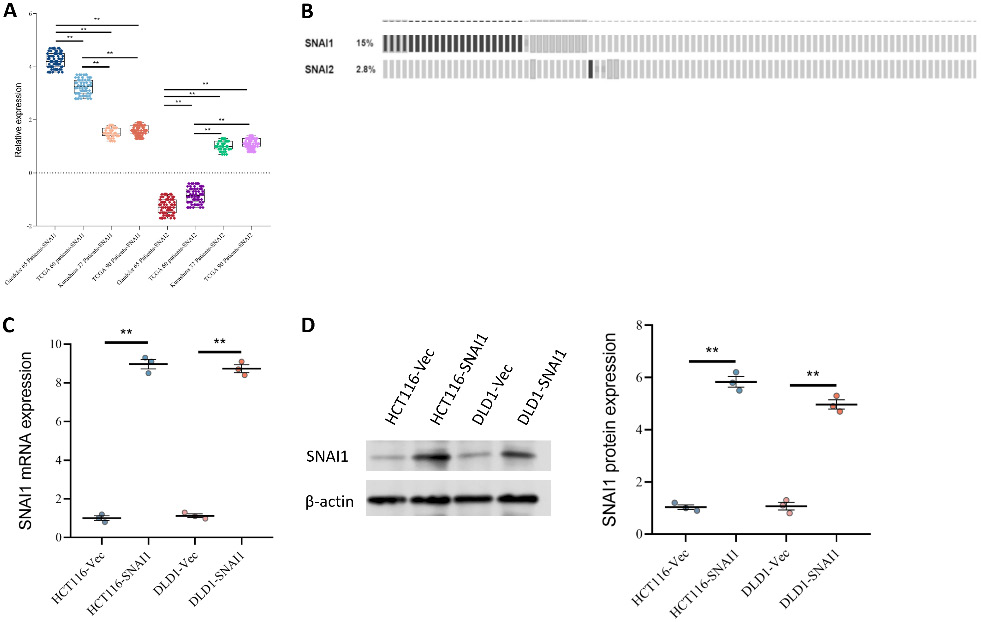
Four colon cancer datasets were analyzed to compare the expression levels of SNAI1 and SNAI2. In the Gaedcke cohort (65 patients), SNAI1 expression was significantly increased and was the highest among the 4 datasets, whereas SNAI2 expression was significantly decreased, suggesting that SNAI1 upregulation and SNAI2 suppression may be associated with aggressive tumor behavior. In the TCGA cohort (60 patients), the results showed decreased SNAI1 expression and significant inhibition of SNAI2, indicating a potential shift in transcriptional regulation during tumor progression. In the Kurashina cohort (37 patients), SNAI1 expression was the lowest, whereas SNAI2 expression was higher. In the TCGA 2 cohort (90 patients), the expression patterns of SNAI1 and SNAI2 were similar to those observed in the Kurashina cohort (Figure 1A). These findings imply that SNAI1 and SNAI2 expression varies significantly among cohorts.
Further analysis of genetic alterations in SNAI1 and SNAI2 in the TCGA dataset showed that the SNAI1 gene amplification rate was significantly higher than that of SNAI2 (Figure 1B), further supporting the dominant role of SNAI1 in CRC progression. Overexpression of SNAI1 in HCT116 and DLD1 cell lines was verified using qPCR analysis. In HCT116-SNAI1 and DLD1-SNAI1 cells, SNAI1 mRNA levels were significantly increased, indicating successful overexpression (Figure 1C). Western blot analysis further confirmed high SNAI1 overexpression at the protein level, with significantly increased SNAI1 protein levels in HCT116-SNAI1 and DLD1-SNAI1 cells (Figure 1D), providing a robust experimental basis for subsequent functional studies.
SNAI1’s function in colon cancer cell migration, survival, proliferation, and phenotypic transformation
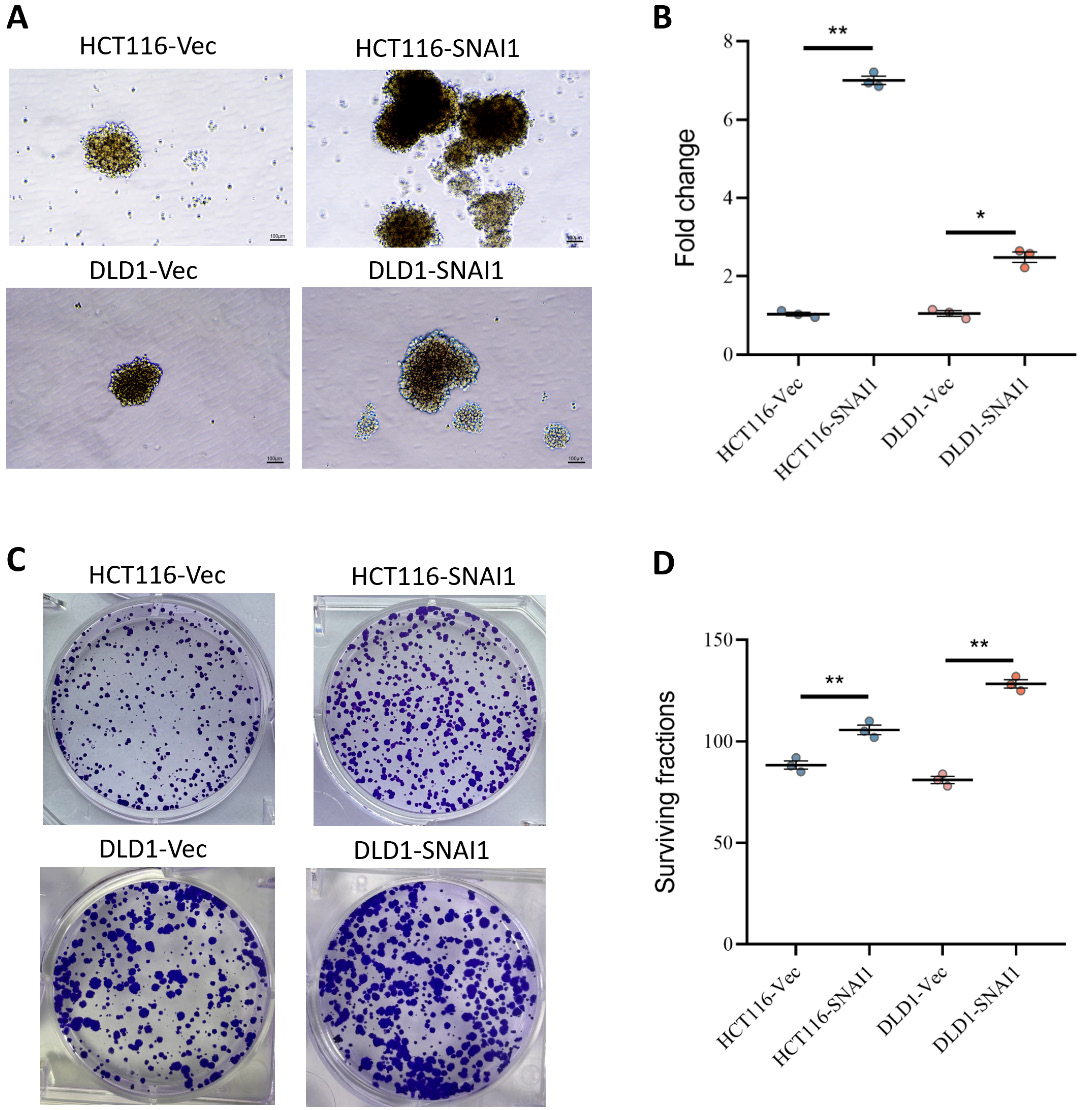
We compared the proliferative capacity of control (Vec) cells and SNAI1-overexpressing colon cancer cell lines HCT116 and DLD1. The findings demonstrated that SNAI1 played a more important role in stimulating proliferation in HCT116 cells than in DLD1-SNAI1 cells, with HCT116-SNAI1 cells exhibiting an approx. 7-fold increase in proliferative capacity, whereas DLD1-SNAI1 cells showed a more moderate increase of approx. 2-fold (Figure 2A,B), suggesting a cell-line-dependent effect of SNAI1 on proliferation. The effect of SNAI1 on cell survival under stress conditions was further assessed. The survival rates of HCT116-SNAI1 and DLD1-SNAI1 cells were significantly increased (Figure 2C,D), indicating that SNAI1 significantly enhanced the tolerance of both cell lines to adverse conditions.
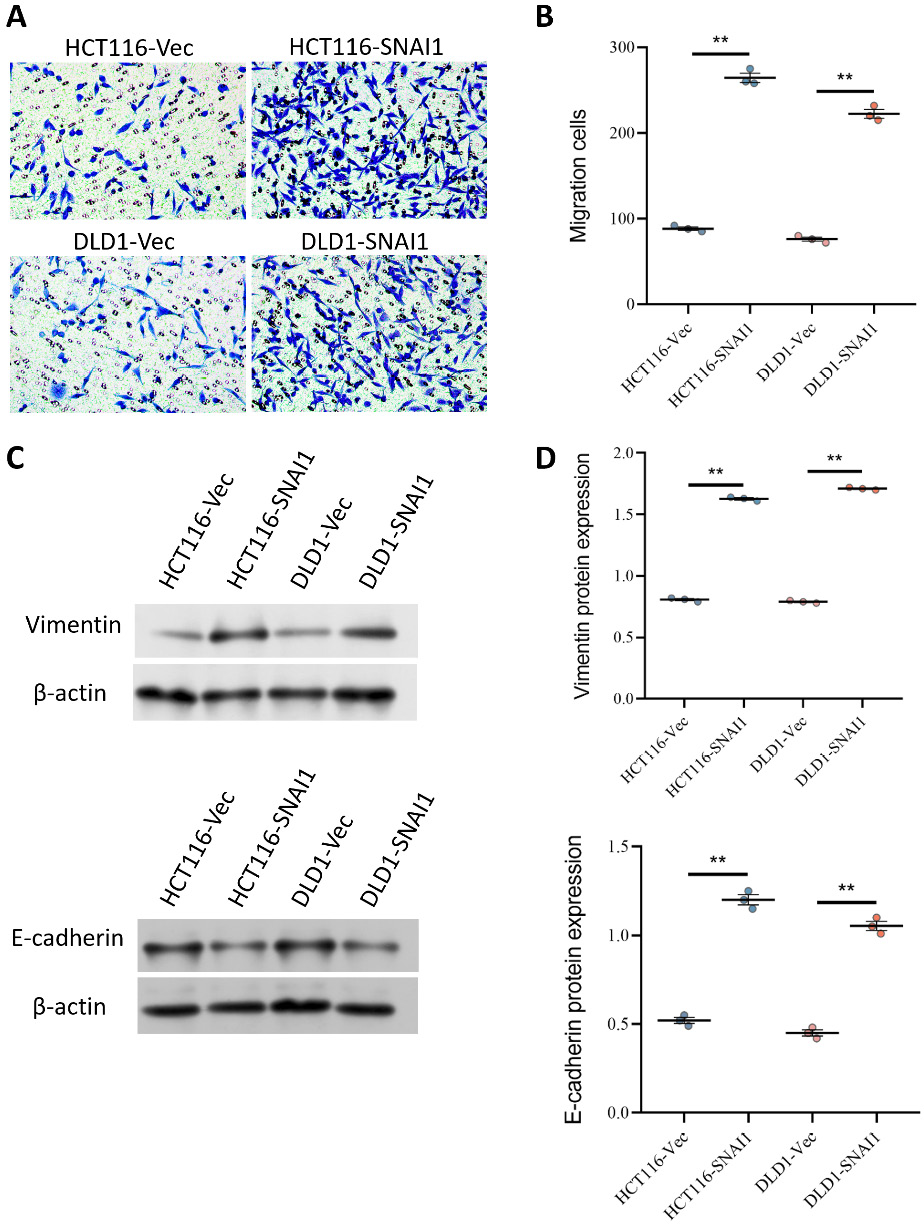
The results of the migration assay demonstrated that SNAI1 overexpression markedly enhanced cell migration. Specifically, overexpression of SNAI1 significantly increased the migratory capacity of HCT116-SNAI1 and DLD1-SNAI1 cells (Figure 3A,B). To further investigate how SNAI1 influences the phenotypic transition of tumor cells, western blot analysis was used to assess the expression of the cytoskeletal protein vimentin and the cell adhesion molecule E-cadherin. Vimentin expression in HCT116-SNAI1 and DLD1-SNAI1 cells was significantly upregulated, whereas E-cadherin expression was downregulated (Figure 3C,D), suggesting that SNAI1 overexpression promoted phenotypic transformation of tumor cells and enhanced their invasiveness.
Inhibitory effect of SNAI1 on miR-145 expression and promoter activity
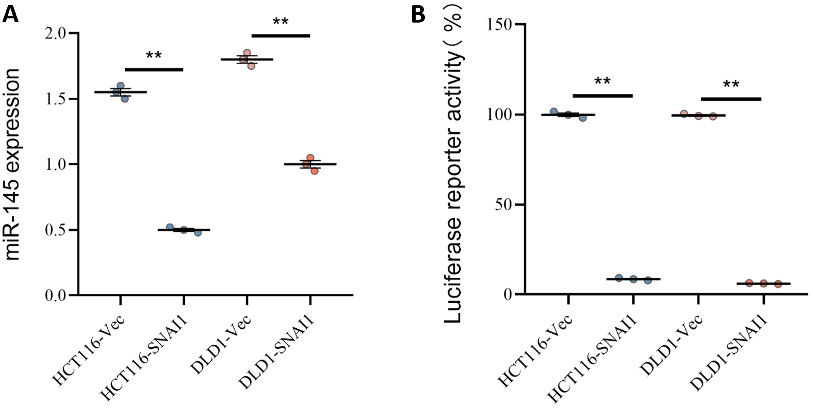
We investigated the effects of SNAI1 overexpression on miR-145 expression in the colon cancer cell lines HCT116 and DLD1 using RT-PCR. The results showed a significant reduction in miR-145 expression in HCT116-SNAI1 cells and a modest downregulation of miR-145 expression in DLD1-SNAI1 cells, indicating that SNAI1 overexpression successfully reduced miR-145 expression (Figure 4A). Further analysis showed that the core sequence of the SNAI1 binding site, CA(C/G)(C/G)TG, in the promoter region of miR-145 was consistent with the upstream CT-enriched region. Using luciferase reporter gene assays, we investigated how SNAI1 affected miR-145 promoter activity (Figure 4B). The findings demonstrated that luciferase activity was dramatically reduced in HCT116-SNAI1 cells, suggesting that SNAI1 strongly suppressed miR-145 promoter activity. Luciferase activity was also significantly reduced in DLD1-SNAI1 cells, further confirming that SNAI1 effectively inhibits miR-145 transcription.
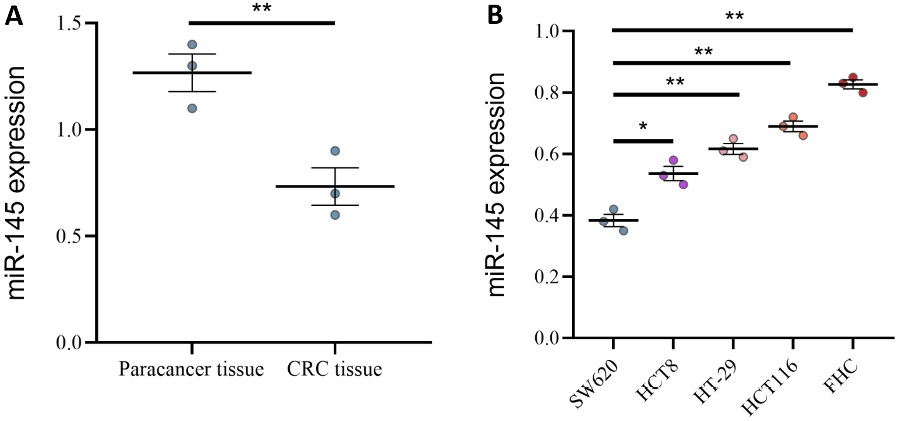
Analysis of miR-145 expression in colorectal cancer cell lines and tissues
Using qPCR, we examined miR-145 expression levels in both healthy colon and CRC tissues. The results showed that miR-145 was considerably downregulated in cancer tissues (Figure 5A). Additionally, we examined miR-145 expression in several colon cancer cell lines and 1 normal colon cell line. miR-145 expression was low in the SW620 cell line and moderate in the HCT8 and HT-29 cell lines, although still lower than in the normal colon cell line (Figure 5B). Overall, miR-145 expression was consistently lower in CRC cell lines compared with normal colon cells, suggesting that miR-145 downregulation may be a common feature of colorectal tumorigenesis.
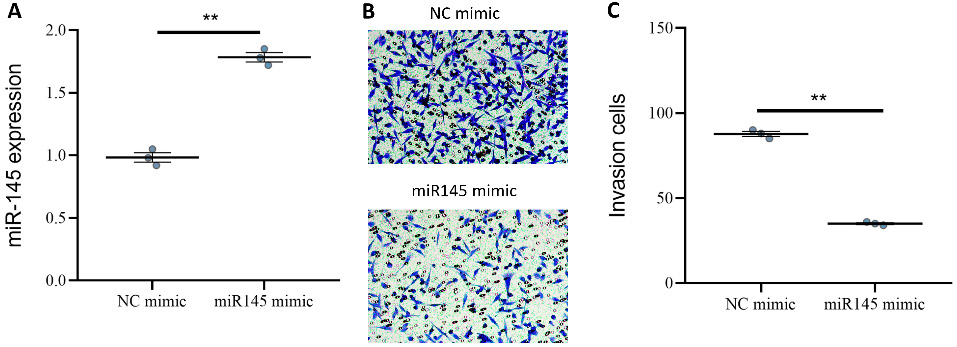
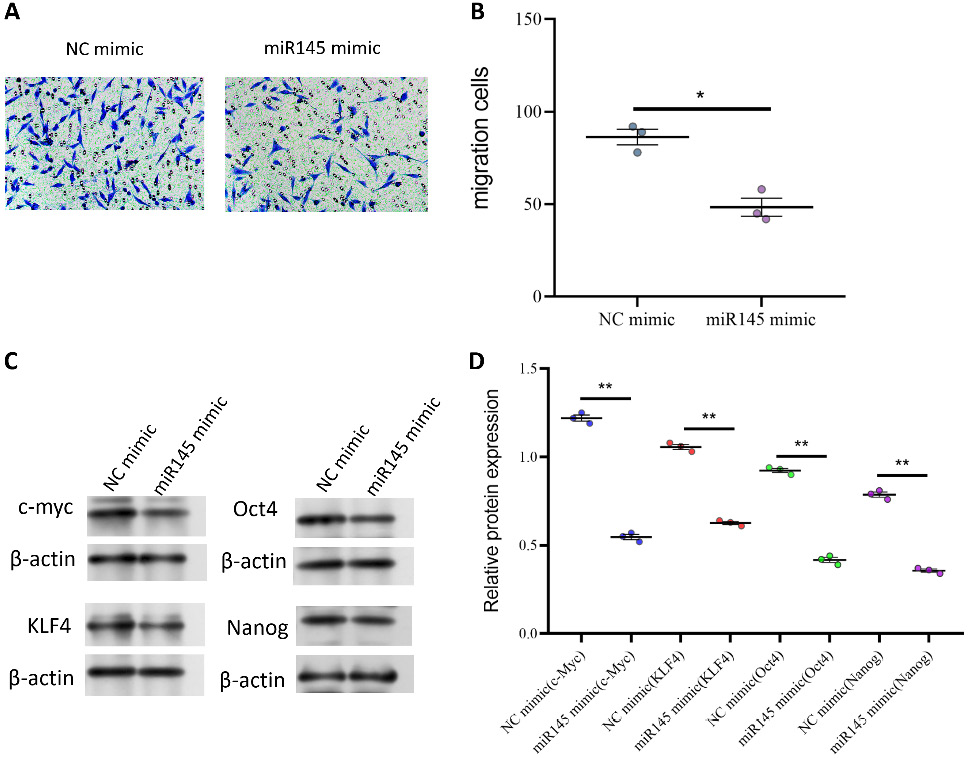
Effects of overexpression of miR-145 on invasion and migration of tumor cells
Through qPCR analysis, we confirmed that miR-145 mimics effectively increased miR-145 expression (Figure 6A), indicating successful overexpression. The effect of miR-145 overexpression on tumor cell invasion and migration was further evaluated. The findings demonstrated a significant decrease in the invasion index of miR-145 mimic-transfected cells (Figure 6B), suggesting that miR-145 overexpression inhibited tumor cell invasion. In addition, miR-145 overexpression markedly impaired the migratory capacity of tumor cells (Figure 6C, Figure 7A,B). Collectively, these results demonstrate that miR-145 acts as a negative regulator of CRC cell aggressiveness and migration.
Effects of SNAI1 on colon cancer cell survival and invasiveness and how miR-145 regulates the cAMP/PKA signaling pathway
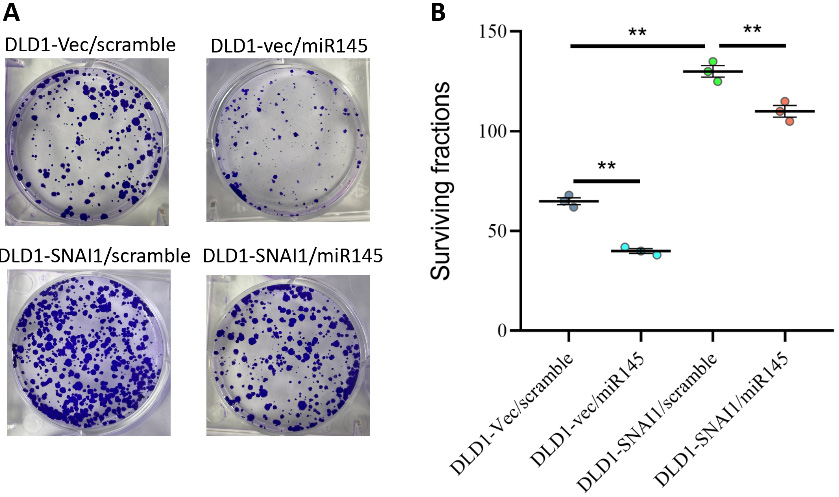
The effects of miR-145 and SNAI1 on DLD1 cell survival were evaluated. Overexpression of miR-145 significantly reduced cell viability, suggesting an inhibitory effect on cell survival. In contrast, overexpression of SNAI1 resulted in a significant increase in cell viability, indicating enhanced cell survival. Notably, co-overexpression of SNAI1 and miR-145 suggested that miR-145 could effectively counteract the survival-promoting effect of SNAI1 (Figure 8A,B).
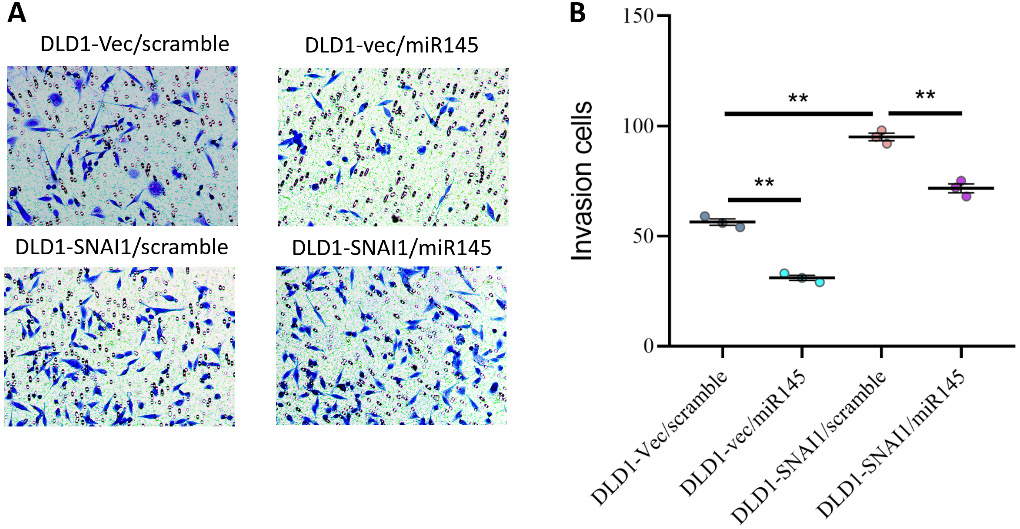
In the invasion assay, overexpression of miR-145 significantly reduced the cellular invasion index, indicating the ability of miR-145 to inhibit cell invasion. In contrast, overexpression of SNAI1 enhanced the invasive capacity of the cells. Notably, when both SNAI1 and miR-145 were overexpressed, the results suggested that miR-145 inhibited tumor cell invasion even in the presence of SNAI1 overexpression (Figure 9A,B).
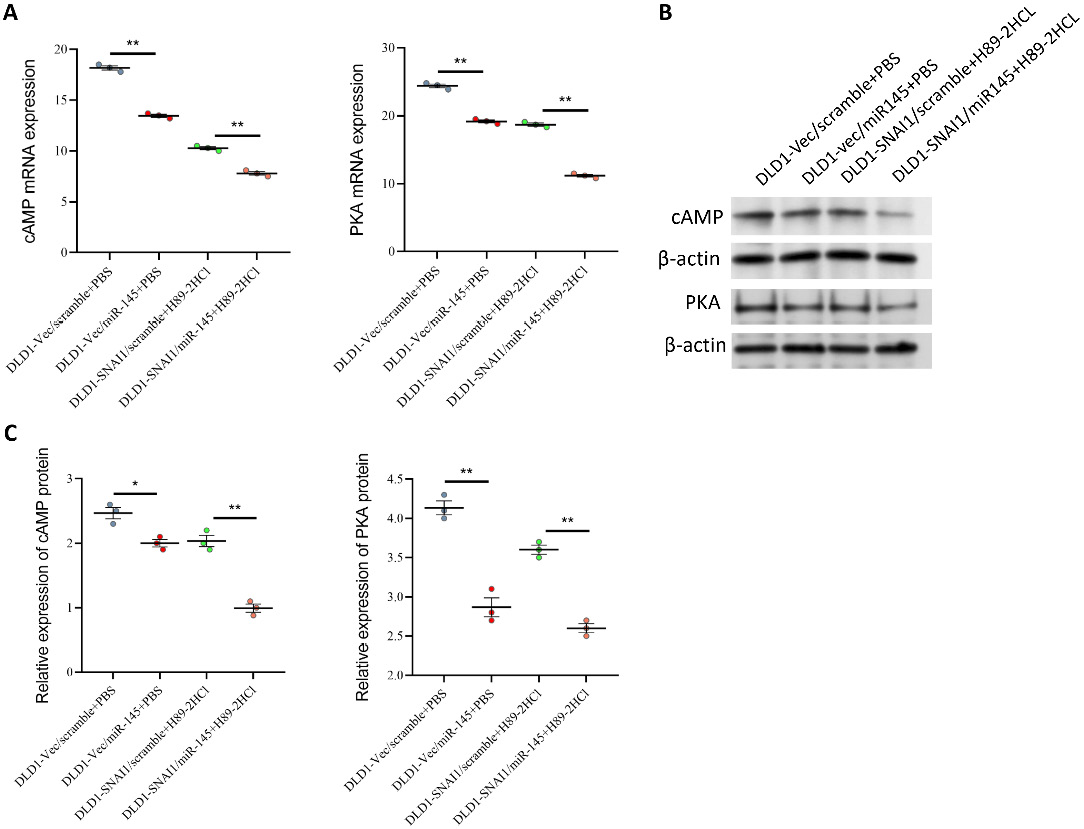
Subsequent experiments revealed that miR-145 overexpression markedly decreased cAMP and PKA activity, suggesting that miR-145 may exert its effects by blocking the cAMP/PKA pathway. Use of the PKA inhibitor H89 also significantly reduced cAMP and PKA levels, indicating effective inhibition of PKA activity (Figure 10A). In the context of miR-145 overexpression, H89 further reduced cAMP and PKA levels, suggesting that the 2 may synergistically inhibit activity of the cAMP/PKA pathway (Figure 10B,C).
Discussion
A number of hereditary and environmental factors are closely associated with the incidence of CRC, one of the malignant tumors with the highest morbidity and mortality rates worldwide. According to global cancer statistics, colon cancer ranked 3rd in terms of incidence and 2nd in terms of mortality among malignant tumors in 2020, with approx. 1.88 million new cases and 920,000 deaths.10 The incidence and mortality of CRC continue to rise in developing countries, particularly China, despite improvements in early detection and treatment resulting from advances in screening technologies, especially in industrialized nations.11 Therefore, CRC prevention and treatment remain major global public health challenges.12
The development and progression of CRC involve a complex, multistep process characterized by interactions among numerous genes and signaling pathways.13, 14 In recent years, increasing attention has been directed toward the role of EMT in tumor invasion, metastasis, and chemoresistance. One of the key steps enabling tumor dissemination is the transition of epithelial cells into more aggressive and migratory mesenchymal cells through a series of molecular alterations, known as EMT.15, 16 In CRC, Snail family transcription factors such as SNAI1 and SNAI2 are considered core regulators of the EMT process, promoting tumor cell migration and invasion through regulation of cytoskeletal remodeling, adhesion molecule expression, and cell–cell interactions.17, 18
In this study, we focused on SNAI1 and SNAI2, 2 key transcription factors, and their roles in CRC. We compared the expression patterns of SNAI1 and SNAI2 among different cohorts of colon cancer patients and further analyzed their genetic alterations. Through comparative analysis of multiple datasets, we found that SNAI1 was significantly overexpressed in certain colon cancer patients, whereas SNAI2 was suppressed in others.19 Furthermore, using cell-based experiments, we investigated the role of SNAI1 in colon cancer cell migration, proliferation, phenotypic transformation, and interaction with miR-145.20
The study found that SNAI1 not only promoted proliferation and survival of colon cancer cells, but also significantly enhanced migratory capacity. In particular, overexpression of SNAI1 in HCT116 cells increased proliferative capacity approx. 7-fold, and the survival rate was also significantly increased. In addition, SNAI1 overexpression promoted phenotypic transformation of the cells, as demonstrated by increased expression of the cytoskeletal protein vimentin and decreased expression of the cell adhesion molecule E-cadherin, thereby further enhancing cellular aggressiveness.21
We investigated the molecular interaction between SNAI1 and miR-145. MiR-145, a well-known tumor suppressor, has been shown to inhibit tumor growth and metastasis in a variety of tumor types.22, 23 In the present study, SNAI1 overexpression markedly reduced miR-145 expression. These findings suggest that SNAI1 may regulate miR-145 expression at the transcriptional level by modulating miR-145 promoter activity. Furthermore, we found that miR-145 expression was frequently downregulated in colon cancer cell lines and tissues, and that its overexpression inhibited tumor cell invasion and migration, further supporting the role of miR-145 as a putative tumor suppressor.24
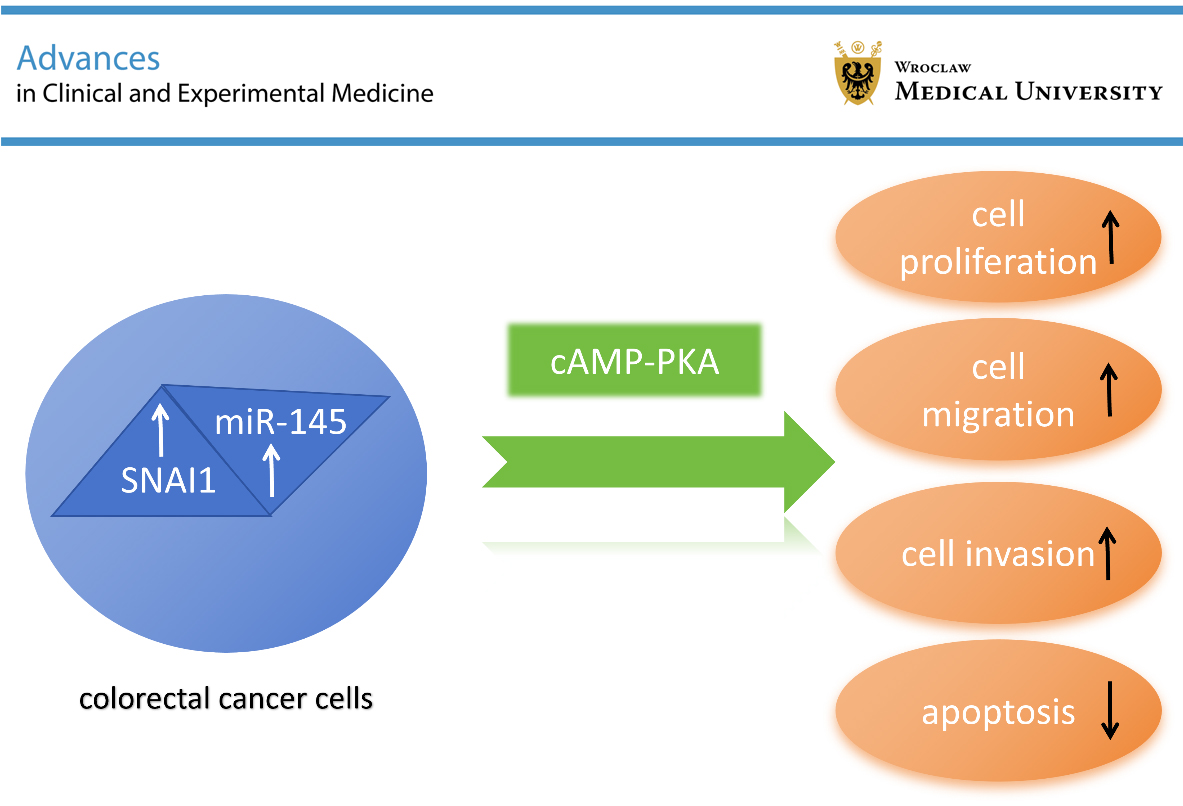
Our findings suggest that SNAI1 and miR-145 play pivotal roles in modulating key biological processes driving CRC progression. SNAI1, a well-known transcription factor promoting EMT, facilitates tumor cell invasion, metastasis, and therapeutic resistance. In contrast, miR-145 functions as a tumor suppressor by inhibiting pathways associated with proliferation and migration, partly through targeting SNAI1 and regulating the cAMP/PKA signaling axis. Dysregulation of the SNAI1/miR-145 axis may therefore enhance tumor aggressiveness and may be associated with poor patient prognosis. These findings underscore the significance of SNAI1 and miR-145 not only in cellular behavior but also in the broader biological processes underlying CRC progression. By suppressing miR-145 expression, SNAI1 may not only serve as a crucial regulatory component in the EMT process of CRC cells but may also contribute to increased tumor aggressiveness and metastasis. Furthermore, upregulation of miR-145 may effectively reduce tumor cell aggressiveness.
While our study focused on the regulatory effects of SNAI1 and miR-145 on the cAMP/PKA pathway, their potential interactions with other critical signaling cascades, such as the Wnt/β-catenin, PI3K/AKT, and TGF-β pathways, remain to be elucidated. Future studies are needed to explore these associations in order to fully understand the broader regulatory network and oncogenic potential of SNAI1 and miR-145 in CRC.
Potential clinical implications
Given the pivotal role of the SNAI1/miR-145 regulatory axis in CRC progression, targeting this pathway represents a promising therapeutic strategy. Potential approaches include development of miR-145 mimics to restore its tumor-suppressive function, use of small-molecule inhibitors to suppress SNAI1 expression or activity, and development of gene-therapy approaches to modulate the expression levels of these key molecules. However, clinical application of these strategies requires careful consideration of delivery efficiency, target specificity, and potential off-target effects. Further preclinical studies and clinical trials are needed to evaluate the safety and efficacy of these approaches in patients with CRC.
Limitations of the study
This study has several limitations that should be acknowledged. First, our findings are primarily based on in vitro experiments using 2 CRC cell lines (DLD1 and HCT116), which may not fully reflect the complexity and heterogeneity of CRC. Validation using additional cell lines with diverse genetic backgrounds is needed to strengthen the generalizability of our conclusions. Second, the lack of in vivo studies limits our ability to fully elucidate the roles of SNAI1 and miR-145 within the physiological tumor microenvironment (TME), where factors such as blood supply, immune surveillance, and stromal interactions play critical roles. Future investigations using animal models or patient-derived xenografts (PDXs) are warranted. Third, although we demonstrated that SNAI1 and miR-145 regulate the cAMP/PKA signaling pathway, their interactions with other key oncogenic pathways, such as Wnt/β-catenin, PI3K/AKT, and TGF-β, remain to be explored. Finally, the clinical relevance of our findings needs to be verified through analysis of patient samples to assess the potential of SNAI1 and miR-145 as diagnostic biomarkers or therapeutic targets.
Moreover, technical factors such as variations in transfection efficiency, reagent handling, and measurement precision may introduce bias. Potential off-target effects and batch-to-batch variability of experimental reagents could also affect the results. Rigorous experimental controls and repeated validation experiments will be necessary to confirm the reproducibility of our findings.
Conclusions
This work demonstrated the critical roles of SNAI1 and miR-145 in regulating the cAMP/PKA signaling pathway, as well as colon cancer cell survival and invasiveness. The findings further supported the critical role of SNAI1 in tumor progression by demonstrating that SNAI1 overexpression enhanced tumor cell survival and invasive potential through upregulation of cAMP and PKA levels. In contrast, overexpression of miR-145 showed promise as a tumor suppressor by markedly inhibiting the cAMP/PKA pathway and reducing tumor cell invasiveness and survival.
When SNAI1 and miR-145 were simultaneously overexpressed, miR-145 counteracted the tumor-promoting effects of SNAI1 by significantly downregulating cAMP/PKA activity, suggesting that miR-145 may antagonize SNAI1-mediated tumor promotion. In addition, administration of the PKA inhibitor H89 further attenuated SNAI1-induced tumor progression, confirming the important role of the cAMP/PKA pathway in SNAI1 regulation. These results provide novel insights into the therapeutic potential of miR-145 and SNAI1 as targets for cancer treatment.
Supplementary data
The supplementary materials are available at https://doi.org/10.5281/zenodo.15684050. The package contains the following files:
Supplementary Table 1. The results of normality test.
Supplementary Table 2. The results of homogeneity of variance.
Supplementary Table 3. The results of statistical analysis.
Data Availability Statement
The data that support the findings of this study are openly available in Figshare at https://figshare.com/s/513f4
d57719ed02098c4.
Consent for publication
Not applicable.
Use of artificial intelligence and AI-assisted technologies
Not applicable.