Abstract
Background. Osteomyelitis is a challenging orthopedic condition characterized by bone inflammation, often resulting from infection. The roles of inflammatory cytokines (ICs) and metabolites in its pathogenesis are not fully understood.
Objectives. This study aimed to explore the potential causal relationships among ICs, metabolites, and osteomyelitis using Mendelian randomization (MR) analysis and in vitro experiments.
Materials and methods. A 2-sample MR analysis (FinnGen: 1,881 cases and 391,037 controls) was performed to screen 91 cytokines and more than 1,400 metabolites. In vitro experiments using MC3T3-E1 cells treated with staphylococcal protein A (SPA) were conducted to evaluate the effects of p-cresol sulfate (PCS), a circulating metabolite identified through MR analysis, on cell proliferation, osteogenic differentiation, and inflammation.
Results. Mendelian randomization analysis identified significant associations between several ICs and osteomyelitis risk. Elevated levels of CUB domain-containing protein 1 (CDCP1; odds ratio (OR) = 1.19, 95% confidence interval (95% CI): 1.03–1.38) and thymic stromal lymphopoietin (TSLP; OR = 1.26, 95% CI: 1.05–1.51) were associated with increased risk, whereas higher levels of adenosine deaminase (ADA; OR = 0.85, 95% CI: 0.74–0.98) and interleukin-5 (IL-5; OR = 0.79, 95% CI: 0.65–0.96) were associated with reduced risk. Metabolites such as PCS (OR = 0.74, 95% CI: 0.59–0.93) were identified as protective, whereas others, such as beta-cryptoxanthin (β-CX; OR = 1.33, 95% CI: 1.07–1.66), were associated with increased risk. Mediation analysis further suggested that several metabolites significantly mediated the indirect effects of cytokines on osteomyelitis risk. In vitro experiments demonstrated that PCS enhanced osteogenic potential, reduced intracellular reactive oxygen species (ROS) production, and lowered IC levels.
Conclusions. These findings provide insight into the associations among ICs, metabolites, and osteomyelitis, suggesting potential therapeutic targets for reducing disease severity. They also highlight the complex interplay among these factors in osteomyelitis pathogenesis. Further studies are needed to clarify the mechanisms through which ICs and metabolites influence osteomyelitis, particularly through regulation of inflammatory responses and oxidative stress.
Key words: osteomyelitis, inflammatory cytokines, metabolomics, Mendelian randomization, osteoblasts
Background
Osteomyelitis is an inflammatory bone condition that can cause damage to both bone and adjacent tissues.1 This disorder may occur at any age and affect any bone, often resulting from the local spread of infection from a contiguous source, such as trauma, bone surgery, or joint replacement.2 Owing to its complex and chronic nature, osteomyelitis is considered a refractory condition in orthopedics and poses a significant challenge in orthopedic surgical practice.3, 4 Even with optimal medical management, approx. 40% of treatments for chronic or recurrent osteomyelitis fail, partly due to persistent infection and bacterial persistence.5
Recent studies have emphasized the key roles of cytokines such as interleukin-1 beta (IL-1β) and interleukin-6 (IL-6) in osteomyelitis pathophysiology, particularly in osteoblast–osteoclast communication.6, 7 The importance of the precise temporal and spatial expression of these cytokines in maintaining the balance between inflammation and immunoregulation is increasingly recognized.8 Gut-derived indole derivatives and short-chain fatty acids have recently been shown to modulate both systemic inflammation and bone turnover.9, 10 In high-income countries, the annual incidence of osteomyelitis is approx. 8–10 per 100,000 person-years, with direct medical costs exceeding USD 1 billion annually.11, 12
Mendelian randomization (MR) uses genetic variation as a natural instrument to investigate potential causal relationships between modifiable risk factors and health outcomes in observational datasets.13 Because genetic variants are fixed at birth, MR is less susceptible to confounding than conventional observational studies. Given that the associations among inflammatory cytokines (ICs), metabolites, and osteomyelitis have not yet been examined using genetic approaches, we employed a 2-sample MR approach to assess the potential causal relationships between genetically predicted blood concentrations of ICs and metabolites and the risk of osteomyelitis.
While MR is a powerful tool for exploring potential causal relationships and identifying ICs associated with osteomyelitis risk, it is limited in its ability to elucidate the specific cellular mechanisms through which these ICs exert their effects. Staphylococcal protein A (SPA), a key virulence factor of Staphylococcus aureus that impairs osteoblast function, is widely used to model infection-induced bone damage. It binds to osteoblasts, inhibits their proliferation, induces apoptosis, and impairs mineralization.14
Objectives
The primary aim of this study was to screen for potential causal effects of 91 cytokines and more than 1,400 blood metabolites on osteomyelitis risk using a 2-sample MR approach. Secondary aims were to: 1) perform mediation analysis to quantify indirect pathways; 2) conduct reverse-direction MR analysis; and 3) validate the effects of PCS in vitro using SPA-treated MC3T3-E1 cells. We hypothesized that p-cresol sulfate (PCS) would attenuate SPA-induced oxidative stress and IC release in osteoblasts.
Materials and methods
Study design
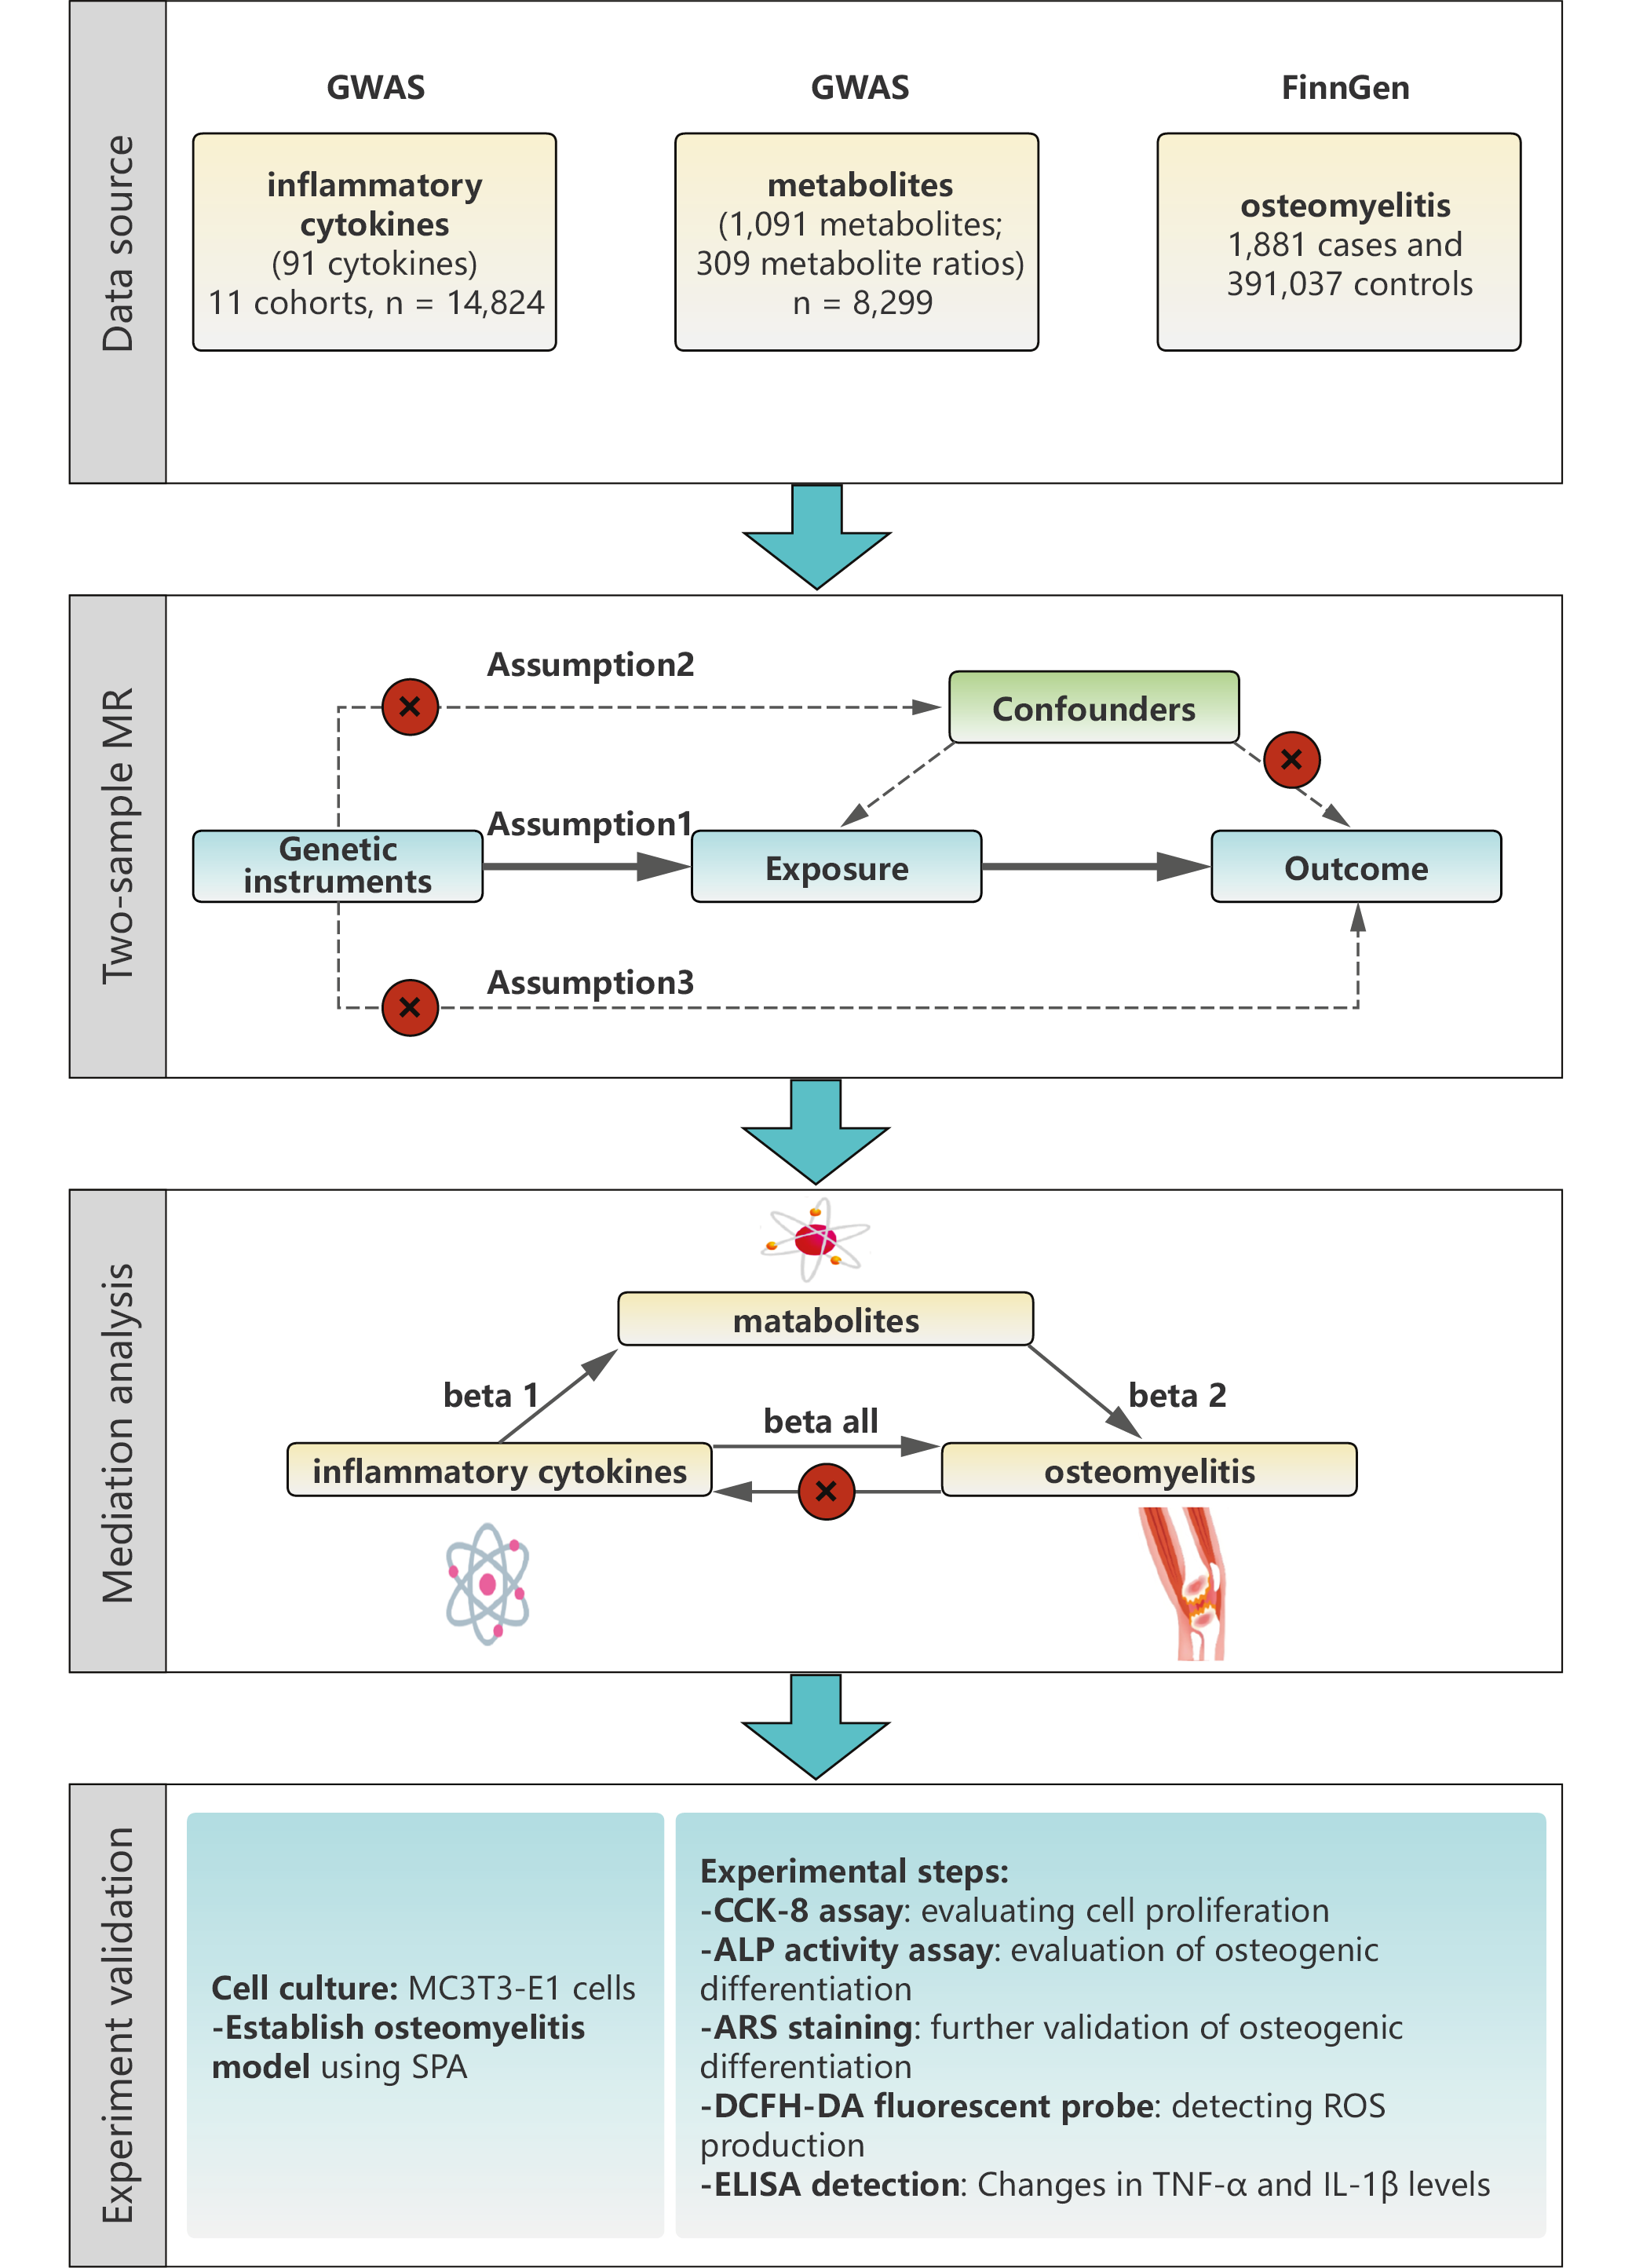
In the 1st stage, the inverse-variance weighting (IVW) method was used as the primary MR analysis, alongside MR-Egger, weighted median, simple mode, and weighted mode methods to improve robustness and address potential pleiotropy.15, 16 Mediation was assessed using a 2-step MR framework. In step 1, 2-sample MR was used to estimate the total effect of each cytokine on osteomyelitis and the direct effect of each metabolite on osteomyelitis. In step 2, 2-sample MR was used to estimate the effect of each cytokine on its candidate mediator (metabolite). The proportion mediated (PM) was calculated as PM = (α × β)/γ, where α represents the effect of the cytokine on the metabolite, β represents the effect of the metabolite on osteomyelitis, and γ represents the total effect of the cytokine on osteomyelitis. Standard errors (SEs) for PM were estimated using the delta method. Inflammatory cytokine data were obtained from the largest available protein quantitative trait loci (pQTL) study (GWAS Catalog IDs GCST90274758–GCST90274848), which quantified 91 plasma proteins using the Olink Target Inflammation platform in 14,824 individuals of European ancestry (Figure 1).17 Plasma metabolite genome-wide association studies (GWAS) data were derived from the Canadian Longitudinal Study on Aging (n = 8,299 participants of European ancestry; Metabolon HD4 platform; GWAS Catalog IDs GCST90199621–GCST9021020). Osteomyelitis summary statistics (1,881 cases and 391,037 controls) were obtained from the FinnGen R10 release (Finnish population). Mean F-statistics were 31 (range: 10–120) for cytokines and 29 (range: 10–105) for metabolites, indicating robust instrument strength.
Genetic instrumental variables selection
Single nucleotide polymorphisms (SNPs) were selected as instrumental variables (IVs) for IC and metabolite traits using a p-value threshold of <1 × 10−5.18 For osteomyelitis, a more stringent threshold of p < 5 × 10⁻⁸ was applied. Genetic variants were clumped using an R2 threshold of <0.001 within a 10,000-kb window. Single nucleotide polymorphisms were further filtered based on the F-statistic, calculated as the ratio of the squared effect size (β2) to the squared standard error (SE2), with a threshold of >10. Potential confounders and related traits (e.g., age, sex, ethnicity, and comorbid conditions) were identified using the PhenoScanner V2 database (http://www.phenoscanner.medschl.cam.ac.uk/).
Allele harmonization was performed using the TwoSampleMR package (action = 2), which automatically aligned ambiguous (palindromic) SNPs to the positive strand and ensured concordant effect alleles across the exposure and outcome datasets. Linkage disequilibrium clumping was performed using the 1000 Genomes European reference panel (https://github.com/MRCIEU/gwasvcf) with a 10,000-kb window and an r2 threshold of <0.001. MR-PRESSO (Mendelian Randomization Pleiotropy RESidual Sum and Outlier) was used to assess horizontal pleiotropy: the global test evaluated overall pleiotropy, whereas the outlier test identified influential SNPs. Outliers with distortion p < 0.05 were removed, and MR estimates were recalculated using the cleaned dataset.
Allele harmonization and strand alignment were performed using the TwoSampleMR package (v. 0.5.6) following the protocol described by Hemani et al.19 To contextualize our findings within recent large-scale studies, we note the comprehensive MR overview by Wang et al.20 and the proteome-wide investigation by Sun et al.17 Our study extends these efforts by focusing specifically on osteomyelitis.
Cell culture and amplification
The MC3T3-E1 cell line was obtained from the Cell Bank of the Chinese Academy of Sciences (Shanghai, China). Cells between passages 3 and 6 were used for all experiments. All experiments were performed with at least 3 independent biological replicates (n = 3 per group). Cells were randomly allocated to treatment groups, and the operator was blinded to treatment identity during image acquisition and quantification. To maintain the cells, they were cultured in phenol-red-free Dulbecco’s modified Eagle’s medium (DMEM) supplemented with 10% heat-inactivated fetal bovine serum (FBS-HI), 100 U/mL penicillin, and 100 μg/mL streptomycin. Cells were incubated at 37°C in a humidified atmosphere containing 5% CO2.
Osteomyelitis in vitro model
A 50 μg/mL SPA solution was added to the culture plates and incubated at 37°C, with the concentration selected based on a previous study.21 After incubation, unbound SPA was removed by aspiration. Cells (5 × 10⁵ cells/mL) were then seeded into each well. The co-culture was maintained for 4 h.
Cell proliferation assay
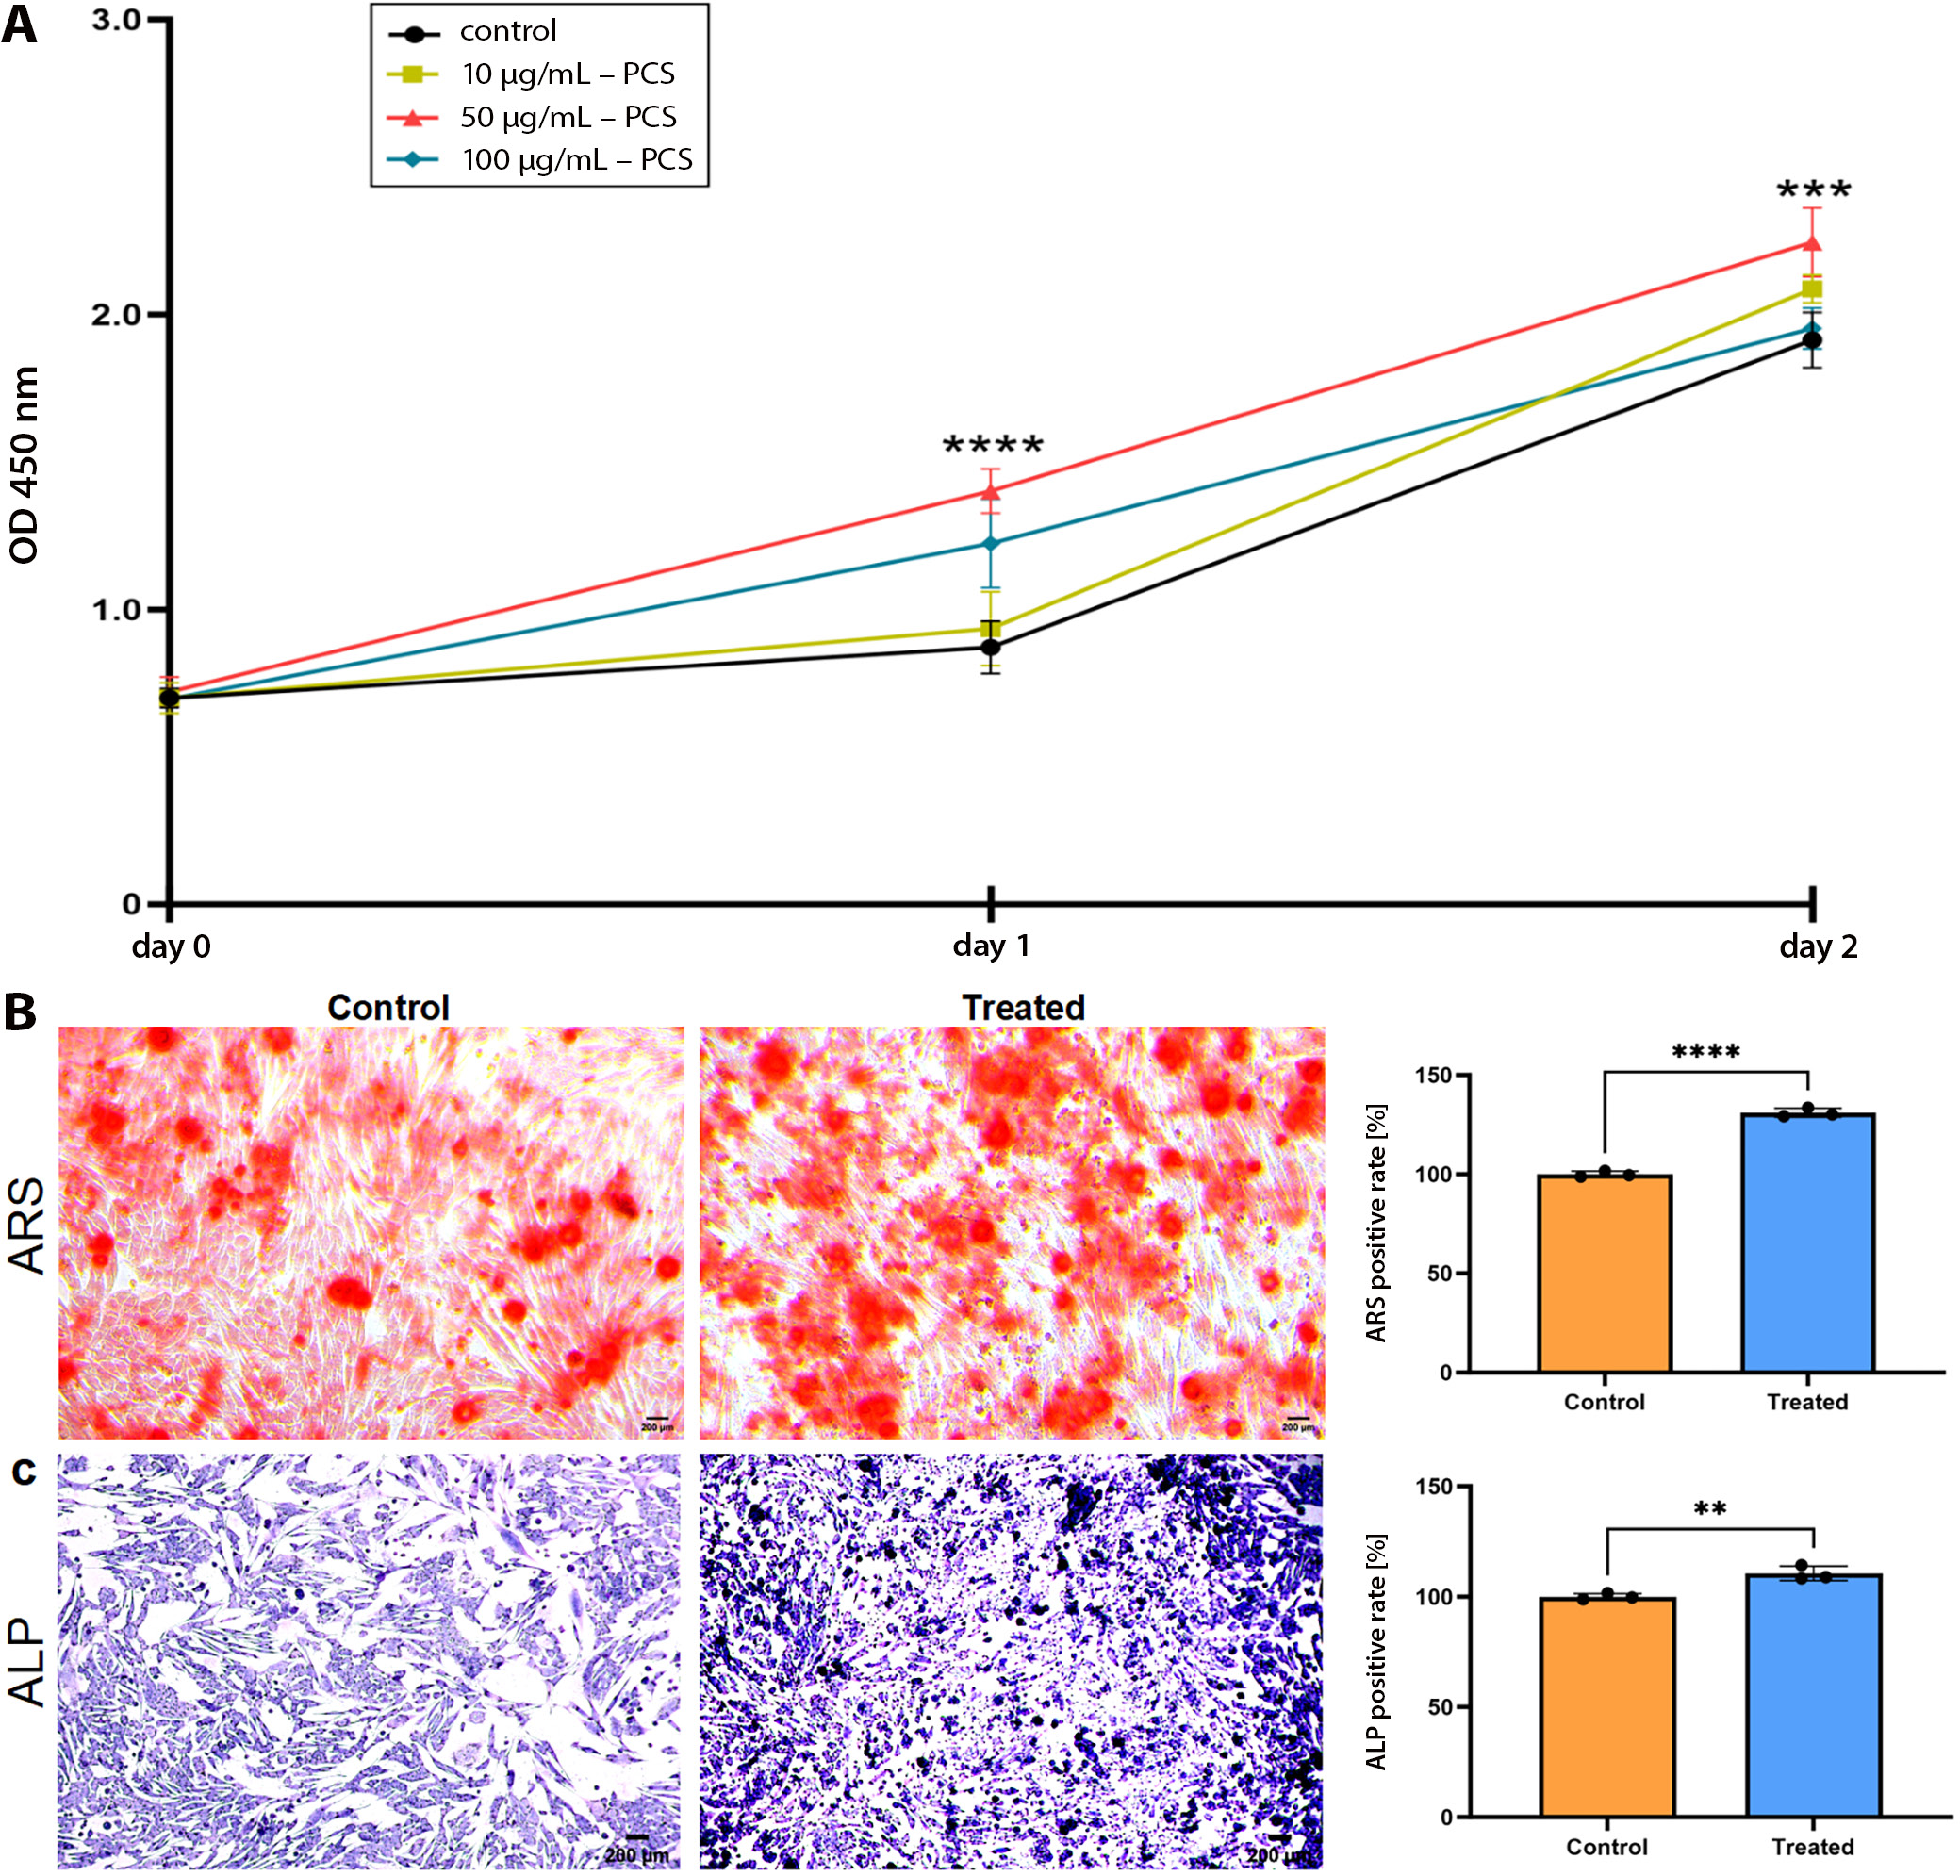
The Cell Counting Kit-8 (CCK-8) assay (MedChemExpress, Monmouth Junction, USA) was used to evaluate cell viability. MC3T3-E1 cells were seeded in 96-well plates at a density of 4 × 10³ cells per well. Following 2-day exposure to different concentrations of PCS (0, 10, 50, and 100 μg/mL), 10 μL of CCK-8 reagent was added to each well, and the plates were incubated at 37°C for 2 h. Absorbance at 450 nm was measured using a spectrophotometer (Molecular Devices, San Jose, USA) to assess cell viability. Based on the preceding CCK-8 dose–response curve (0–100 μg/mL), 50 μg/mL was selected as the non-cytotoxic concentration that maximally restored osteoblast function and was therefore used in all subsequent alkaline phosphatase (ALP), alizarin red staining (ARS), and reactive oxygen species (ROS) assays.
Alkaline phosphatase staining
MC3T3-E1 cells were cultured in osteogenic induction medium for 7 days. For differentiation assays, cells were seeded at a density of 5 × 10⁴ cells per well. On day 7, cells were stained using the Cell Alkaline Phosphatase Staining Kit (Solarbio, Beijing, China) according to the manufacturer’s instructions. Following staining, the cells were observed under an optical microscope (Leica DMRB Microscope; Leica Microsystems GmbH, Wetzlar, Germany), and representative images were captured.
Alizarin red staining
MC3T3-E1 cells were cultured in osteogenic induction medium for 21 days. After the induction period, the medium was removed, and the cells were stained using the Cell Alizarin Red S Staining Kit (Solarbio) according to the manufacturer’s instructions. The stained cells were then examined under a microscope (Leica Microsystems GmbH), and representative images were captured.
Detection of intracellular O2 production
The cell-permeable 2′,7′-dichlorodihydrofluorescein diacetate (DCFH-DA; MedChemExpress) probe was used to measure intracellular ROS levels. For ROS assays, cells were seeded at a density of 2 × 10⁴ cells per well. SPA-treated MC3T3-E1 cells were co-cultured with PCS for 3 days. After rinsing with phosphate-buffered saline (PBS), the cells were incubated with 10 μM DCFH-DA in the dark for 30 min, then washed twice with PBS. Fluorescence images were acquired using a fluorescence microscope (Nikon Eclipse 80i; Nikon Corp., Tokyo, Japan).
ELISA
The culture supernatants from SPA-treated MC3T3-E1 cells were collected, and changes in tumor necrosis factor alpha (TNF-α) and IL-1β levels were measured using commercially available Yuanju Bio, Shanghai, China) enzyme-linked immunosorbent assay (ELISA) kits according to the manufacturer’s instructions. Each measurement was performed in triplicate. Concentrations were calculated based on standard calibration curves, and mean values were subsequently determined.
Statistical analyses
All statistical analyses were performed using R v. 4.3.3 (R Foundation for Statistical Computing, Vienna, Austria) with the TwoSampleMR package (https://github.com/MRCIEU/TwoSampleMR). To account for the multiple-testing burden arising from approx. 1,500 exposures, we applied a 2-stage filtering strategy. First, associations with p < 0.05 based on the IVW estimator were retained. Second, these p-values were corrected using the Benjamini–Hochberg false discovery rate (FDR) procedure across all independent tests (91 cytokines and 1,400 metabolites analyzed separately). Only cytokines or metabolites with FDR-adjusted p < 0.05 were considered statistically significant.
For cellular experiments, all data were analyzed using GraphPad Prism v. 10 (GraphPad Software, San Diego, USA). CCK-8 proliferation data were analyzed using 2-way analysis of variance (ANOVA; factors: treatment and time), followed by Dunnett’s multiple-comparisons test to obtain adjusted p-values. All other cellular assays (ALP activity, ARS quantification, ROS fluorescence intensity, and ELISA) were analyzed using unpaired 2-tailed t-tests after confirmation of normal distribution with the Shapiro–Wilk test. Count data were analyzed using the χ2 test. Results are presented as mean ± standard deviation (SD) from at least 3 independent biological replicates (passages 3–6). Statistical significance was set at p (or adjusted p) <0.05.
Ethics approval and biosafety
The use of the MC3T3-E1 cell line was approved by the Institutional Animal Care and Use Committee (IACUC) of Shanghai Jiao Tong University School of Medicine (China). As this study was conducted entirely in vitro using a commercially available cell line and did not involve live animals, an animal ethics approval number is not applicable. All procedures involving SPA were conducted under Biosafety Level 2 (BSL-2) containment in accordance with institutional guidelines.
This study relied on publicly available summary statistics from previously published studies and research consortia. Ethical approval had been obtained by the respective institutional review boards for each original study, and all participants had provided informed consent. As this study did not involve individual-level data, no additional ethical approval was required.
Results
Inflammatory cytokines as dual modulators in osteomyelitis risk
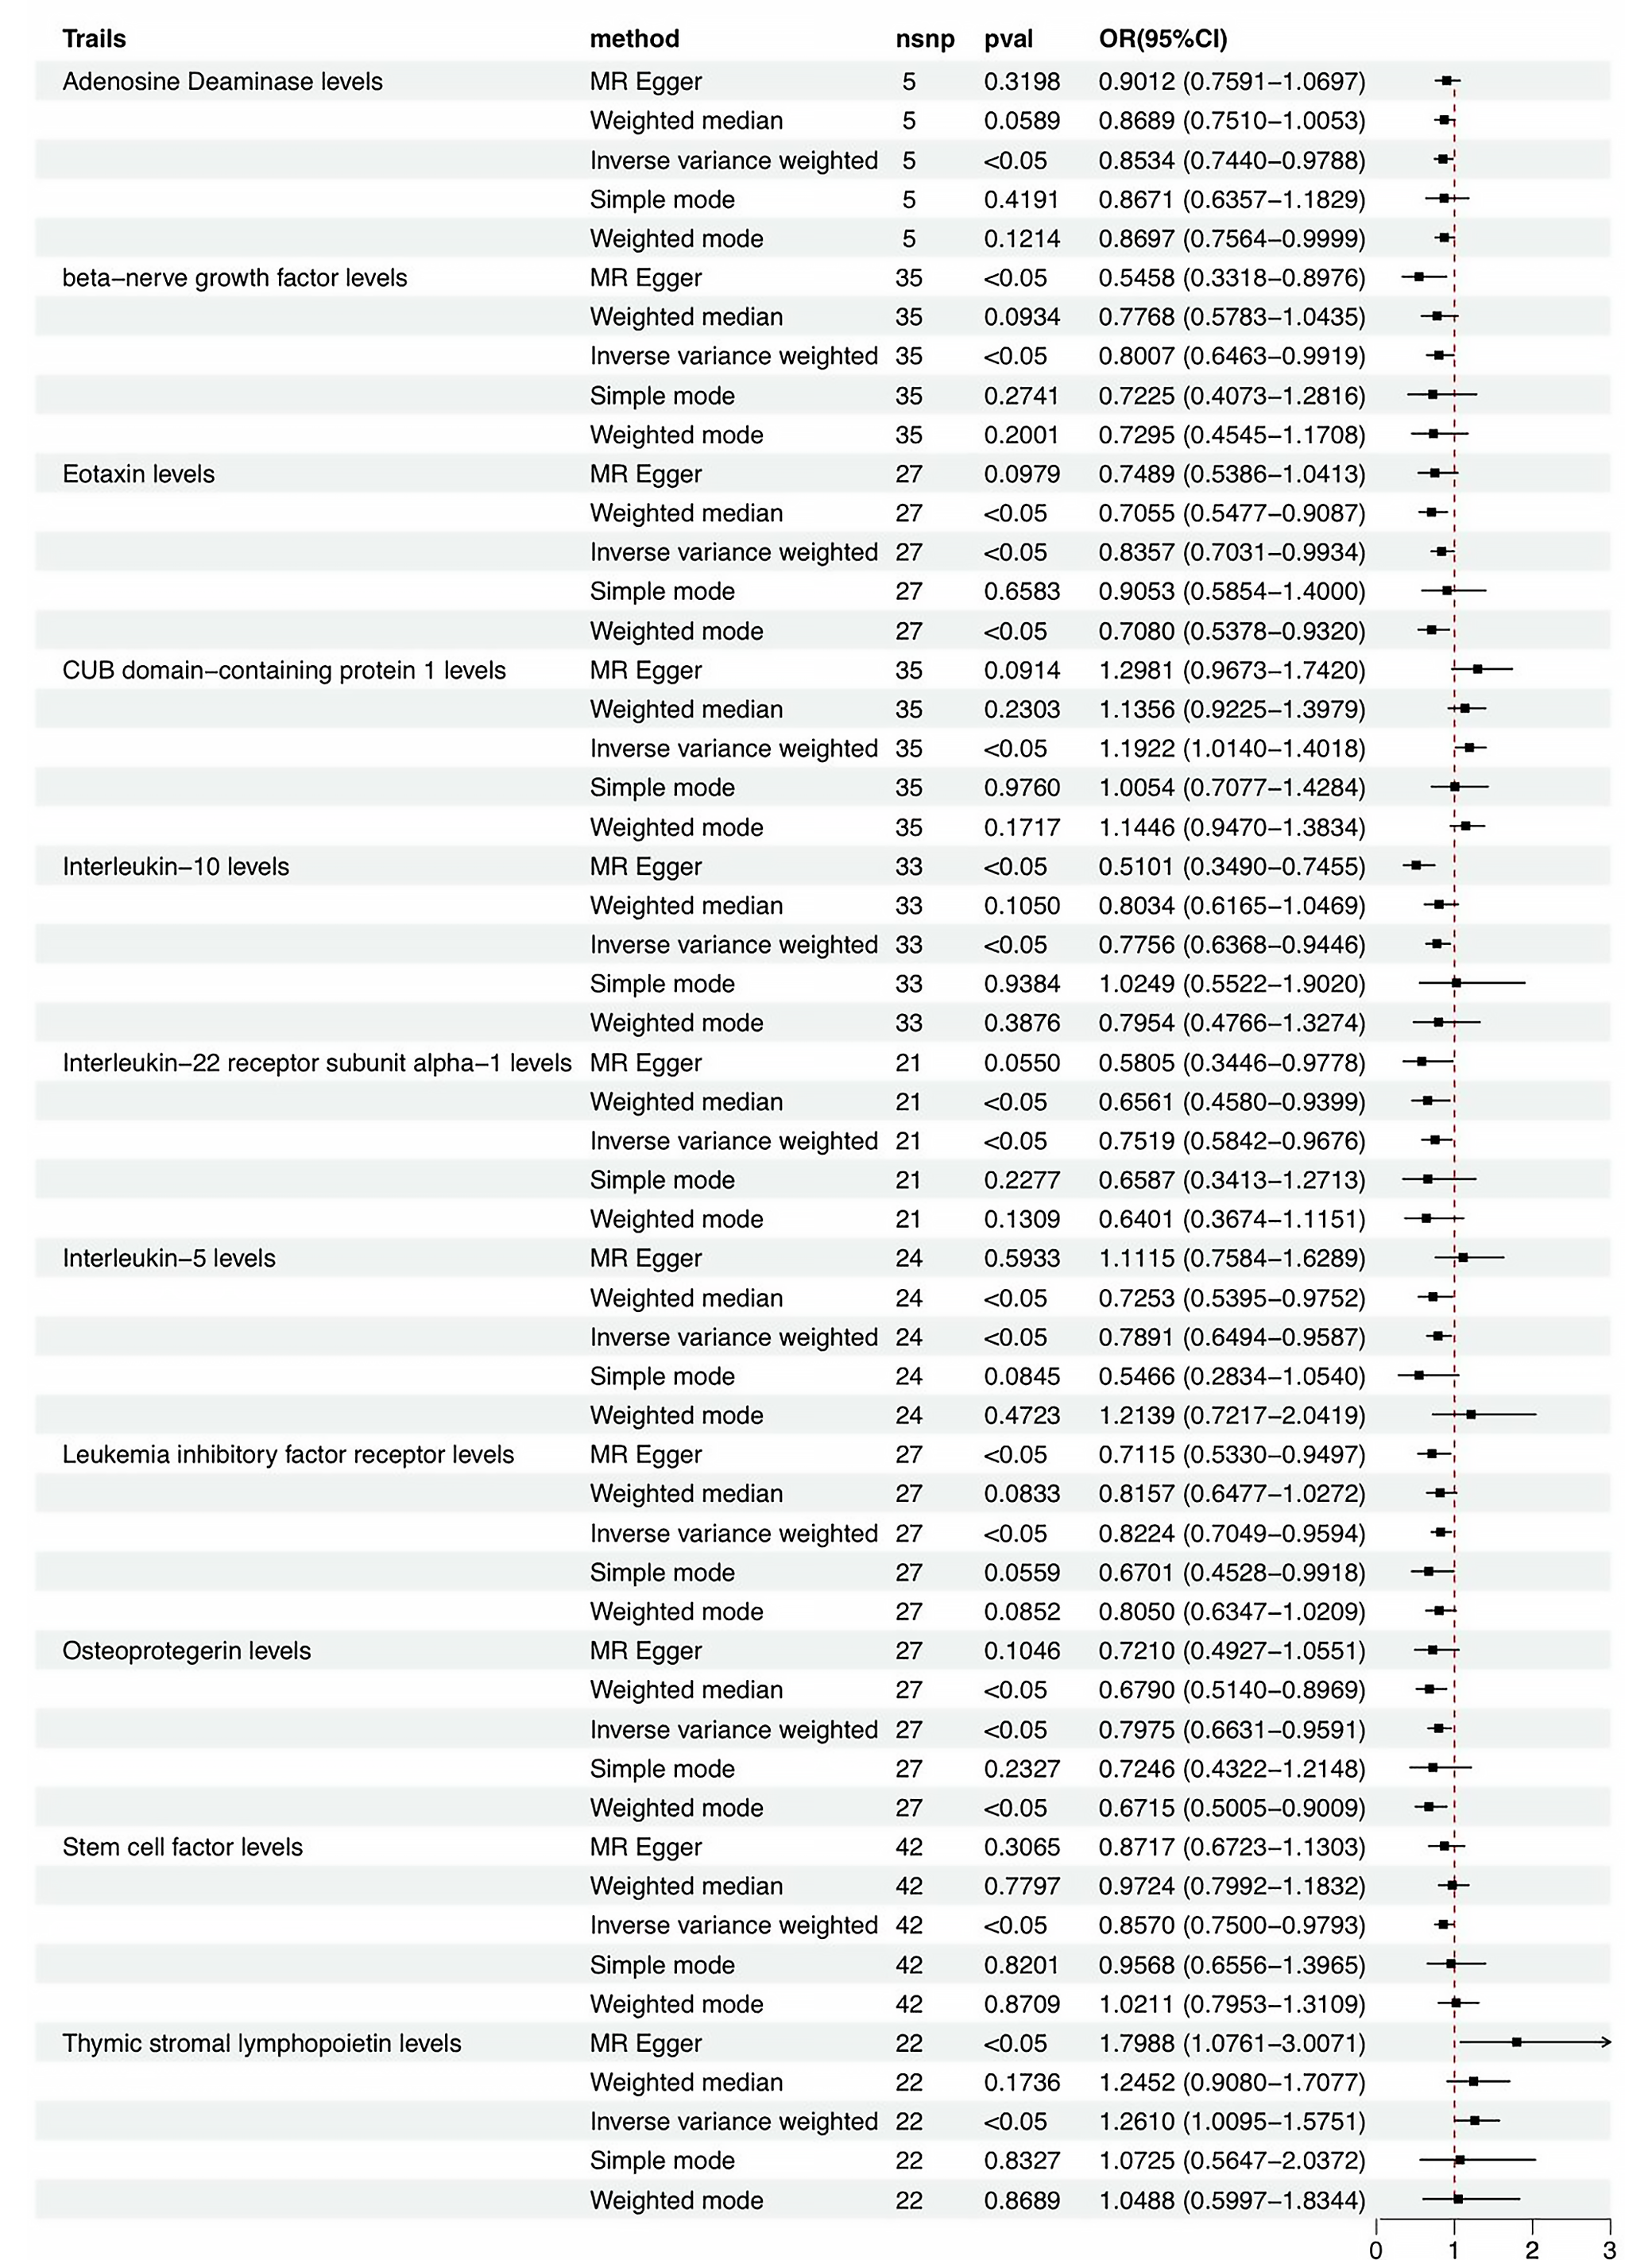
A total of 33,384, 1,397, and 229 SNPs were selected as IVs for 1,400 metabolites, 91 ICs, and osteomyelitis, respectively (Supplementary Tables 1–3). Mendelian randomization analysis revealed significant associations between IC levels and osteomyelitis risk. The primary analysis, conducted using the IVW method (Figure 2), indicated that elevated levels of CDCP1 were associated with an increased risk of osteomyelitis (odds ratio (OR) = 1.19, p < 0.05). Similarly, higher levels of thymic stromal lymphopoietin (TSLP) were associated with increased osteomyelitis risk (OR = 1.26, p < 0.05). Conversely, certain ICs, including adenosine deaminase (ADA) (OR = 0.85, p < 0.05) and IL-5 (OR = 0.79, p < 0.05), showed protective associations with osteomyelitis. These findings highlight the potentially diverse roles of ICs in osteomyelitis pathophysiology and identify promising candidates for further investigation as potential therapeutic targets. MR-PRESSO and MR-Egger analyses were used to assess pleiotropy (Supplementary Table 4). Heterogeneity testing using Cochran’s Q (Supplementary Table 4) yielded p > 0.05 for all 3 cytokines across both IVW and MR-Egger models, indicating low heterogeneity. Leave-one-out analysis (Supplementary Fig. 1,2) demonstrated that no single SNP had a disproportionate impact on the causal estimates, supporting the robustness of the results. Potential horizontal pleiotropy was assessed using MR-PRESSO and, where appropriate, multivariable MR (MVMR) to adjust for correlated exposures.22, 23 We then conducted reverse MR analysis to evaluate the effect of osteomyelitis on these ICs. Mendelian randomization analysis showed that all p-values exceeded 0.05, indicating no significant effect of osteomyelitis on circulating IC levels (Supplementary Table 5). Results of horizontal pleiotropy testing, heterogeneity analysis (Supplementary Table 6), and leave-one-out analyses (Supplementary Fig. 3,4) were consistent with these findings.
Metabolic determinants of osteomyelitis risk: Protective and risk-enhancing metabolites
The results presented in Table 1 highlight significant associations between various metabolites and osteomyelitis risk. Using the IVW method, the analysis identified 54 metabolites with either protective or risk-enhancing associations (Supplementary Table 7). Notably, higher levels of PCS, X-12007 (an uncharacterized plasma metabolite identified in the GWAS Catalog), and homostachydrine were associated with a reduced risk of osteomyelitis, with ORs of 0.744 (p = 0.012), 0.753 (p = 0.007), and 0.773 (p = 0.007), respectively. Conversely, higher beta-cryptoxanthin (β-CX) levels were associated with an increased risk of osteomyelitis (OR = 1.334, p = 0.009). Results from pleiotropy and heterogeneity analyses (Supplementary Table 8) were consistent with these findings. An FDR threshold of q < 0.05 was applied separately for each family of tests (cytokines, n = 91; metabolites, n = 1,400; details in Supplementary Table 9).
Mediation roles of ICs on osteomyelitis via metabolites
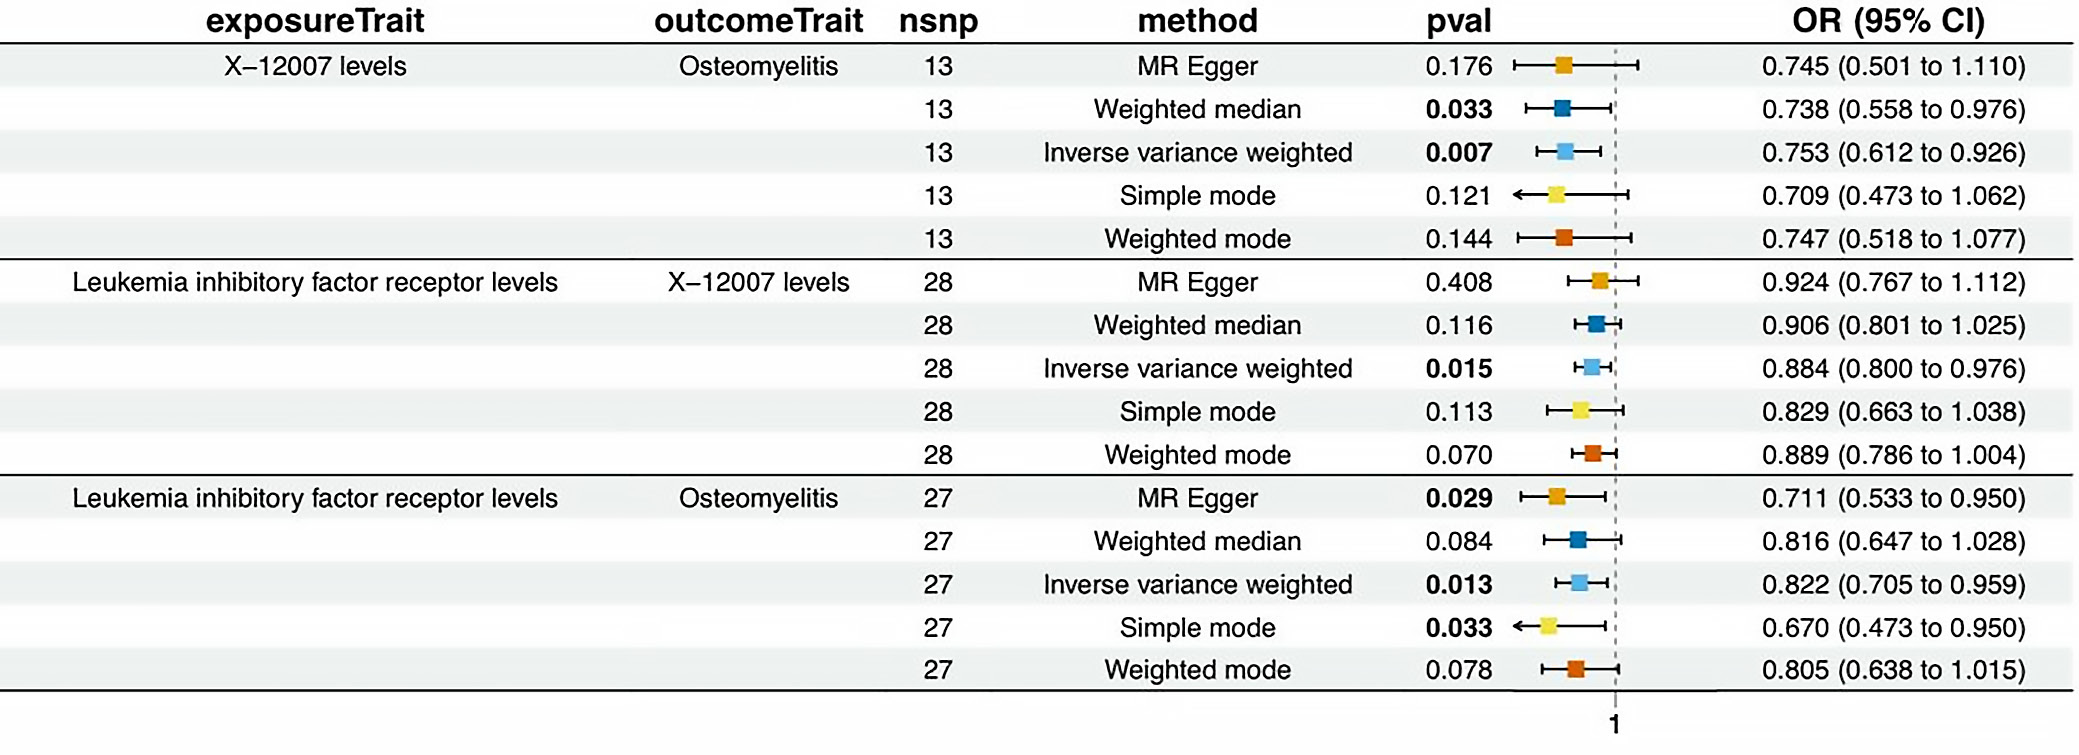
Previously, we identified 11 ICs with a unidirectional effect on osteomyelitis, as well as 54 metabolites associated with osteomyelitis. We next explored the potential causal relationships between these ICs and metabolites (Table 2). The 95% confidence intervals (95% CIs) for the mediated effect and proportion mediated were estimated using the delta method; proportions >100% or <0% may occur when the indirect and total effects have opposite directions. Figure 3 illustrates the associations between various IC levels and metabolites in relation to osteomyelitis risk, as assessed using different MR methods. The IVW method identified significant associations for specific cytokine–metabolite pairs.
Leukemia inhibitory factor receptor (LIFR) was negatively associated with osteomyelitis, and X-12007 was also associated with a reduced osteomyelitis risk. Based on these findings, one might expect a positive association between LIFR and X-12007. However, the observed causal relationship between LIFR and X-12007 was negative. These findings highlight the complex interplay among cytokines, metabolites, and osteomyelitis risk, with some factors showing protective associations while others may increase susceptibility. Sensitivity analyses further supported these results (Supplementary Table 9 and Supplementary Fig. 5,6).
Validation of osteomyelitis in vitro model
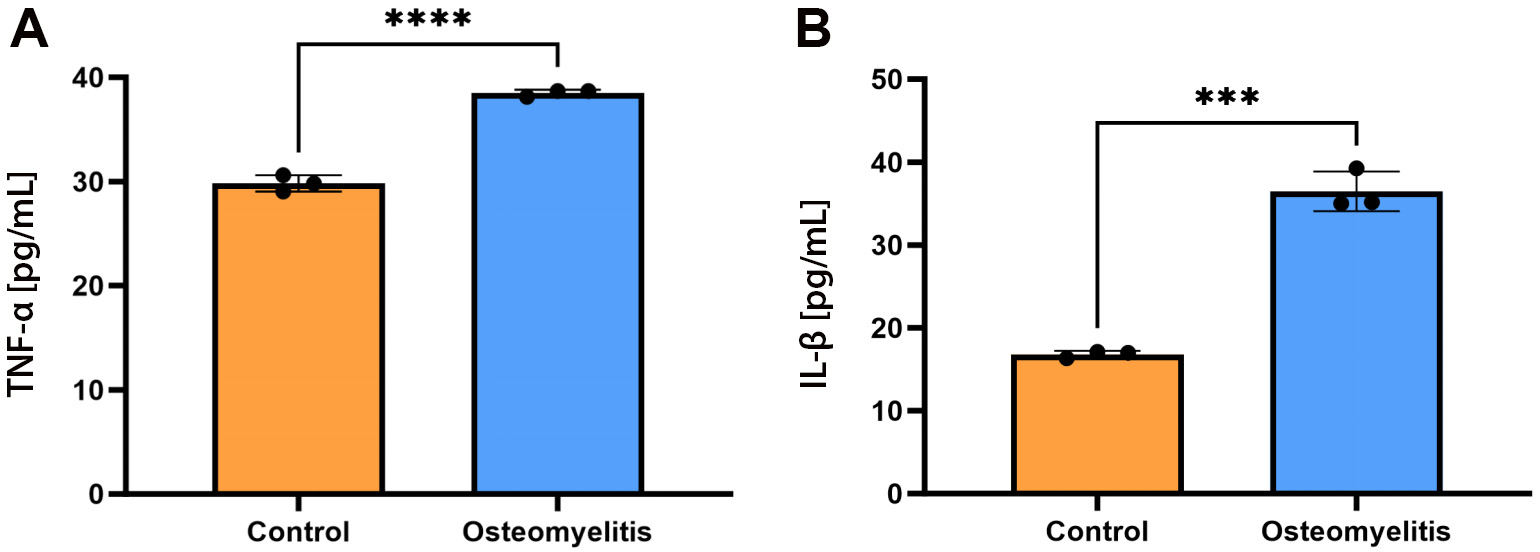
Following establishment of the in vitro osteomyelitis cell model, the expression levels of the inflammatory markers TNF-α and IL-1β in the cell culture supernatant were measured using ELISA (Figure 4A,B). In the osteomyelitis model, both inflammatory cytokines were significantly elevated compared with the control group. TNF-α concentration was 16.81 ±1.31 pg/mL in the control group and 38.50 ±1.42 pg/mL in the osteomyelitis group (mean ±SD, n = 3 biological replicates; mean difference (MD) = 19.66 pg/mL, 95% CI: 15.75–23.57; unpaired 2-tailed t-test, p = 0.001). Interleukin-1 beta showed a similar trend, with concentrations of 29.82 ±1.36 pg/mL in the control group vs 38.50 ±1.28 pg/mL in the osteomyelitis group (MD = 8.68 pg/mL, 95% CI: 7.32–10.04, p ≤ 0.001).
PCS increased the proliferation and osteogenic differentiation of SPA-treated MC3T3-E1 cells
Furthermore, to explore the impact of PCS on the osteogenic differentiation of SPA-treated MC3T3-E1 cells, ALP activity was evaluated on day 7, and ARS staining was performed on day 21. Cells were seeded at 5 × 10⁴ cells per well in 3 independent cultures (n = 3) and treated with 50 µg mL PCS, the concentration chosen from pilot data. Alkaline phosphatase activity reached 110.5 ±2.1% vs 100.0 ±2.3% (mean ±SD, n = 3 biological replicates); MD = 10.5% (95% CI: 4.8–16.3, p = 0.007). Mineralized nodules (ARS) quantified 131.0 ±1.6% vs 100.0 ±1.8%; MD = 31.0% (95% CI: 26.6–35.4, p < 0.001). The findings demonstrated that MC3T3-E1 cells co-cultured with PCS displayed a notable rise in both ALP activity and calcified nodules compared to the control group (Figure 5B,C).
PCS decreased the intracellular ROS production and protein levels of inflammatory cytokines in SPA-treated MC3T3-E1 cells
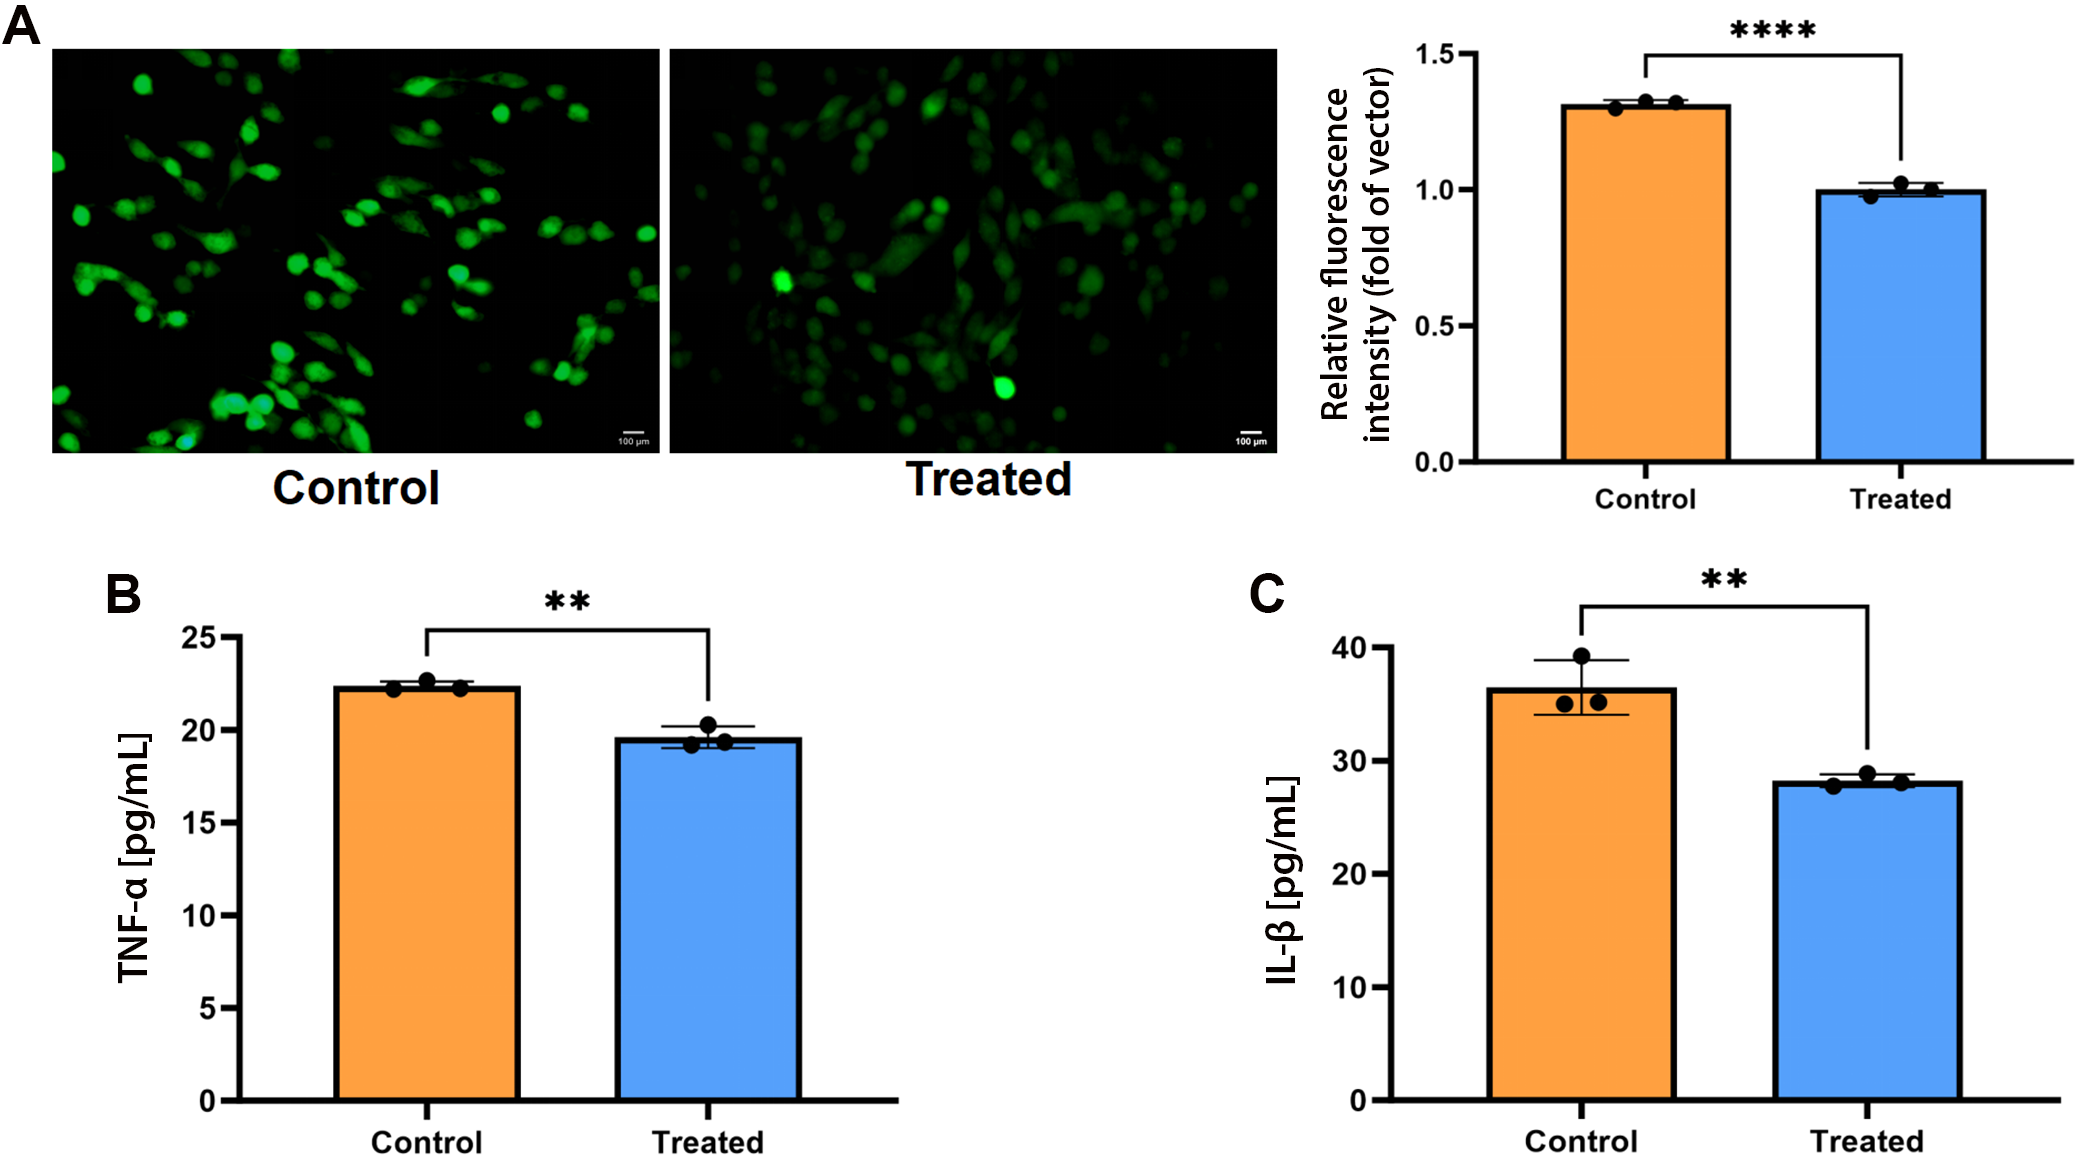
The reduction effect of PCS on ROS was assessed by observing the fluorescence intensity of the DCFH-DA probe via fluorescence microscopy (Nikon Eclipse 80i) (Figure 6A). The PCS demonstrated antioxidant properties, significantly reducing intracellular ROS in SPA-treated MC3T3-E1 cells. Intracellular ROS was 1.000 ±0.016 a.u. vs 1.315 ±0.018 a.u. in control (mean ±SD, n = 3 biological replicates); MD = −0.315 a.u. (95% CI: −0.360 to −0.269, p < 0.001). Normality and equal variance confirmed (F = 3.04, p = 0.495). The ELISA results showed that PCS co-culture simultaneously reduced both cytokines: TNF-α decreased to 28.23 ±1.39 pg/mL vs 36.48 ±1.23 pg/mL in SPA-only control (mean ±SD, n = 3 biological replicates; MD = −8.25 pg/mL, 95% CI: −12.21 to −4.29, unpaired two-tailed t-test, p = 0.004), while IL-1β fell to 19.60 ±1.21 pg/mL vs 22.36 ±1.18 pg/mL (MD = −2.76 pg/mL, 95% CI: −3.77 to −1.76, p = 0.002). Normality (Shapiro–Wilk) and equal variance (F test) were satisfied for both datasets (TNF-α: F = 18.04, p = 0.105; IL-1β: F = 5.95, p = 0.288). (Figure 6B,C).
Discussion
Previous research has predominantly focused on the role of ICs in other inflammatory conditions, such as rheumatoid arthritis and inflammatory bowel disease (IBD).24 In contrast, this study represents the first systematic evaluation of the causal relationship between ICs and osteomyelitis. The results indicate that CDCP1 and TSLP significantly increase the risk of osteomyelitis, whereas ADA and IL-5 appear to exert protective effects. CDCP1 and TSLP may exacerbate the inflammatory response in osteomyelitis by promoting the activation and proliferation of inflammatory cells. CDCP1 is a transmembrane protein with critical intracellular signaling functions.25 Its detection on extracellular vesicles in prostate cancer suggests that this cell surface protein may serve as a biomarker for malignancy.26 As a ligand for CD6 expressed on T cells, CDCP1 acts as a co-stimulatory receptor within the immunological synapse and has been proposed as a potential molecular target for cancer therapy.27
Although TSLP was originally identified as an initiator of type 2 inflammatory responses, its biological functions extend far beyond this role, with involvement in viral infections, cancer, chronic inflammatory diseases, and lipid metabolism.28, 29
In contrast, ADA and IL-5 appear to play protective roles in osteomyelitis by suppressing inflammatory cell activation and attenuating the inflammatory response. ADA, an RNA-editing enzyme that acts on RNA, restricts the accumulation of endogenous immunostimulatory double-stranded RNA.30 The inflammatory effects of ADA on tissues may vary depending on the time elapsed since injury onset.31
Interleukin-5, a hematopoietic cytokine derived from Th2 cells, plays a critical role in regulating the development and function of basophils and mast cells.32 Recent studies suggest that IL-5 may also hold therapeutic potential in sepsis through its effects on non-eosinophilic myeloid cell populations.33 Ongoing and future clinical trials are expected to further enhance our understanding of its role in the pathogenesis of allergic and eosinophilic inflammatory diseases.34
Additionally, this study found that β-CX increases the risk of osteomyelitis, whereas PCS appears to exert protective effects. Residual pleiotropy cannot be entirely excluded, and the restriction of the study population to individuals of European ancestry limits the generalizability of these findings to other populations. Compared with the MR analysis by Yang et al.,35 our study expands the metabolic landscape to include more than 1,400 metabolites and provides additional functional validation. As a carotenoid, β-CX is generally recognized for its anti-inflammatory properties, particularly in conditions such as oral ulcers, where it suppresses inflammation-related signaling pathways and cytokine production.36 However, in the context of osteomyelitis, β-CX appears to exhibit pro-inflammatory effects. This apparent discrepancy may be attributable to differences in cellular and tissue microenvironments, as well as the specific signaling pathways involved. For example, β-CX has been shown to enhance nuclear Nrf2 expression and preserve mitochondrial function, thereby mitigating oxidative stress and cellular senescence in renal cells; however, within the bone marrow microenvironment, it may activate distinct molecular pathways that promote inflammation.37
PCS is the principal metabolite of p-cresol, a uremic toxin traditionally associated with toxicity and increased mortality in patients with chronic kidney disease (CKD).38 Previous studies have demonstrated that PCS induces immune activation and cellular inflammatory responses in various cell types, including cultured proximal renal tubular cells, endothelial cells, and macrophages.39
However, the relationship between PCS and its precursor, tyrosine, appears to be complex. Notably, PCS levels are not correlated with tyrosine concentrations, despite evidence that tyrosine can suppress the production of pro-inflammatory ICs.40 Our MR-prioritized identification of PCS is consistent with recent murine metabolomics studies that identified sphingosine and tricarboxylic acid (TCA) cycle intermediates as early indicators of osteomyelitis.41 These findings suggest that the inflammatory effects of PCS may be mediated not by its precursor itself, but rather by downstream metabolic mechanisms. Given this, p-cresol and its metabolites represent promising targets for future mechanistic investigation.42
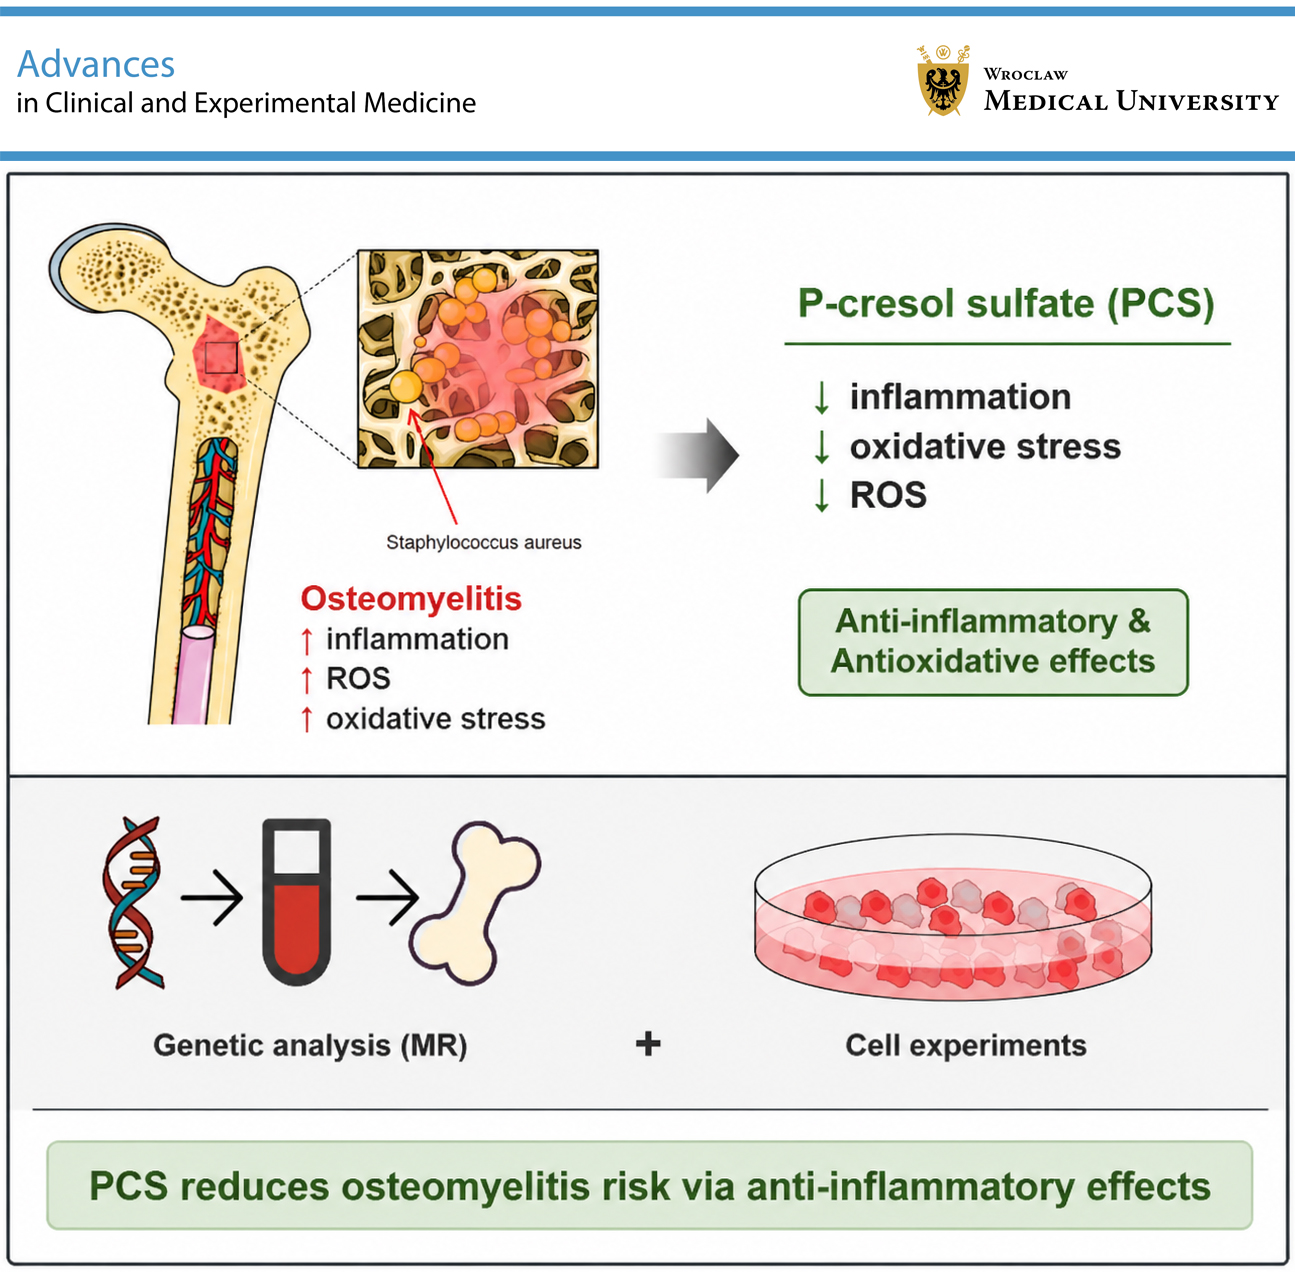
In the context of osteomyelitis, the protective effects of PCS may be attributable to its potential modulation of oxidative stress pathways. Oxidative stress is a critical contributor to the pathogenesis of osteomyelitis, as it can exacerbate inflammation and tissue damage.43 By modulating the cellular oxidative stress response, PCS may help attenuate inflammatory cell activation, thereby reducing disease severity. This hypothesis is supported by studies demonstrating that PCS can influence the expression of antioxidant enzymes, such as superoxide dismutase and catalase, which play key roles in neutralizing ROS.39 Our findings identify PCS as a potential candidate for future mechanistic and interventional studies.
Limitations of the study
This study has several limitations. First, the analysis was restricted to GWAS data derived from individuals of European ancestry, which may limit the generalizability of the findings to other populations. Second, residual pleiotropy and weak instrumental variables could not be entirely excluded. Third, the mediation analyses were based on genetic proxies rather than direct measurements of circulating biomarker levels. Fourth, the in vitro validation was limited to a single murine cell line and short-term experimental readouts. Finally, potential confounding factors, including age, sex, and environmental exposures, could not be accounted for in the summary-level data.
Conclusions
Despite leveraging comprehensive GWAS datasets, our investigation was predominantly limited to populations of European ancestry and lacked critical demographic information, such as age and sex distribution, thereby precluding more refined stratified analyses that might have identified population-specific associations.44 In summary, our MR analysis identified PCS as a potentially protective metabolite against osteomyelitis (OR = 0.74, p = 0.012), a finding further supported by in vitro evidence demonstrating reduced ROS production and lower levels of pro-inflammatory cytokines. Future studies involving diverse ancestral populations and well-controlled experimental models are warranted to validate and further elucidate these findings.
Supplementary data
The supplementary materials are available at https://doi.org/10.5281/zenodo.17622218. The package contains the following files:
Supplementary Table 1. Instrumental variables for inflammatory cytokines.
Supplementary Table 2. SNPs used as instruments.
Supplementary Table 3. Instrumental variables for osteomyelitis.
Supplementary Table 4. Heterogeneity and pleiotropy tests for total effects (beta.all).
Supplementary Table 5. All odds ratios for nonsignificant cytokines (all_OR_NO10).
Supplementary Table 6. Heterogeneity and pleiotropy tests for reverse MR analysis.
Supplementary Table 7. IVW filtered results (IVW.filter).
Supplementary Table 8. Heterogeneity and pleiotropy tests for beta2 (metabolite→outcome).
Supplementary Table 9. Heterogeneity and pleiotropy tests for beta1 (cytokine→metabolite).
Data Availability Statement
The datasets supporting the findings of this study are available in 2 ways:
1. Publicly available GWAS summary statistics used as exposure and outcome were accessed from FinnGen R10 (https://storage.googleapis.com/finngen-public-data-r10/summary_stats/finngen_R10_M13_OSTEOMYELITIS.gz) and GWAS Catalog (GCST90274758–GCST90274848 for inflammatory proteins; GCST90199621–GCST90201020 for metabolites).
2. All raw and processed data are openly available in Zenodo at https://doi.org/10.5281/zenodo.17622259.
Consent for publication
Not applicable.
Use of AI and AI-assisted technologies
Not applicable.