Abstract
Background. Lung adenocarcinoma (LUAD) ranks among the deadliest malignancies worldwide. The endoplasmic reticulum (ER) stress response plays a critical role in the pathogenesis of various cancers, and long non-coding RNAs (lncRNAs) are known for their regulatory roles in gene expression and disease progression.
Objectives. To construct and validate a prognostic model based on ER stress-related lncRNAs in LUAD.
Materials and methods. The Cancer Genome Atlas (TCGA) and Genotype-Tissue Expression (GTEx) databases were used. Utilizing the Molecular Signatures Database (MSigDB), we identified ER stress-related mRNAs and lncRNAs. Weighted gene co-expression network analysis (WGCNA) was employed to identify genes associated with LUAD prognosis. An lncRNA-based prognostic risk scoring model was constructed using univariate and least absolute shrinkage and selection operator (LASSO) regression analyses and independently validated. Consensus clustering analysis was applied to define risk subgroups, optimizing the risk scoring system. The model’s performance was evaluated using receiver operating characteristic (ROC) curves and nomograms. Differentially expressed gene (DEG) and enrichment analyses were performed to investigate the biological relevance of the risk score. Additionally, the relationships between risk scores, immune infiltration, and the tumor microenvironment (TME) were explored.
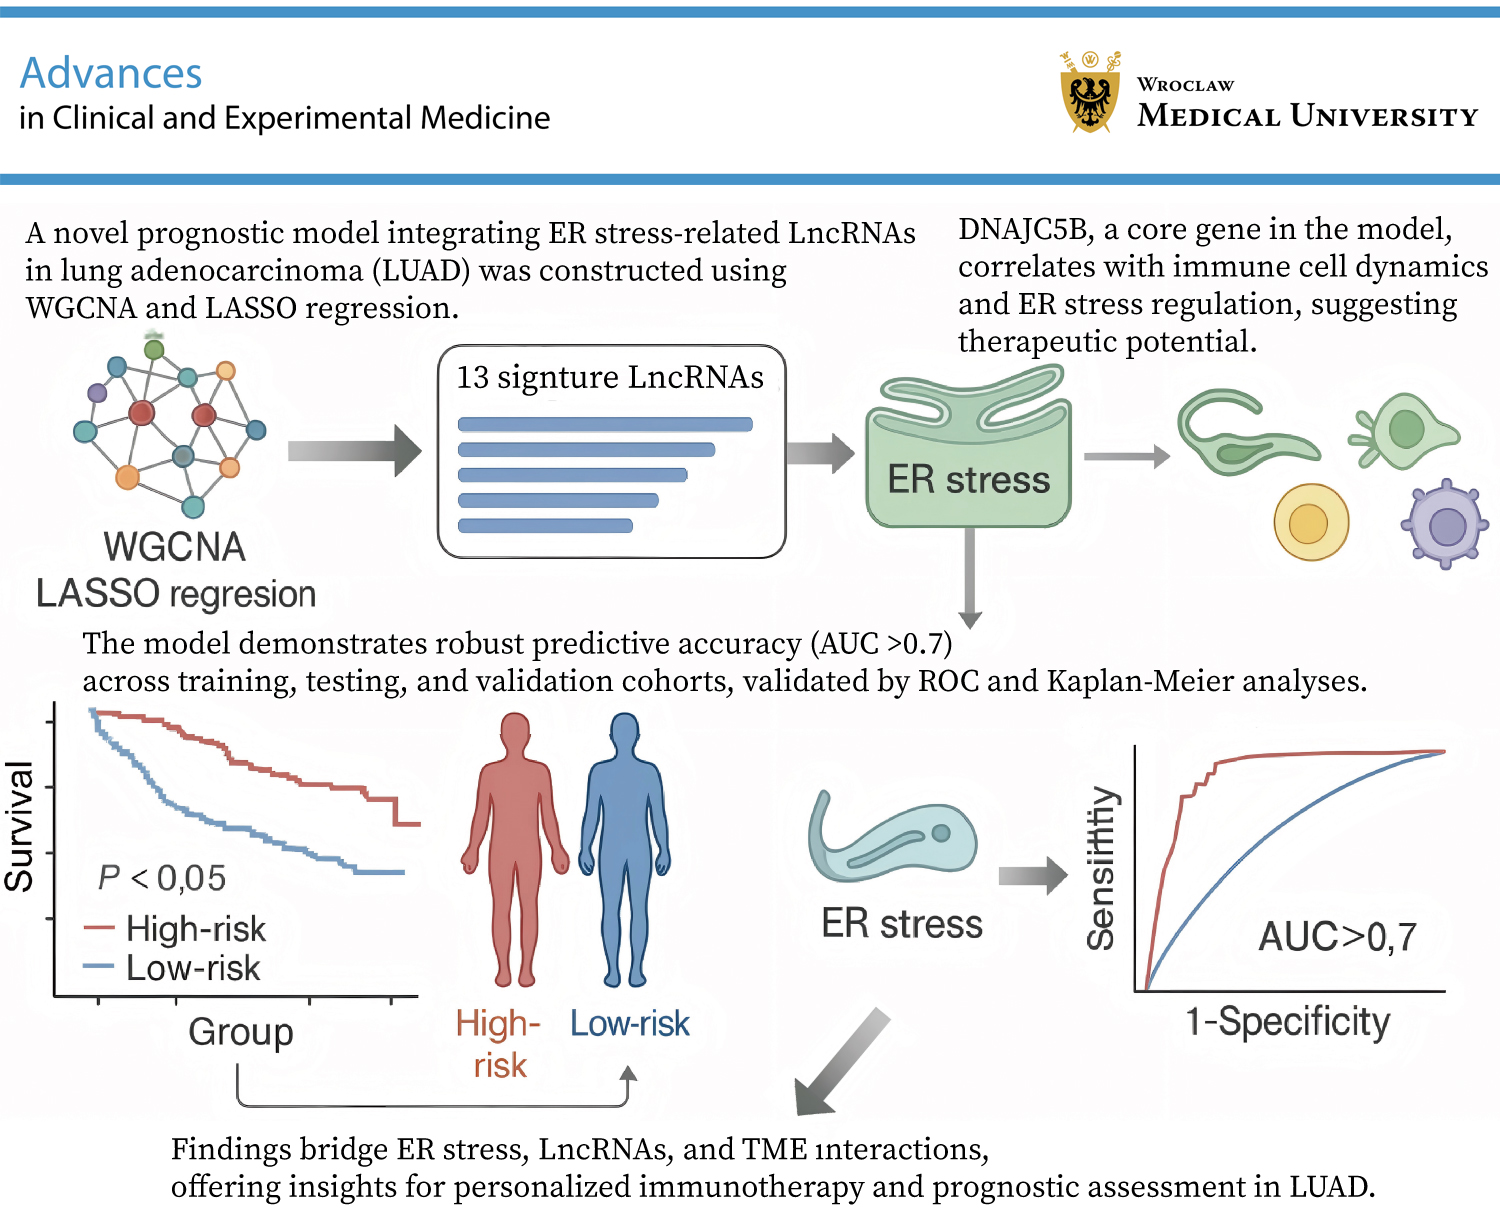
Results. Using WGCNA, we successfully identified genes strongly associated with ER stress in LUAD prognosis. A prognostic model comprising 13 signature genes was developed, demonstrating robust discrimination between high- and low-risk patients, with the high-risk group exhibiting reduced overall survival (OS). The model’s predictive accuracy was confirmed through Kaplan–Meier and ROC analyses. Correlation analysis between risk scores and immune infiltration indicated that the model reflects the immune landscape of LUAD. Subgroup analysis using consensus clustering (C1 and C2) revealed more pronounced differences in immune cell dynamics than the binary risk score classification alone.
Conclusions. This study introduces a novel prognostic model based on the co-expression of ER stress-related lncRNAs in LUAD.
Key words: lung adenocarcinoma, immune infiltration, prognostic model, endoplasmic reticulum stress, long non-coding RNAs
Background
Lung adenocarcinoma (LUAD), the most common histological subtype of non-small cell lung cancer (NSCLC), is one of the most prevalent malignancies worldwide, accounting for approx. 40% of all lung cancer cases.1, 2, 3 According to the World Health Organization (WHO), lung cancer remains the leading cause of cancer-related mortality globally, with adenocarcinoma representing a substantial proportion of these cases.3 Lung adenocarcinoma is characterized by marked molecular heterogeneity and biological complexity, which contribute to its poor prognosis, particularly in patients diagnosed at advanced stages. The 5-year survival rate for LUAD remains low, often below 20%, highlighting the urgent need for improved diagnostic and therapeutic strategies. Therefore, a deeper understanding of the molecular mechanisms underlying LUAD and the identification of reliable biomarkers for early detection, targeted intervention, and personalized management are of critical importance.4
The endoplasmic reticulum (ER) is a critical intracellular organelle responsible for maintaining protein homeostasis through the regulation of protein synthesis, folding, and transport.5, 6 Endoplasmic reticulum stress occurs when ER protein-folding capacity is disrupted, resulting in the accumulation of misfolded proteins. This stress response activates a series of signaling pathways, including the unfolded protein response (UPR), which aims to restore cellular homeostasis.7 In the context of LUAD, ER stress has been shown to be closely associated with malignant cellular behaviors, including invasion, metastasis, and resistance to anticancer therapies.8, 9, 10 For example, studies have demonstrated that ER stress can promote epithelial–mesenchymal transition (EMT) in LUAD cells, thereby enhancing their invasive and metastatic potential. Additionally, ER stress has been implicated in the development of therapeutic resistance, representing a major challenge in cancer treatment. Therefore, targeting ER stress has emerged as a promising therapeutic strategy for LUAD.11
Long non-coding RNAs (lncRNAs) have attracted increasing attention in recent years due to their critical roles in diverse biological processes, including cellular differentiation, development, and gene expression regulation.12 In LUAD, dysregulated lncRNA expression has been closely associated with tumor progression, metastasis, and patient prognosis.13, 14, 15, 16 For example, specific lncRNAs have been identified as potential oncogenes or tumor suppressors in LUAD, influencing cell proliferation, apoptosis, and migration. Moreover, lncRNAs can interact with ER stress-related signaling pathways, thereby modulating the biological behavior of tumor cells.17 This crosstalk between lncRNAs and ER stress pathways suggests that ER stress-related lncRNAs may serve not only as promising biomarkers for LUAD but also as potential therapeutic targets.
Recent advances in molecular biology have revealed that the interplay between ER stress and lncRNAs is more complex than previously recognized. For example, the lncRNA HOTAIR has been reported to interact with ER stress-related pathways, promoting tumor progression in LUAD through modulation of key genes involved in the UPR.18 Similarly, the lncRNA MALAT1 has been implicated in enhancing the metastatic potential of LUAD cells by stabilizing ER stress-related transcripts.19 These findings further underscore the potential of lncRNAs as both prognostic biomarkers and therapeutic targets in LUAD.
Furthermore, the tumor microenvironment (TME) plays a critical role in the progression of LUAD and in determining treatment response. Endoplasmic reticulum stress has been shown to modulate the TME by influencing the recruitment, activation, and function of immune cells, including macrophages and T lymphocytes.20 This interaction between ER stress and the TME further complicates the therapeutic landscape of LUAD and highlights the need for a comprehensive understanding of the underlying molecular mechanisms. The complex interplay among ER stress, lncRNAs, and the TME in LUAD underscores the importance of further investigation into their roles in tumor biology. A deeper understanding of these interactions may reveal novel therapeutic targets and contribute to improved clinical outcomes in LUAD.
Objectives
Although previous studies have explored the roles of ER stress and ER stress-related lncRNAs in LUAD, their interactions and specific prognostic applications in LUAD remain unclear. This study aimed to construct an ER stress-related prognostic risk model through comprehensive analysis of gene expression data from LUAD patients, with particular emphasis on lncRNA expression patterns. We anticipate that this study will provide novel insights and potential biomarkers for personalized prognostic assessment and therapeutic decision-making in LUAD.
Material and methods
Data processing
This study utilized data from The Cancer Genome Atlas (TCGA; https://portal.gdc.cancer.gov) and the Genotype-Tissue Expression (GTEx) project (https://gtexportal.org). In addition, single-cell validation analyses were performed using TISCH2 (http://tisch.comp-genomics.org), which includes 17 single-cell sequencing datasets. TISCH2 is a single-cell transcriptomic database focused on the TME, providing detailed cell-type annotations. As LUAD was not available as a specific category in the TISCH2 database, NSCLC was selected as the closest alternative for the initial validation analysis. This approach enabled validation using the available single-cell transcriptomic data relevant to the lung cancer microenvironment.
The TCGA cohort of patients with LUAD included transcriptomic data and detailed clinical information for 600 patients. All patients underwent surgical resection and had relatively complete follow-up data, with a median follow-up duration of 6 years. The patients ranged in age from 30 to 90 years, with a male-to-female ratio of approx. 1.8:1. The pathological stage distribution included 279 patients with stage I disease, 124 with stage II, 100 with stage IIA, 85 with stage III, and 26 with stage IV disease.
Identification of ER stress-related lncRNAs
A keyword search for “endoplasmic reticulum stress” identified 419 ER stress-related genes. Pearson’s correlation analysis was subsequently performed between these ER stress-related genes and 16,876 lncRNAs in the expression matrix, identifying 3,611 lncRNAs significantly associated with ER stress.
Weighted correlation network analysis
Weighted correlation network analysis (WGCNA; v. 1.73) was performed to identify gene modules associated with LUAD prognosis. Selection of an appropriate soft-thresholding power is a critical step in WGCNA, as it directly influences the scale-free topology of the constructed network. To determine the optimal soft threshold, a systematic evaluation of candidate soft-thresholding powers ranging from 1 to 20 was performed. For each candidate value, the scale-free topology fit index (R2) was calculated to assess the degree of conformity between the network connectivity distribution and the ideal scale-free topology. A soft-thresholding power of 16 was selected, at which the scale-free topology fit index reached 0.80, indicating a satisfactory approximation to a scale-free network model. This threshold was chosen based on the balance between module stability, intramodular connectivity, and reduction of background noise, thereby improving the identification of prognostically relevant gene modules in LUAD.
Construction and validation of the prognostic ER stress-related lncRNA risk score
For construction of the prognostic risk model, differential expression analysis between LUAD and control samples was first performed using the limma package (v. 3.50.3; https://bioconductor.org/packages/limma) in R to identify significantly differentially expressed genes (DEGs). Differentially expressed genes were defined using the thresholds of |log2 fold change| >1 and Benjamini–Hochberg adjusted p < 0.05. Subsequently, WGCNA was applied to the gene expression dataset to identify gene modules significantly associated with LUAD prognosis. WGCNA enables the identification of potential disease-related biomarkers by constructing gene co-expression networks and clustering genes with similar expression patterns into biologically relevant modules.
After identifying disease-related gene modules, intersecting analysis was performed between these modules and the previously identified DEGs. This step was used to further refine the candidate gene set by focusing on genes that were both differentially expressed and associated with disease-relevant molecular modules. Subsequently, univariate Cox regression analysis was performed to identify genes significantly associated with patient prognosis among the intersecting genes. Univariate Cox regression is a standard survival analysis method used to evaluate the association between gene expression levels and patient survival outcomes.
To further optimize the prognostic model and reduce the risk of overfitting, least absolute shrinkage and selection operator (LASSO) Cox regression analysis was performed to select prognostically relevant genes and estimate their coefficients. LASSO regression is a regularization-based method suitable for variable selection in high-dimensional datasets. The analysis was conducted using the glmnet package in R (https://CRAN.R-project.org/package=glmnet), and the optimal penalty parameter (λ) was determined through 10-fold cross-validation by minimizing the partial likelihood deviance. This approach improved model robustness and generalizability.
Validation of prognostic model and consensus clustering
Based on gene expression profiles following risk stratification, consensus clustering analysis was performed on the TCGA-LUAD dataset using the ConsensusClusterPlus package (https://www.bioconductor.org/packages/release/bioc/html/ConsensusClusterPlus.html). Principal component analysis (PCA) and t-distributed stochastic neighbor embedding (t-SNE) were used to visualize the distribution of clustered samples. A heatmap was generated to illustrate the distribution of LUAD patients across different clusters, together with survival information and stratification into high- and low-risk groups. A nomogram was constructed to provide a visual representation of the clinical applicability of the prognostic model. In addition, subgroup analyses based on clinical characteristics were performed to evaluate the prognostic value of the risk score and consensus clustering within specific patient subgroups.
Enrichment and TME analysis
Immune cell infiltration in LUAD samples was initially evaluated using the CIBERSORT algorithm (R script v. 1.03) (https://cibersort.stanford.edu) with 1,000 permutations and a significance threshold of p < 0.05, in combination with the IOBR (Immuno-Oncology Biological Research) package (v. 0.99.9; https://CRAN.R-project.org/package=IOBR) in R to estimate the relative abundance of immune cell populations based on RNA transcriptomic data. This approach enabled quantitative assessment of immune cell infiltration across individual samples. For TME analysis, the ESTIMATE algorithm implemented in the IOBR package was used to assess stromal and immune components within the tumor tissue. Default gene signatures were applied for immune and stromal cell estimation, and immune, stromal, and ESTIMATE scores were calculated for each TCGA-LUAD sample. Patients were stratified into high- and low-risk groups, as well as consensus clustering subgroups, using the median risk score as the cutoff. Differences in stromal, immune, and ESTIMATE scores between groups were assessed using the Wilcoxon rank-sum test.
Gene mutation analysis
Somatic mutation data for TCGA-LUAD patients were obtained from the TCGA database. A waterfall plot was generated to visualize the mutation landscape of frequently mutated genes in the high- and low-risk groups. In addition, tumor mutation burden (TMB) was calculated for each TCGA-LUAD patient using the maftools R package (v. 3.21; https://bioconductor.org/packages/release/bioc/html/maftools.html). Tumor mutation burden was defined as the number of somatic mutations per megabase (Mb) of sequenced genomic region and was subsequently used for comparative and correlation analyses.
LncRNA-related target genes
Potential target genes of the model lncRNAs were identified using RNAct (http://rnact.crg.eu) and systematically compiled for downstream analysis. An interaction network was constructed and hub gene analysis was performed using Cytoscape (https://cytoscape.org). Core target genes associated with the model lncRNAs were subsequently subjected to differential expression analysis across risk score groups and consensus clustering subgroups.
Statistical analyses
Statistical analyses and data visualization were performed using R v. 4.1.0 (R Foundation for Statistical Computing, Vienna, Austria). Survival analyses were conducted using the Kaplan–Meier method, and differences between groups were compared using the log-rank test. Associations between risk scores and clinical characteristics were evaluated using Cox proportional hazards regression analysis with the survival package (v. 3.2-11; https://github.com/therneau/survival) in R to assess the independent prognostic value of the risk score. During model construction and validation, the proportional hazards (PH) assumption was assessed for all Cox regression models, including univariable and LASSO Cox regression analyses. The PH assumption was evaluated using the Schoenfeld residuals test, and the results confirmed that the included variables satisfied this assumption (Supplementary Fig. 1).21 Statistical tests were selected according to data distribution and variance characteristics. For comparisons between 2 groups, Student’s t-test was applied when data met assumptions of normality and homogeneity of variance; Welch’s t-test was used when normality was satisfied but variances were unequal; otherwise, the Wilcoxon rank-sum test was applied. A p < 0.05 was considered statistically significant.
Results
Model construction
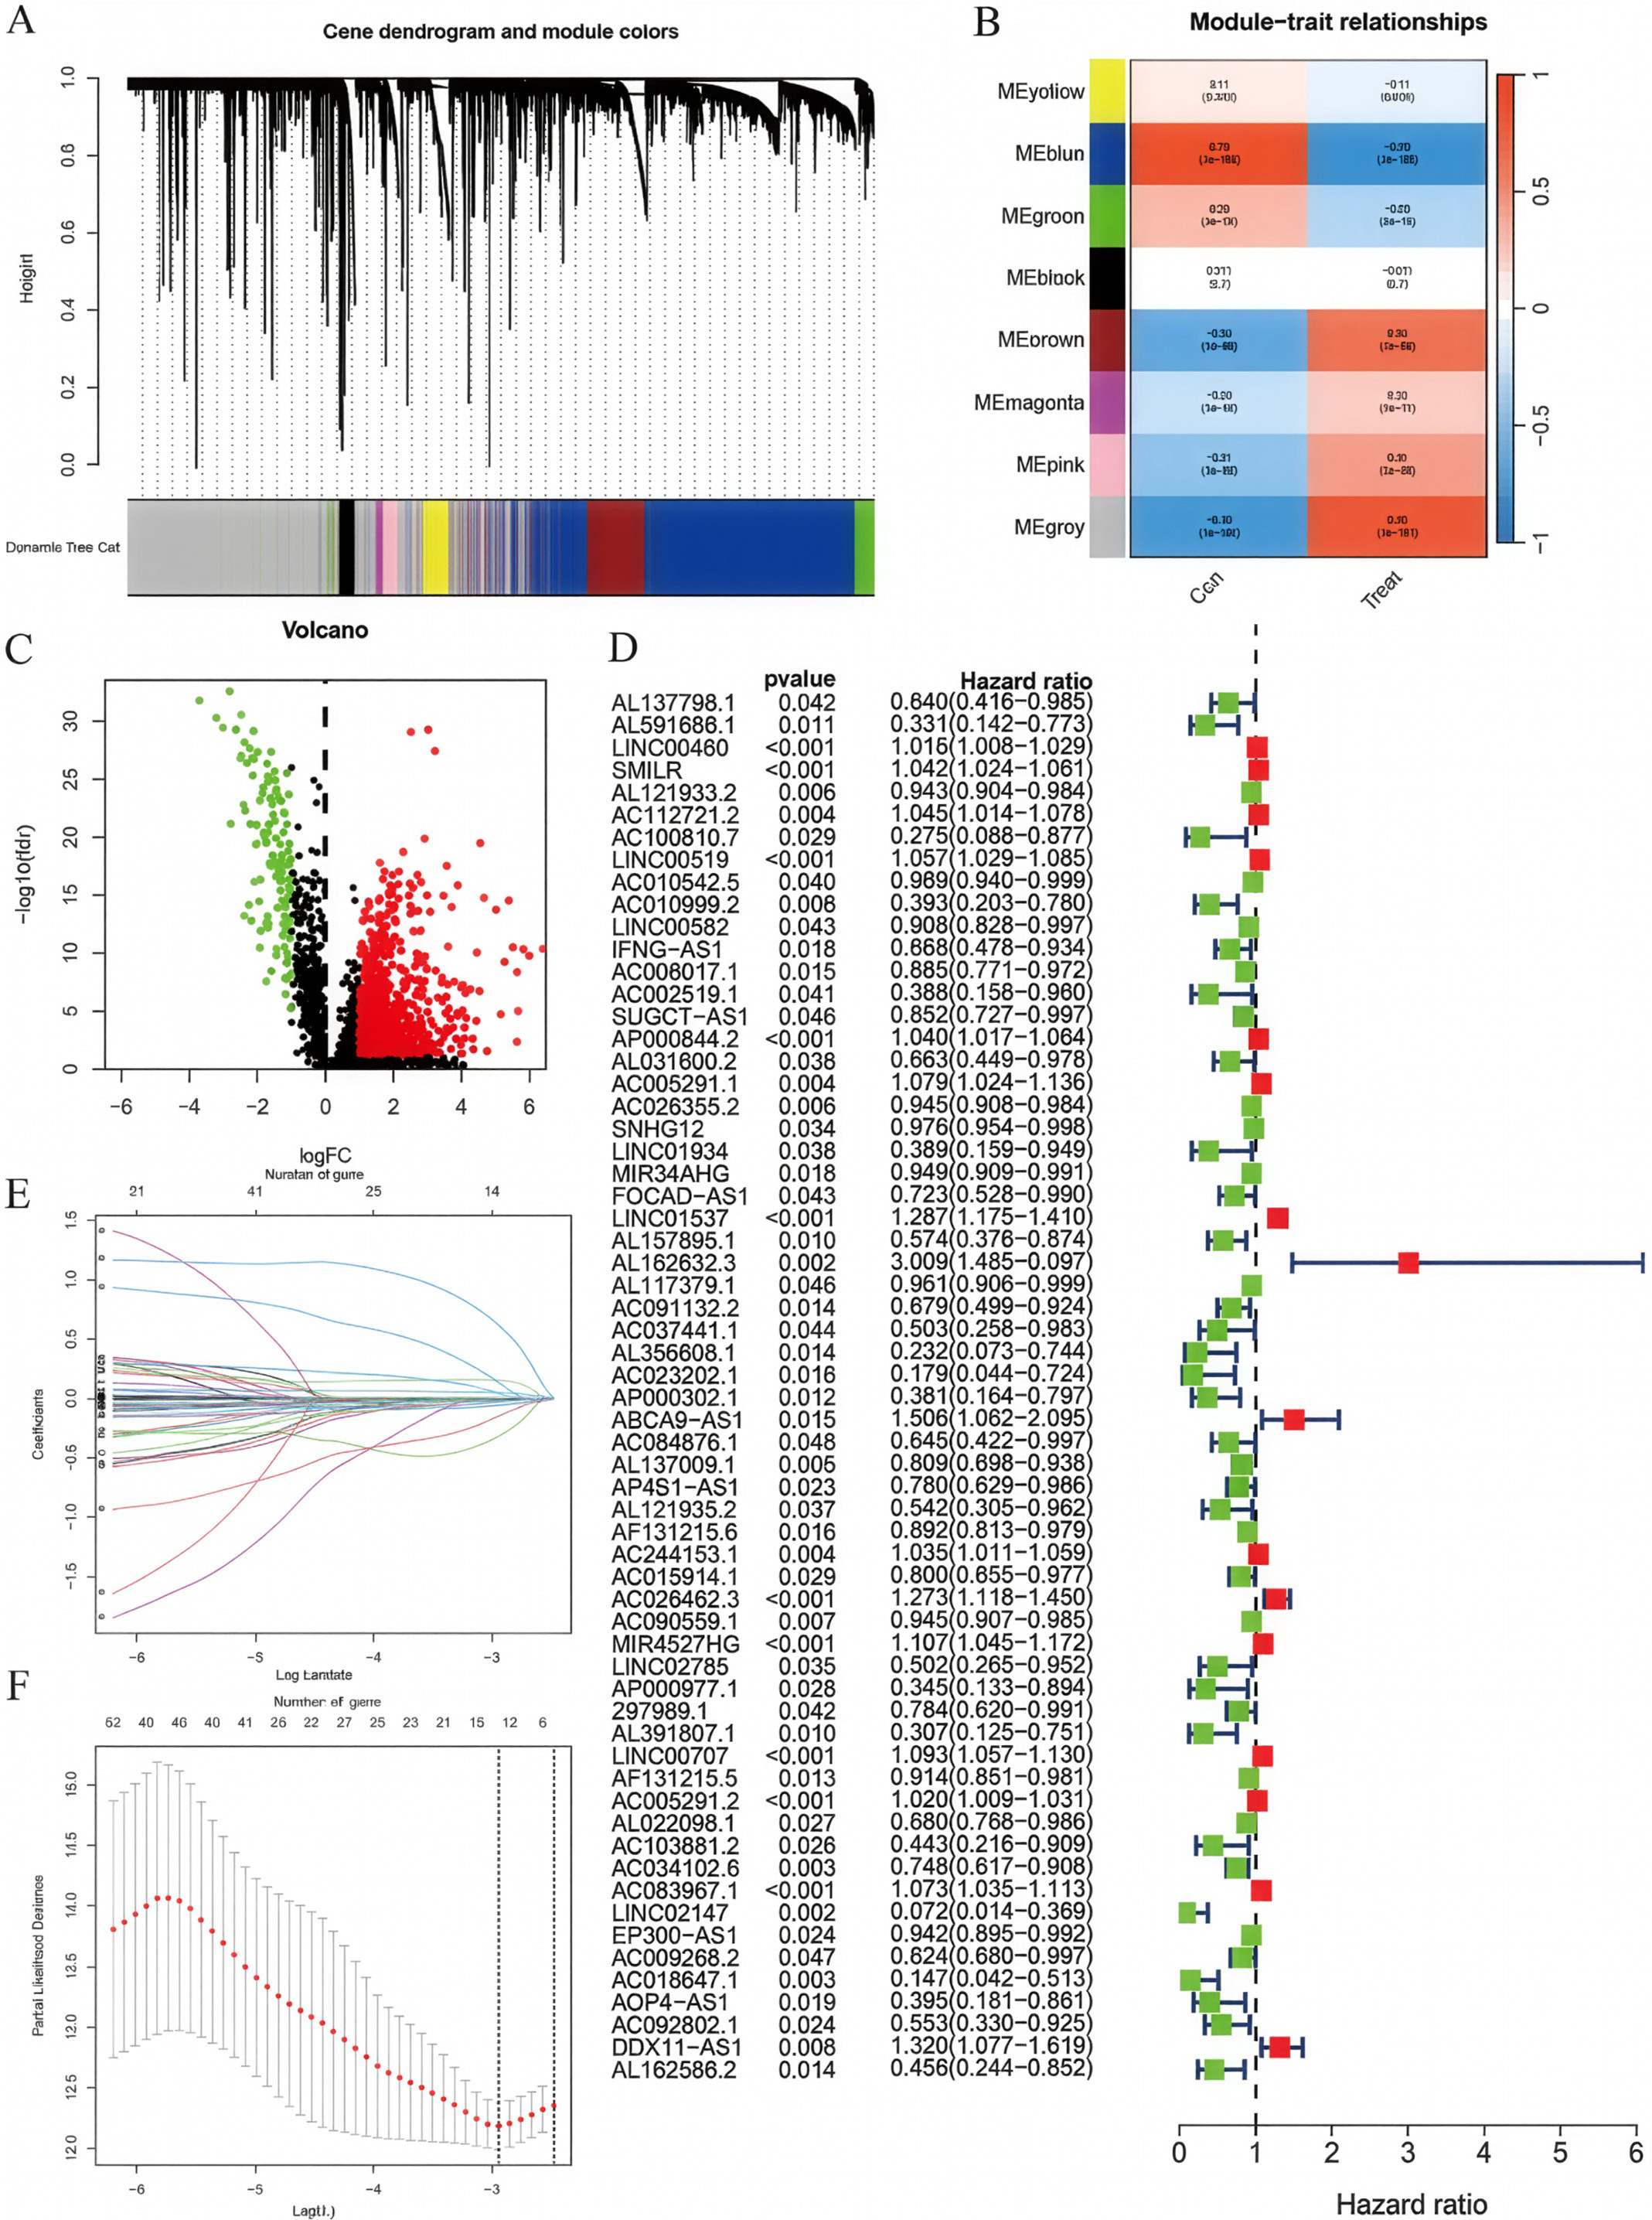
Differential expression analysis and WGCNA were performed on LUAD and normal control samples from the TCGA and GTEx datasets (Figure 1A,B). The intersection between differentially expressed genes and genes from the blue and gray WGCNA modules was selected for univariate Cox regression analysis (Figure 1D), yielding candidate genes for prognostic model construction. Subsequently, LASSO Cox regression analysis was performed to construct the ER stress-related lncRNA prognostic model (Figure 1E,F), with the following risk score formula:
Risk score =
(LINC00460 × 0.0006) + (AC010999.2 × −0.1509) + (AC026355.2 × −0.0104) + (LINC01537 × 0.1545) + (AL162632.3 × 0.6158) + (ABCA9-AS1 × 0.1352) + (AL137009.1 × −0.0158) + (AC026462.3 × 0.0417) + (AC090559.1 × −0.0023) + (LINC00707 × 0.0481) + (AC034102.8 × −0.0575) + (AC018647.1 × −0.3211) + (AC092802.1 × −0.0283).
All lncRNAs included in the final prognostic model satisfied the proportional hazards assumption based on Schoenfeld residual testing.
Consensus clustering
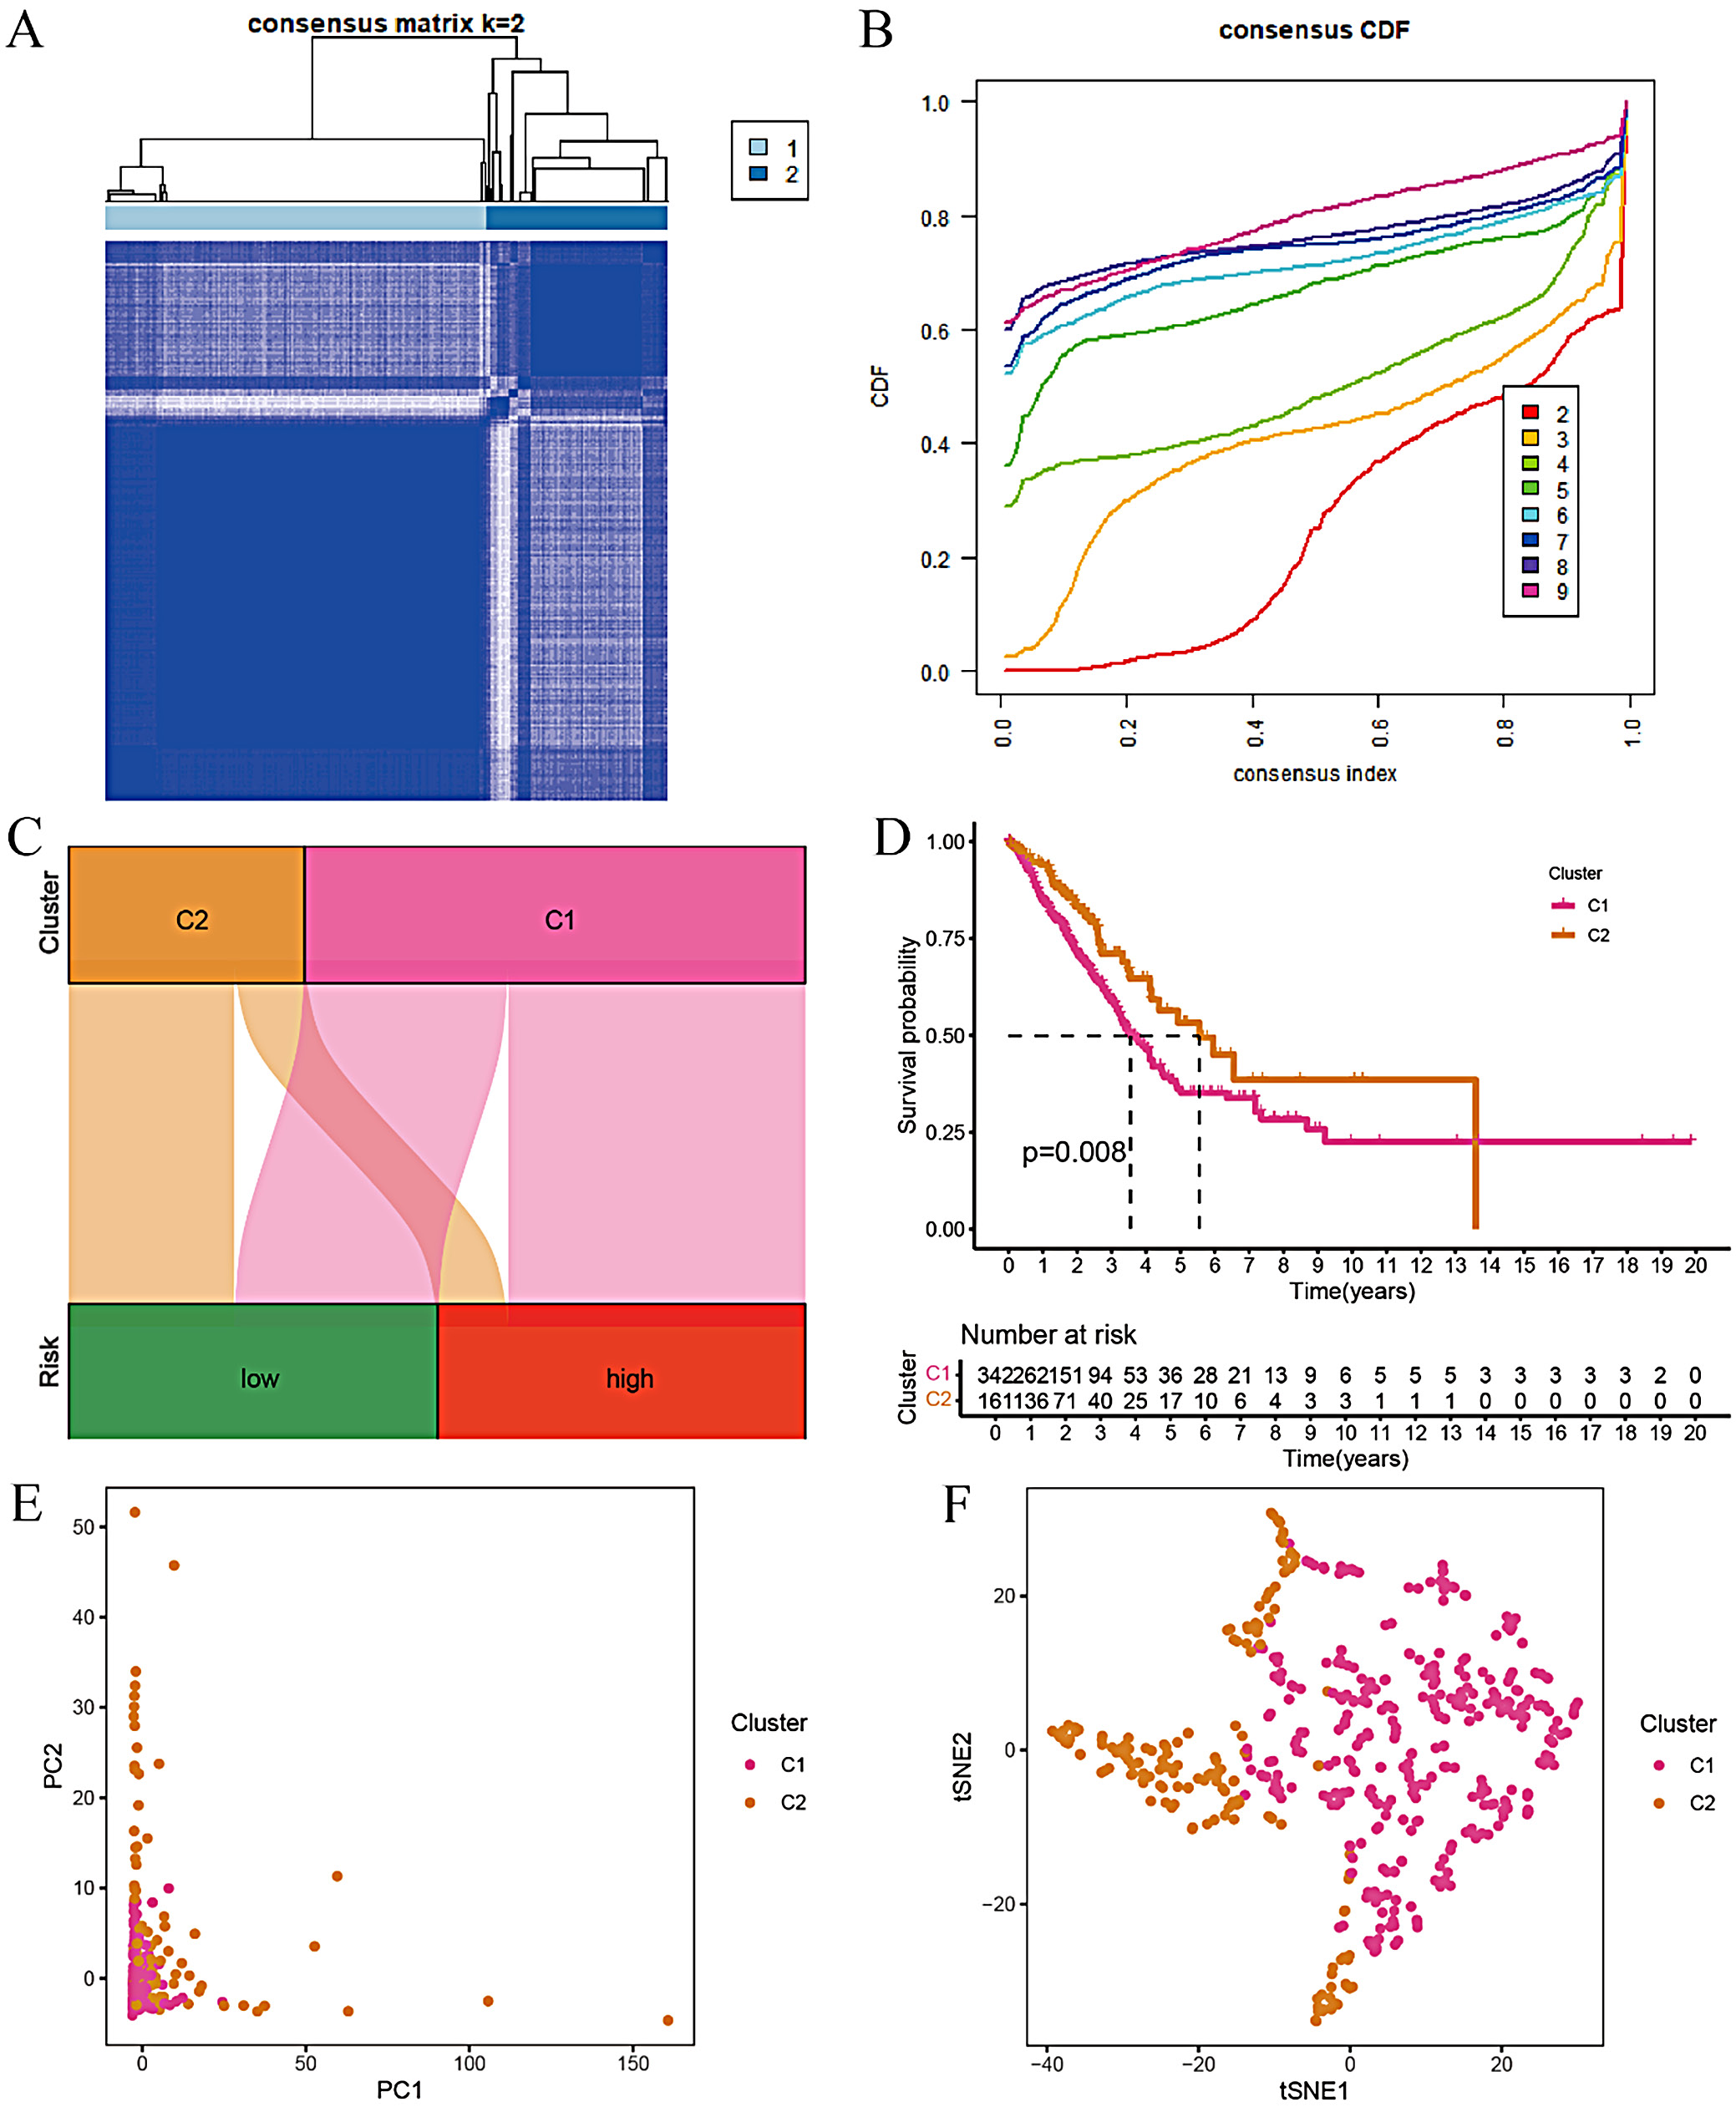
Based on the model genes and risk scores, we conducted consensus clustering analysis on LUAD samples. First, the patients were divided into different clusters (K = 2–9), and the optimal number of clusters was determined to be K = 2 based on the consensus matrix (Figure 2A). The consensus cumulative distribution function (CDF) curve was also plotted (Figure 2B). The analysis showed that patients with LUAD could be divided into 2 risk groups, C1 and C2. The infiltration level of immunosuppressive cells (such as regulatory T cells, myeloid-derived suppressor cells, and tumor-associated macrophages) in the TME of group C1 (high-risk group) was relatively high. These cells can inhibit the antitumor immune response and promote tumor immune escape. Therefore, group C1 may be associated with a poorer survival prognosis. Conversely, the infiltration level of immunosuppressive cells in group C2 (low-risk group) was lower, suggesting that there may be a more active antitumor immune response in the TME. Effector T cells can recognize and attack tumor cells more effectively, thereby inhibiting tumor growth and metastasis. To visually demonstrate the relationship between the risk score and the clustering results, we plotted a Sankey plot (Figure 2C) and verified using the Kaplan–Meier curve that the survival time of patients in group C2 was longer (Figure 2D). Furthermore, the stability and repeatability of the clustering results were confirmed through PCA and t-SNE analysis (Figure 2E,F).
Model validation and comparison
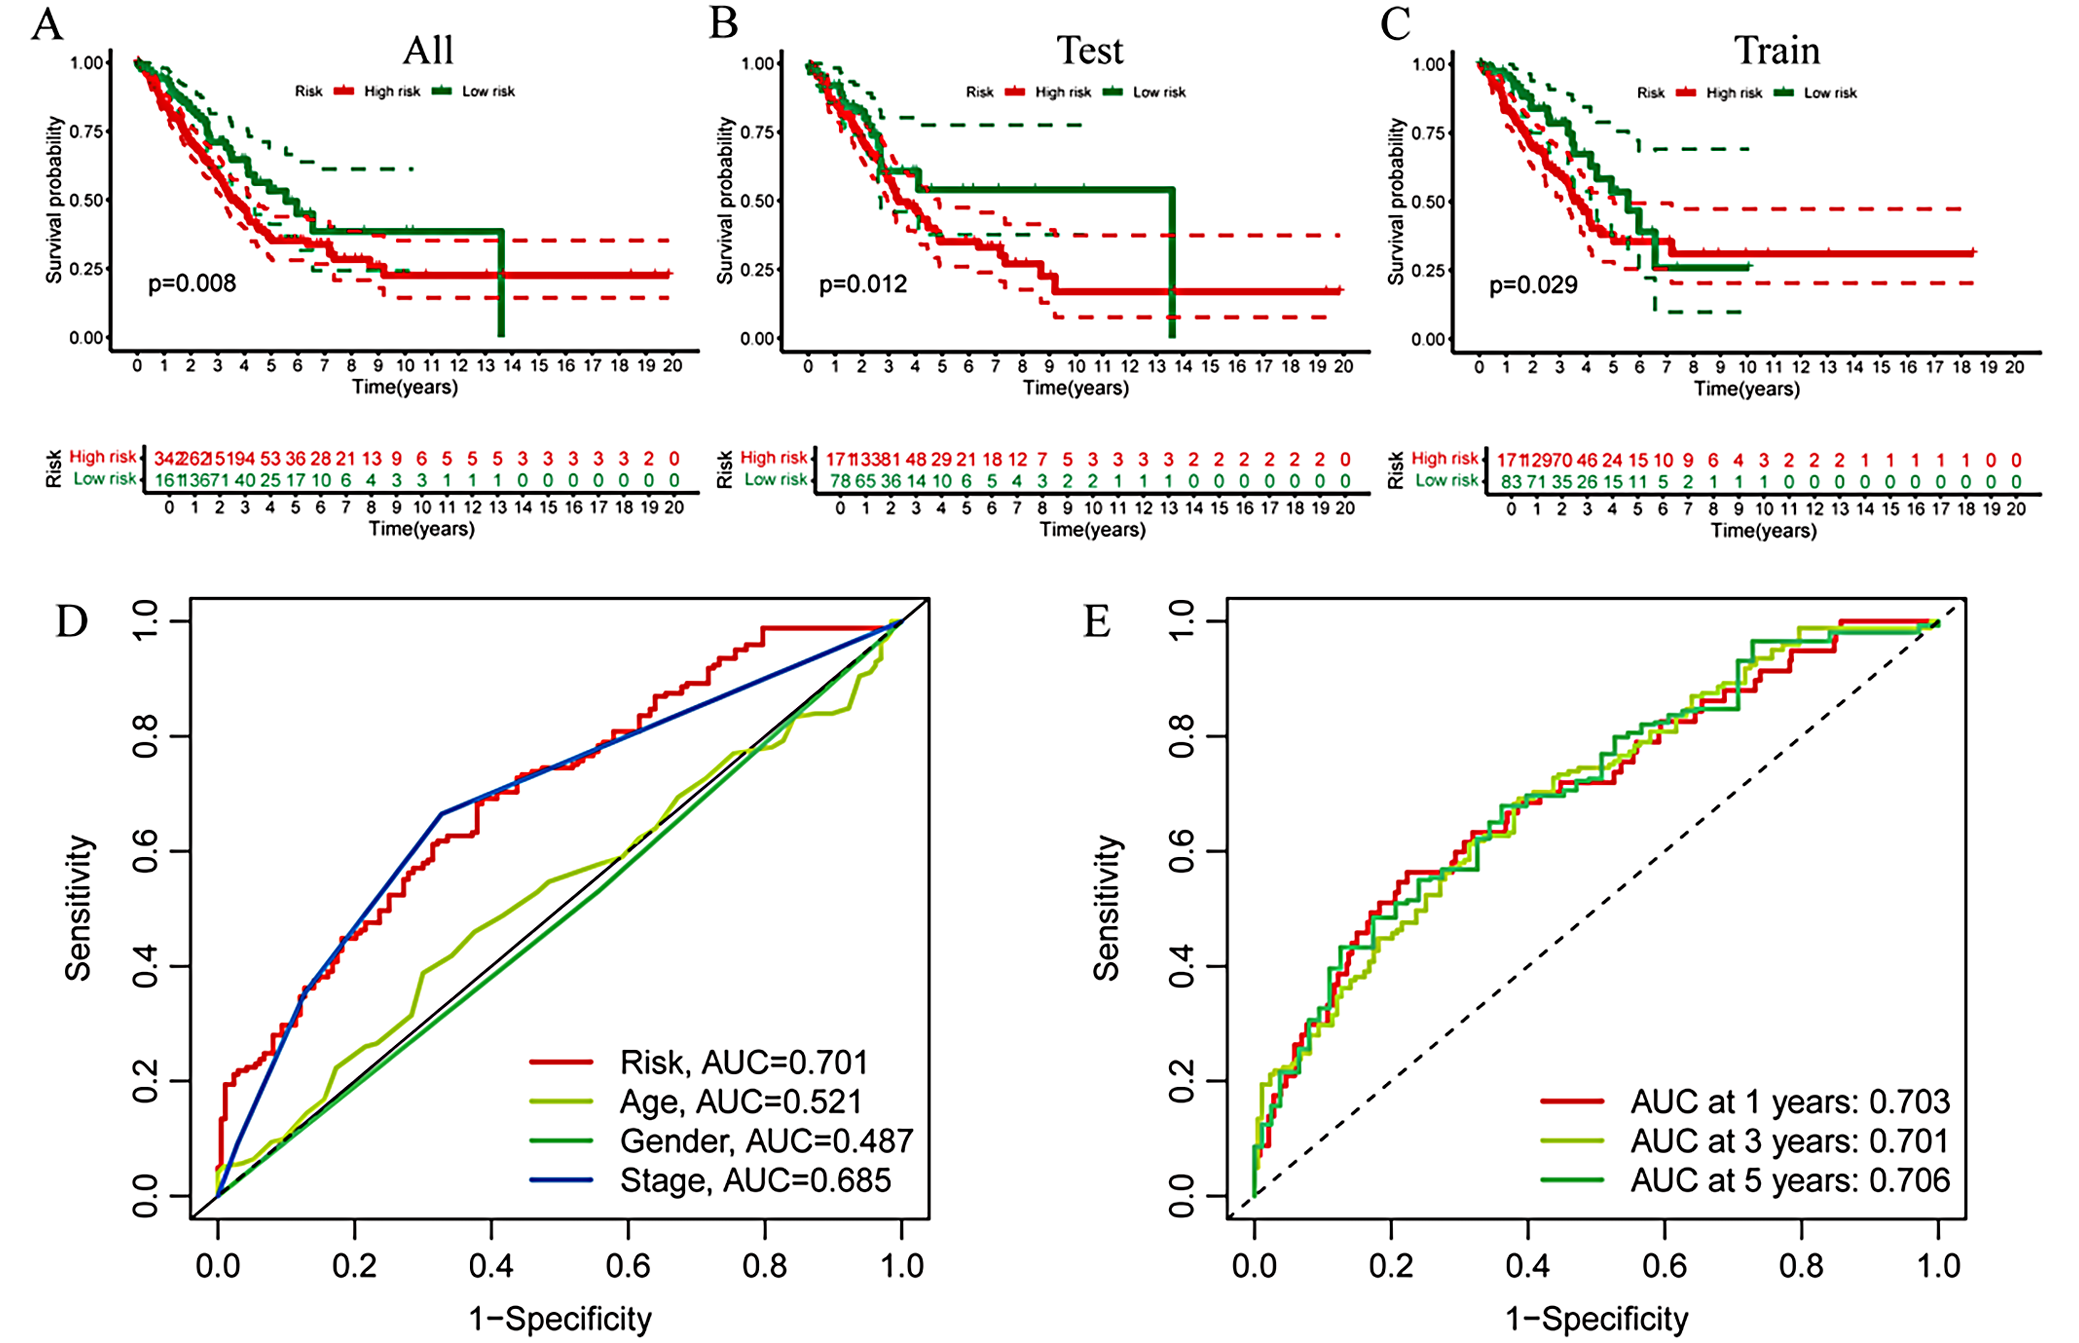
The samples were randomly divided into a test group and a training group. There were survival differences according to risk scores across the entire cohort, the test set, and the training set, with lower scores indicating better survival outcomes (Figure 3A–C). Time-dependent receiver operating characteristic (ROC) analysis demonstrated robust predictive accuracy. The area under the ROC curve (AUC) for the risk scores with clinical relevance, as well as the AUCs at 1, 3, and 4 years, were consistent (Figure 3D,E).
Functional enrichment analysis
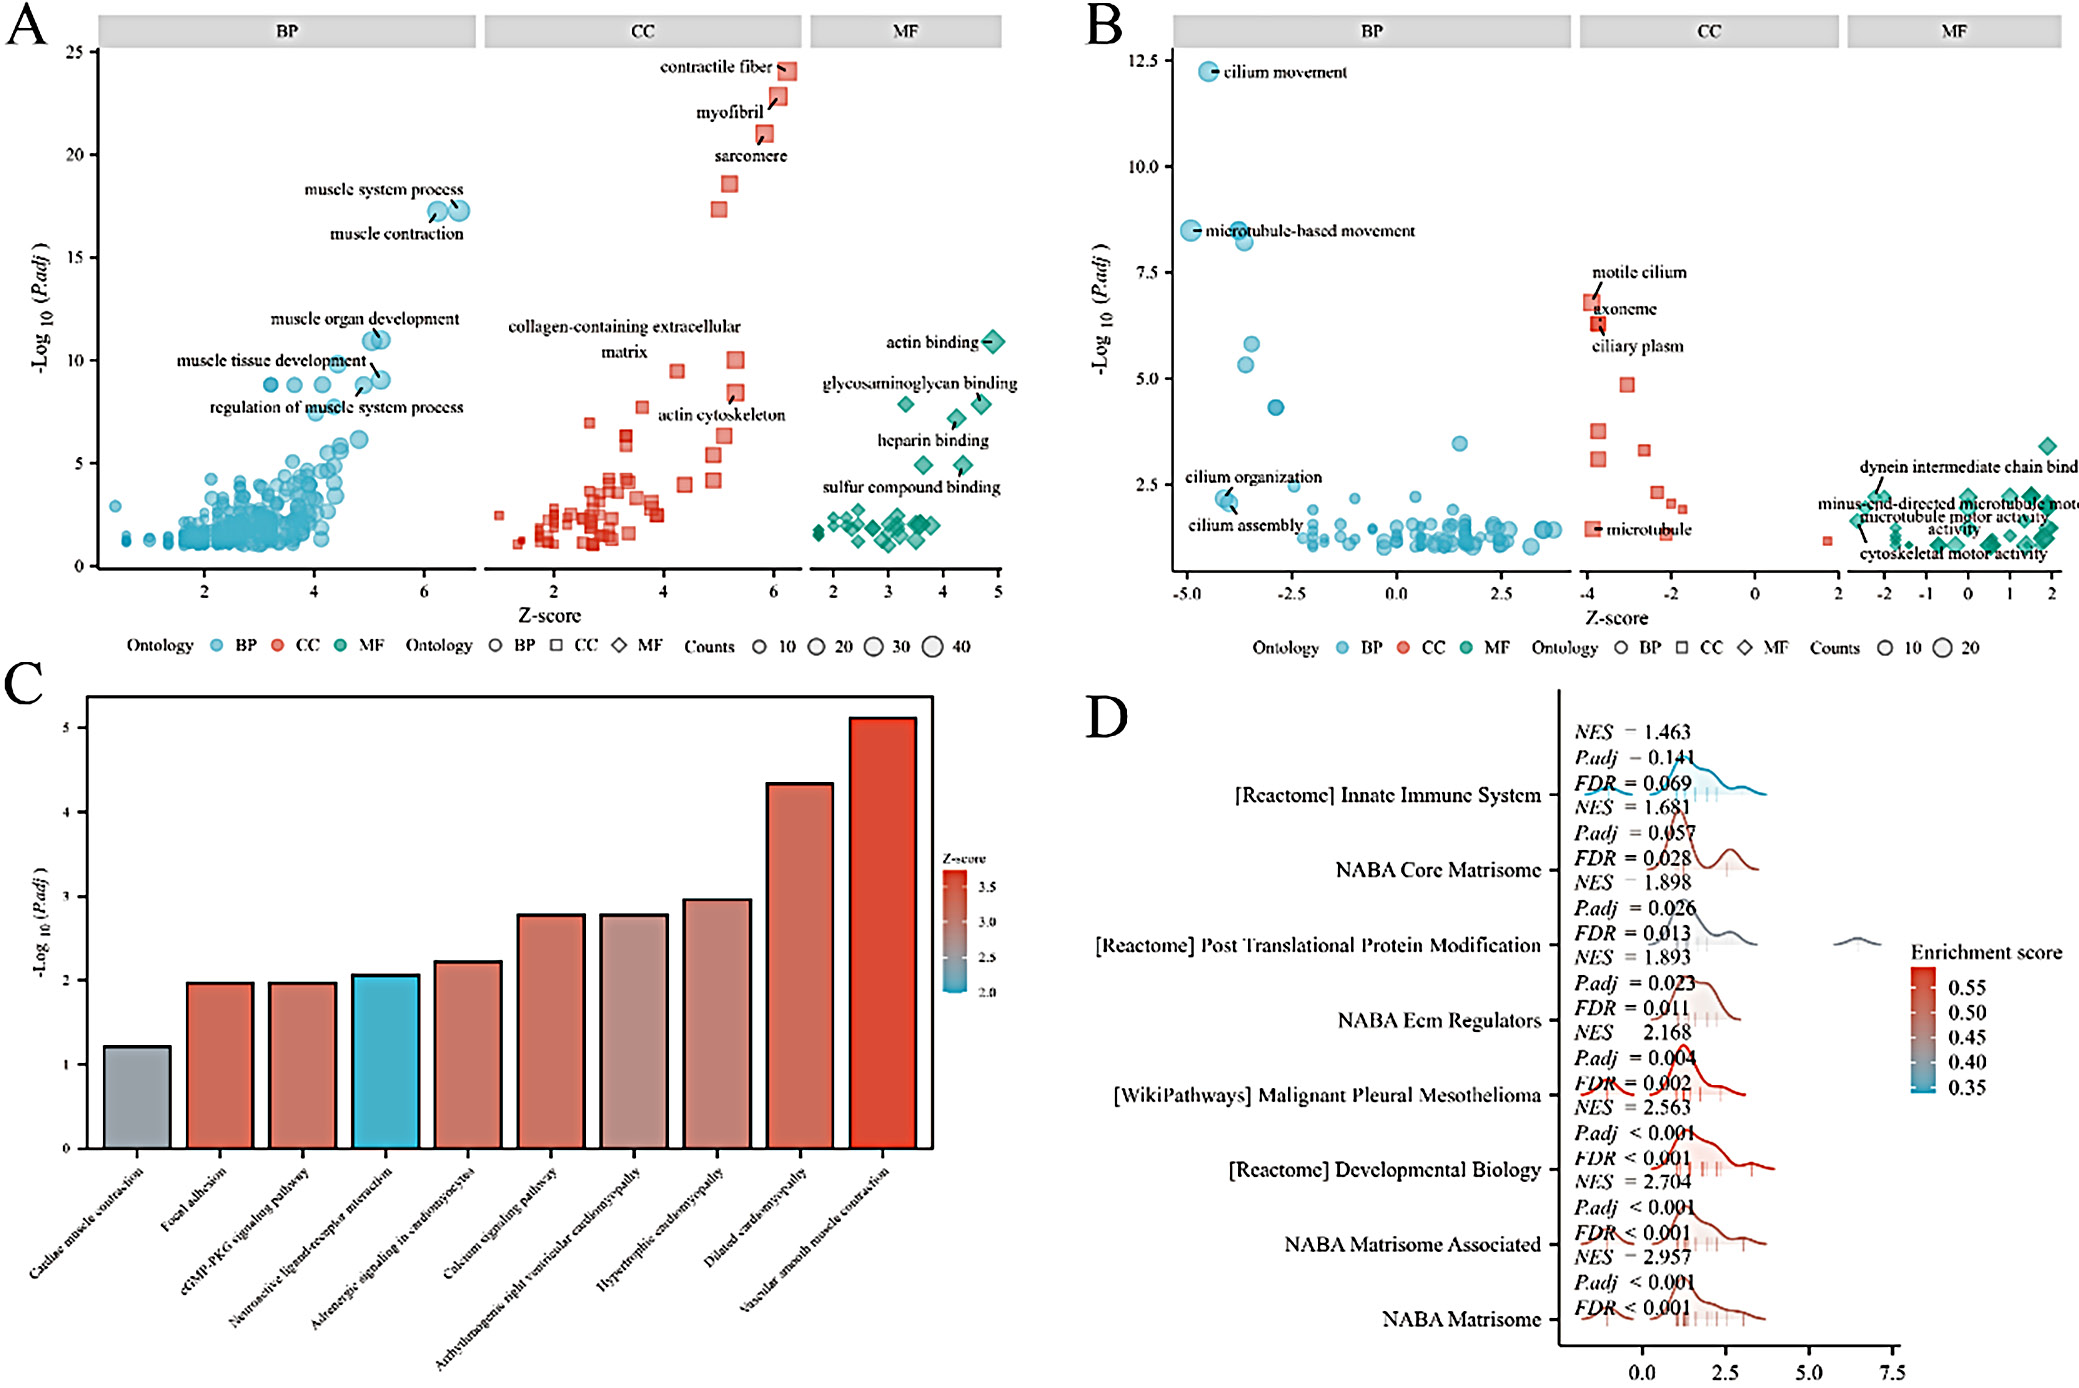
Functional enrichment analysis was performed on differential genes between the risk score and consensus clustering groups. Gene Ontology (GO) analysis related to the risk score mainly involved cell movement and ciliary movement. Among these, “cell motility” and “cilia motility” were significantly enriched biological processes that play a key role in LUAD invasion and metastasis (Figure 4A), while GO analysis related to consensus clustering mainly involved muscle contraction and fiber contraction (Figure 4B). Kyoto Encyclopedia of Genes and Genomes (KEGG; https://www.genome.jp/kegg) enrichment analysis and gene set enrichment analysis (GSEA) related to the risk score were enriched only in cell movement; therefore, these results are not shown in the figures. The KEGG analysis for consensus clustering mainly involved vascular contraction (Figure 4C). GSEA for consensus clustering mainly involved the formation and regulation of the stromal group (Figure 4D).
Immune-related analysis
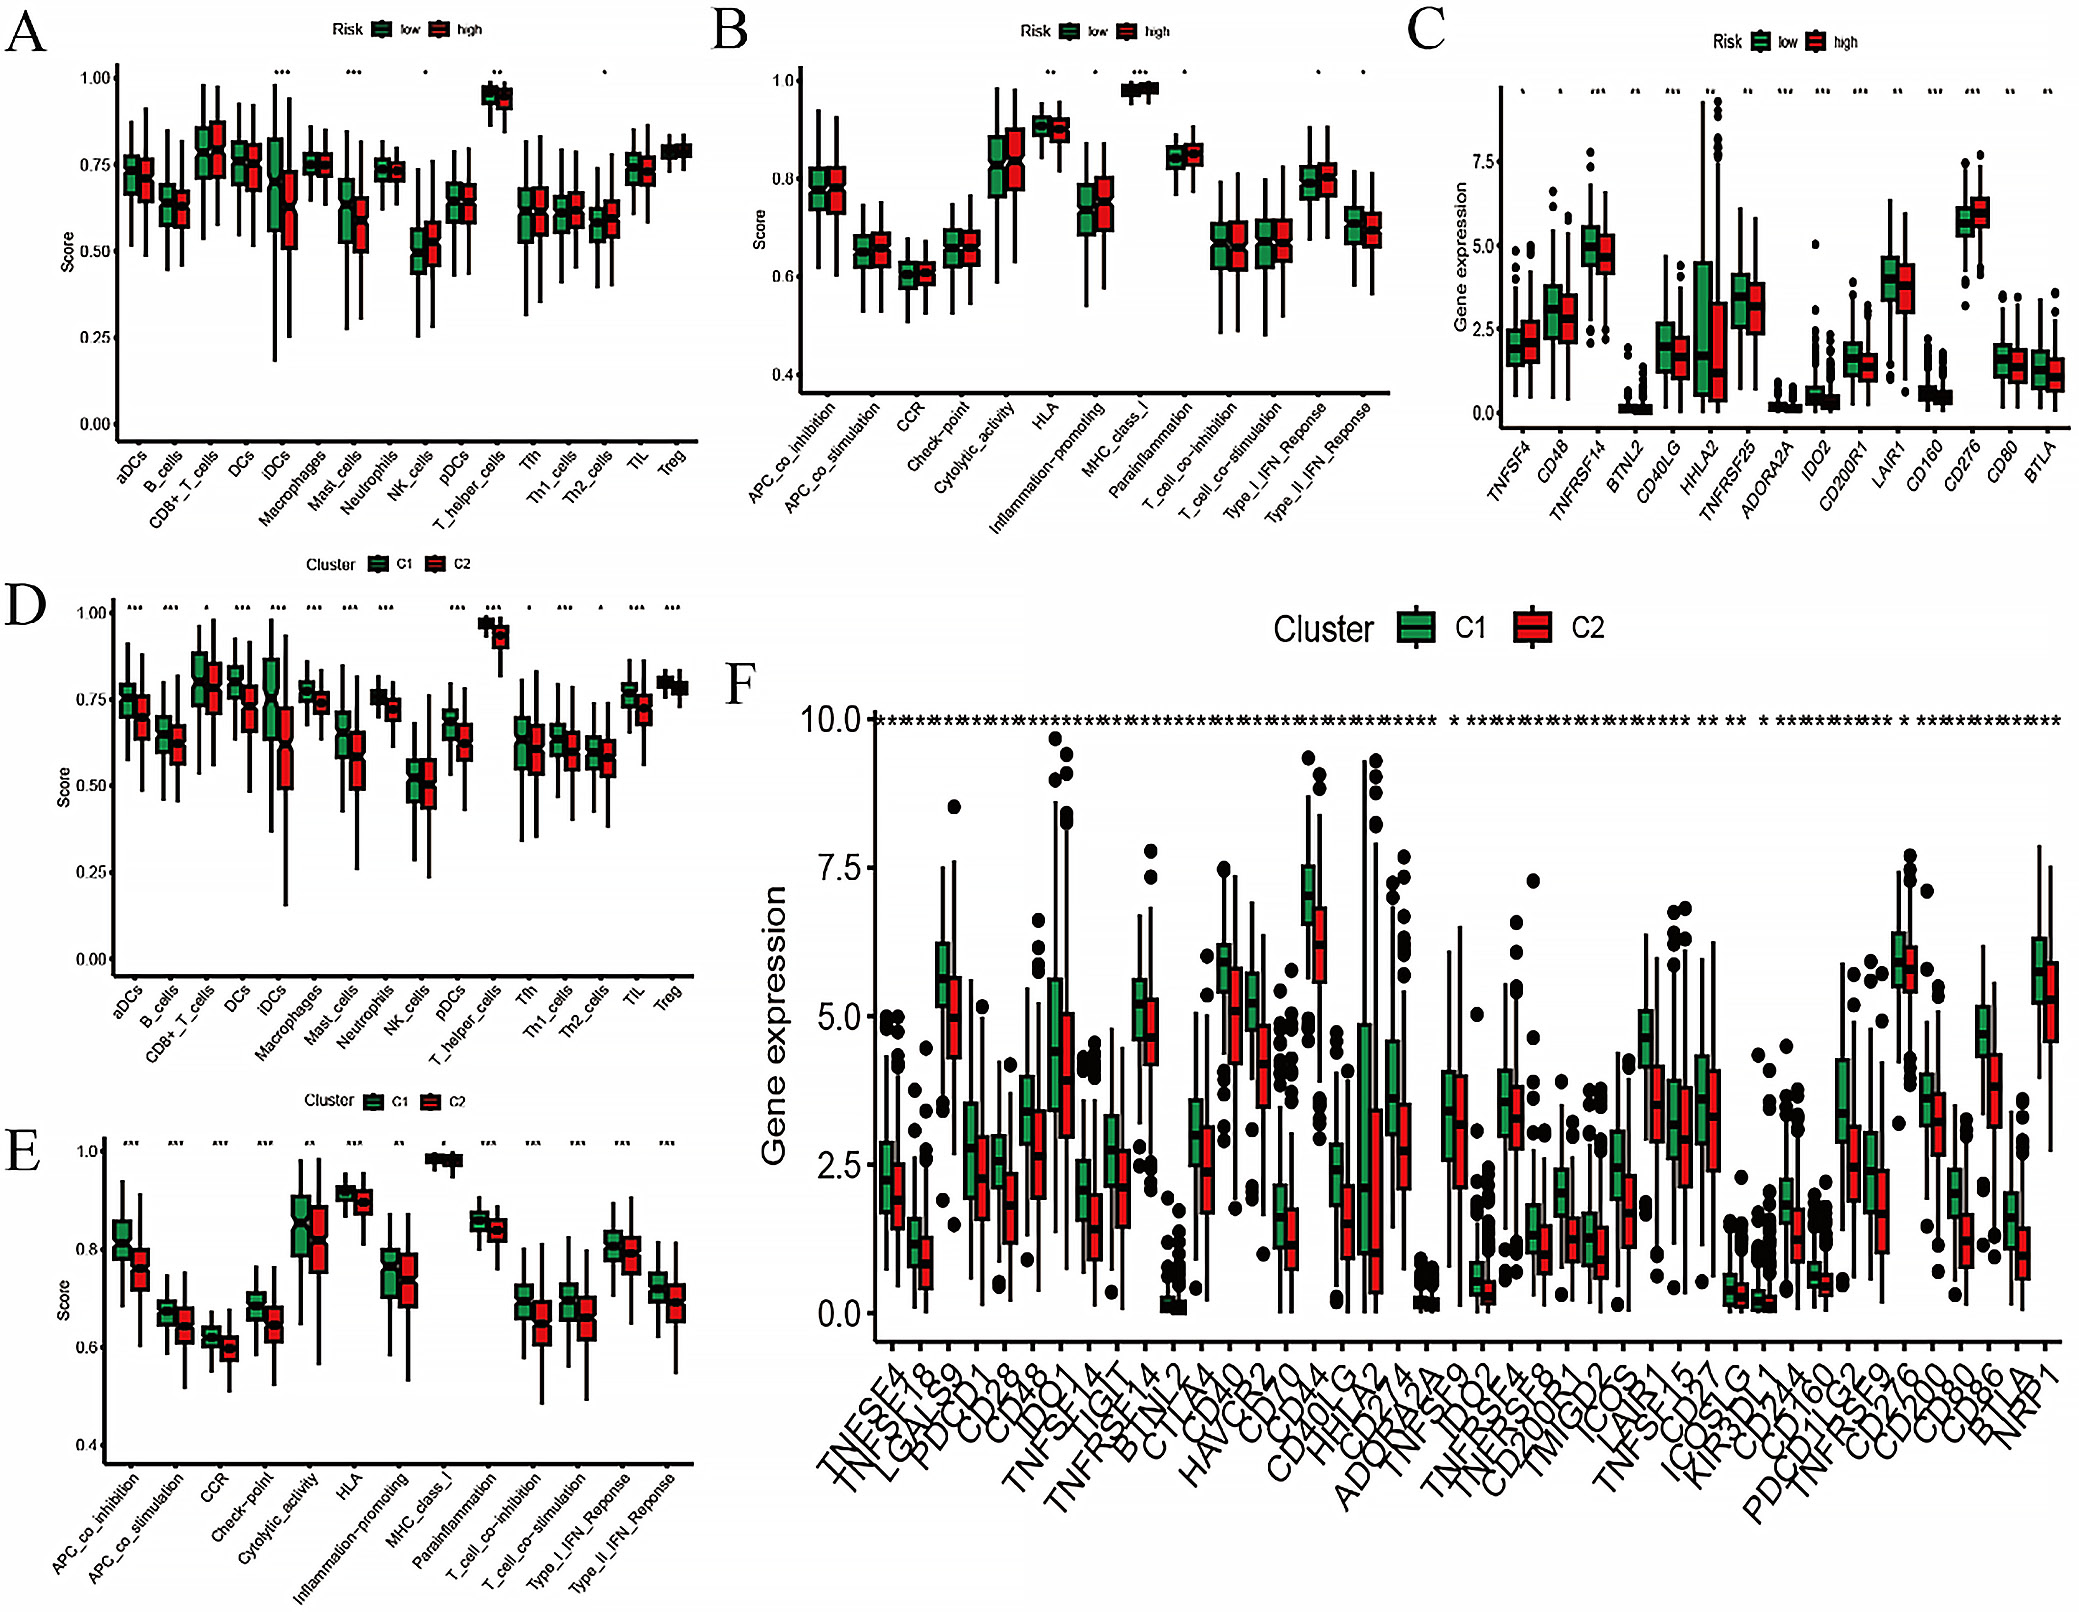
The risk score and consensus clustering showed similar profiles in immune cell infiltration and immune cell function, primarily associated with T cells and macrophages (Figure 5A,B,D,E). By integrating checkpoint analysis with risk scores and consensus clustering, together with the analysis of immune cells and their functions, the consensus clustering groups appeared to be more immunologically sensitive (Figure 5C,F).
Mutation analysis
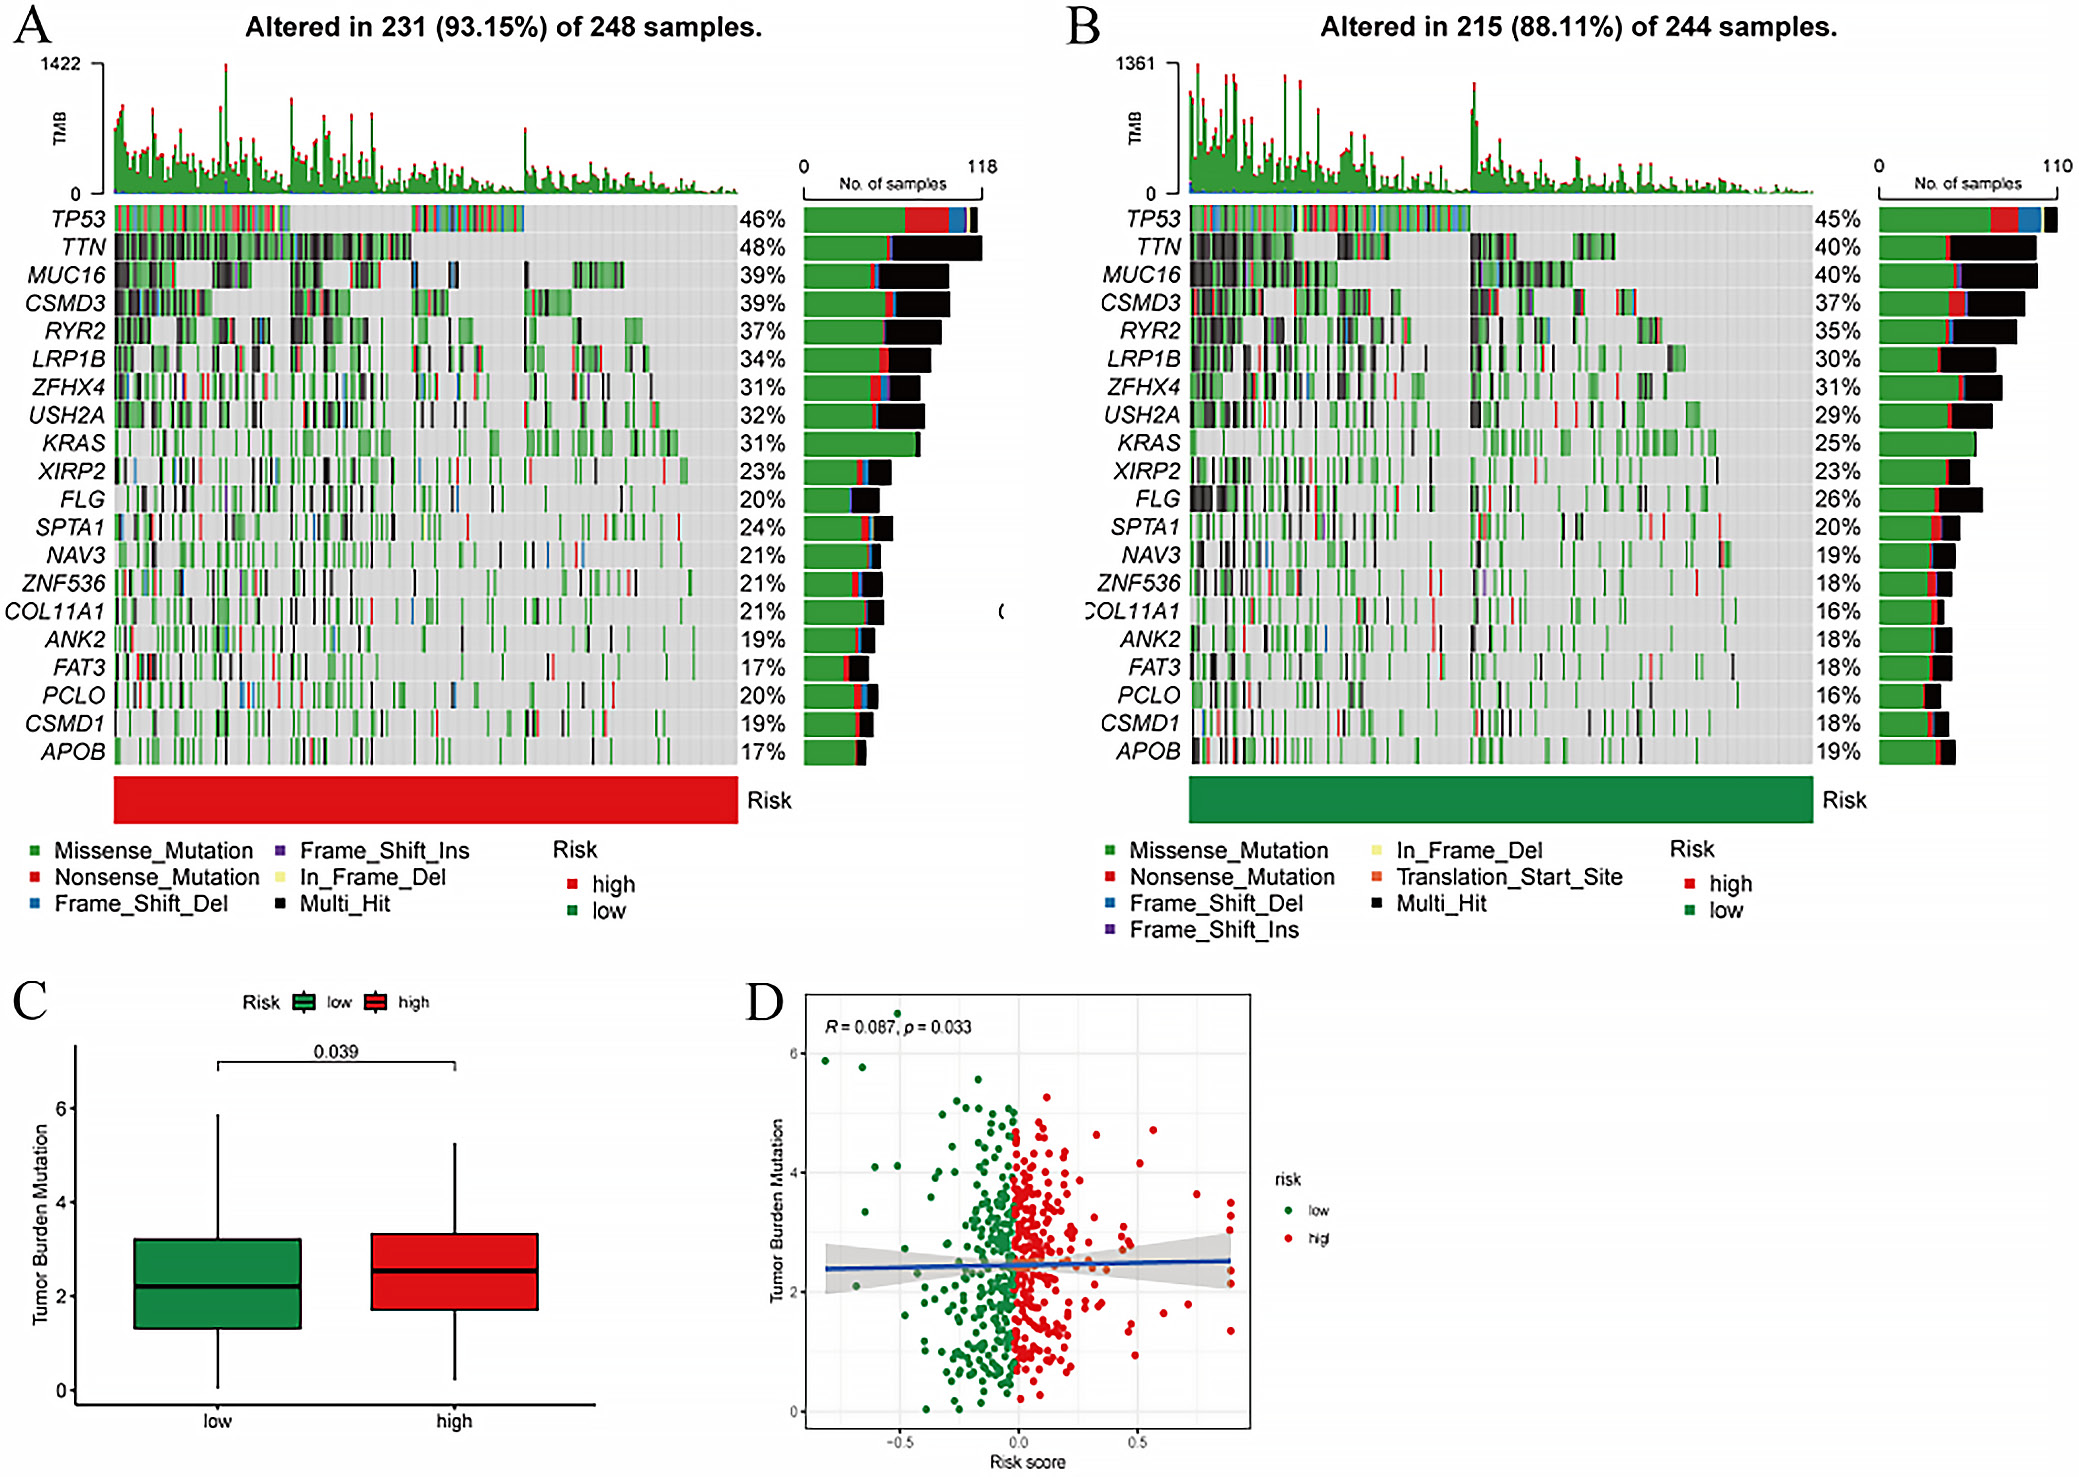
An in-depth examination of the mutational profile in relation to the risk score was performed. The mutational spectrum revealed the top 20 most frequently mutated genes, highlighting a pronounced disparity in mutation rates between the high- and low-risk cohorts (Figure 6A). A statistically significant difference in mutation rates was observed between these groups (p = 0.039), with the high-risk group exhibiting a notably elevated TMB score compared to the low-risk group (Figure 6B). Moreover, a significant positive correlation was identified between TMB and risk scores (correlation coefficient R = 0.087, p = 0.033), suggesting a direct association between the 2 metrics (Figure 6C).
Clinical and functional exploration of model genes
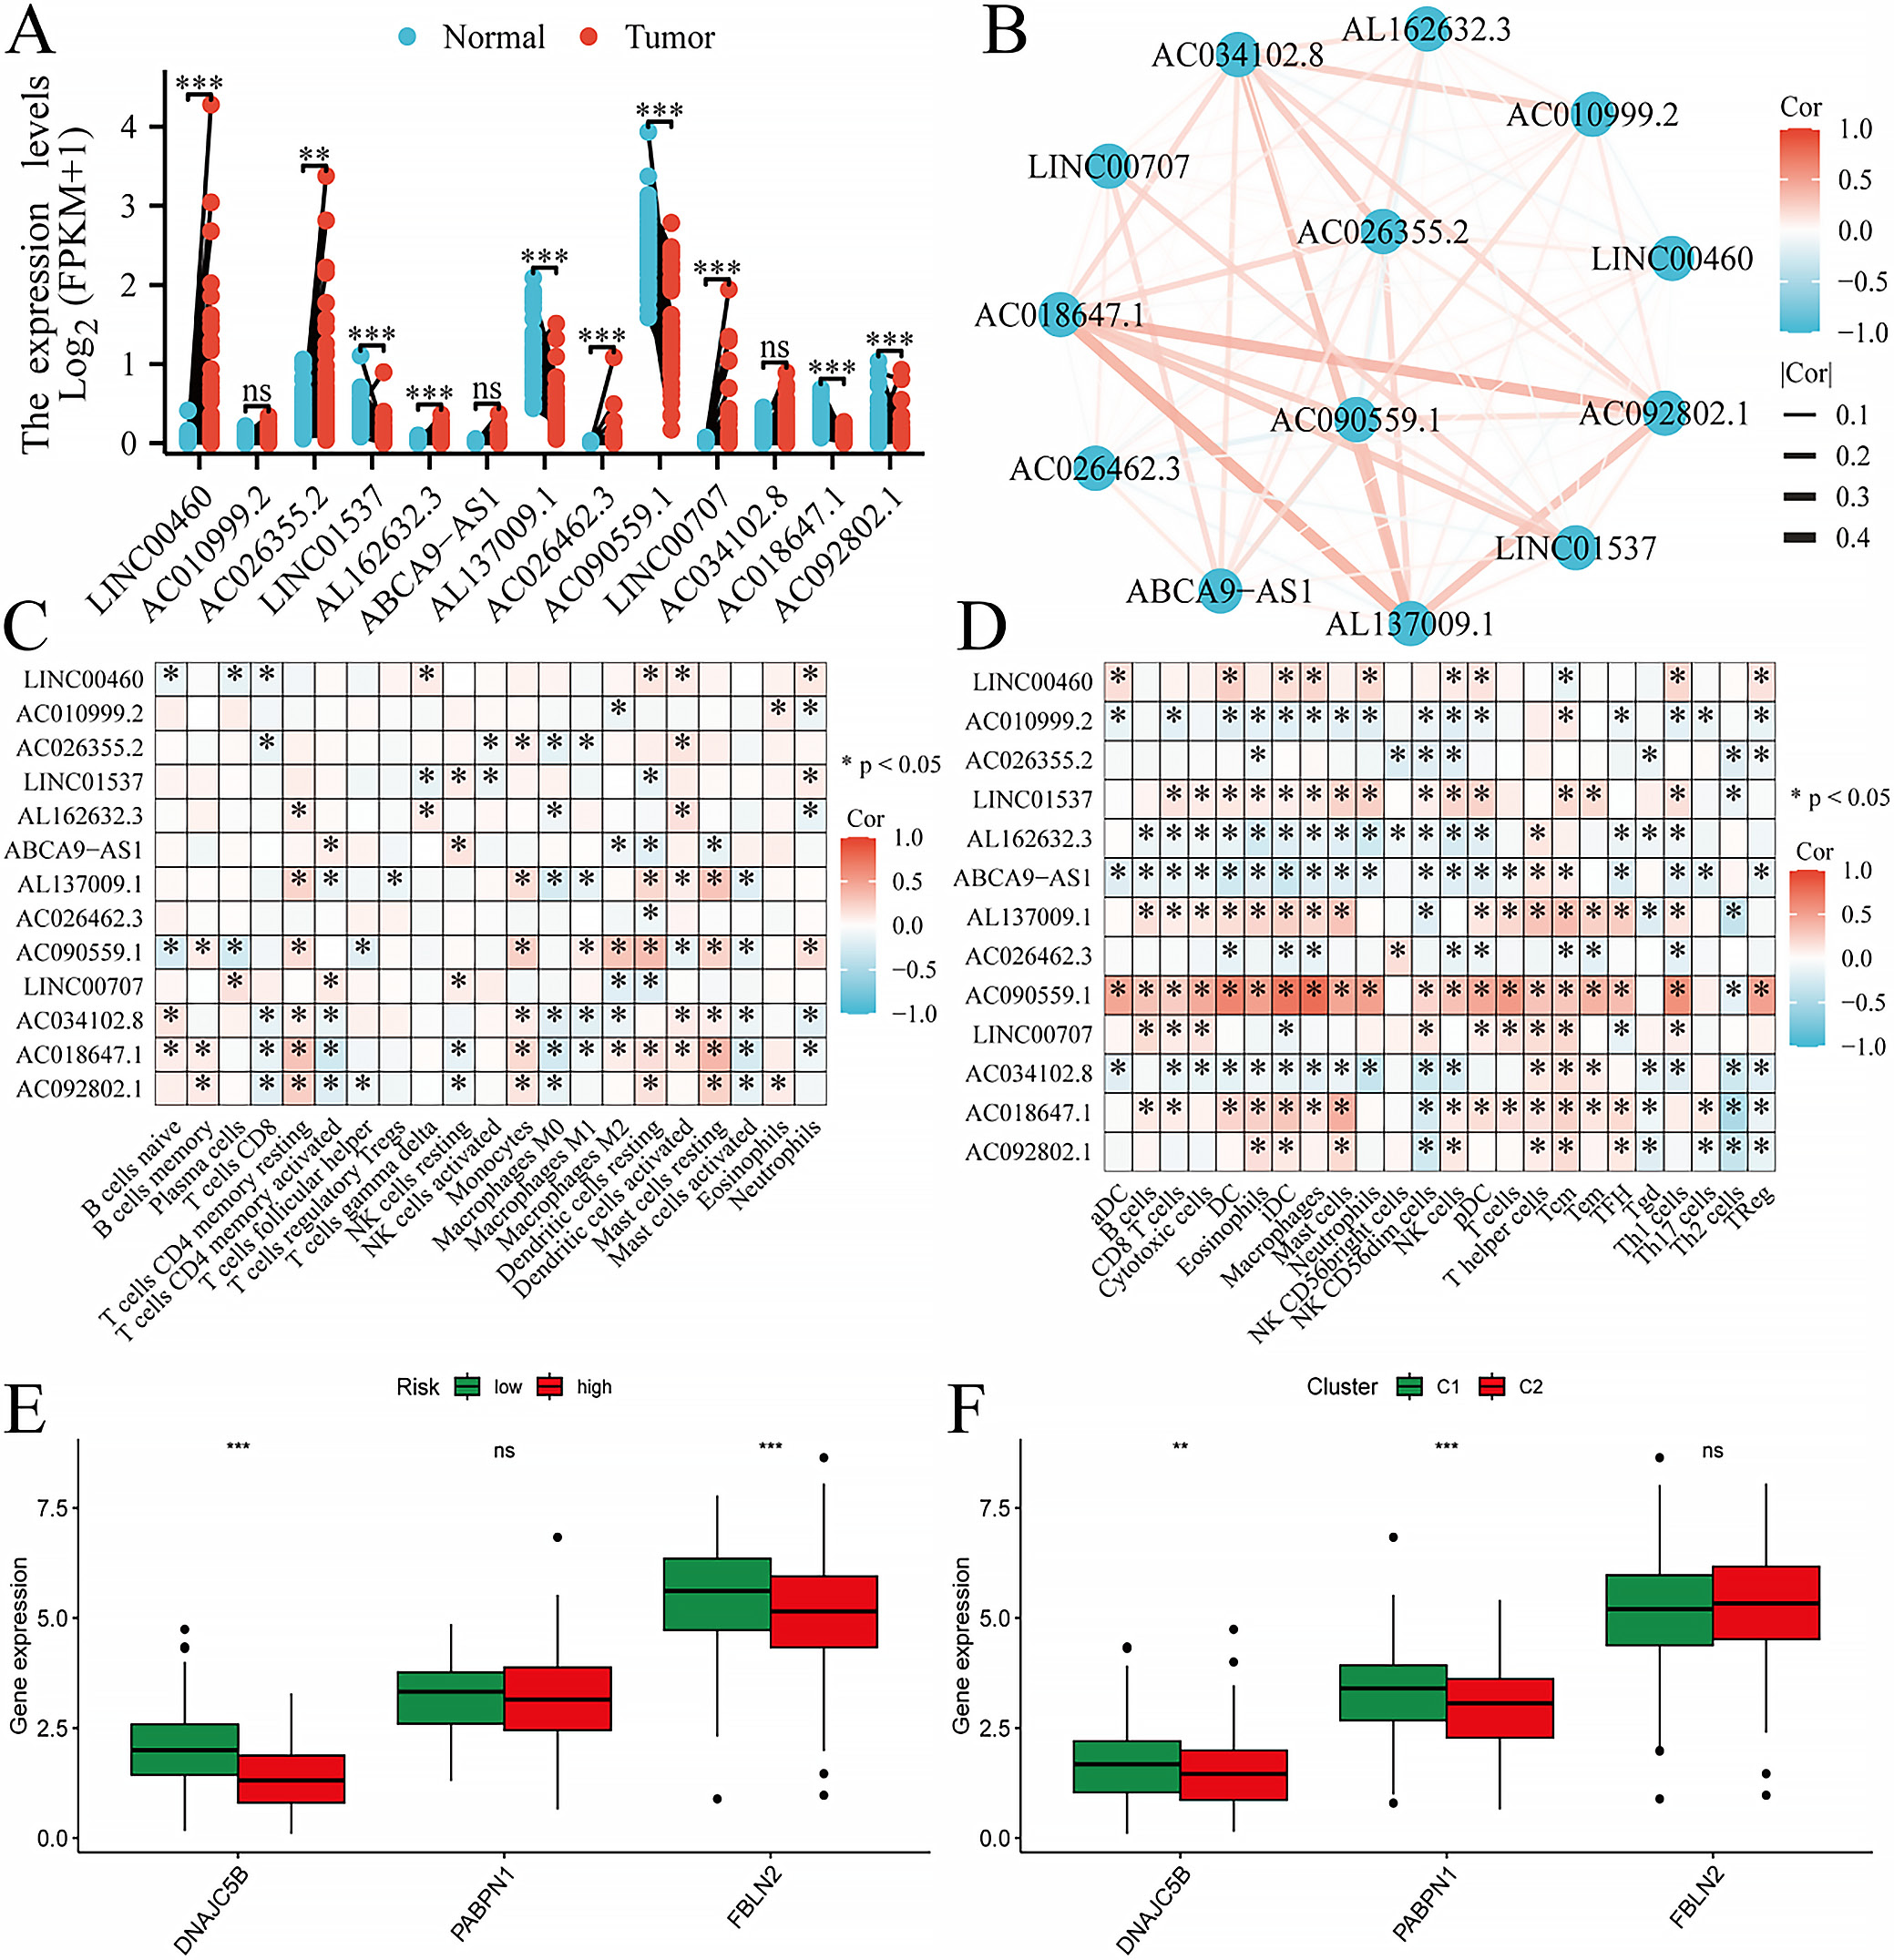
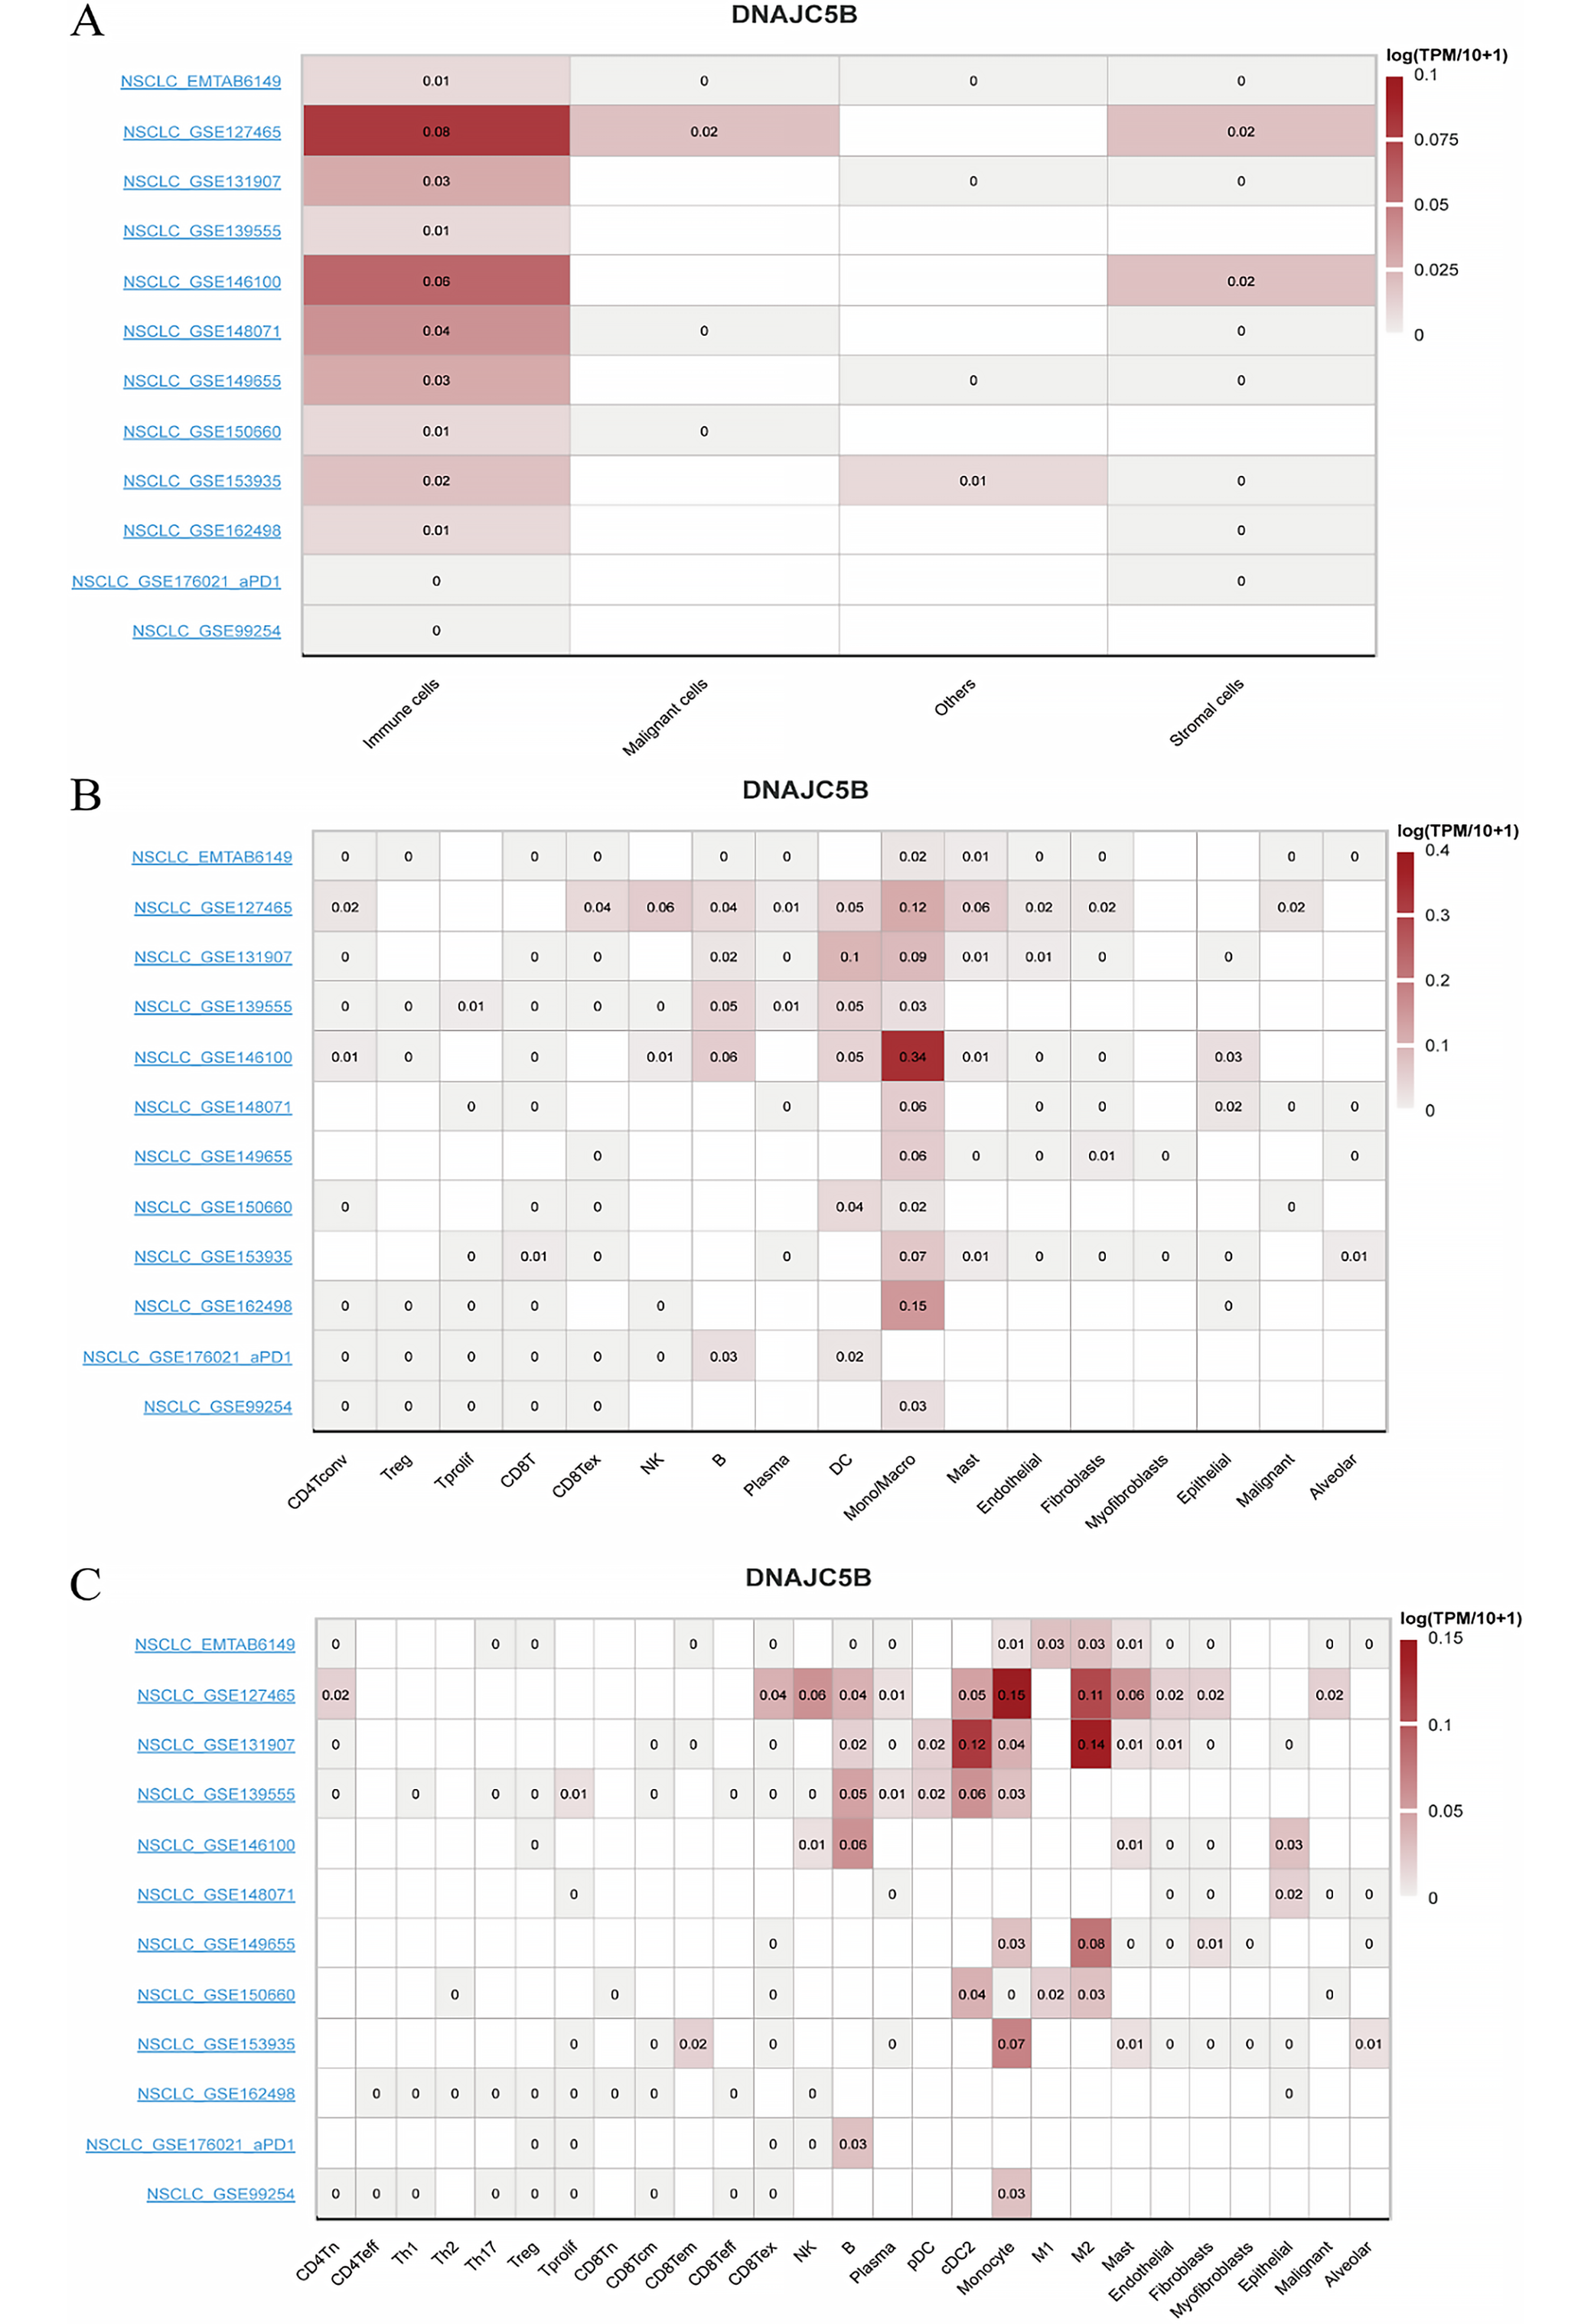
Pairwise sample analysis was conducted on the model genes, revealing expression differences for all core genes in the model except AC010999.2, AC026462.3, and AC034102.8 (Figure 7A). Prognostic analysis of the model genes over 1–5 years indicated a close relationship between the model genes and prognosis (Figure 7B). Immunoinfiltration analysis showed that the model genes were involved in immune cell production and immune cell function (Figure 7C,D). Based on TCGA data, we further analyzed the expression of the hub target genes in the risk scoring and consensus clustering groups (Figure 7E,F). Combining expression correlation analysis and differential expression analysis, DNAJC5B was ultimately selected for subsequent validation. Based on TISCH2, as there was no option for LUAD, we selected NSCLC. DNAJC5B was primarily associated with monocytes/macrophages, followed by B cells and natural killer (NK) cells (Figure 8).
Discussion
The individual variability among patients leads to different responses to treatment, necessitating robust prognostic markers for personalized prediction and therapy.4, 22 Therefore, the construction of a robust prognostic model to predict patient outcomes is urgently needed. Long non-coding RNAs play a significant role in many biological processes, including tumorigenesis, cell differentiation, and metabolism.23, 24, 25 In recent years, these novel non-coding transcripts have garnered widespread attention due to their extensive and complex roles in cancer migration and progression.26
Long non-coding RNAs play a key role in cancer development by interacting with ER stress-related proteins, activating downstream signaling pathways, and regulating apoptosis and survival. For example, lncRNA GAS5 binds to GRP78, activates the UPR and the caspase-9 and CHOP signaling pathways, and induces apoptosis in hepatoblastoma HepG2 cells.27 lncRNA MEG3 is associated with increased expression of ER stress pathway proteins (e.g., GRP78, PERK, IRE1α, and ATF6), enhances NF-κB (nuclear factor kappa-light-chain-enhancer of activated B cells) translocation, and induces apoptosis in cancer cells.28, 29, 30 In addition, lncRNAs are involved in the fine regulation of apoptosis and survival mechanisms and influence the sensitivity of tumor cells to chemotherapeutic agents.31, 32 These mechanisms are complex and diverse, providing potential targets for cancer prognostic assessment and treatment, and further research is needed to support precision cancer therapy in the future.
In the present study, we paid special attention to the role of lncRNAs such as LINC00460 in ER stress. LINC00460 has been reported to interact with key regulators of ER stress, such as ATF4, which in turn affects UPR signaling. Our data indicate that the expression level of LINC00460 is closely associated with the prognosis of LUAD patients, suggesting that it may influence tumor progression by regulating the UPR.
We employed the WGCNA method to identify gene modules highly related to the disease from the gene expression data of LUAD patients. Combined with DEGs and univariate Cox analysis, we selected genes significantly associated with prognosis and further optimized model construction using the LASSO Cox regression algorithm. This process not only improved the predictive accuracy of the model but also ensured its robustness through cross-validation.
The risk scoring model and its consensus clustering subgroups demonstrated excellent discrimination ability in both the training and testing sets, clearly distinguishing high- and low-risk patient groups. The predictive accuracy of the model was further validated through Kaplan–Meier survival curves and ROC curve analysis, providing a potential prognostic tool for personalized treatment of LUAD patients. Compared with previous methods that only used the median or average value of the risk score as the threshold to distinguish high and low-risk groups, consensus clustering subgroups (C1 and C2) more accurately combined the risk score with clinical actual subgroups. This combination helps to identify subgroups sensitive to the risk score (C2) and subgroups with unique immune characteristics (C1), providing a more precise stratification basis for clinical treatment. We found that a high risk score was associated with a poorer survival prognosis, which may be related to the high infiltration of immunosuppressive cells in the TME of patients in the high risk score group. This finding provides a potential biomarker for future immunotherapy, suggesting that we can improve patient prognosis by modulating immune cells in the TME.
Furthermore, functional enrichment analysis using the GO and KEGG databases revealed that differential genes were mainly enriched in biological processes related to cell movement and ciliary movement. In contrast, consensus clustering analysis revealed gene enrichment related to muscle contraction and fiber contraction. These findings suggest that ER stress-related lncRNAs may affect the development of LUAD by regulating these key biological processes.
Muscle contraction and fiber contraction play important roles in tumor biology, as they can regulate vascular contraction and, through the regulation of material exchange between the tumor and the circulatory system, affect tumor metabolism and proliferation on the one hand.33, 34, 35 On the other hand, these processes also participate in the regulation of tumor invasion, metastasis, and immune escape mechanisms.34, 36, 37, 38 At the same time, cell movement and ciliary movement directly participate in affecting the invasiveness, metastatic ability, and immune escape mechanisms of tumors.39, 40 It is worth noting that both muscle and fiber contraction and cell and ciliary movement depend on the normal function of the ER to ensure the correct synthesis and execution of protein functions.41, 42, 43 The ER plays a crucial role in maintaining cell movement and tumor biological behavior.
Therefore, the analysis results of this study highlight the multifaceted role of the ER in tumor biology and provide new perspectives for future research. Especially when developing treatment strategies for LUAD, considering the potential impact of ER stress and related lncRNAs is crucial. These findings may help design new intervention measures to regulate ER stress, thereby affecting tumor development and response to treatment.
The TME, immune system interactions, and TMB are pivotal areas of interest in oncology, significantly influencing tumor genesis and progression.44, 45, 46 Our research demonstrated that the TME score for patients categorized in the high-risk group markedly surpassed that of the low-risk group, suggesting a potential enhanced responsiveness to immunotherapy among high-risk patients. This notion is further corroborated by a detailed examination of immune cell dynamics and their respective roles. Clinically, an elevated TMB score is often linked to enduring clinical benefits and enhanced objective response rates in cancer immunotherapy.47 Our findings indicate that the TMB score for the high-risk group was considerably higher than for the low-risk group, hinting at a more favorable prognosis and a greater potential for therapeutic advantage from immunotherapy for those with elevated TMB scores.48
A combined analysis of risk score grouping and consensus clustering subgroups was performed.49, 50 This finding provides a new perspective for understanding the role of ER stress in the tumor immune microenvironment and may help develop precision treatment strategies for specific immune cell populations.
DNAJC5B (DnaJ heat shock protein family C member 5B), as a member of the heat shock protein family, belongs to the subfamily of DNAJ/Hsp40 protein co-chaperones. These proteins play important roles in cells, including promoting the correct folding of proteins, preventing the aggregation of misfolded proteins, and participating in the degradation and translocation processes of proteins.51 DNAJC5B, with its molecular chaperone characteristics, may be involved in the correct folding of proteins in the ER, preventing the accumulation of abnormal proteins, thereby maintaining protein homeostasis.
When protein folding encounters obstacles, it may trigger ER stress. In this process, DNAJC5B may participate in the regulation of the ER stress response through its role in the ER, affecting the cell’s response to ER stress. Therefore, DNAJC5B may indirectly affect the proliferation, migration, invasion, apoptosis, and colony formation of tumor cells by participating in the ER stress response.52, 53, 54 To verify this hypothesis, we conducted an in-depth exploration of the function of DNAJC5B in the experimental part.
In addition, combined with the single-cell sequencing exploration in this study, we found that DNAJC5B mainly affects monocytes/macrophages, T cells (NK cells), and B cells. Therefore, we speculate that DNAJC5B affects immune cells (monocytes/macrophages, T cells (NK cells), B cells) through the ER stress response, thereby affecting the immune-related treatment of LUAD. Interestingly, the correlation between DNAJC5B and immune cells is not related to lung cancer treated with neoadjuvant PD-1 blockade, which provides evidence for our hypothesis.
This study successfully constructed a risk scoring model based on ER stress-related lncRNAs, providing a new perspective and tool for the prognostic evaluation and personalized treatment of LUAD. Through consensus clustering analysis, not only were populations potentially sensitive to treatment identified, but populations with specific immune characteristics were also discovered. In addition, the biological relevance of the core target gene DNAJC5B in tumor cell biological behavior was experimentally verified, further confirming the biological relevance of the model.
Limitations of the study
A critical limitation is the absence of external validation cohorts, which may restrict the generalizability of the model. Future studies should prioritize multicenter prospective trials to assess its clinical utility across diverse populations. Additionally, the model’s dependency on RNA-seq data necessitates standardization of sequencing platforms for real-world application. The present study’s used only data on LUAD patients from the TCGA database, which may be subject to selection bias. In addition, our model has not been validated in an independent cohort, so its generalizability and reliability need to be further assessed. To overcome these limitations, future research will verify the biological function of the model through experimental methods and plans to further explore the clinical application potential of the model in a larger independent patient cohort. Meanwhile, future studies should include validation of our risk scoring model in a larger multicenter cohort of patients and explore its application in guiding individualized treatment. This will help improve the generalizability and reliability of the models, bridge the gap between computational prediction and clinical implementation, and provide more accurate guidance for the clinical treatment of LUAD patients. In addition, we suggest further studies on the regulatory mechanisms of lncRNAs in ER stress and how they affect the immune microenvironment in LUAD.
Conclusions
Our study contributes to the development of new therapeutic strategies to improve outcomes for LUAD patients. This will help improve the model’s universality and reliability, providing more accurate guidance for the clinical treatment of LUAD patients. Through these efforts, we hope to translate research results into practical clinical applications, benefiting more LUAD patients.
Supplementary data
The supplementary materials are available at https://doi.org/10.5281/zenodo.16993863. The package contains the following files:
Supplementary File 1. Schoenfeld PH test results.
Data Availability Statement
The datasets supporting the conclusions of this study are publicly available on Figshare at the following link: https://figshare.com/s/0423b4e4fcde57b9dc87.
Consent for publication
All authors have reviewed the manuscript and consent to its publication.