Abstract
Background. Osteogenesis imperfecta (OI) necessitates innovative mesenchymal stem cell (MSC) therapies targeting key molecular pathways to enhance targeted and combination treatments and improve bone health.
Objectives. To investigate the therapeutic mechanisms of various interventions for OI by analyzing relevant datasets, with a focus on lipid metabolism-related genes, particularly PLIN2, in order to determine whether they influence the balance between osteoblast and adipocyte differentiation.
Materials and methods. This study analyzed datasets from the Gene Expression Omnibus (GEO; GSE157587, GSE214064, GSE186141) and UK Biobank genome-wide association study (GWAS) summary statistics (UKB-b-4657, UKB-b-1096, UKB-b-8875, UKB-b-20124) using bioinformatics tools, including GEO2R, DESeq2, TwoSampleMR, MR-Egger, MR-PRESSO, gwasrapidd, and summary data-based Mendelian randomization (MR), to identify differentially expressed genes (DEGs) and assess causal relationships with heel bone mineral density (BMD).
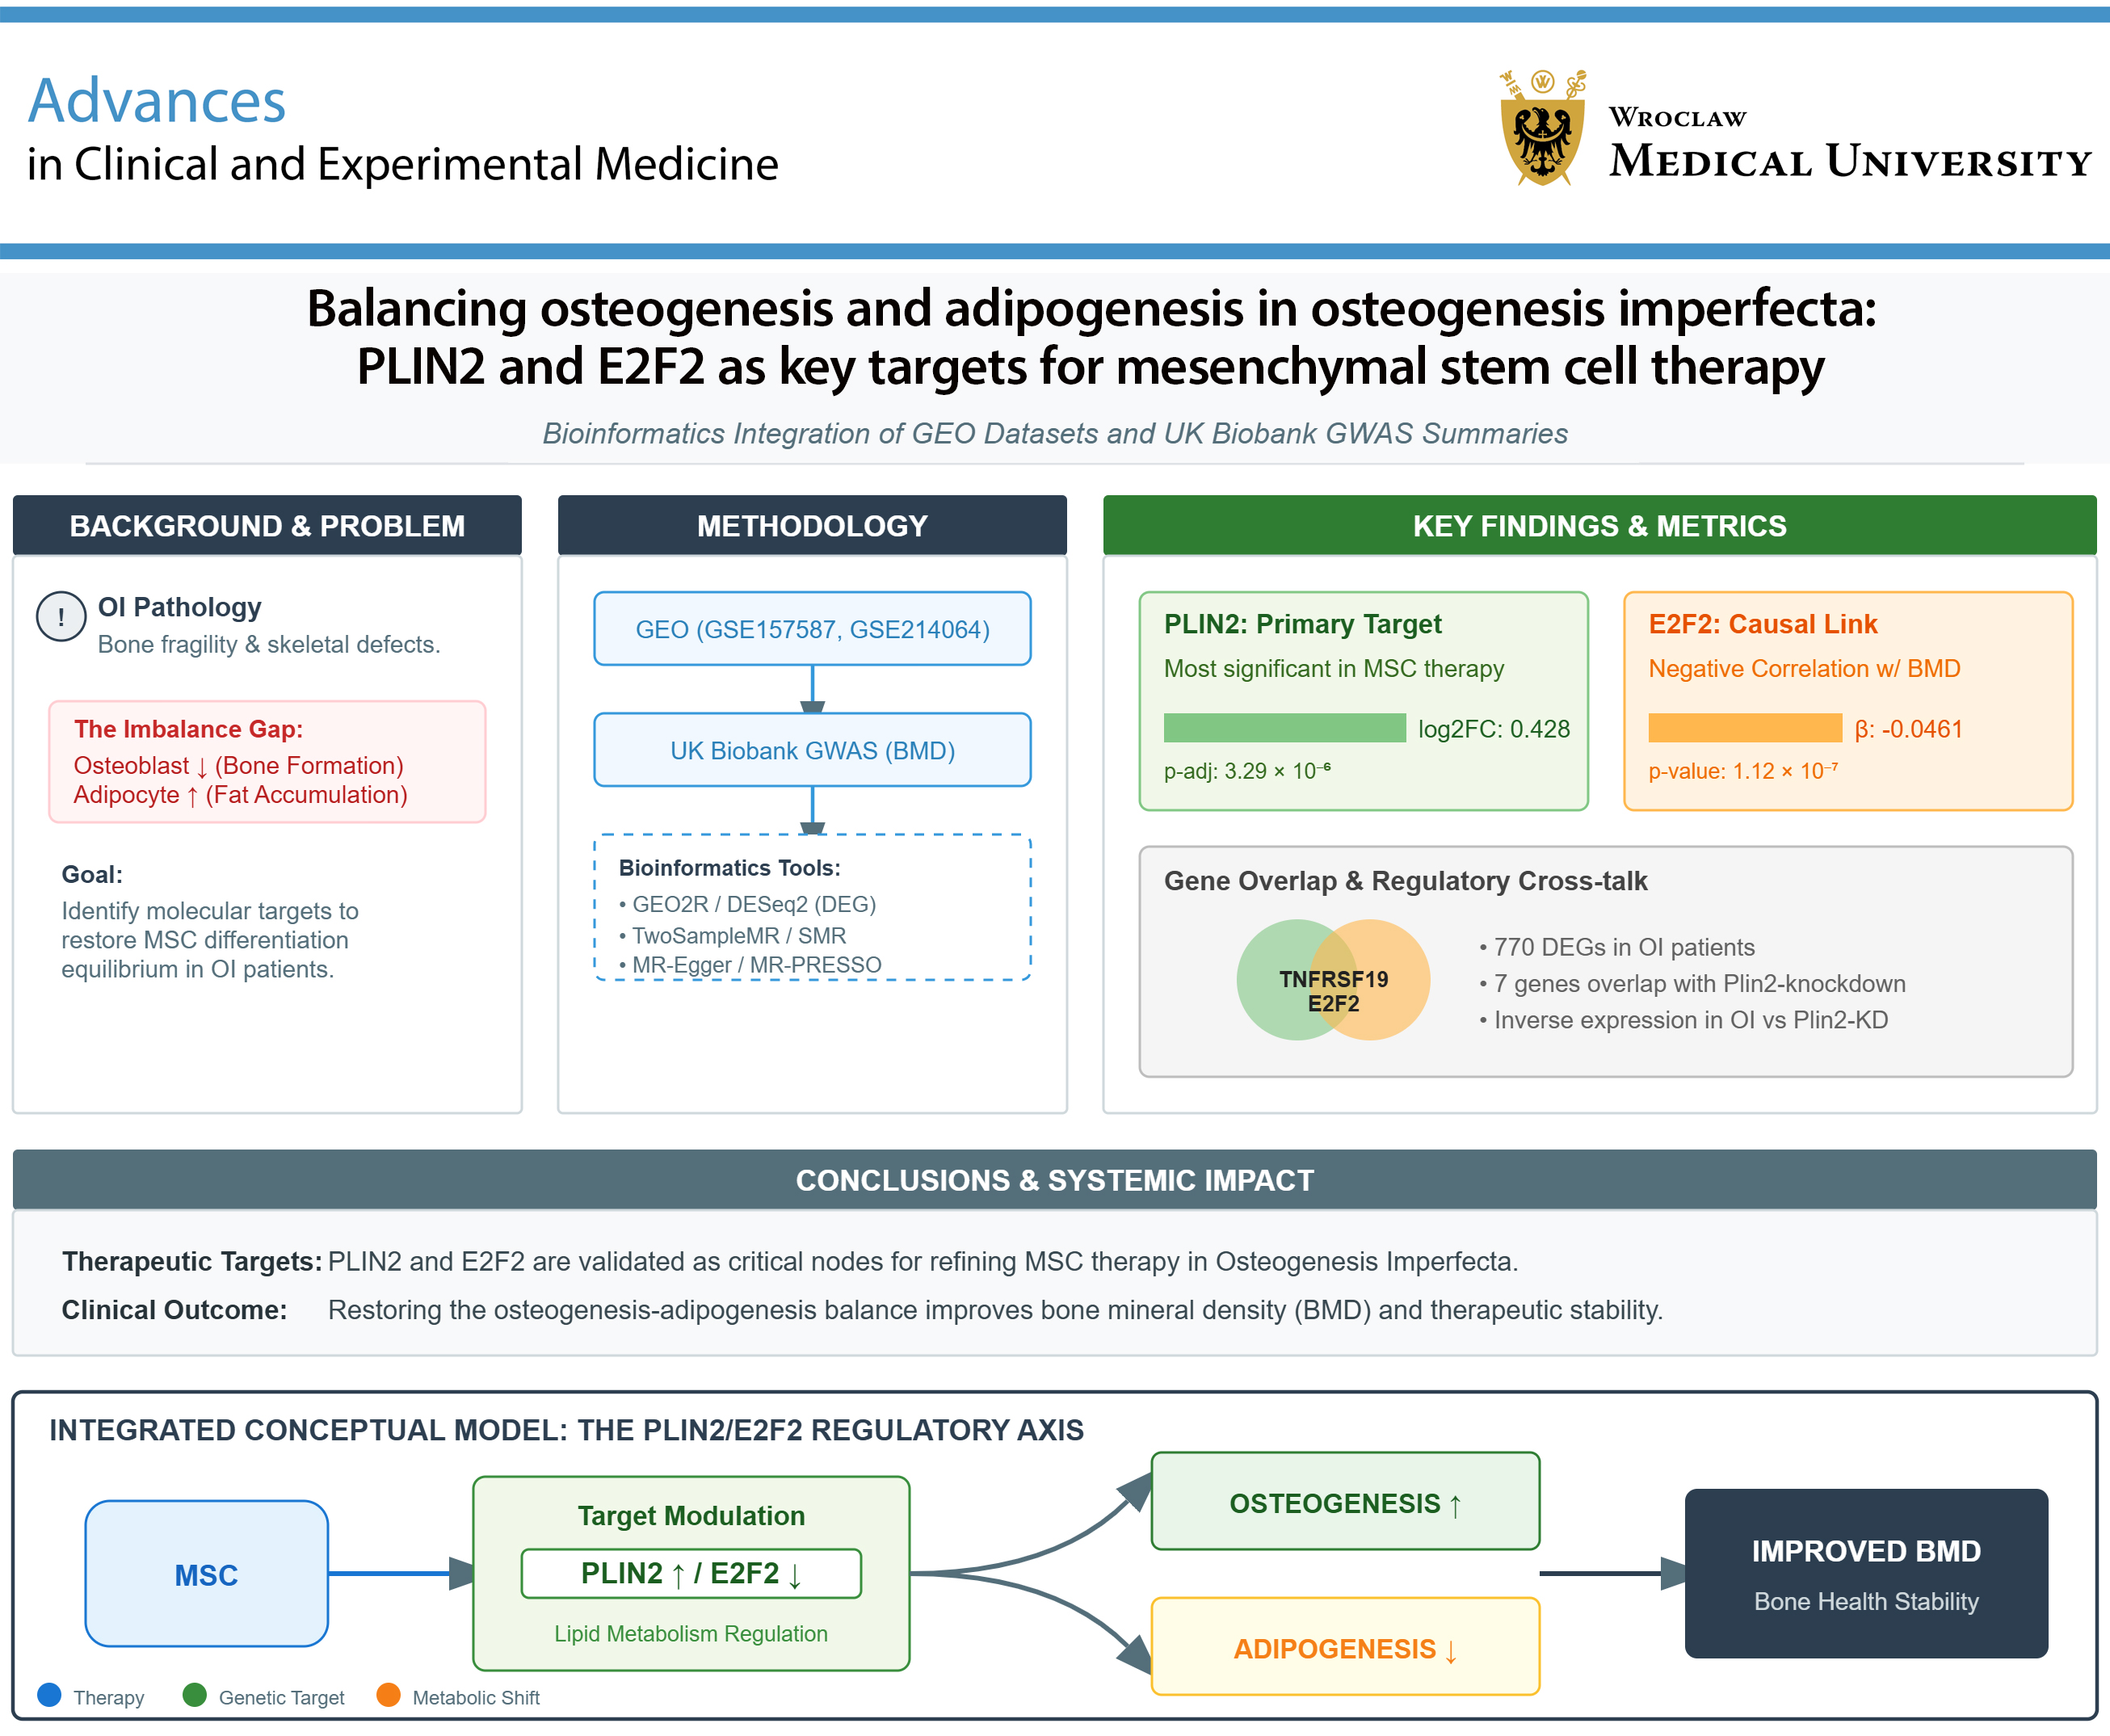
Results. Differentially expressed genes analysis of GSE157587 identified PLIN2 as the most significant gene influenced by MSC therapy in OI (log2 fold change = 0.428, adjusted p = 3.29 × 10⁻⁶), whereas GSE186141 revealed 770 DEGs in OI patients, with 7 overlapping with PLIN2-related genes. Notably, TNFRSF19 (log2 fold change = −2.7454, adjusted p = 3.930 × 10⁻⁷ in OI; 1.5001, adjusted p = 3.482 × 10⁻³ in PLIN2 knockdown) and E2F2 (log2 fold change = −2.1428, adjusted p = 8.830 × 10⁻⁵ in OI; 1.7207, adjusted p = 1.244 × 10⁻² in PLIN2 knockdown) were identified as key genes. Mendelian randomization analysis confirmed a negative association between E2F2 and heel BMD (p = 1.116 × 10⁻⁷ to 6.073 × 10⁻⁵; effect size −0.0461 to −0.0277).
Conclusions. PLIN2 and E2F2 emerge as critical targets for refining MSC therapy in OI, with the potential to improve bone formation and reduce fat accumulation by restoring the osteogenesis–adipogenesis balance. These findings may support the development of combination therapies or engineered MSCs, ultimately improving clinical outcomes for patients with OI.
Key words: Mendelian randomization, lipid metabolism, osteogenesis imperfecta, mesenchymal stem cell therapy, bone homeostasis
Background
Osteogenesis imperfecta (OI) is a genetic disorder characterized by bone fragility and impaired bone formation. This rare connective tissue disorder affects approx. 11.6 per 100,000 pediatric individuals, as reported in a recent nationwide registry study conducted in Turkey (data from 2016–2022).1 Current treatments for OI primarily rely on bisphosphonates and other antiresorptive agents. Despite these approaches, significant challenges remain, including limited efficacy in severe cases, long-term adverse effects, and the inability to fully restore normal bone quality and reduce fracture risk. Therefore, the identification of novel therapeutic targets remains essential for improving the management of this serious disease. Recent studies have highlighted the complex interplay between glucose and lipid metabolism and bone homeostasis. Notably, hypoglycemic agents such as metformin2 and glucagon-like peptide-1 (GLP-1) receptor agonists3, 4 have demonstrated potential pro-osteogenic effects, while lipid-lowering agents such as statins5, 6 have also shown promise in promoting bone formation. These findings suggest that targeting glucose and lipid metabolic pathways may provide novel therapeutic strategies for OI.
Recent studies have highlighted the complex interplay between glucose and lipid metabolism and bone homeostasis. Notably, high-fat diet-induced glucose intolerance leads to dysregulated osteoblast lipid metabolism, resulting in reduced bone formation; this effect can be mitigated by enhanced fatty acid oxidation.7 Furthermore, extracellular metabolites such as lactate, as well as interactions with mesenchymal stromal cells in the tumor microenvironment (TME), exacerbate lipid droplet accumulation in osteosarcoma cells. Targeting PLIN2, a key protein associated with lipid droplet formation, significantly reduces cell viability and increases reactive oxygen species (ROS) production in these cells.8 PLIN2, a protein involved in lipid droplet formation and fatty acid oxidation, has emerged as a critical regulator in lipid metabolism. Specifically, PLIN2 knockdown has been shown to induce lipolysis and increase fatty acid oxidation, making it a promising target in various metabolic disorders.9, 10 Given the dynamic relationship between adipogenesis and osteogenesis, and the potential role of PLIN2 in regulating lipid metabolism and bone cell differentiation, we hypothesize that therapeutic interventions for OI may exert their effects, at least in part, by modulating PLIN2 expression and thereby influencing the balance between osteogenesis and adipogenesis.
Objectives
This study aims to investigate the therapeutic mechanisms of various interventions for OI by analyzing relevant datasets, with a focus on lipid metabolism-related genes, particularly PLIN2, to determine whether they influence the balance between osteoblast and adipocyte differentiation. By elucidating the role of PLIN2 in OI pathogenesis and therapeutic responses, this study seeks to provide novel insights into potential therapeutic targets for OI.
Materials and methods
Datasets
We retrieved datasets from the Gene Expression Omnibus (GEO; https://www.ncbi.nlm.nih.gov/geo/) database to investigate innovative therapeutic strategies aimed at improving bone health in patients with OI. Among these, mesenchymal stem cell (MSC) therapy has demonstrated potential in clinical settings, with studies showing improvements in bone parameters and stimulation of pro-osteogenic responses (GSE157587), whereas other emerging therapies remain largely limited to animal or cell line models. The dataset GSE214064 examines the impact of PLIN2 deficiency on hepatic lipid droplet storage and gene expression in fasted mice, demonstrating that PLIN2 plays a crucial role in regulating lipid droplet size and neutral lipid storage under fasting conditions. The dataset GSE186141 investigates mutations in the COL1A1 and COL1A2 genes and their correlation with clinical phenotypes in a Chinese cohort of patients with OI.
The included datasets comprise genome-wide association study (GWAS) summary statistics related to heel bone mineral densite (BMD), derived from the UK Biobank, a large-scale prospective cohort study. Specifically, UKB-b-4657 was designated as the discovery dataset, whereas UKB-b-1096, UKB-b-8875, and UKB-b-20124 served as validation datasets. All datasets originate from a European population, including both males and females, and were generated in 2018. The variables are continuous and expressed in standard deviations (SD). Sample sizes vary across datasets, ranging from approx. 146,000 to 265,000 individuals, and each dataset includes nearly 9.85 million single-nucleotide polymorphisms (SNPs). These datasets were generated using PHESANT-derived variables from the UK Biobank, based on the hg19/GRCh37 reference genome build. Notably, UKB-b-20124 represents heel BMD T-scores, whereas the remaining datasets correspond to raw BMD measurements.
DEGs analysis methodology
To address the hypothesis that MSC therapy or PLIN2 deficiency alters gene expression profiles relevant to OI pathophysiology, we employed a dual approach using both the online tool GEO2R (https://www.ncbi.nlm.nih.gov/geo/geo2r) and the R package DESeq2 (v. 3.21.1; https://github.com/thelovelab/DESeq2).11 DESeq2 models count data using a negative binomial generalized linear model, which accounts for the variance–mean dependence inherent in RNA-seq data and does not assume normality of raw counts. All DESeq2 analyses were performed using standard workflows and default parameters unless otherwise specified. The primary criteria for identifying differentially expressed genes (DEGs) were defined as a log2 fold change >1 or <−1 and an adjusted p < 0.05. For multiple testing correction, DESeq2 applies the Benjamini–Hochberg procedure to control the false discovery rate (FDR). However, when these stringent log2 fold change thresholds did not yield any DEGs, the selection criteria were relaxed to include genes with an adjusted p < 0.05. This approach ensured the inclusion of potentially relevant genes exhibiting statistically significant differential expression, even with more modest effect sizes.
Data acquisition and preparation
To investigate potential causal relationships between overlapping DEGs identified from OI and PLIN2-related gene expression profiles and heel BMD, we performed Mendelian randomization (MR) analysis. We first identified overlapping DEGs from the GSE186141 dataset, which contains gene expression data from patients with OI. These overlapping genes were subsequently analyzed for their association with heel BMD. GWAS summary statistics for heel BMD were obtained from the UK Biobank. One dataset was designated as the discovery dataset, whereas the remaining datasets served as validation datasets. To facilitate efficient retrieval and management of GWAS data, we used the gwasrapidd R package,12 which enables querying and downloading data from the GWAS Catalog.
MR analysis
To address our hypothesis regarding the causal effects of gene expression on heel BMD, we performed two-sample MR analysis using the TwoSampleMR R package (v. 0.6.17; R Foundation for Statistical Computing, Vienna, Austria).13 This approach uses genetic variants as instrumental variables to infer causal relationships between exposures (gene expression) and outcomes (heel BMD). For each gene, independent SNPs associated with gene expression were selected as instrumental variables. Instrumental variables were selected based on stringent criteria to ensure validity: SNPs were required to have a p < 5 × 10⁻⁸ for association with gene expression and an F-statistic >10 to minimize weak instrument bias. To account for linkage disequilibrium (LD), clumping was performed using PLINK (v. 1.9; https://www.cog-
genomics.org/plink) with a 1000 Genomes Project European reference panel, applying an LD r2 threshold of 0.3 and a clumping window of 1,000 kb to ensure independence of selected SNPs. This procedure reduces multicollinearity among instrumental variables by retaining only independent variants. The inverse variance weighted (IVW) method was used as the primary approach to estimate causal effects, as it provides the most precise estimates when all instrumental variable assumptions are satisfied. This method performs a weighted linear regression of SNP–outcome associations on SNP–exposure associations, with weights inversely proportional to the variance of the SNP–outcome effects. The validity of MR analysis relies on 3 core assumptions for the instrumental variables: 1) relevance (SNPs are associated with the exposure), ensured by the applied p-value and F-statistic thresholds; 2) independence (SNPs are not associated with confounders of the exposure–outcome relationship), supported by the random allocation of genetic variants and further evaluated using MR-Egger regression to detect directional pleiotropy; and 3) exclusion restriction (SNPs influence the outcome only through the exposure), assessed using heterogeneity tests. Regarding the underlying statistical framework, MR assumes linear relationships, homoscedasticity (constant variance of residuals), and normally distributed residuals for valid inference of standard errors (SEs) and p-values. Although these assumptions cannot be directly verified using summary-level data, the application of complementary robust MR methods (e.g., MR-Egger and MR-PRESSO (Mendelian Randomization Pleiotropy RESidual Sum and Outlier)), along with validation across multiple datasets, enhances the robustness of the findings to potential violations. All analyses using the TwoSampleMR package were conducted with default parameters unless otherwise specified.
Statistical analyses and heterogeneity assessment
Causal effects of gene expression on heel BMD were estimated using the IVW method, and statistical significance was assessed using p-values. Heterogeneity among instrumental variables was evaluated using Cochran’s Q statistic. Directional pleiotropy was assessed using MR-Egger regression. Additionally, MR-PRESSO analysis was performed to detect and correct for horizontal pleiotropy.14 A key consideration in MR analyses based on summary-level data is the potential for bias due to sample overlap between exposure and outcome GWAS datasets or residual linkage disequilibrium if clumping is insufficient. Although strict clumping parameters were applied and findings were validated across multiple UK Biobank datasets to mitigate these concerns, these limitations are inherent to analyses based on summary-level data.
SMR integration
To further validate our findings and integrate GWAS summary statistics with expression quantitative trait loci (eQTL) data, we applied the summary data-based Mendelian randomization (SMR) method using default parameters for heterogeneity (I2 < 0.05 and P_HEIDI > 0.01).15 SMR enables the identification of candidate genes for complex traits by integrating GWAS summary statistics with eQTL data. Specifically, SMR tests for pleiotropy, whereby a genetic variant influences both gene expression and a complex trait through a shared underlying causal variant. By applying multiple MR approaches and integrating GWAS and eQTL data, we aimed to comprehensively assess potential causal relationships between the identified overlapping DEGs and heel BMD.
Results
DEGs of MSC therapy on OI
Differentially expressed gene analysis was performed using GEO2R based on the GSE157587 dataset, which examines the effects of MSC therapy in OI. This analysis identified a limited set of 4 potentially significant DEGs: PLIN2, PDK4, ANGPTL4, and HADHA. Notably, the log2 fold change values for these genes were modest, indicating moderate changes in gene expression. Among the identified DEGs, PLIN2 showed the most significant adjusted p-value (adjusted p = 3.290 × 10⁻⁶), with a corresponding p-value of 1.920 × 10⁻¹⁰, lfcSE of 0.0673, test statistic of 6.367, log2 fold change of 0.428, and a baseMean of 6529.790 (Table 1).
DEGs analysis of PLIN2-deficient mice reveals significant transcriptomic alterations
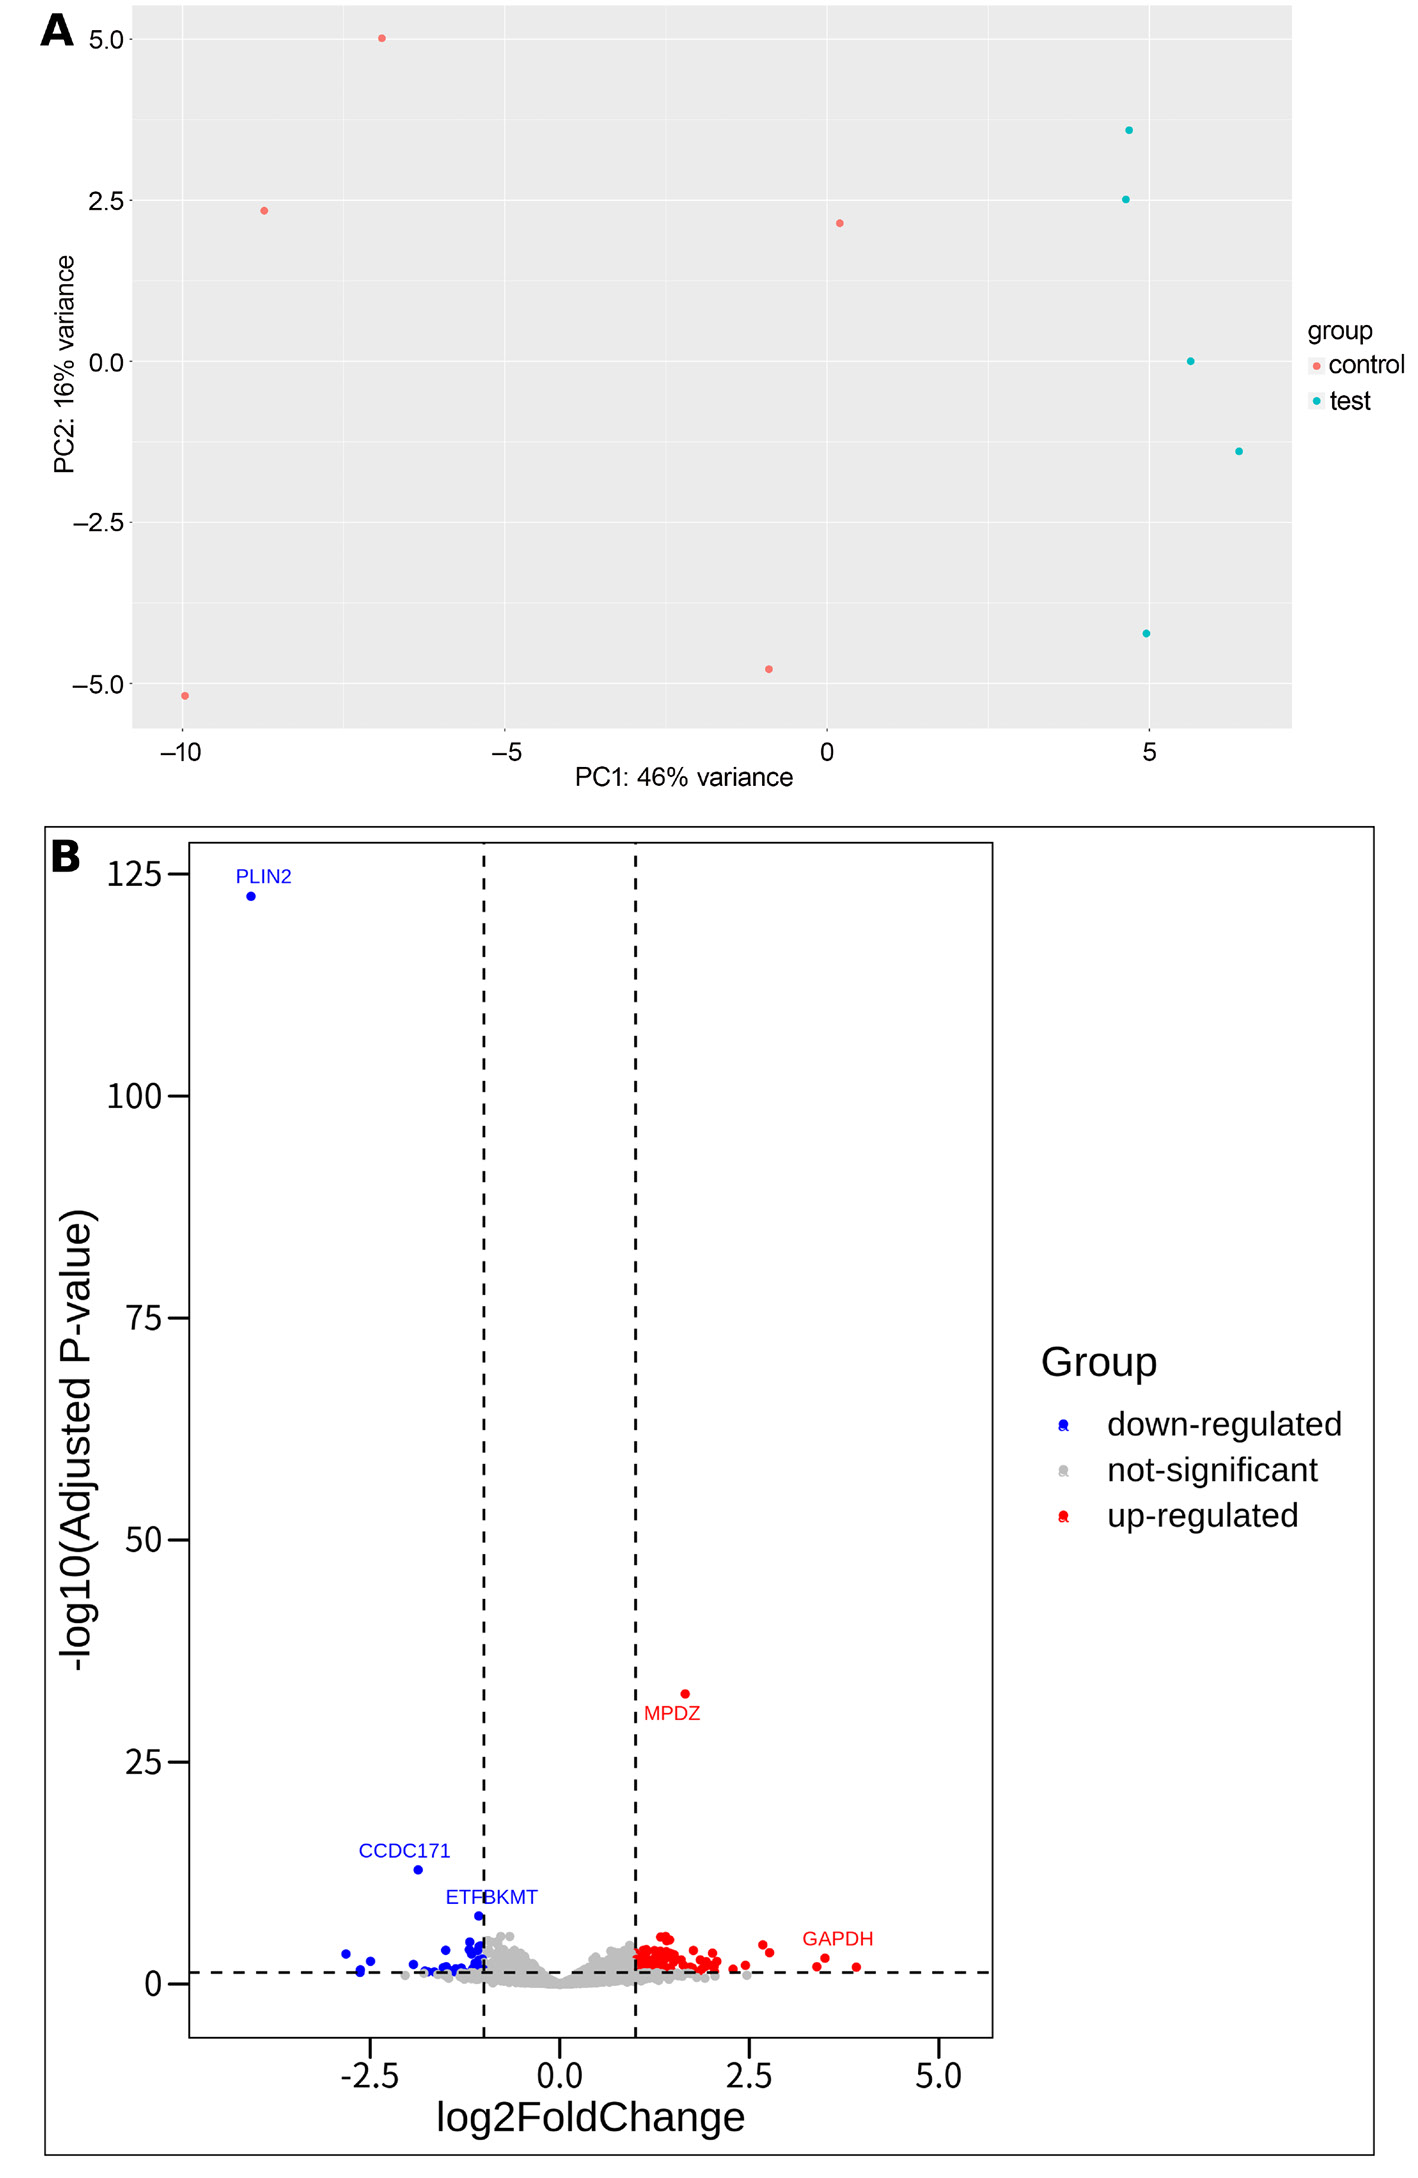
Differentially expressed gene analysis was conducted on the GSE214064 dataset, which examined gene expression differences between PLIN2+/+ and PLIN2−/− mice under 24-h fasting conditions in a C57BL/6N background. The analysis aimed to identify PLIN2-related genes. Transcriptomic data clearly distinguished the PLIN2+/+ and PLIN2−/− sample groups from each other (Figure 1A). The results revealed 43 downregulated and 102 upregulated DEGs with statistical significance. Among the downregulated genes, PLIN2 itself exhibited the most substantial log2 fold change, with a value of −4.074 and an adjusted p = 3.180 × 10−123. Other notable downregulated genes included CCDC171, ETFBKMT, and CCNG2, each demonstrating log2 fold changes greater than −1 and adjusted p < 0.001. Conversely, the upregulated gene list comprised 102 genes, with MPDZ showing the highest log2 fold change of 1.655 and an adjusted p = 2.100 × 10⁻³³. Other significantly upregulated genes included S100A9, ZBP1, and CIRBP, all with log2 fold changes exceeding 1 and adjusted p < 0.001 (Figure 1B).
Overlap of DEGs between OI and PLIN2-related gene expression profiles
Differentially expressed gene analysis was performed on the GSE214064 dataset, which examined gene expression differences between PLIN2+/+ and PLIN2–/– mice under 24-h fasting conditions in a C57BL/6N background. The analysis aimed to identify PLIN2-related genes. Transcriptomic profiling clearly distinguished PLIN2+/+ and PLIN2–/– samples (Figure 1A). A total of 43 downregulated and 102 upregulated DEGs were identified as statistically significant. Among the downregulated genes, PLIN2 exhibited the most substantial log2 fold change (−4.076; adjusted p = 3.180 × 10–123). Other notable downregulated genes included CCDC171, ETFBKMT, and CCNG2, each with log2 fold change <−1 and adjusted p < 0.001. Conversely, 102 genes were significantly upregulated, with MPDZ showing the highest log2 fold change (1.655; adjusted p = 2.100 × 10⁻³³). Other significantly upregulated genes included S100A9, ZBP1, and CIRBP, all with log2 fold change >1 and adjusted p < 0.001 (Figure 1B). The overlap between the PLIN2-related DEGs and genes previously associated with OI is presented in Table 2.
MR analysis results for overlap of DEGs and heel BMD
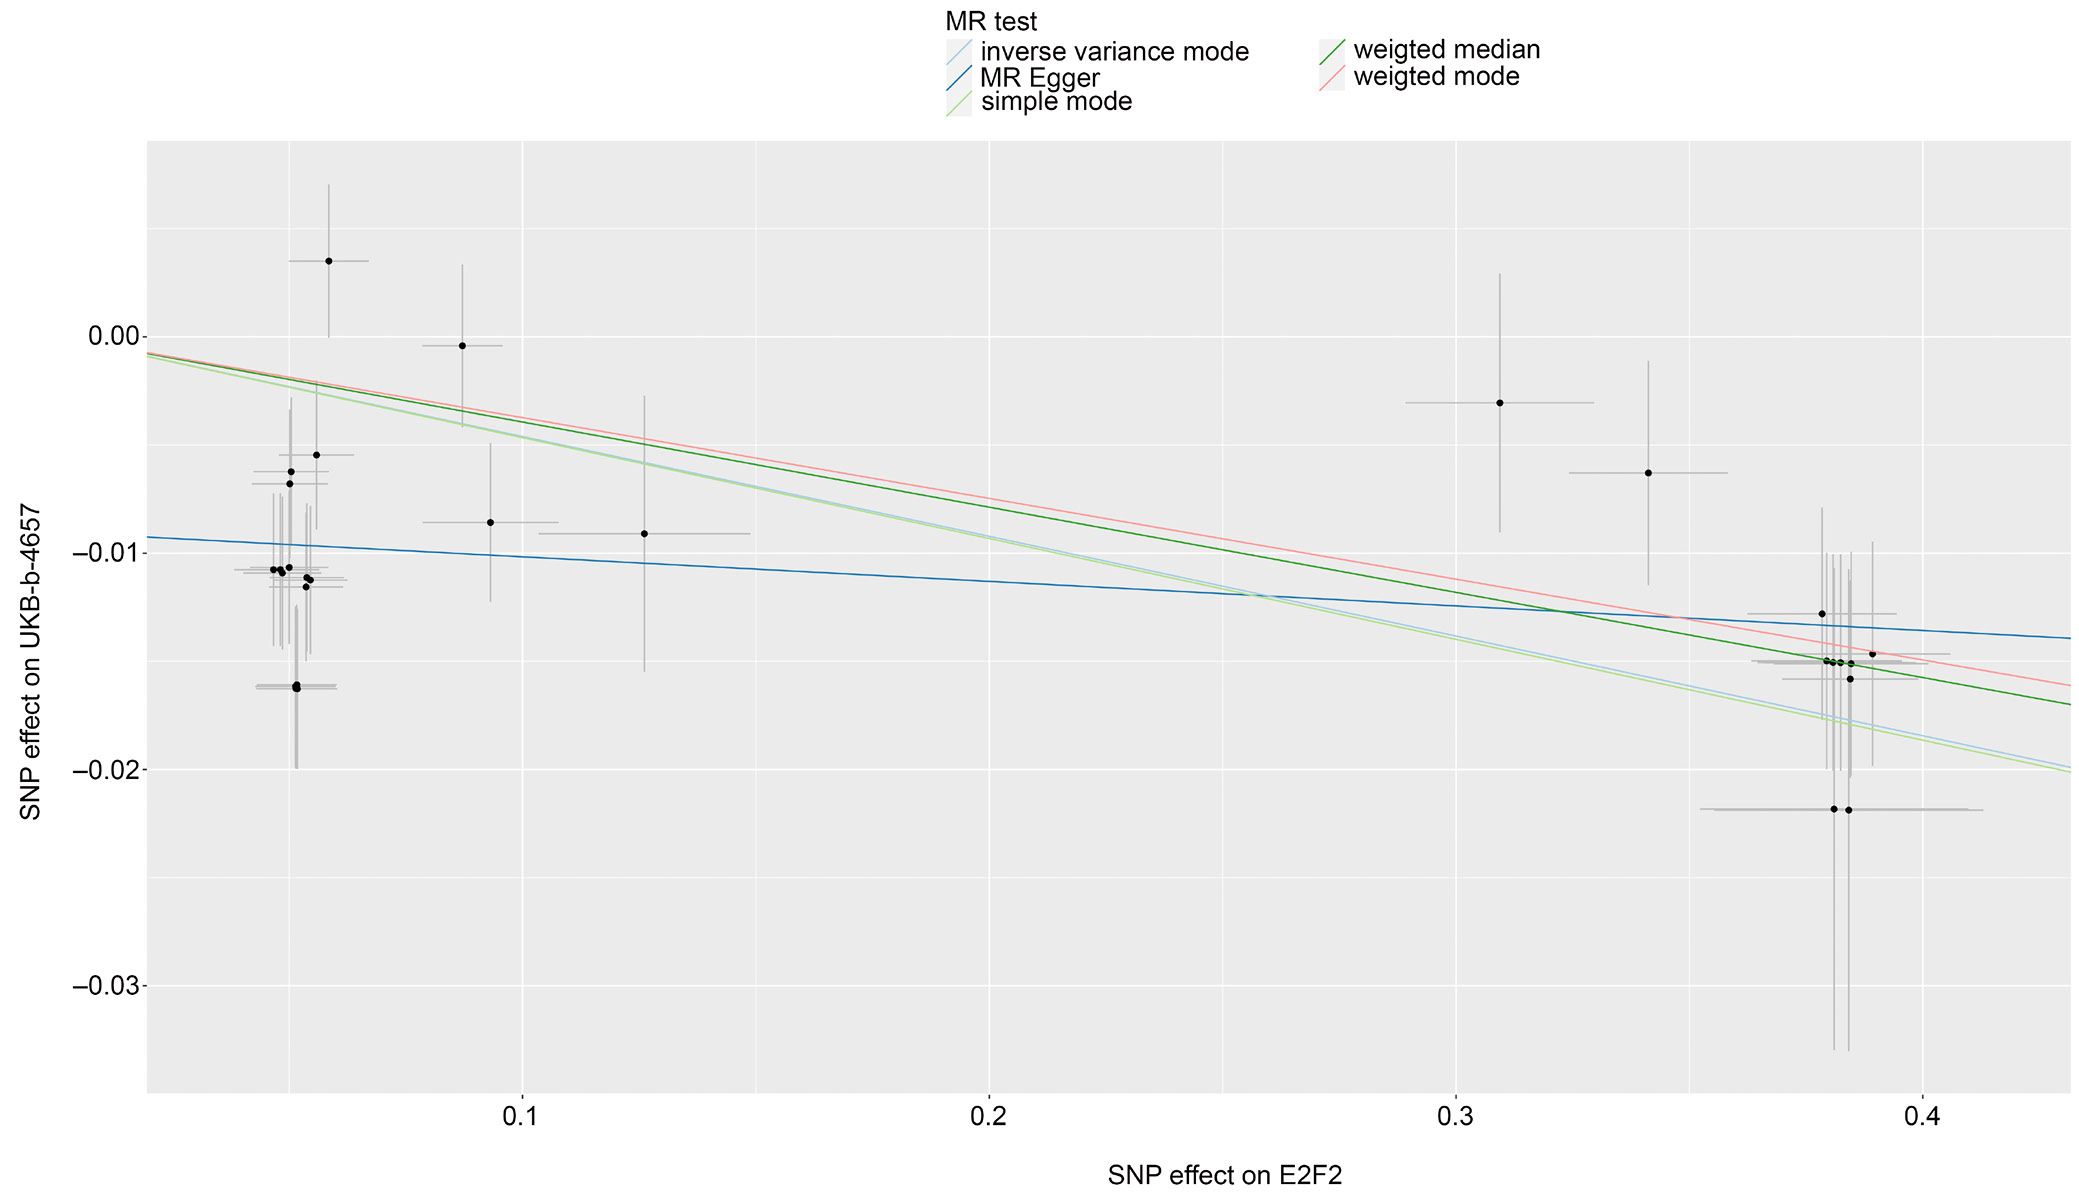
Mendelian randomization analysis of E2F2 was conducted to evaluate its potential causal relationship with heel BMD using UK Biobank data. The UKB-b-4657 dataset served as the discovery dataset, whereas UKB-b-8875, UKB-b-20124, and UKB-b-1096 were used as validation datasets. The IVW method was applied. For each dataset, 29 SNPs were used as instrumental variables. The estimated effect sizes (β coefficients) consistently indicated a negative association between E2F2 expression and heel BMD, suggesting that increased E2F2 expression is associated with lower heel BMD. The p-values across all 4 datasets were highly significant, ranging from 1.116 × 10⁻⁷ to 6.073 × 10⁻⁵, indicating strong statistical evidence for this association. The 95% confidence intervals (95% CIs) for the effect estimates further supported this finding, as all intervals indicated negative effects across datasets. The corresponding odds ratios (ORs) were close to 1 (0.955–0.973), suggesting that although the association is statistically significant, the magnitude of the effect is relatively small (Table 3, Figure 2). No other DEGs showed a causal relationship with heel BMD using the IVW method.
Mendelian randomization analysis of the causal relationship between E2F2 and heel BMD, conducted using the IVW method across 4 UK Biobank datasets (UKB-b-4657, UKB-b-1096, UKB-b-8875, and UKB-b-20124), revealed significant heterogeneity in the causal estimates derived from instrumental SNPs. Specifically, Cochran’s Q statistic and the corresponding p-values indicated substantial heterogeneity across all datasets, with Q p-values ranging from 5.140 × 10⁻¹⁷ to 5.895 × 10⁻¹³ (Table 4). MR-Egger regression analysis further indicated the presence of directional pleiotropy. This conclusion was supported by statistically significant intercept p-values (p < 0.05) across all datasets, suggesting that genetic variants associated with E2F2 may influence heel BMD through pathways other than the hypothesized causal mechanism (Table 5).
The MR-PRESSO analysis for horizontal pleiotropy, examining the causal effect of E2F2 on heel BMD, consistently demonstrated a negative association across all datasets, as indicated by statistically significant p-values (p < 0.001) for the causal estimates. The global test p-value (pGlo), which also remained below 0.001, further supported the overall significance of the observed association (Table 6).
Discussion
Our analysis revealed that PLIN2 is a key gene influenced by MSC therapy in OI, exhibiting the most significant adjusted p-value among the identified DEGs. PLIN2 plays a critical role in lipid droplet formation and storage, thereby influencing cellular lipid metabolism. Given the important role of lipids in cellular energy homeostasis and signaling, particularly in stem cell differentiation,16 modulation of PLIN2 by MSC therapy suggests a potential mechanism for altering the metabolic environment of bone-forming cells in OI. Furthermore, our findings indicate that PLIN2 deficiency leads to substantial transcriptomic changes, underscoring its regulatory role in gene expression.17
The observed interplay between PLIN2 and other DEGs, such as TNFRSF19 and E2F2, which are significantly downregulated in patients with OI but upregulated under PLIN2 knockdown conditions, highlights the complex relationship between lipid metabolism and bone homeostasis.18 This finding suggests that PLIN2 may act as a key regulator of the balance between osteogenic and adipogenic differentiation of MSCs.19 Dysregulation of this balance is a hallmark of OI, in which impaired bone formation is often accompanied by increased adipogenesis.20 Accordingly, PLIN2 emerges as a potential therapeutic target in MSC-based therapies for OI, as its modulation may help restore the balance between bone and adipose tissue formation, thereby improving bone matrix quality and osteoblast function. By targeting PLIN2, MSC therapy may not only enhance bone repair but also mitigate the adverse effects of excessive adipogenesis, potentially leading to more effective and sustained therapeutic outcomes in patients with OI.21
The complex interplay between bone and lipid metabolism is essential for maintaining skeletal health, particularly in conditions such as OI, in which metabolic imbalances may exacerbate disease pathology. Our findings underscore the important role of PLIN2 in this context, consistent with the broader understanding of how lipid metabolism influences bone homeostasis.22 The balance between osteogenesis and adipogenesis is tightly regulated, and its disruption can lead to impaired bone quality and increased fracture risk, as observed in OI.23 The involvement of PLIN2 in lipid metabolism suggests that it may play a key role in this process, potentially influencing the differentiation of MSCs into either osteogenic or adipogenic lineages. This is particularly relevant in OI, where a shift toward adipogenesis may impair effective bone formation.24
Research demonstrates that lipid metabolism is closely linked to bone homeostasis, and disruptions in this balance contribute to OI pathophysiology. For instance, the peroxisome proliferator-activated receptor (PPAR) signaling pathway, a key regulator of adipogenesis and osteogenesis, is influenced by lipid dynamics. Although PLIN5 has been shown to modulate PPAR signaling in oxidative tissues,25 the role of PLIN2 in MSCs and adipocytes suggests that it may indirectly influence this pathway by regulating lipid availability. Specifically, PLIN2 controls the availability of free fatty acids for energy metabolism compared to their storage within lipid droplets. In OI, where a shift toward adipogenesis is commonly observed, modulation of PLIN2 may restrict lipid availability for adipogenic pathways and redirect metabolic resources toward osteogenesis. This balance is critical; by optimizing lipid partitioning, PLIN2 may influence MSC lineage commitment, promoting differentiation toward osteoblasts rather than adipocytes. Bone remodeling involves a tightly regulated interplay between osteoblasts and osteoclasts, with lipid metabolism playing an important regulatory role in this process. Studies indicate that PLIN5 deficiency alters the expression of osteoclastogenesis-related genes, such as RANKL and OPG, thereby affecting bone resorption. In contrast, the role of PLIN2 in lipid storage within the bone microenvironment may indirectly stabilize osteoclast–osteoblast dynamics by modulating the availability of lipid-derived signaling molecules. These molecules, including fatty acids, are known to influence inflammation and oxidative stress – key contributors to the excessive bone fragility observed in OI.26 Accordingly, the regulation of lipid reserves by PLIN2 may support bone remodeling processes in the context of MSC-based therapy. The therapeutic relevance of PLIN2 is further supported by its potential interaction with mitochondrial function, a critical component of energy metabolism in osteoblasts. Previous studies on PLIN5 have highlighted its role in facilitating mitochondrial lipid utilization, thereby influencing adenosine triphosphate (ATP) production and ROS levels. In OI, mitochondrial dysfunction exacerbates oxidative stress and impairs osteogenesis, and PLIN5 deficiency may further aggravate these effects. Although PLIN2 is not directly associated with mitochondria, unlike PLIN5, it contributes to cytoplasmic lipid homeostasis and may indirectly support mitochondrial energy supply. This suggests that PLIN2 could enhance MSC therapy by maintaining the lipid pool required for energy-intensive bone formation.
PLIN2 and PLIN5, both members of the perilipin family, exhibit distinct yet complementary roles in lipid and bone metabolism. PLIN2 primarily regulates lipid droplet storage and hydrolysis in adipocytes and MSCs, whereas PLIN5, which is enriched in oxidative tissues, directs lipids toward mitochondria for β-oxidation. In the context of OI, the predominance of PLIN2 in MSCs positions it as a key regulator of lipid availability, influencing whether these cells differentiate into osteoblasts or adipocytes. In contrast, the mitochondrial role of PLIN5 supports energy metabolism in active osteoblasts and may help mitigate oxidative stress in OI. The interplay between these proteins is evident: PLIN2 maintains the lipid reservoir, whereas PLIN5 facilitates the utilization of these lipids for mitochondrial energy production.
One downstream consequence of the PLIN2-mediated inflammatory response is the upregulation of TNFRSF19, a member of the tumor necrosis factor (TNF) receptor superfamily. Evidence suggests that TNFRSF19 expression is elevated under conditions of increased inflammation and cellular stress, potentially as a compensatory response.27 In the context of PLIN2 deficiency, increased availability of lipid-derived signaling molecules may stimulate TNFRSF19, which has been implicated in the regulation of cell proliferation and survival. Notably, GWAS have identified TNFRSF19 among candidate genes associated with bone biology, alongside genes such as PPARG and FBN2.28 The upregulation of TNFRSF19 under PLIN2 knockdown conditions suggests a potential role in osteoblast or pre-osteoblast proliferation, as TNFRSF19 signaling may promote cell growth in response to inflammatory stimuli. In OI, where bone formation is already impaired, the interplay between PLIN2 deficiency, inflammation, and TNFRSF19 upregulation presents a complex scenario. On the one hand, enhanced osteoblast proliferation driven by TNFRSF19 could potentially improve bone formation and counteract osteopenia. On the other hand, inflammation associated with increased lipid catabolism may offset these benefits by promoting osteoclast activity or impairing bone matrix quality.29 This dual effect highlights the nuanced role of PLIN2 as a regulator of both lipid metabolism and inflammatory tone in the bone microenvironment. The observed upregulation of TNFRSF19 under PLIN2 knockdown conditions, as identified in our analysis, further supports its potential role in modulating bone cell dynamics, although the net outcome – whether anabolic or catabolic – likely depends on the balance between these competing processes. From a therapeutic perspective, these findings reinforce the importance of PLIN2 as a target in MSC-based therapy for OI. Preservation of PLIN2 function may help mitigate excessive lipolysis and inflammation, thereby limiting downstream activation of TNFRSF19 and its uncertain effects on bone cell proliferation. Alternatively, if the proliferative effects of TNFRSF19 prove beneficial, a combined strategy involving PLIN2 modulation and targeted TNFRSF19 agonists may enhance osteogenesis while maintaining control over inflammation. This hypothesis is supported by evidence that TNFRSF19 contributes to bone biology and that PLIN2 deficiency amplifies inflammatory signaling, underscoring the need for further studies to clarify these interactions.
The downregulation of E2F2 in OI is consistent with its established role in bone and cartilage biology. E2F2, a transcription factor, is involved in cell cycle regulation and differentiation, with studies demonstrating its impact on skeletal tissues. For example, constitutive overexpression of E2F2 inhibits chondrocyte differentiation and delays endochondral ossification.30 These findings suggest that reduced E2F2 expression in OI may reflect impaired chondrocyte or osteoblast differentiation, thereby contributing to the characteristic bone fragility observed in this disease. Conversely, the upregulation of E2F2 under PLIN2 knockdown conditions indicates that PLIN2 may normally suppress E2F2, potentially maintaining a balance that favors osteogenesis over excessive proliferation or adipogenesis. This relationship is particularly relevant given the role of PLIN2 in lipid metabolism, which influences MSC fate. Mechanistically, E2F2 regulates osteogenesis and adipogenesis through its control of cell cycle progression and progenitor cell proliferation. By governing the transition from proliferation to differentiation, E2F2 may define the temporal window during which MSCs commit to either osteogenic or adipogenic lineages. In OI, altered E2F2 expression may disrupt this critical timing, thereby contributing to the imbalance in bone formation. Further evidence supports the therapeutic relevance of E2F2 in skeletal disorders. In traumatic osteoarthritis, exosomes enriched with miR-125a-5p derived from MSCs target E2F2 to suppress chondrocyte degeneration, suggesting a protective effect associated with E2F2 downregulation.31 Similarly, in osteoarthritis prevention, long noncoding RNA (lncRNA) PTS-1 inhibits E2F2 via the miR-8085/E2F2 axis, thereby promoting cartilage homeostasis.32 These findings contrast with OI, in which E2F2 downregulation may exacerbate bone defects, highlighting context-dependent effects. In fracture healing, quercetin modulates the miR-6089/E2F2 axis to enhance osteoblast viability, proliferation, migration, and differentiation,33 suggesting that increased E2F2 expression may be beneficial in certain regenerative contexts. The upregulation of E2F2 following PLIN2 loss may therefore represent a compensatory mechanism in OI, aimed at enhancing osteoblast activity, although potentially at the expense of increased inflammation or dysregulated differentiation. Mendelian randomization analysis further elucidates the causal relationship between E2F2 and bone health. Across 4 UK Biobank datasets, E2F2 expression consistently demonstrated a negative association with heel BMD, with statistically significant p-values (from 1.116 × 10⁻⁷ to 6.073 × 10⁻⁵) and effect estimates indicating that higher E2F2 expression is associated with lower BMD. This finding is consistent with the inhibitory role of E2F2 in chondrocyte differentiation and suggests that E2F2 downregulation in OI may represent a compensatory mechanism aimed at preserving BMD, despite the osteopenic phenotype of the disease. However, the relatively small effect sizes (ORs: 0.955–0.973) indicate a modest magnitude of association. Moreover, the presence of significant heterogeneity and directional pleiotropy suggests that additional biological pathways may contribute to this relationship, thereby complicating its potential as a therapeutic target. This heterogeneity indicates that the causal effect estimates across instrumental variables are not fully consistent, which may arise from several factors. Potential explanations include residual confounding, differences in genetic architecture or environmental exposures within UK Biobank subpopulations, and horizontal pleiotropy, whereby SNPs influence the outcome through pathways independent of the exposure. Although MR-Egger and MR-PRESSO analyses were applied to detect and partially account for pleiotropy, residual pleiotropic effects or context-specific genetic interactions may still contribute to the observed variability. These findings suggest that the relationship between E2F2 and BMD is multifactorial and likely governed by complex biological networks, rather than a single causal pathway. Accordingly, while the MR analysis supports a causal association, the magnitude and generalizability of this effect should be interpreted with caution. Future studies incorporating individual-level data or stratified population analyses are warranted to further elucidate the sources of heterogeneity and refine causal inference.
Mesenchymal stem cell therapy has attracted considerable attention as a potential treatment for OI due to its capacity to differentiate into osteoblasts, home to sites of injury, and exert paracrine effects on recipient tissues. These properties, together with a favorable safety profile, multilineage differentiation potential, low immunogenicity, and relative ease of manufacturing, position MSCs as a promising therapeutic platform for OI. Fetal-derived MSCs, in particular, exhibit enhanced osteogenic potential compared with adult-derived MSCs, as supported by preclinical and early clinical studies demonstrating improved bone formation and potential clinical benefits following intravenous administration.34 Despite these advantages, the therapeutic efficacy of MSC therapy in OI remains limited, with outcomes that are often modest, variable, and insufficiently durable, thereby hindering broader clinical translation. Evidence from multiple studies highlights these limitations. Although MSC therapy shows promise, including the superior bone-forming capacity of fetal MSCs, consistent and sustained clinical benefit has not been reliably achieved. More broadly, analyses of clinical-stage MSC therapies indicate that many fail to meet primary efficacy endpoints, suggesting that the intrinsic therapeutic potency of MSCs in humans may be lower than that predicted by preclinical models.35 This discrepancy may be attributed to heterogeneity arising at multiple stages of cell therapy development, including cell sourcing, expansion, and delivery, all of which can undermine consistency and therapeutic efficacy. In osteoarthritis, MSC injections have been shown to improve clinical outcomes such as pain and joint function; however, magnetic resonance imaging (MRI) typically demonstrates only minimal structural improvement, suggesting that functional benefits may not translate into durable tissue repair.36 Similarly, clinical trials of MSC therapy in osteoarthritis and rheumatoid arthritis report improvements in joint function, pain reduction, and quality of life without major adverse effects. Nevertheless, the magnitude of these benefits varies, and their long-term durability remains uncertain.37 Additional challenges include age-related declines in MSC potency and the risk of immune responses associated with allogeneic MSCs.38 Taken together, these findings indicate that although MSC therapy provides measurable benefits, its effects are often insufficient or unstable for addressing complex underlying pathologies such as OI. Accordingly, the inconsistent and modest efficacy of MSC-based approaches highlights the need to target key regulatory genes, including PLIN2 and E2F2, to enhance osteogenesis and improve therapeutic stability, potentially through combinatorial strategies or MSC engineering.
Future directions and clinical relevance
Our study, primarily computational in nature, identifies PLIN2 and E2F2 as promising therapeutic targets in OI and suggests novel strategies to enhance MSC-based therapies by promoting osteogenesis and improving the stability of therapeutic outcomes. Future research should prioritize experimental validation of these findings using both in vitro and in vivo models to confirm the causal roles of PLIN2 and E2F2 in osteoblast and adipocyte differentiation. Further investigation into the molecular mechanisms by which modulation of these genes affects bone quality and fracture healing is warranted. Ultimately, these insights may facilitate the development of more targeted and effective MSC-based interventions for OI, supporting the advancement of personalized therapeutic approaches aimed at optimizing bone health and reducing disease burden.
Limitations of the study
Although our bioinformatics analysis provides valuable insights into the roles of PLIN2 and E2F2 in OI and their potential as therapeutic targets, it is inherently limited by its reliance on computational methods and publicly available datasets. The identification of DEGs and the causal associations inferred from MR analyses are based on statistical relationships rather than direct experimental evidence, and therefore should be interpreted with caution.
Factors such as sample heterogeneity, batch effects, and unmeasured confounders may have influenced the observed expression patterns and associations. Moreover, the upregulation of E2F2 and TNFRSF19 under PLIN2 knockdown conditions, contrasted with their downregulation in OI, suggests a complex regulatory interplay that requires functional validation. Further experimental studies – including in vitro assays using MSC models, in vivo PLIN2 knockout models, and histological analyses of bone formation – are necessary to elucidate the mechanistic role of PLIN2 in lipid metabolism and the impact of E2F2 on osteoblast differentiation and BMD. In addition, clinical translation will require well-designed trials to evaluate the feasibility and efficacy of targeting these pathways in MSC-based therapies, ensuring that bioinformatics-derived hypotheses are validated by robust experimental and clinical evidence.
Conclusions
Our study highlights the pivotal role of PLIN2 in regulating lipid metabolism and MSC fate in OI, with E2F2 emerging as a key downstream regulator that influences bone cell dynamics and BMD. The overlap of DEGs between OI and PLIN2-related profiles, together with MR evidence linking E2F2 to skeletal traits, underscores their therapeutic relevance. Despite the promise of MSC-based therapies for OI, their efficacy remains modest and variable, characterized by transient clinical benefits, inconsistent outcomes, limited structural repair, and potential immunological challenges. These limitations highlight the need for more targeted and mechanistically informed approaches. We propose that PLIN2 and E2F2 represent critical molecular targets for enhancing MSC therapy. Precise modulation of PLIN2 to optimize lipid metabolism, together with regulation of E2F2-mediated differentiation pathways, may improve osteogenic potential and promote more durable therapeutic effects. Although these findings provide a compelling framework, experimental and clinical validation is essential to translate bioinformatics-driven insights into effective therapeutic strategies, ultimately improving skeletal outcomes in patients with OI.
Data Availability Statement
All data used in this study are derived from publicly available repositories. This study analyzed datasets from the Gene Expression Omnibus (GEO; GSE157587, GSE214064, GSE186141) and UK Biobank genome-wide association study (GWAS) summary statistics (UKB-b-4657, UKB-b-1096, UKB-b-8875, UKB-b-20124).
Consent for publication
Not applicable.
Use of AI and AI-assisted technologies
Not applicable.