Abstract
Background. Thrombocytopenia remains a significant problem in patients with cardiovascular disease (CVD) due to the indispensable use of antiplatelet therapy.
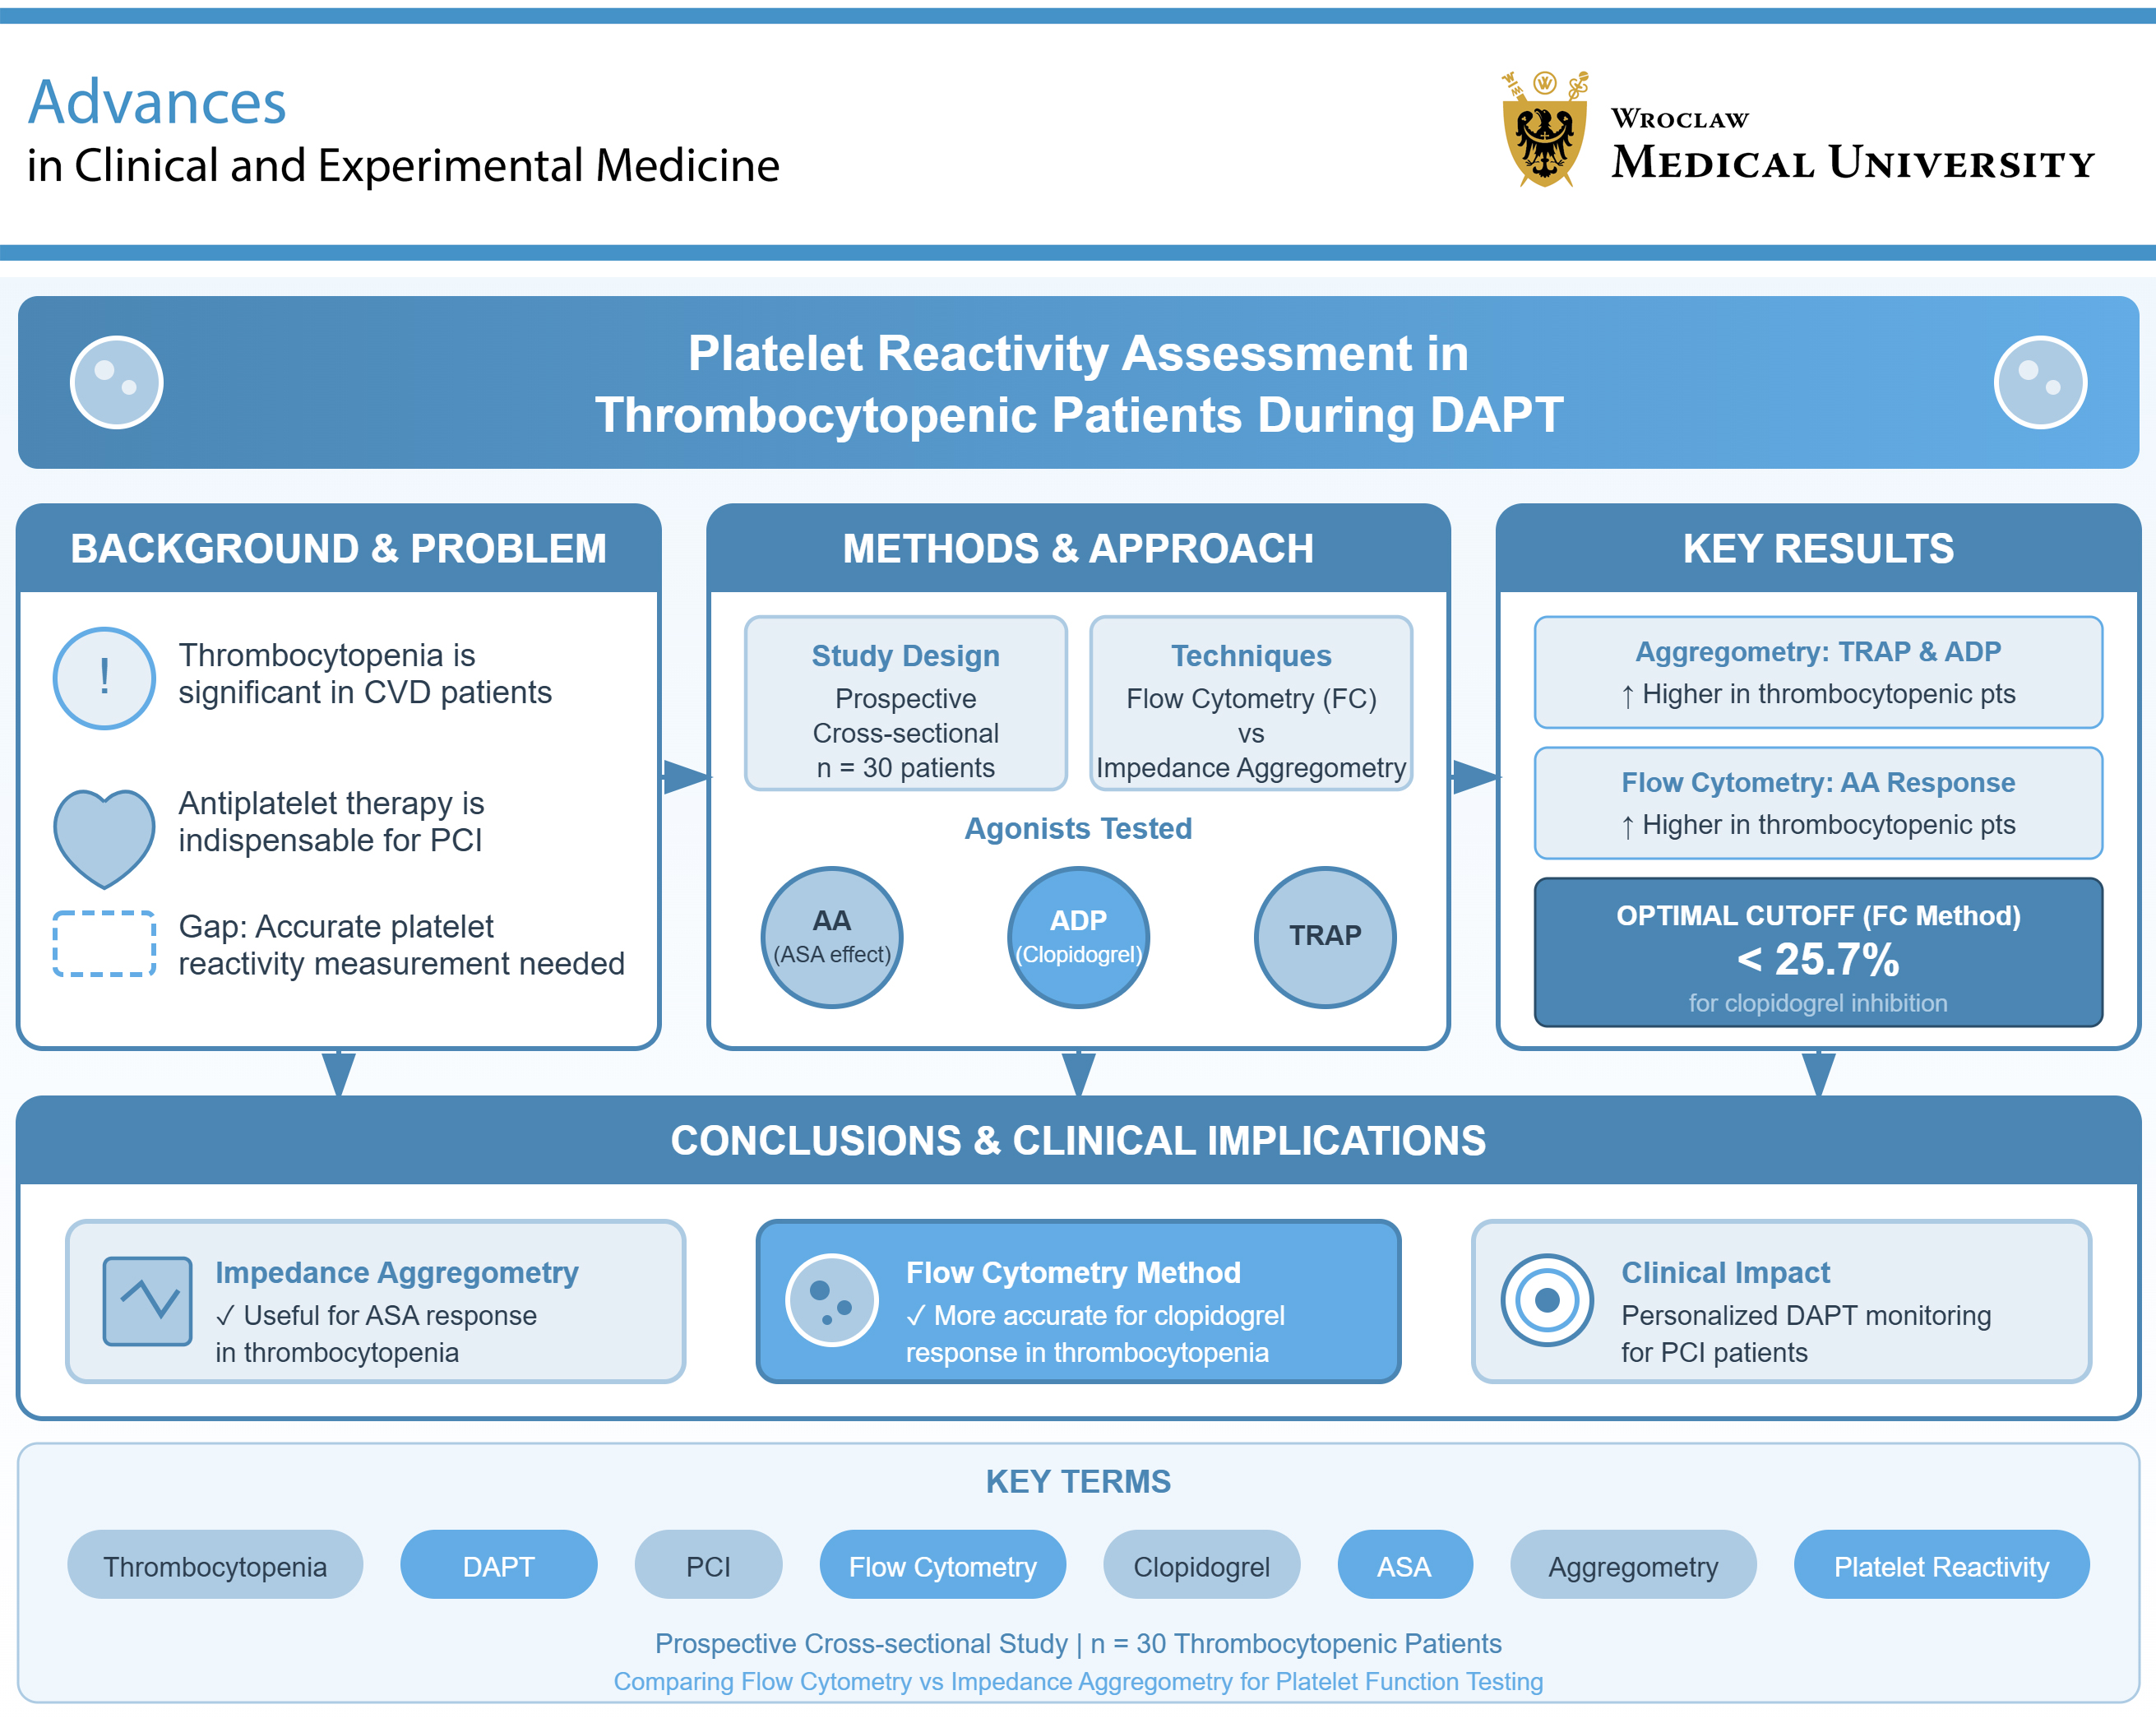
Objectives. The aim of this study was to establish a novel flow cytometry (FC)-based method for measuring platelet reactivity during dual antiplatelet therapy (DAPT) and to compare it with impedance aggregometry (IA) in thrombocytopenic patients undergoing percutaneous coronary intervention (PCI).
Materials and methods. This prospective cross-sectional study included 30 patients with thrombocytopenia. Platelet aggregation was assessed using IA and FC.
Results. A similar response to arachidonic acid (AA), reflecting the effect of acetylsalicylic acid (ASA), was observed in both groups. Responses to thrombin receptor agonist peptide (TRAP) and adenosine diphosphate (ADP), measured with aggregometry, were significantly higher in thrombocytopenic patients than in patients with normal platelet counts. When the FC method was used, the response to AA was significantly higher in thrombocytopenic patients. The optimal cut-off value for the FC method to define adequate platelet reactivity inhibition with clopidogrel in thrombocytopenic patients was <25.7%.
Conclusions. In patients with thrombocytopenia, IA is useful for assessing ASA response, whereas the presented FC method may be more accurate for evaluating response to clopidogrel.
Key words: percutaneous coronary intervention, thrombocytopenia, dual antiplatelet therapy
Background
Antiplatelet therapy is a key component of pharmacologic treatment in patients with atherosclerotic vascular disease, as it reduces platelet activation and aggregation and thereby lowers the risk of thrombotic events. However, this approach is inherently associated with an increased risk of bleeding, making the balance between thrombotic protection and hemorrhagic complications particularly challenging in high-risk populations with thrombocytopenia. This issue is especially pronounced after percutaneous coronary intervention (PCI) with stent implantation, where dual antiplatelet therapy (DAPT) with acetylsalicylic acid (ASA) and clopidogrel is recommended for 6 months. However, robust evidence to guide DAPT management in patients with thrombocytopenia is lacking. The available literature is largely limited to individual case reports, small case series, and expert opinions, with a notable lack of evidence-based guidelines or randomized controlled trials (RCTs) supporting tailored long-term antiplatelet therapy in this population.1, 2, 3, 4, 5, 6
One proposed approach to optimize ASA and clopidogrel therapy involves monitoring platelet inhibition using aggregometry.7 This technique has been extensively studied in patients with normal platelet counts and has demonstrated robust utility in characterizing platelet function and assessing responsiveness to antiplatelet therapy. However, current clinical guidelines do not recommend its routine use after PCI. Instead, platelet reactivity assessment is reserved for selected high-risk populations, such as patients undergoing urgent coronary artery bypass grafting while receiving DAPT.8 Although thrombocytopenia is relatively uncommon among patients undergoing coronary interventions, platelet function monitoring may be justified in this subgroup to achieve an appropriate balance between antithrombotic efficacy and bleeding risk. This consideration is particularly relevant because thrombocytopenia is independently associated with adverse outcomes in patients hospitalized with cardiovascular disease (CVD).9
A major limitation of conventional aggregometry is that commercially available systems are validated only for platelet counts from 150,000/mm3 to 450,000/mm3. An alternative approach to address this limitation is the use of flow cytometry (FC)-based platelet reactivity assessment, which allows for evaluation of platelet activation independently of the absolute platelet count. Although FC remains technically demanding and has not yet been implemented as a point-of-care assay, it has consistently demonstrated superior sensitivity for detecting alterations in platelet reactivity.
Objectives
This study aimed to establish a novel FC-based method for assessing platelet reactivity during DAPT and to compare its performance with impedance aggregometry (IA) in patients with thrombocytopenia undergoing PCI.
Materials and methods
Patients selection
This prospective cross-sectional study was conducted in patients with thrombocytopenia undergoing PCI. Inclusion criteria were a platelet count <150,000/mm3, recent PCI, and treatment with DAPT. Exclusion criteria included the use of additional systemic anticoagulation. Patients who met all inclusion criteria, had no exclusion criteria, and provided written informed consent were enrolled. The control group comprised healthy volunteers not receiving antiplatelet therapy and patients with normal platelet counts who had recently undergone PCI and were treated with DAPT. All participants had blood samples collected in the early morning after fasting for at least 6 h.
Impedance aggregometry
Blood samples for platelet aggregation assessment were collected at the following time points: pre-PCI and at 24 h, 7 days, and 30 days after the procedure. Platelet aggregation was measured using a Multiplate® impedance aggregometer (Roche Diagnostics, Basel, Switzerland). Blood was collected into tubes containing hirudin (25 µg/mL) as an anticoagulant (Roche Diagnostics). The agonists used for aggregation were arachidonic acid (AA) 0.5 mM, adenosine diphosphate (ADP) 6.4 µM, collagen (COL) 3.2 µg/mL, and thrombin receptor agonist peptide (TRAP) 32 µM. All reagents were provided by the manufacturer (Roche Diagnostics). Aggregation was performed within 2 h of blood collection and recorded as the area under the curve (AUC). Each test was performed in duplicate, and the mean value was used for analysis. If the difference between the 2 measurements exceeded 10%, the result was discarded and the measurement was repeated. Response to ASA was evaluated using AA-induced platelet aggregation, whereas response to clopidogrel was assessed using ADP-induced aggregation. Based on previously published thresholds, incomplete response to clopidogrel was defined as aggregation >48 AU and incomplete response to ASA as aggregation >30 AU.10, 11
Flow cytometry method
Plasma from a single male donor (blood group AB, RhD positive) was used as the matrix for all flow cytometric platelet aggregation experiments, following the protocol described by Vinholt et al.12 Donor plasma was obtained by double centrifugation of citrate-anticoagulated whole blood at 1,000 × g for 10 min. The resulting plasma was aliquoted into 150-µL portions and stored at −80°C. Peripheral blood from study participants was collected into BD Vacutainer® tubes (BD Biosciences, Franklin Lakes, USA)containing 0.109 M trisodium citrate for platelet function testing or ethylenediaminetetraacetic acid (EDTA) for hematologic analysis. Platelet-rich plasma (PRP) was prepared by centrifuging citrate-anticoagulated blood at 200 × g for 15 min at 37°C. Platelet counts in PRP were measured using a Sysmex XN-2000 analyzer (Sysmex Corporation, Kobe, Japan).
Platelet-rich plasma was subsequently divided into 2 fractions containing 144 × 103/µL and 16 × 103/µL platelets, respectively. In patients with peripheral platelet counts <150 × 103/µL, proportional reductions in fraction volumes were applied (eg, 72 × 103/µL and 8 × 10³/µL). The PRP fractions were diluted to the target platelet concentration with a physiologic buffer (NaCl 134 mM, KCl 2.9 mM, MgCl2 1 mM, glucose 5.6 mM, and HEPES 20 mM; pH 7.4) and labeled with either calcein-AM ultrapure grade (CAMU; detected in fluorescein isothiocyanate (FITC)) or calcein-AM Violet 450 (CV450; detected in V450) (both from eBioscience, San Diego, USA). A 500-µL aliquot of the 144 × 103/µL fraction was stained with 10 µL of CV450 (working solution, 0.2 µM in dimethyl sulfoxide (DMSO)), and a 500-µL aliquot of the 16 × 103/µL fraction was stained with 10 µL of CAMU (working solution, 10 µM in DMSO). Labeling was performed for 15 min at 37°C in the dark with shaking at 600 rpm (BioSan Thermo-Shaker TS-100; Biosan, Riga, Latvia).
For the FC aggregation assay, 35 µL of thawed donor plasma was mixed with 17.5 µL of each labeled platelet fraction in 1.5-mL Eppendorf® tubes (Eppendorf SE, Hamburg, Germany). Subsequently, 2.5 µL of ADP, 2.5 µL of TRAP, or 25 µL of AA (Roche ADPtest, TRAPtest, and ASPItest, respectively; Roche Diagnostics) was added, yielding a final concentrations of ADP 6.5 µM, TRAP 32 µM, and AA 0.56 mM. Samples were incubated for 5 min at 37°C with shaking at 600 rpm. A 4th tube, processed identically but without agonist, served as a negative control (NC).
After incubation, 1 mL of fixation buffer (0.2% formaldehyde in dilution buffer) was added, and samples were transferred to FC tubes. Acquisition was performed using a FACSCanto 10-color (uncompensated) flow cytometer, and data were analyzed using FACSDiva software (both from BD Biosciences).
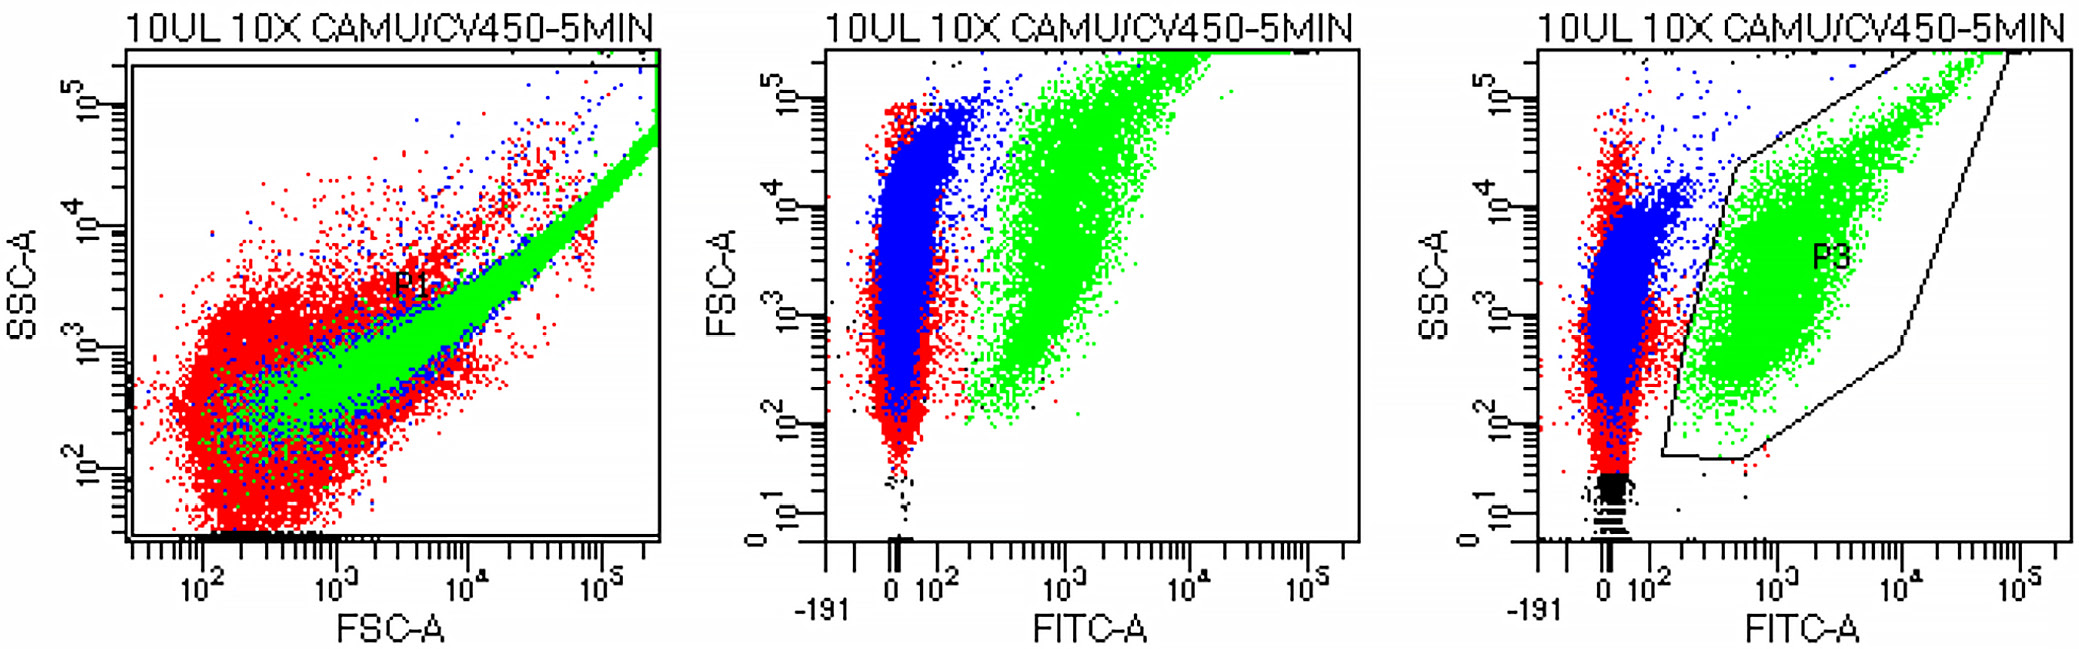
Gating strategy
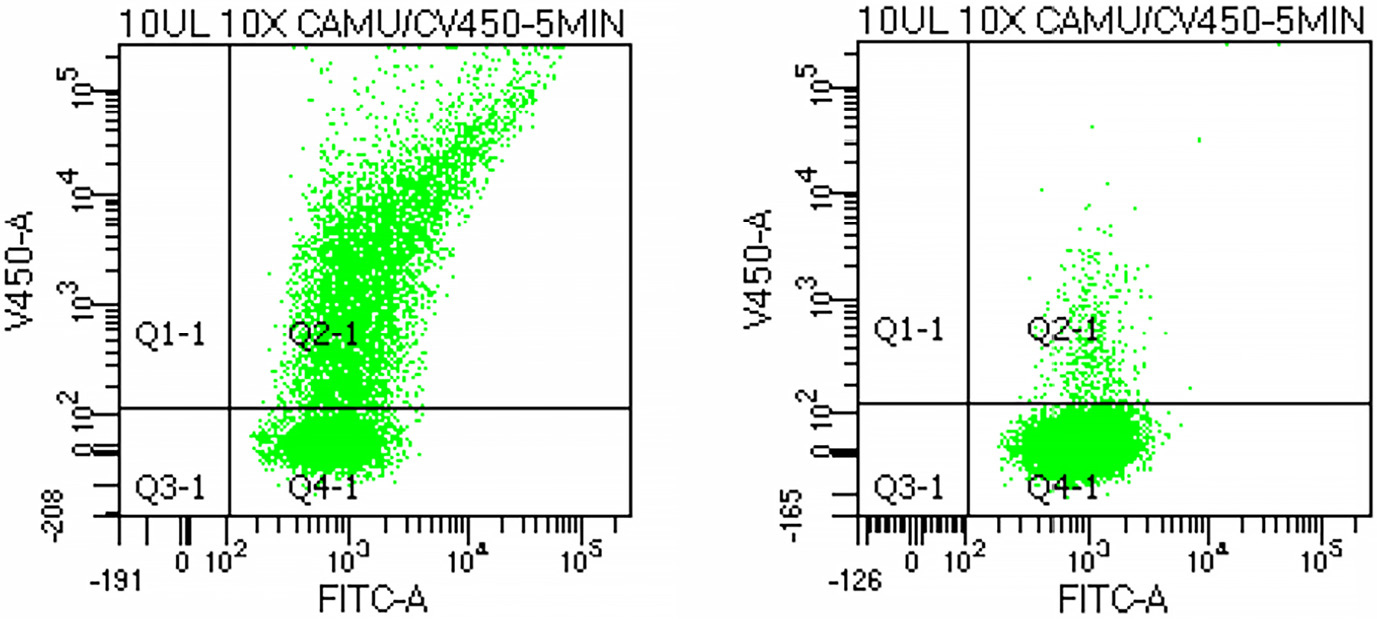
The platelet population was initially identified on a forward scatter (FSC) vs side scatter (SSC) plot and subsequently confirmed on an FSC vs FITC plot corresponding to CAMU-labeled platelets (Figure 1). The platelet gate (P3) was defined on the SSC vs FITC plot, and 10,000 events were acquired within this gate. Platelet aggregation was quantified as the proportion of double-positive (CAMU+/CV450+) events relative to all CAMU-positive platelets. Representative results showed 60.8% aggregation following ADP stimulation and 4.6% in the unstimulated control (Figure 2).
Statistical analyses
Statistical analysis was performed using Statistica v. 9.0 (StatSoft Inc., Tulsa, USA). For all patients, means and standard deviations (SDs) were calculated, and the distribution of variables was assessed using the Shapiro–Wilk test (Supplementary Table 1). Levene’s test was used to evaluate homogeneity of variance. Differences between independent groups were analyzed using the Student’s t-test for normally distributed variables and the Mann–Whitney U test for non-normally distributed variables (Supplementary Table 2). For dichotomous variables, differences between groups were assessed using the χ2 test with Yates’ correction or the Fisher’s exact test, as appropriate. Receiver operating characteristic (ROC) curve analysis was also performed. Correlations between variables were assessed using the Pearson’s and the Spearman’s test, as appropriate.
Results
The study included 30 patients with thrombocytopenia and 24 patients with normal platelet counts. Detailed characteristics of both groups are presented in Table 1. Patients with thrombocytopenia had significantly lower platelet counts (p < 0.001) and were more likely to have kidney failure (p = 0.014) and a history of coronary artery bypass grafting (CABG; p = 0.042) than patients with normal platelet counts, whereas other clinical characteristics were similar.
The control cohort (healthy volunteers) had a mean (±SD) age of 29 (±5) years and a mean platelet count of 225,000 (48,000)/mm3. The predominant causes of thrombocytopenia were idiopathic thrombocytopenia (n = 11), chronic leukemia (n = 1), and thrombocytopenia of unknown origin or under diagnostic evaluation (n = 18). Platelet reactivity findings are summarized in Table 2. AA-induced aggregation (reflecting ASA effect) did not differ significantly between the 2 groups. In contrast, TRAP- and ADP-induced aggregation measured with IA was significantly higher in patients with thrombocytopenia than in those with normal platelet counts.
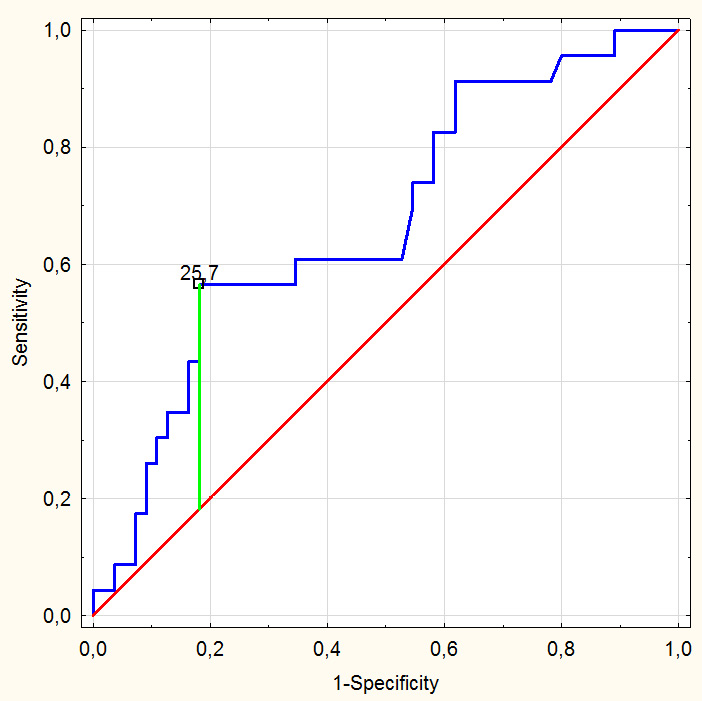
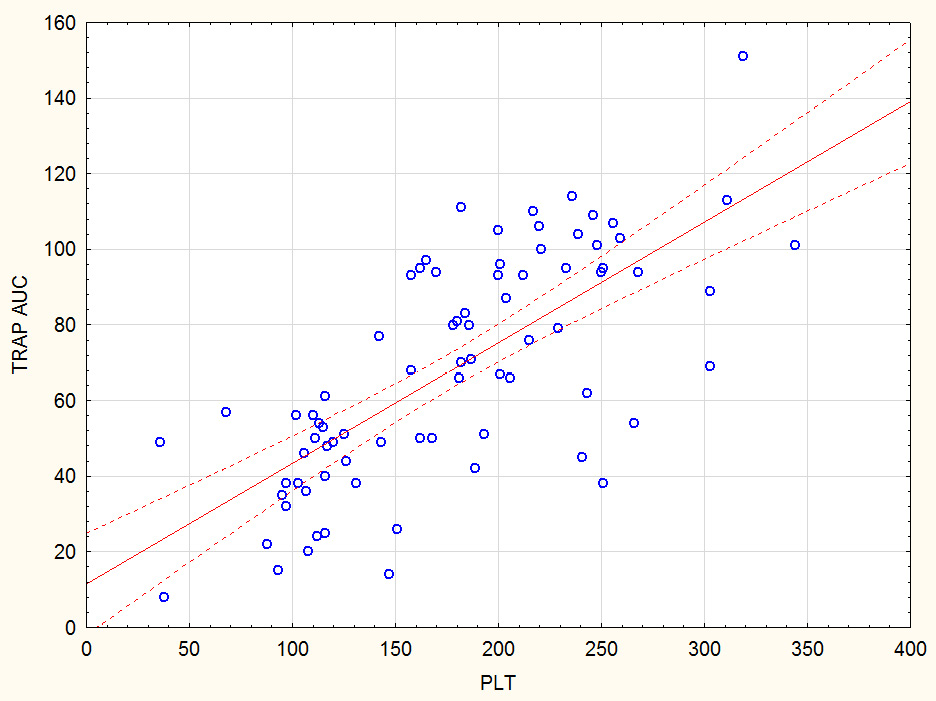
In the FC assay, ADP- and TRAP-induced responses were comparable between groups, whereas the AA-induced response was significantly higher in patients with thrombocytopenia. In patients with normal platelet counts, an optimal response to clopidogrel assessed using Multiplate aggregometry was defined as <48 AU. Receiver operating characteristic analysis showed that in patients with thrombocytopenia, the optimal FC cut-off indicating adequate P2Y12 inhibition was <25.7% (AUC = 0.75; sensitivity 60%; specificity 80%) (Figure 3). Using this threshold, 7 patients (23%) with thrombocytopenia had an inadequate response to clopidogrel despite low platelet counts. Correlation analysis showed a moderate association between platelet count and TRAP-induced aggregation in the pooled cohort (r = 0.62 for TRAP AUC; p < 0.05) and a weak association between platelet count and ADP-induced aggregation (r = 0.33 for ADP AUC; p < 0.05) (Figure 4).
Discussion
Our results indicate no significant difference in ASA response measured using IA between patients with thrombocytopenia and controls. Similarly, clopidogrel response assessed using the FC-based aggregation method did not differ between groups. In contrast, ASA responsiveness differed significantly when evaluated with FC, whereas clopidogrel responsiveness differed significantly when assessed using IA. These findings suggest that in patients with thrombocytopenia, ASA reactivity is more reliably assessed using IA, whereas clopidogrel reactivity is better evaluated using the FC-based assay. Currently available aggregometers are not fully adapted for use in patients with low platelet counts. To address this limitation, several investigators have proposed correction formulas to adjust IA results in thrombocytopenia. Shultz-Lebahn et al. diluted healthy donor blood to simulate thrombocytopenia and demonstrated strong correlations between platelet count and aggregation responses to COL, ADP, and TRAP.13 A similar approach was reported by Rubak et al.14 Previous studies suggest that FC-based methods are largely independent of platelet count.15 Skipper et al. demonstrated that platelet function assessed by FC showed minimal variability across platelet count ranges.16 Likewise, Frelinger et al. reported that in immune thrombocytopenia, FC-based platelet function remained stable across platelet count ranges.17 In this study, a moderate correlation was observed between TRAP-induced aggregation and platelet count, whereas weak or no correlation was found for ADP- and AA-induced aggregation, respectively. This finding may reflect the inclusion of patients with true clinical thrombocytopenia, as well as the influence of DAPT. TRAP-induced aggregation assesses platelet reactivity independently of P2Y12 or COX-1 blockade and therefore shows a continuous relationship between platelet count and aggregation amplitude. Skipper et al. developed mathematical formulas in a mixed cohort of patients with normal and low platelet counts to adjust IA results to equivalent values at normal platelet counts11; however, this approach requires further clinical validation. In this study, we used the FC method described by Vinholt et al.12, as it appears to circumvent the technical limitations of IA by evaluating washed platelet populations with count-independent analytical performance. Based on published evidence and our data, we established a cut-off value for clopidogrel-induced platelet reactivity in patients with thrombocytopenia.18 Despite low platelet counts, 7 patients (24%) demonstrated inadequate P2Y12 receptor inhibition according to this FC-derived threshold. This finding is clinically relevant, as patients with thrombocytopenia are known to have an elevated risk of recurrent cardiovascular events.19
Limitations of the study
Because thrombocytopenia is relatively uncommon in the general population, including patients with CVD, the study group was small. Nevertheless, the study provides clinically relevant insights into DAPT monitoring in patients with thrombocytopenia.
Although the FC method may appear complex, it was performed in a hematology laboratory where FC is routinely used, and once established, the analyses proceeded without difficulty.
Finally, these findings should be considered hypothesis-generating and require further study to confirm their applicability in routine clinical practice.
Conclusions
In patients with thrombocytopenia, IA appears appropriate for assessing ASA response, whereas the FC-based aggregation method may provide a more accurate evaluation of clopidogrel responsiveness, with optimal P2Y12 inhibition defined as <25.7%.
Supplementary data
The supplementary materials are available at https://doi.org/10.5281/zenodo.19235950. The package contains the following files:
Supplementary Table 1. Results of checking the normality of the data distribution (Shapiro–Wilk test) of the variables.
Supplementary Table 2. Results of the statistical analyses.
Data Availability Statement
The participants of this study did not give written consent for their data to be shared publicly, so due to the sensitive nature of the research, the supporting data are not available.
Consent for publication
Not applicable.
Use of AI and AI-assisted technologies
Not applicable.