Abstract
Background. Pancreatic cancer (PC) is among the most aggressive and lethal malignancies, characterized by development within a complex tumor microenvironment (TME) that includes a desmoplastic stroma composed of extracellular matrix (ECM) and various cellular components.
Objectives. This study aims to elucidate the cellular and molecular mechanisms regulating PC progression through an integrated analysis of single-cell pseudotime trajectories and intercellular communication.
Materials and methods. We constructed pseudotime trajectories using single-cell RNA sequencing (scRNA-seq) data from PC tissues to trace the developmental progression of cancer cells. Transitional cell states and critical genes involved in the shift from early-to-advanced disease stages were identified. Through a comprehensive analysis, we pinpointed key transcription factors and signaling pathways implicated in tumor progression. Expression of stemness-associated genes in pancreatic stellate cells (PSC) was validated using immunofluorescence and transmission electron microscopy (TEM). Additionally, cell–cell communication analysis was performed to examine interactions within the TME, with particular emphasis on ligand–receptor pairings.
Results. Our analysis identified key transcription factors and signaling pathways that drive the cellular transitions associated with cancer progression. The findings revealed extensive intercellular crosstalk between cancer cells, stromal fibroblasts, and diverse immune cell subpopulations. Notably, the study underscored the distinct functional contributions of these cell populations to tumor development, immune evasion and metastatic dissemination.
Conclusions. The study uncovers the complex cellular diversity and intercellular crosstalk in PC, providing novel avenues for therapeutic interventions and early predictive markers in diagnosis. These findings support the potential for more targeted, personalized treatment strategies in combating PC.
Key words: pancreatic cancer, core genes, scRNA-seq, cell communication
Background
Pancreatic cancer (PC) is associated with one of the highest mortality rates due to its aggressive nature and poor overall prognosis. The 5-year survival rate for patients with PC remains approx. 9%, with minimal improvement over recent decades. This is partly attributed to late detection and a tumor microenvironment (TME) that supports cancer progression and therapy resistance. Understanding the cellular and molecular events associated with the emergence of PC is crucial for developing more effective diagnostic and therapeutic strategies.1, 2, 3
Emerging technologies, such as Single-cell RNA sequencing (scRNA-seq), have dramatically transformed our ability to uncover the complexity of cancer in detail. Unlike bulk RNA sequencing, which averages gene expression profiles over a large population of cells, scRNA-seq allows for the analysis of gene expression at the individual cell level. This technology has revealed the diversity of cellular composition and states within tumors, highlighting the functional roles that various cell types play throughout cancer progression.4, 5, 6, 7 Clinically, these insights are vital for tailoring personalized treatment approaches and enhancing early detection methods. By understanding the unique cellular interactions and resistance mechanisms in PC, researchers and clinicians can develop targeted therapies that more effectively disrupt tumor growth and dissemination. This could potentially lead to improved survival rates and enhanced quality of life for patients.
This catalog aims to provide a molecular atlas for the cellular heterogeneity and intercellular communication that characterize PC. To achieve this, scRNA-seq approaches were employed to analyze PC tissues at single-cell resolution to define developmental trajectories in this study, enhancing understanding of how various cell populations within the TME interact. By utilizing pseudotime trajectories, the evolution of individual cancer cells from early to late stages of the disease was traced. This method identified key transitional states and the genes driving these transitions, elucidating the hierarchical organization and temporal dynamics of tumor evolution.8, 9, 10, 11 In addition, a cell communication analysis was conducted to examine interactions between cancer cells and stromal and immune cells. Various cell types are known to affect tumor progression and inhibition through immune evasion, metastasis and therapy resistance in the TME. The analysis of ligand–receptor interactions uncovered widespread intercellular crosstalk and emphasized the intricate signaling networks that maintain the TME.12, 13, 14, 15
To further support our single-cell analysis, we combined immunofluorescence and transmission electron microscopy (TEM) to identify the expression of stemness genes in pancreatic stellate cells (PSC). These methods confirmed and spatially contextualized our findings, highlighting the role of stemness in PC pathogenesis.
These discoveries offer additional therapeutic targets and biomarkers for early detection and treatment. These discoveries emphasize the critical role that single-cell technologies can play in advancing our understanding of cancer biology and driving precision oncology.
Objectives
The study aims to elucidate the cellular and molecular features regulating PC progression through an integrated analysis of single-cell pseudotime and cell communication.
Materials and methods
Patients
The study included PC patients sourced from public databases (such as The Cancer Genome Atlas (TCGA) https://www.cancer.gov/ccg/research/genome-sequencing/tcga, Gene Expression Omnibus (GEO) https://www.ncbi.nlm.nih.gov/geo, GSM8541021, GSM8541020). Inclusion criteria comprised confirmed cases of PC with documented patient characteristics, including age, sex, geographic location, and stage at diagnosis. Exclusion criteria encompassed patients with incomplete clinical or demographic data.16, 17, 18
Specimen characteristics
Gene expression data from PC patients were collected from the GEO database. Control samples were obtained from the same datasets, consisting of non-cancerous tissue from PC patients. The datasets used were publicly available and underwent quality control in their respective studies. Data storage complied with open-source data-sharing standards.
Gene expression analysis
RNA-seq and microarray data were utilized for expression profiling. Data were processed with normalization techniques to account for batch effects and technical variability. The analysis focused on differentially expressed genes (DEGs) related to PC. All assays were conducted blinded to clinical endpoints, ensuring unbiased interpretation.
Study design
The study was retrospective and utilized data from the GEO database. The analysis concentrated on immune infiltration and intercellular communication in PC. The primary endpoint focused on exploring gene expression differences in the TME using single-cell sequencing data. The secondary endpoint centered on intercellular communication pathways. Variables initially considered included gene expression levels, selected based on their relevance in PC prognosis. A large dataset from the GEO database was used to ensure adequate statistical power.
Statistical analyses
The clustering and annotation process for single-cell data was performed as follows: First, the Seurat package (v. 4.4.0; https://github.com/satijalab/seurat) was used to filter, perform quality control, normalize, reduce dimensionality, and cluster the single-cell data from GSM854102 and GSM8541020. The steps involved are outlined below:
1. Data preprocessing: The CreateSeuratObject function was employed to filter the single-cell sequencing data, retaining genes expressed in at least 3 cells and cells detecting more than 350 genes (parameters set to min.cell = 3 and min.features = 350).
2. Mitochondrial and ribosomal gene scoring: The PercentageFeatureSet function was utilized to calculate the mitochondrial and ribosomal gene scores based on the expression data of mitochondrial and ribosomal genes, respectively. A robust gene expression window was established, excluding cells with fewer than 200 or more than 2,500 unique genes. This approach mitigated the risk of including cell doublets and excluded low-quality cells that could compromise subsequent analyses. Furthermore, mitochondrial gene expression was assessed, and cells with more than 5% mitochondrial transcript expression were systematically removed. This step helped identify and exclude cells potentially undergoing stress or apoptosis, which could distort analytical outcomes. Only cells with mitochondrial and ribosomal gene scores below 20% were retained for analysis.
3. Data normalization and variable gene identification: The SCTransform function was used to normalize the data and identify the top 3,000 highly variable genes (variable.features.n = 3000).
4. Principal component analysis and dimensionality reduction: Principal component analysis (PCA) was performed, and an elbow plot was generated to determine the optimal number of dimensions. Principal components up to the inflection point were selected for further analysis. The first 15 principal components were chosen, and batch effects were removed using the Canonical Correlation Analysis (CCA) method in Seurat. The FindNeighbors and FindClusters functions were then used for unsupervised cluster analysis of the data, following batch removal. The optimal resolution parameter was determined using the “clustree” function to assess cluster stability across different resolutions. In this study, the optimal resolution was set to 0.7, resulting in the identification of 26 clusters. Uniform manifold approximation and projection (UMAP) visualization was employed for cluster representation. Cells were annotated based on reference marker genes provided by CellMarker,13 and the proportions of annotated cells were computed and visualized using ggplot2.19, 20, 21, 22
5. Cell communication analysis: To assess cell communication, the interaction between ligands and receptors, along with the activation of specific cell signaling pathways, was analyzed. The CellChat package was used to predict differences in cell communication between groups with high and low Müller ratings. Ligand-receptor pairs were selected for analysis, with a threshold p-value of less than 0.05 considered statistically significant. Only membrane-bound ligand-receptor pairs were analyzed, and the expression of these pairs in different cell types was evaluated.
6. Immunofluorescence: Cells were fixed using either pre-warmed 4% paraformaldehyde (PFA) or cold methanol for 20 min. The PFA-fixed cells were then permeabilized with 0.1% Triton X-100 in phosphate-buffered saline (PBS) for 8 min. A pre-boiled ethylenediaminetetraacetic acid (EDTA) solution (1 mM EDTA) was added to the PFA-fixed cells in a LabTek 8-well chambered coverglass and incubated for 10 min at room temperature. This procedure was repeated 3 times. Following fixation and permeabilization, cells were blocked with 3% bovine serum albumin (BSA) in PBS for 30 min. Primary antibodies were incubated at 4°C overnight, diluted 1:500 in 3% BSA/PBS. After washing, secondary antibodies (also diluted 1:500) were incubated for 1 h at room temperature. Nuclear DNA was stained using DAPI (4′,6-diamidino-2-phenylindole; 1 µg/mL). Samples were then analyzed using an LSM800 GaAsP laser scanning confocal microscope with Zen software (Carl Zeiss AG, Jena, Germany).23, 24, 25
All statistical analyses were performed using R v. 4.0.3 (R Foundation for Statistical Computing, Vienna, Austria). Differences were considered statistically significant when the p-value was less than 0.05, unless otherwise specified.
Results
Analysis of single-cell RNA sequencing data comparing normal and tumor cells
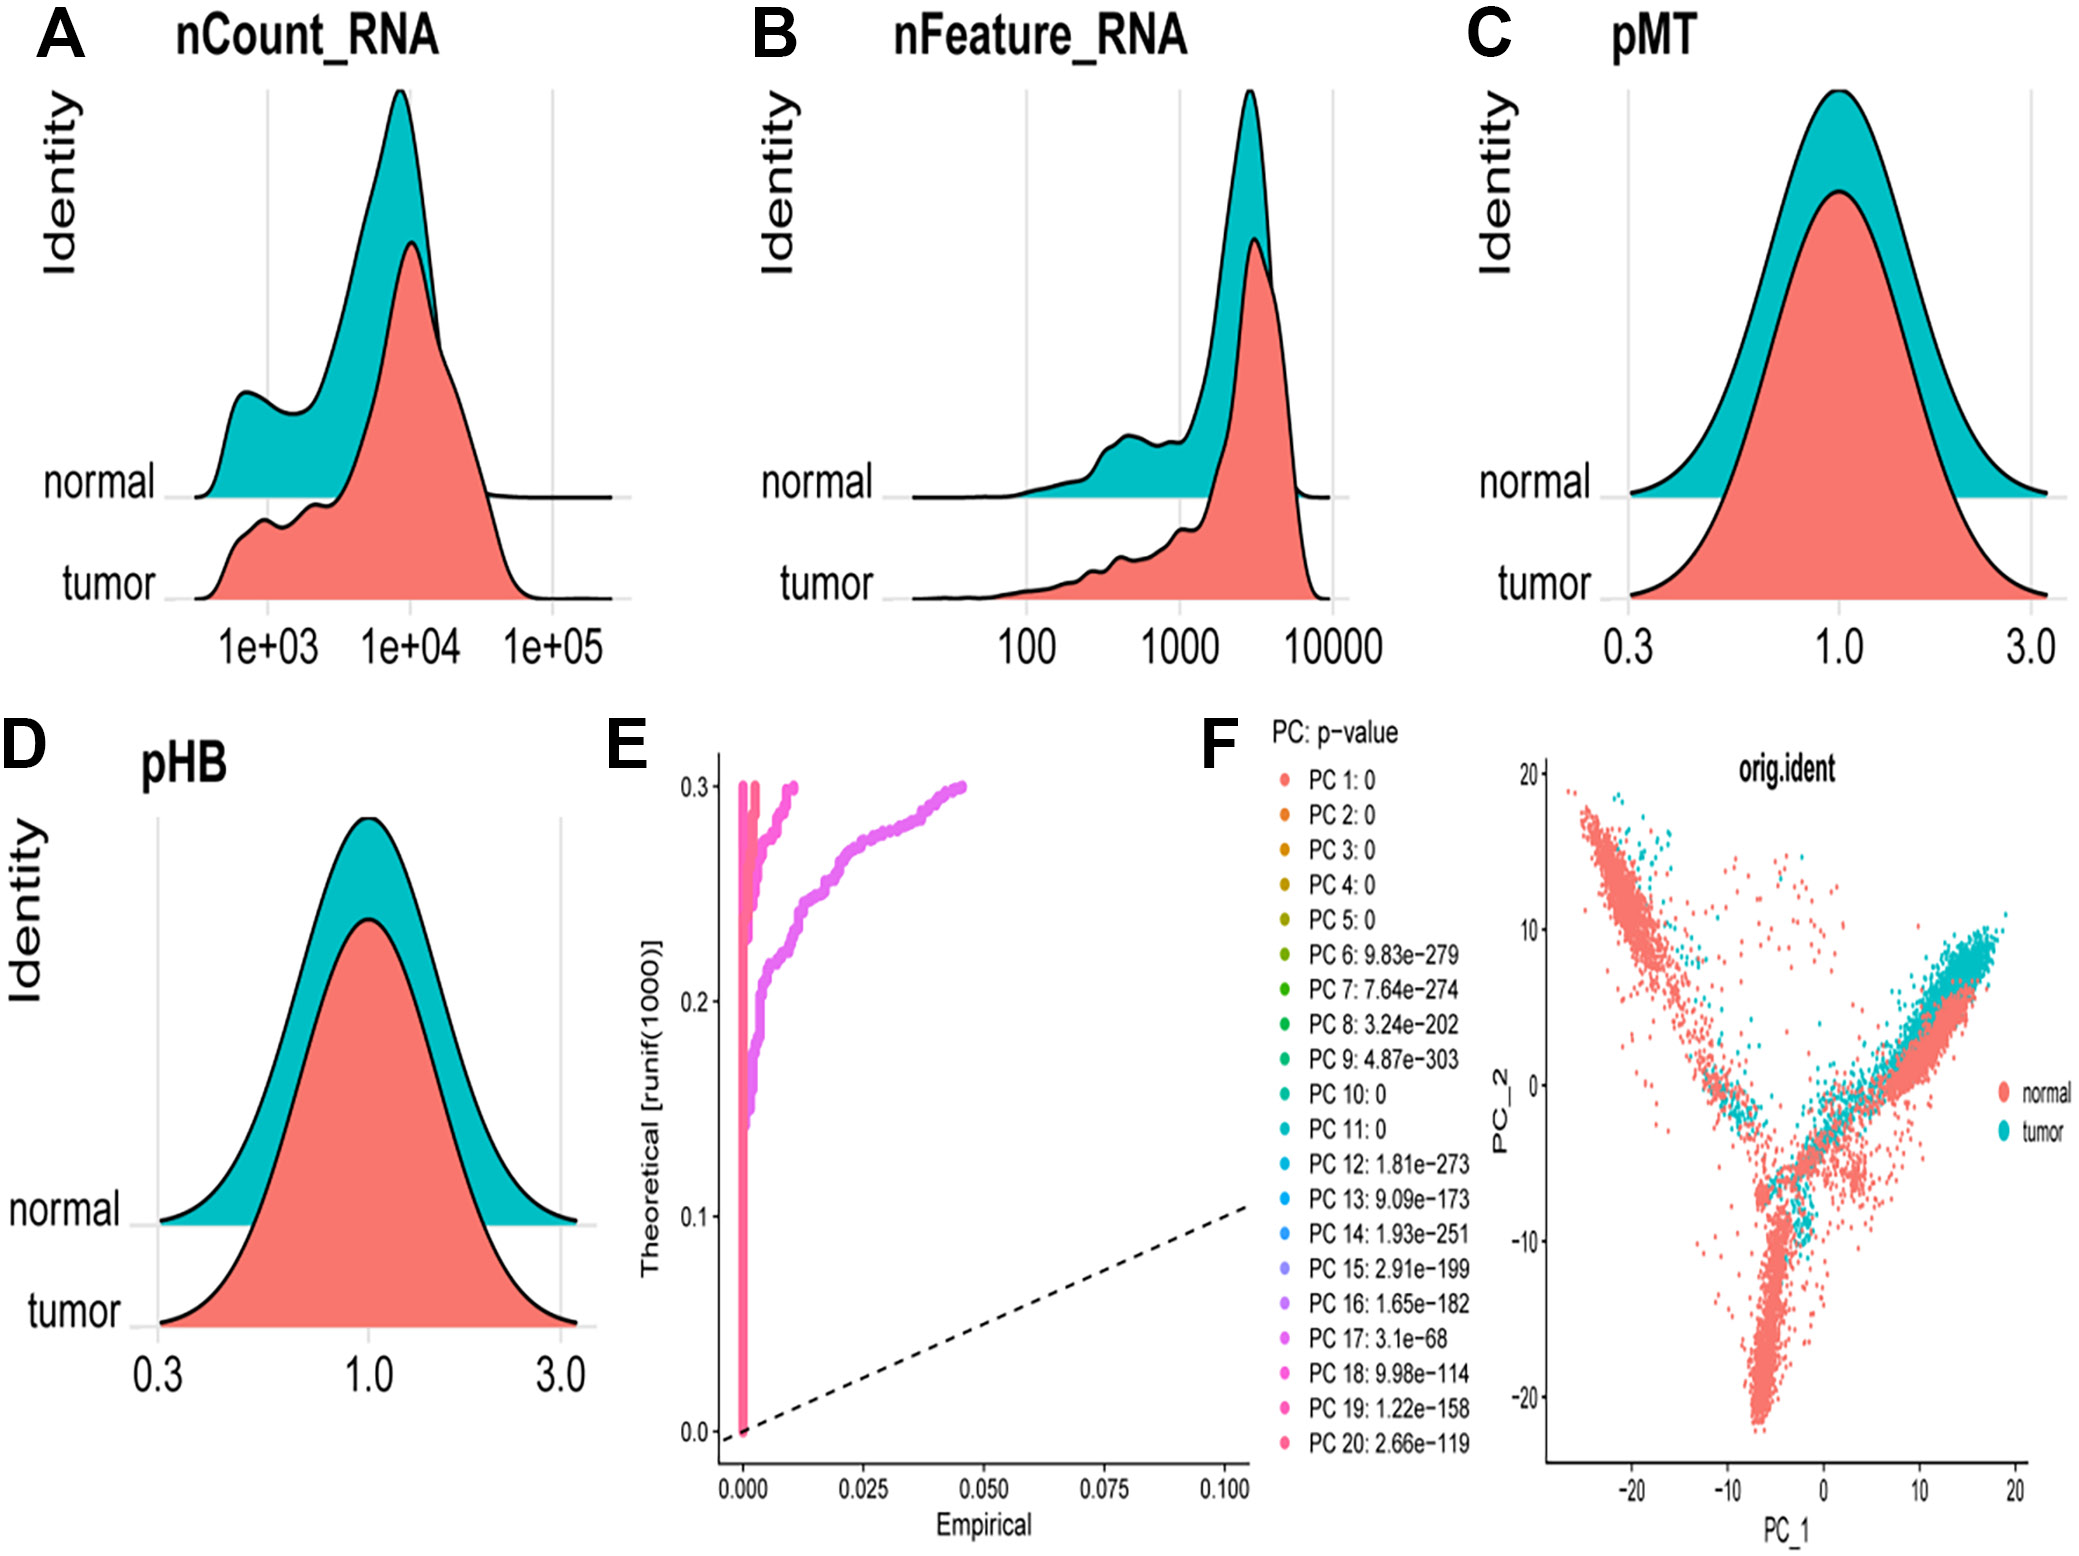
Figure 1 presents a comprehensive analysis of scRNA-seq data comparing normal and tumor cells. Panels A–D display density plots of various metrics, whereas panels E, F present results from PCA. The density plot illustrates the distribution of total RNA counts per cell for normal (blue) and tumor (red) cells, revealing a broader and higher distribution of RNA counts in tumor cells, indicative of increased transcriptional activity (Figure 1A). This plot demonstrates the distribution of the number of detected genes per cell, with tumor cells exhibiting a higher number of detected genes, suggesting increased gene expression diversity (Figure 1B). The density plot depicting mitochondrial gene expression percentage shows a similar distribution for both normal and tumor cells, although tumor cells exhibit a slight shift towards higher mitochondrial gene expression, potentially indicating altered metabolic states (Figure 1C). The plot representing hemoglobin gene expression percentage shows overlapping distributions for normal and tumor cells, with tumor cells displaying slightly higher hemoglobin gene expression (Figure 1D). The scree plot illustrates the variance explained by each principal component, with the first few principal components accounting for the majority of variance in the data. Although p-values are provided for each principal component, they indicate statistical significance rather than effect magnitude. The relative importance of principal compotents is better assessed by the proportion of variance they explain, as visualized in the scree plot (Figure 1E). The scatter plot visualizes the PCA results, with cells plotted according to their scores on the first 2 principal components. Normal (blue) and tumor (red) cells formed distinct clusters, indicating substantial differences in their gene expression profiles. The separation along principal compotent 1 and principal component 2 suggests that these principal components capture the major sources of variation between normal and tumor cells (Figure 1F).
Principal component analysis and dimensionality reduction techniques
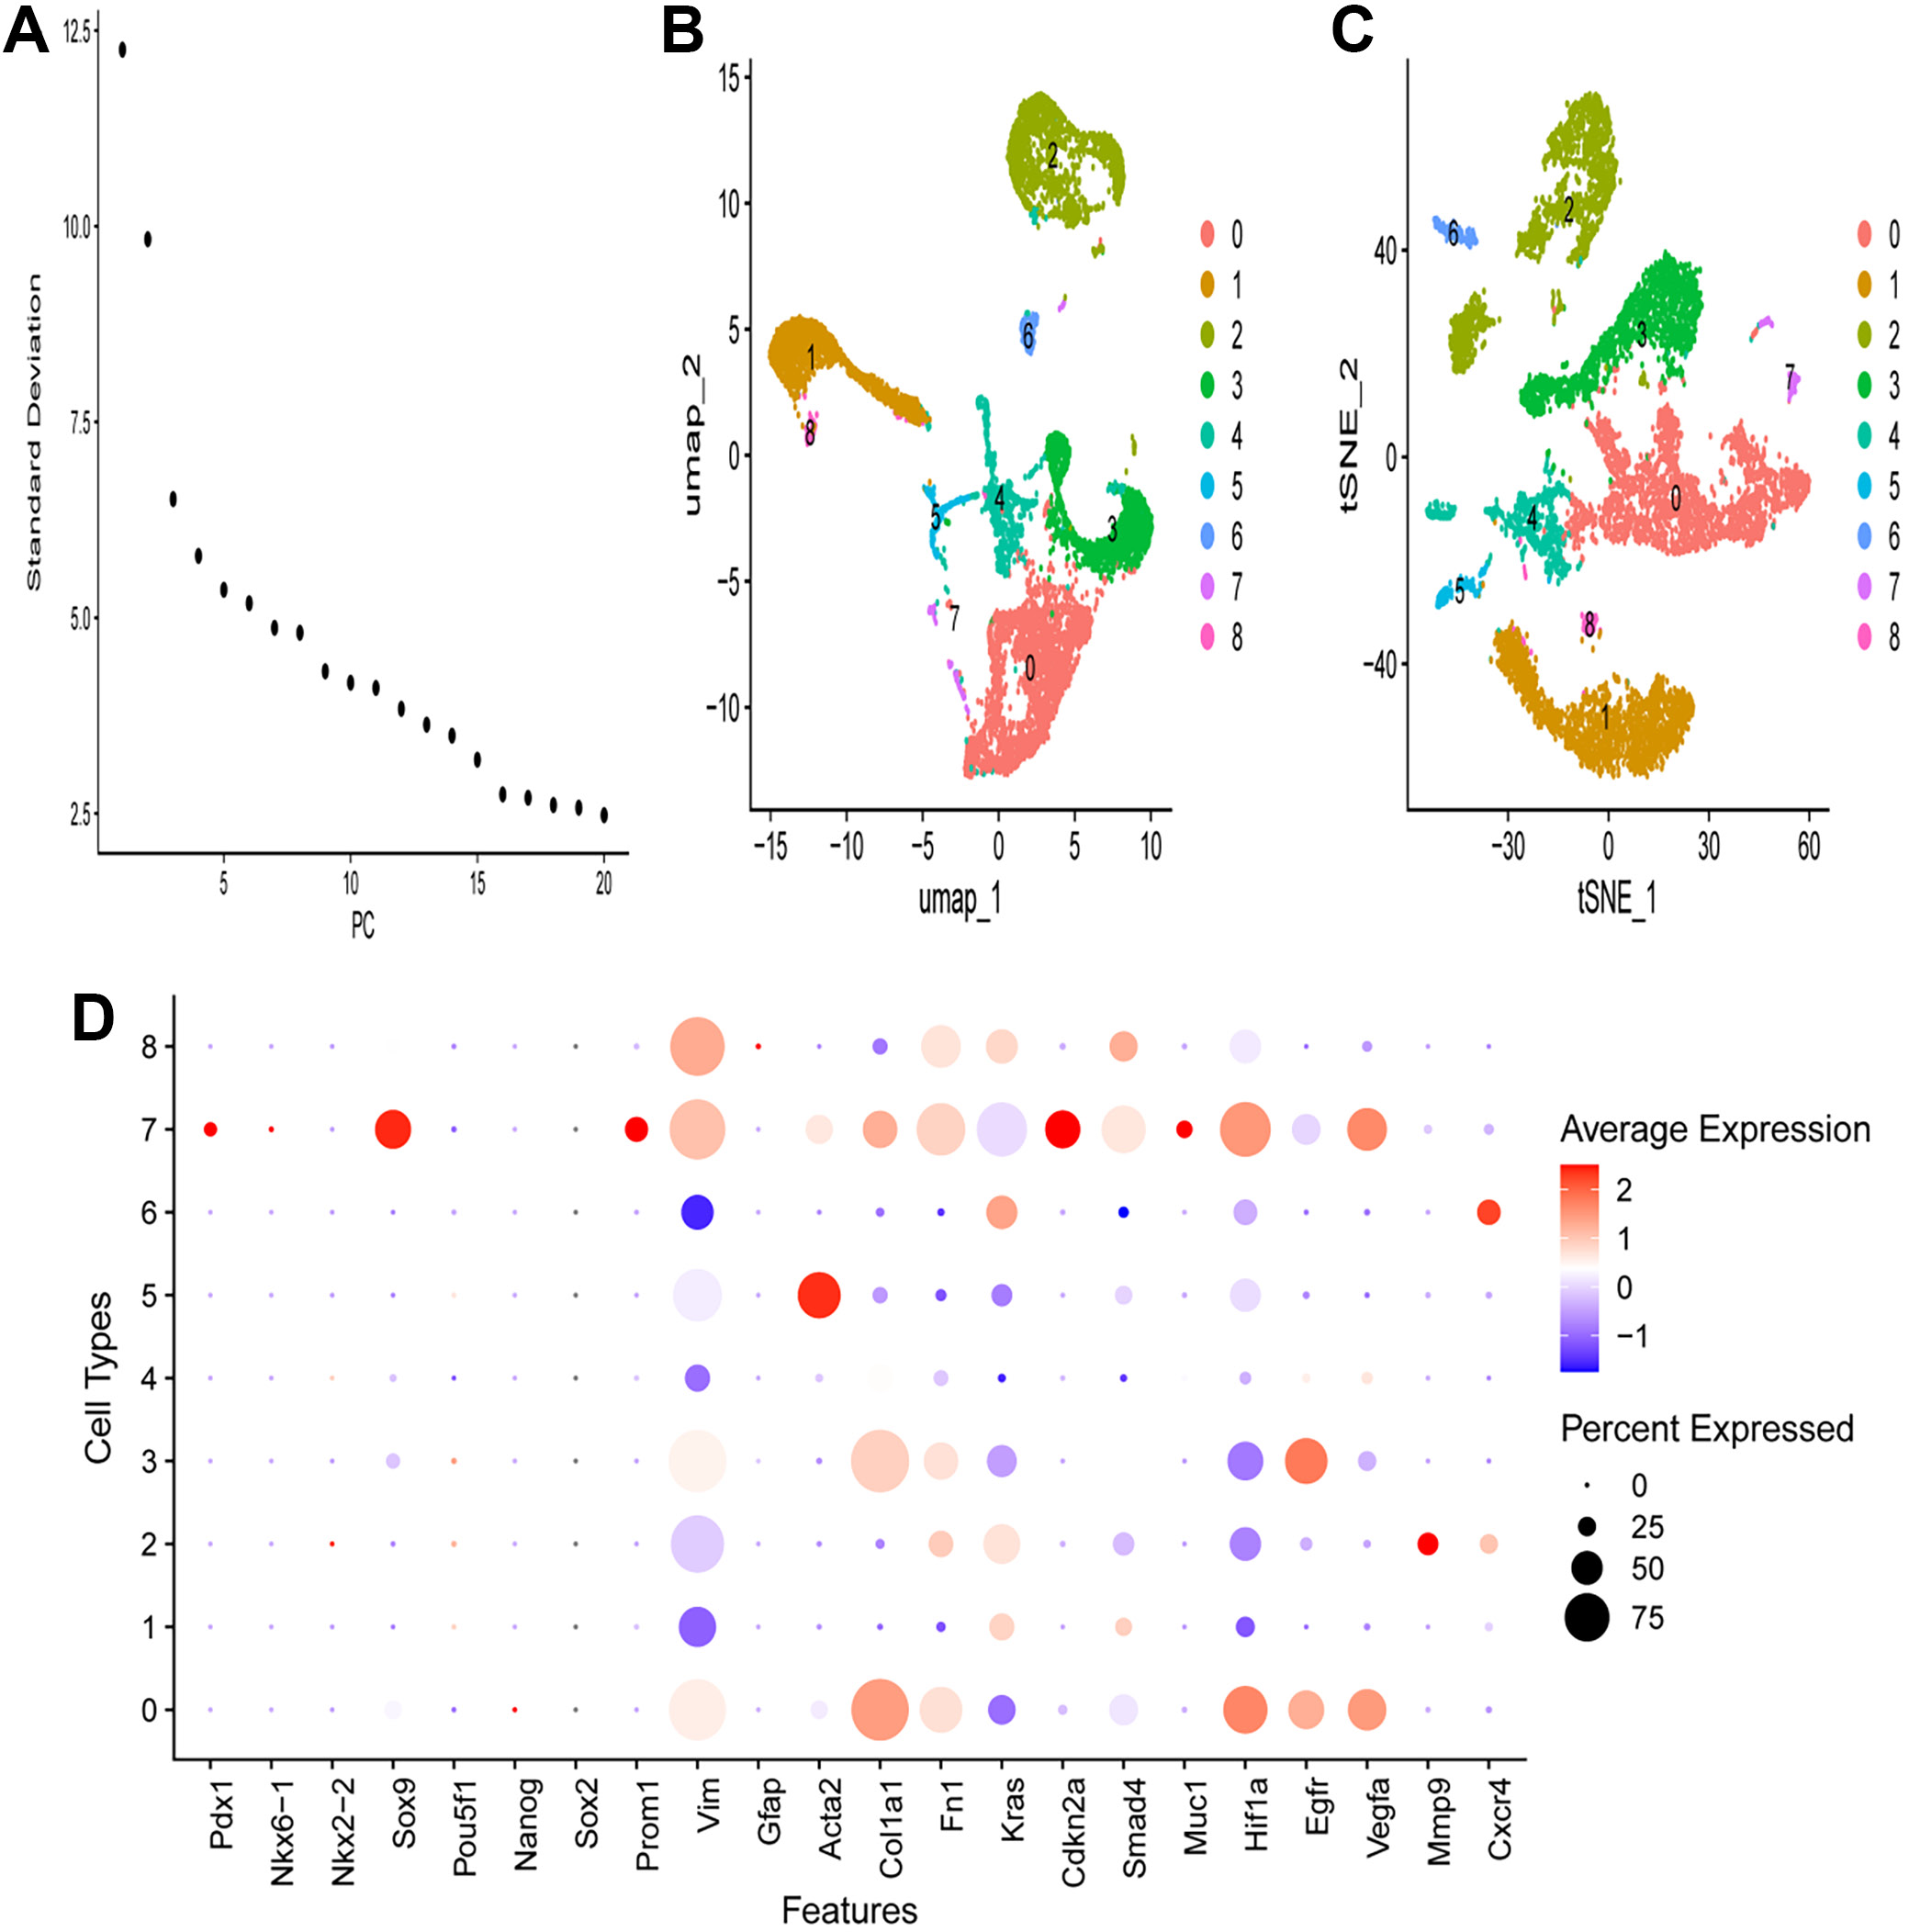
The scree plot (Figure 2A) illustrates the standard deviation (SD) of the principal components, indicating that the first few principal components capture the most variance. As the number of principal components increases, the SD decreases, suggesting that later principal components contribute less to overall variance (Figure 2A). The UMAP plot visualizes the scRNA-seq data in a 2-dimensional space, where each dot represents a single cell colored based on assigned clusters (0–8). The distinct clusters indicate different cell populations, with spatial separation suggesting differences in gene expression profiles (Figure 2B). The t-distributed stochastic neighbor embedding (t-SNE) plot also visualizes the scRNA-seq data in 2 dimensions. Similar to the UMAP plot, cells are colored by clusters (0–8), further confirming the separation of cell populations and highlighting heterogeneity within the dataset (Figure 2C). The dot plot displays expression levels of selected genes across different cell types, where the size of each dot represents the percentage of cells expressing the gene, and the color indicates the average expression level. Notable observations show that certain genes are highly expressed in specific cell types, as indicated by larger and darker dots (Figure 2D). For example, Sox2 and Prom1 show high expression in cell type 7, whereas Egfr and Vegfa are broadly expressed across multiple cell types. The differential expression patterns provide insights into the functional roles of these genes in various cell populations.
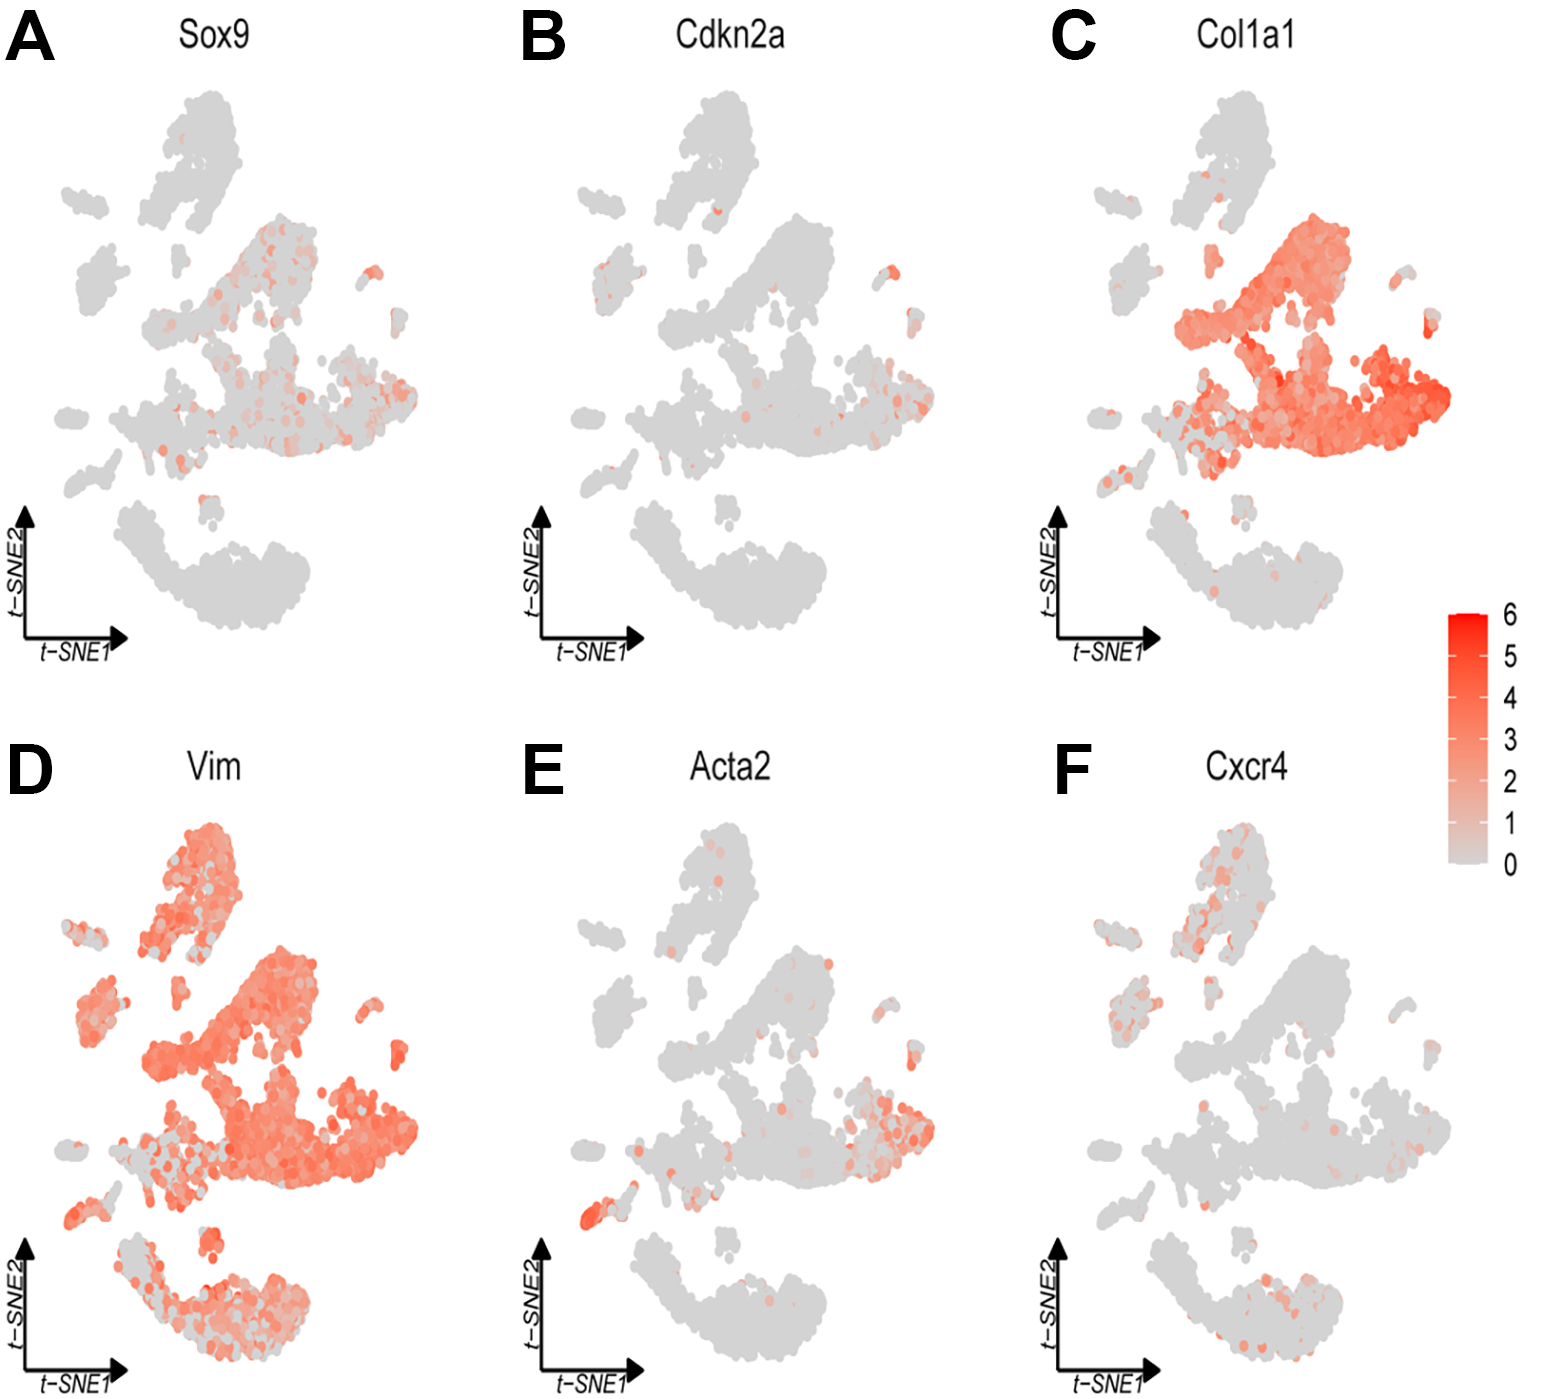
Figure 3 presents t-SNE plots illustrating the expression of specific genes across various cell populations in a scRNA-seq dataset. The t-SNE plot for Sox9 gene expression reveals that Sox9 is present in multiple, yet discrete clusters. The staining intensities vary among clusters, with some clusters exhibiting higher levels of Sox9 expression (Figure 3A). The visualization of Cdkn2a expression in the t-SNE plot indicates a more cluster-specific expression pattern, suggesting a cell-type-dependent expression profile. Each major group of genes (MGA-D, MGB-E and 2GGs) is ordered by peak expression time within each cluster, with shades of gray representing expression levels. Gene Ontology (GO) term analysis was performed for each functional map, consistently applying a threshold or flag-based criteria at the boundaries of the last exons.
Figure 3C displays the expression of Col1a1, which is concentrated in specific regions of the dataset, indicating that Col1a1 is expressed at lower levels throughout much of the brain, suggesting that Col1a promoter-driven Cre recombinase primarily exists in specific cell populations, such as those producing extracellular matrix (ECM; Figure 3C). The t-SNE plot for Vim demonstrates broad expression across various clusters, with several regions exhibiting higher expression levels. The lower cluster is enriched with cell types similar to mesenchymal cells, characterized by the expression of their derived marker, Vim (Figure 3D). The Acta2 expression plot indicates that Acta2 is concentrated in specific clusters, suggesting predominant expression in certain cell populations, potentially smooth muscle cells or myofibroblasts, due to its role in actin filament formation (Figure 3E). The expression of Cxcr4 is depicted in the t-SNE plot, showing scattered and relatively low expression across the clusters, indicating that this gene is expressed at lower levels or in fewer cell populations compared to the other genes illustrated (Figure 3F).
The proportions of different cell types in each group
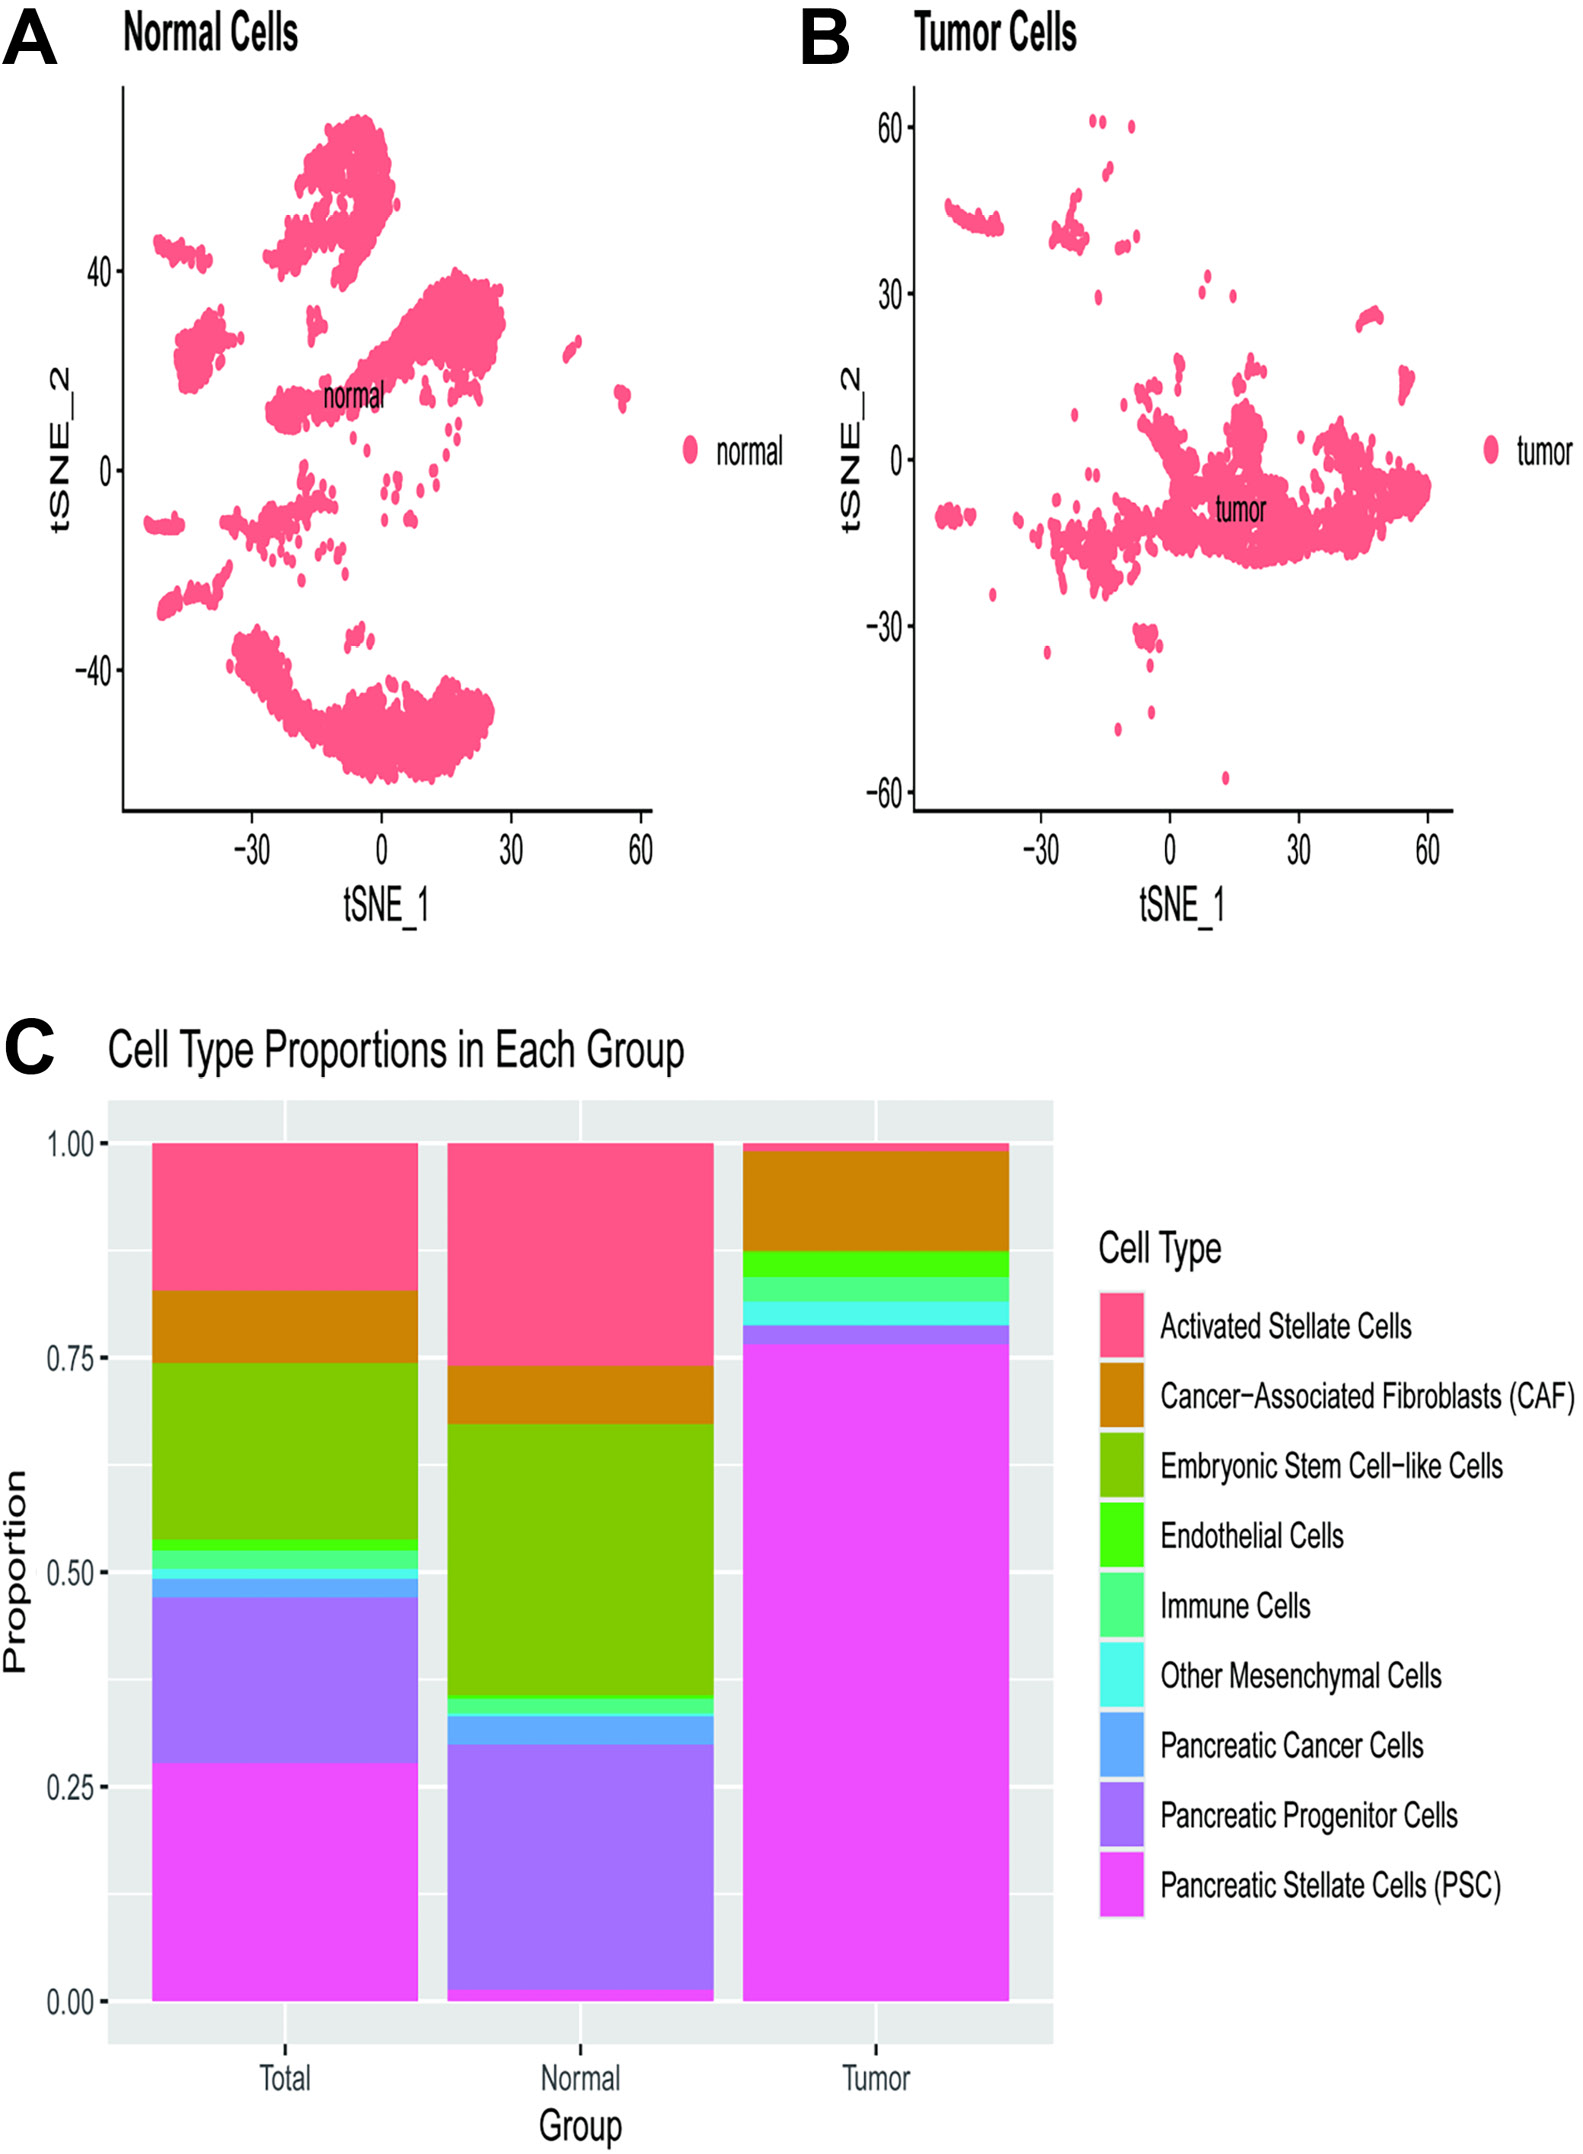
The t-SNE plot (Figure 4) visualizes the distribution of normal cells within a 2-dimensional space, with each dot representing a single cell. The clustering pattern illustrates the presence of distinct cell populations within the normal tissue, with spatial separation suggesting heterogeneity among normal cells (Figure 4A). Another t-SNE plot displays the distribution of tumor cells, where each dot again represents a single cell. The clustering pattern indicates the presence of various cell populations within the tumor tissue. In comparison to normal cells, tumor cells appear more densely packed and less dispersed, indicating alterations in cellular composition and gene expression profiles (Figure 4B). A bar plot compares the proportions of different cell types across the total, normal, and tumor groups. The cell types are color-coded as follows: activated stellate cells (orange), cancer-associated fibroblasts (CAF) (green), embryonic stem cell-like cells (cyan), endothelial cells (blue), immune cells (purple), other mesenchymal cells (brown), PC cells (dark pink), pancreatic progenitor cells (light blue), and PSC (pink). In the normal group, PSC and other cell types are well-represented. Conversely, in the tumor group, PC cells dominate, accompanied by a noticeable increase in CAF and a decrease in other cell types such as PSC.
Using pseudotime trajectories to explore cellular differentiation and transitions
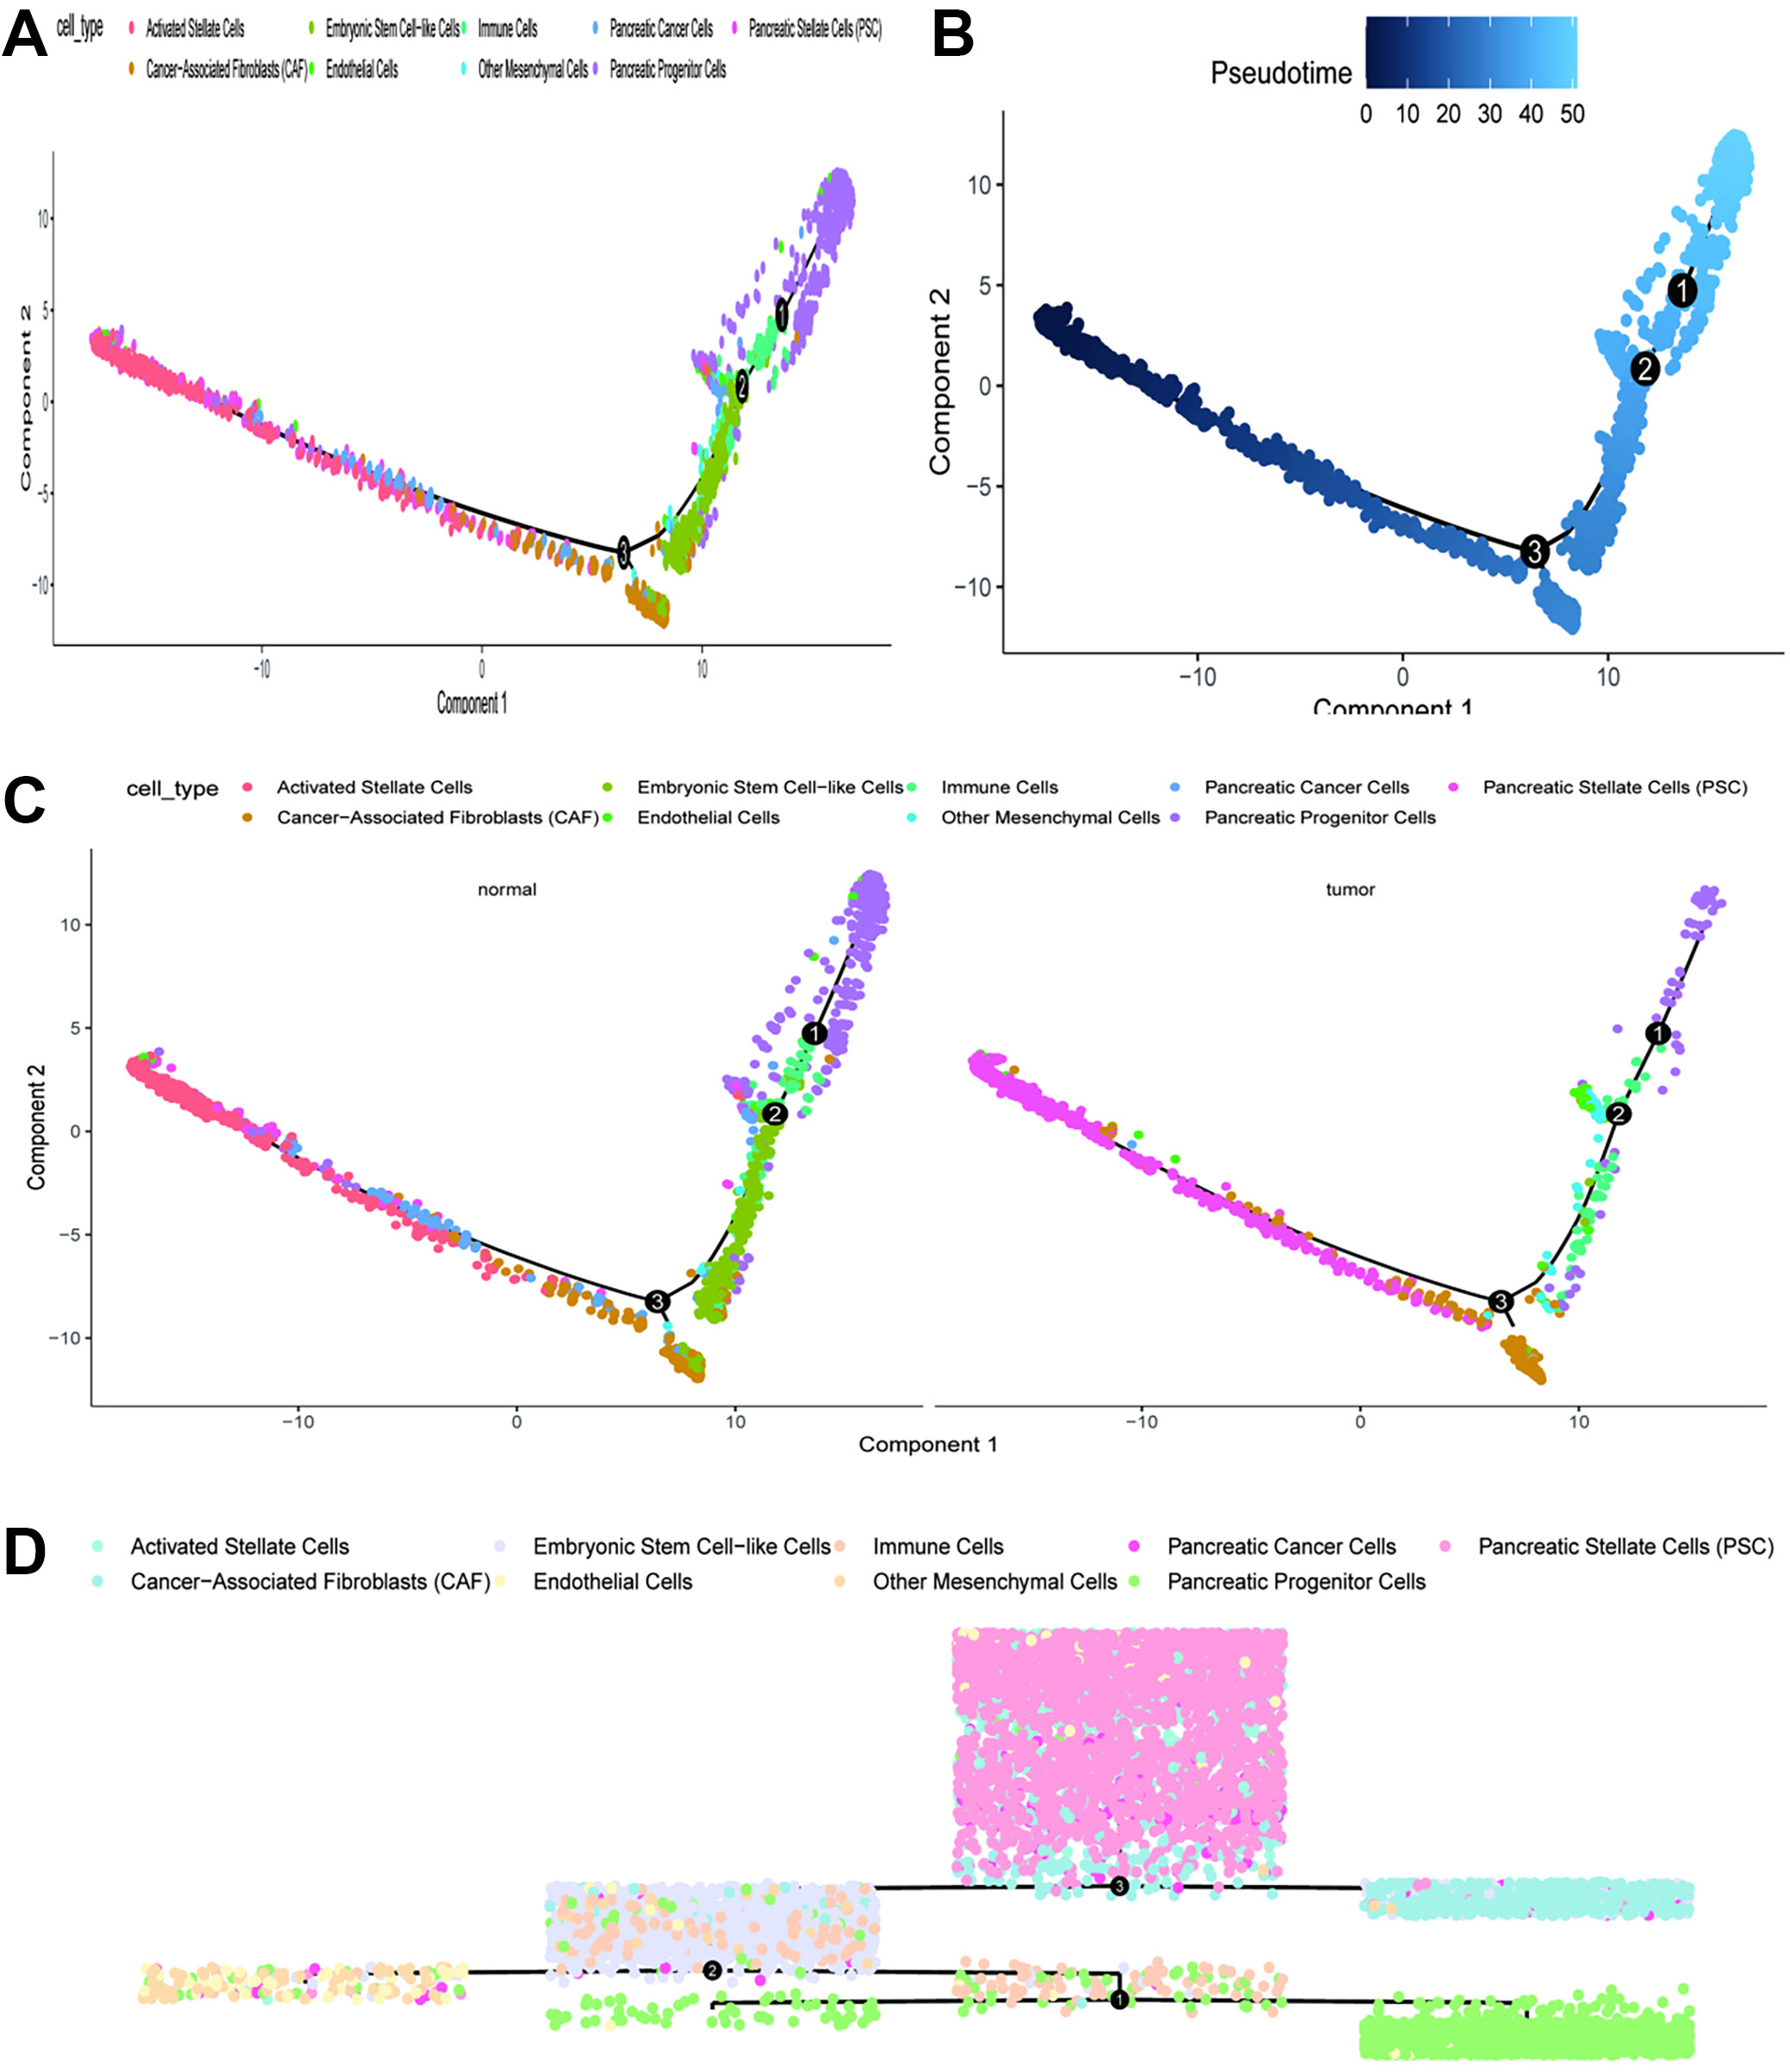
Figure 5 presents visualizations of cell type distributions along pseudotime and comparisons between normal and tumor cells. This plot displays the pseudotime trajectory of cells, color-coded by cell types. The trajectory is represented in a 2-dimensional space, with components 1 and 2 indicating the PC. The cell types are color-coded: activated stellate cells (orange), CAF (green), embryonic stem cell-like cells (cyan), endothelial cells (blue), immune cells (purple), other mesenchymal cells (brown), PC cells (dark pink), pancreatic progenitor cells (light blue), and PSC (pink). The trajectory suggests a progression from one cell type to another, implying a potential differentiation pathway or cellular transition process (Figure 5A).
A subsequent plot shows the same pseudotime trajectory as in panel A, with cells colored according to their pseudotime values, ranging from 0 to 50 (light to dark blue). Key transition points (1, 2 and 3) are marked along the trajectory, indicating significant stages in the progression of cellular states (Figure 5B). Additional plots compare the pseudotime trajectories of normal and tumor cells, with cells colored by their respective types. The left plot illustrates the trajectory for normal cells, whereas the right plot depicts the trajectory for tumor cells. Observed differences in the trajectories suggest varying differentiation pathways or cellular transitions between normal and tumor cells. Notably, tumor cells exhibit a more pronounced clustering of PC cells and CAF (Figure 5C). This combined plot presents pseudotime trajectories for both normal and tumor cells in a single view, with cells colored by their types. The trajectories are aligned to emphasize the differences and similarities in the progression of cell states between normal and tumor conditions. The transitions and clustering patterns provide insights into how cellular states evolve differently within the TME compared to normal tissue (Figure 5D).
Using pseudotime analysis to understand the progression and differentiation of various cell types
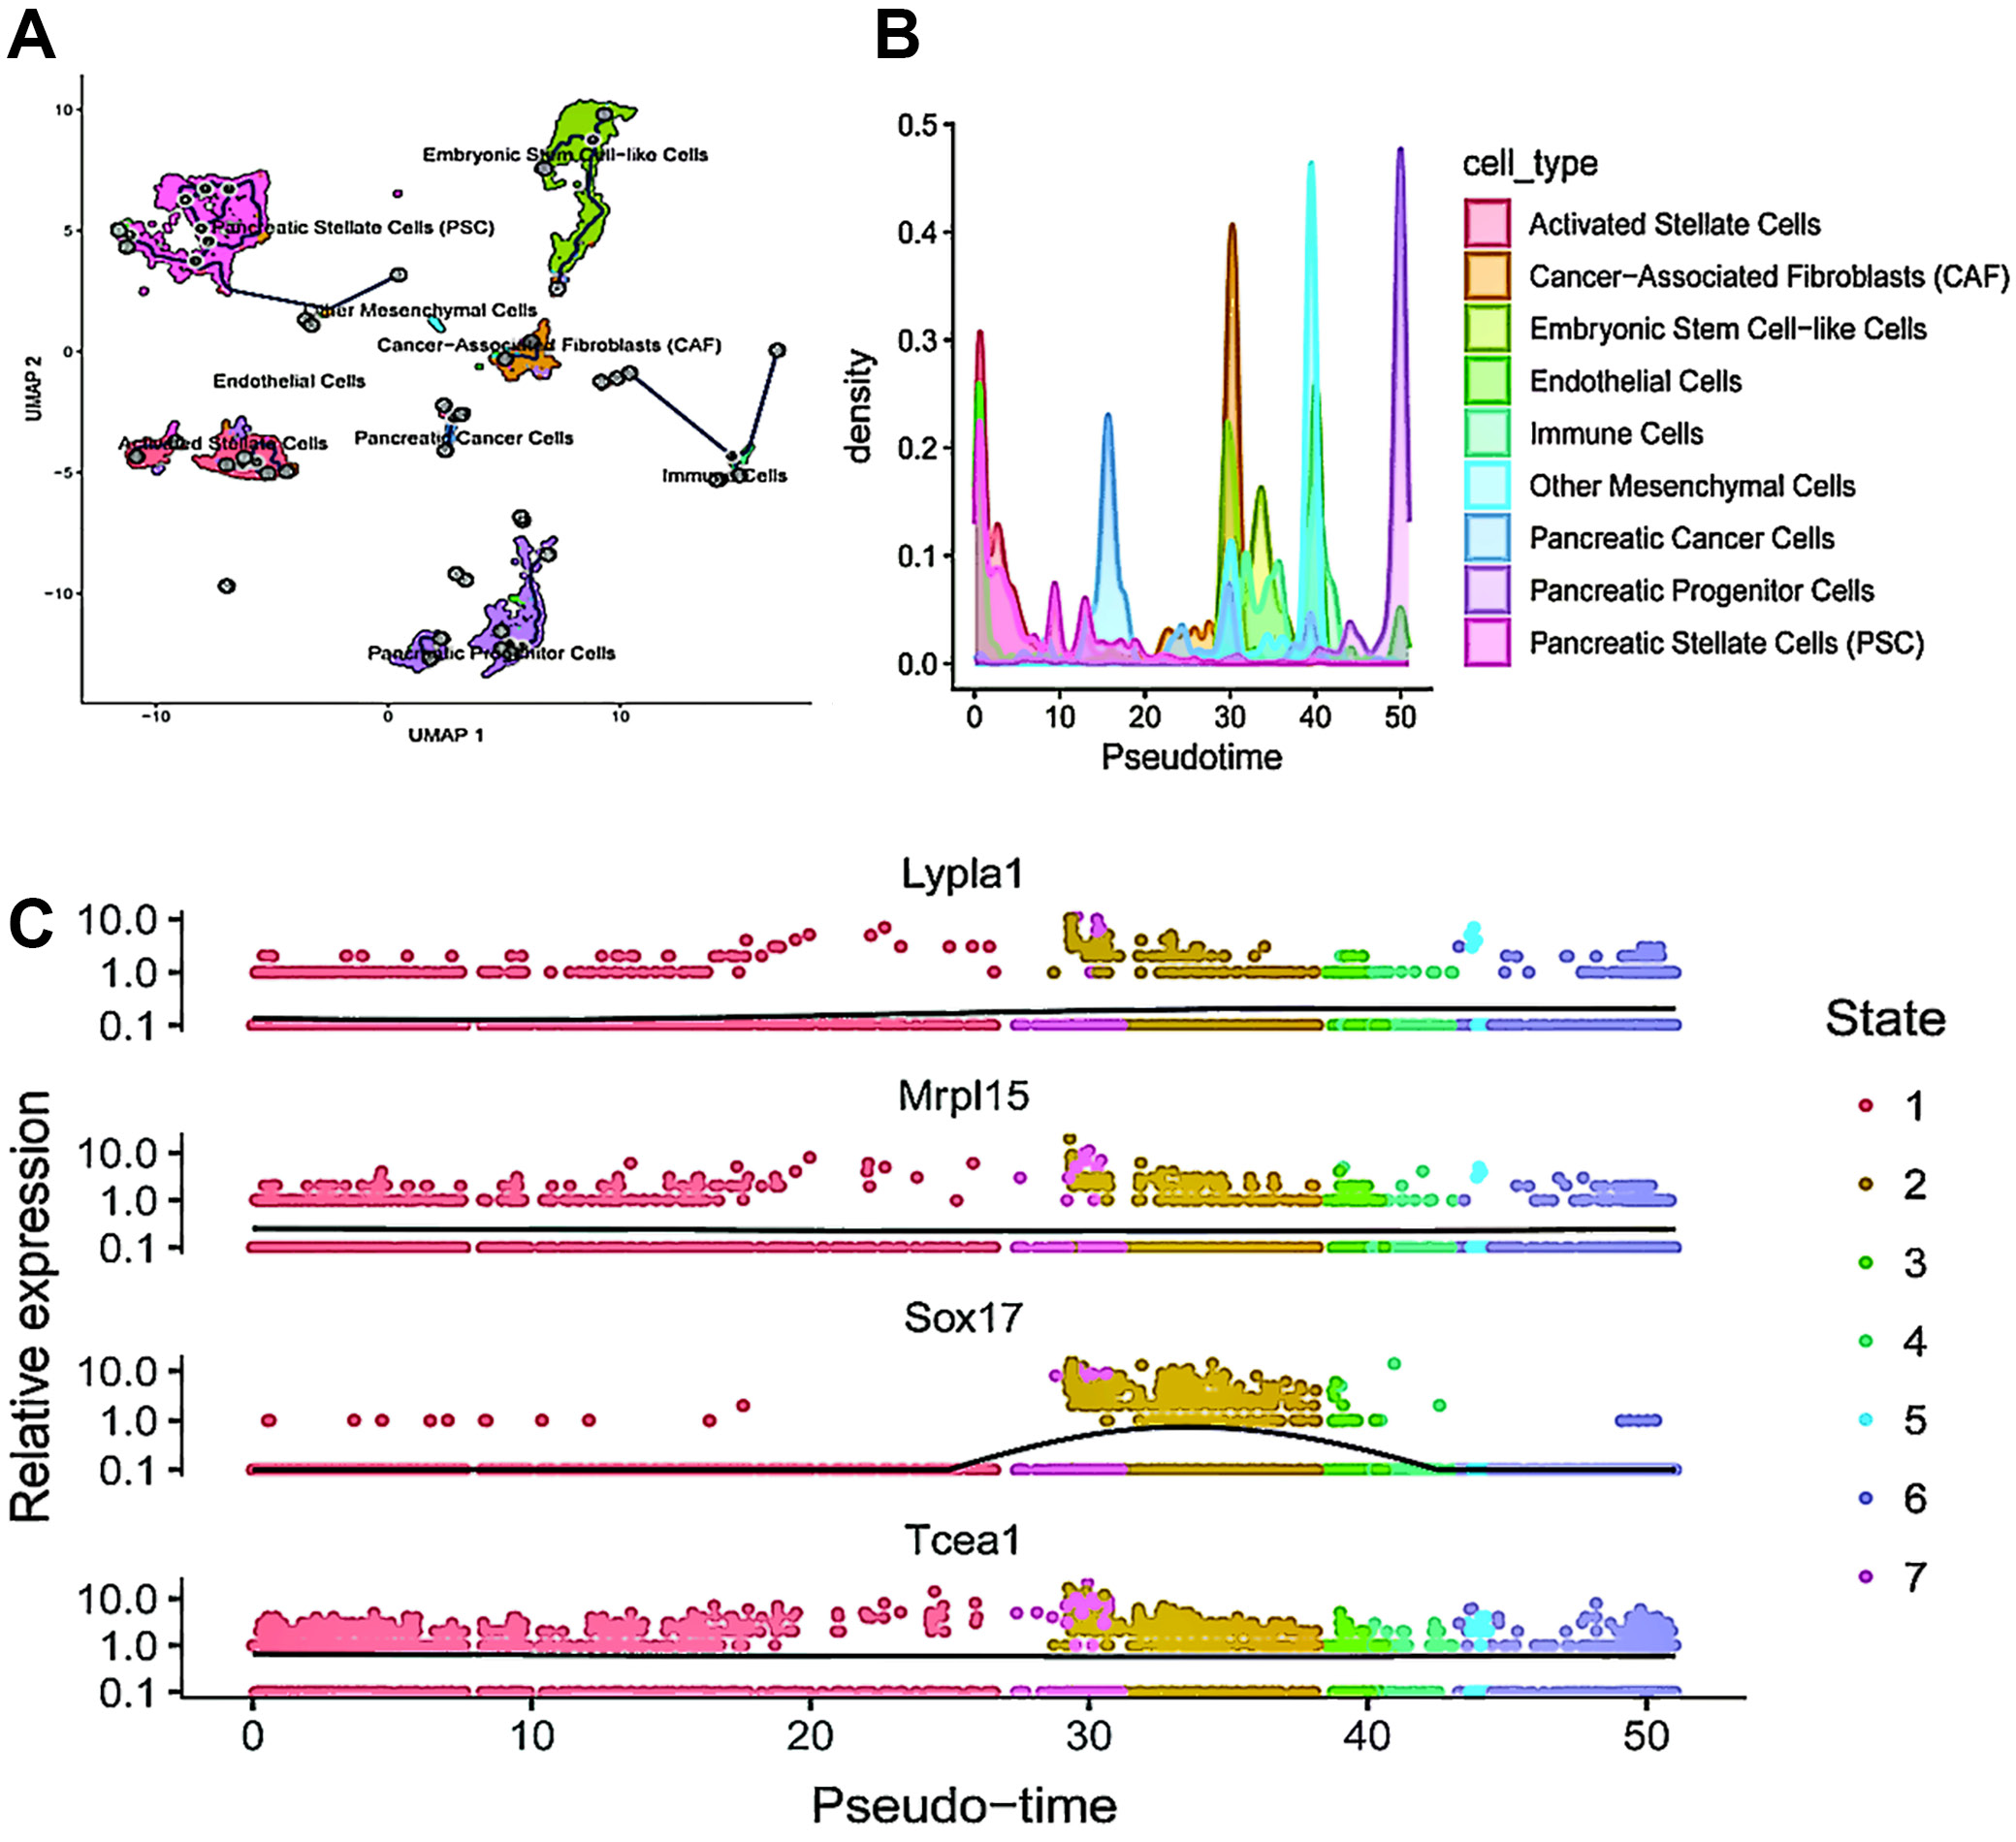
The UMAP plot (Figure 6A) illustrates the distribution of cells in 2-dimensional space, color-coded by cell type. The pseudotime trajectory is overlaid, demonstrating the progression of cells through various states. The cell types are color-coded as follows: activated stellate cells (orange), CAF (green), embryonic stem cell-like cells (cyan), endothelial cells (blue), immune cells (purple), other mesenchymal cells (brown), PC cells (dark pink), pancreatic progenitor cells (light blue), and PSC (pink). The trajectory lines connect different clusters, suggesting pathways of cellular differentiation or transition. This plot also depicts the density of various cell types along the pseudotime axis, with each cell type represented by a different color, consistent with those in Figure 6A. The density peaks indicate where specific cell types are most prevalent along the pseudotime trajectory. For instance, PC cells (dark pink) and cancer-associated fibroblasts (CAFs; green) exhibit distinct expression peaks, suggesting critical transition points in their progression. These plots illustrate the expression levels of 4 genes (Lypla1, Mrpl15, Sox17, and Tcea1) over pseudotime, with each dot representing a single cell colored by its state (1–7) (Figure 6B). The black line represents the smoothed trend of gene expression over pseudotime. Key observations include: Lypla1 shows high expression early in pseudotime, decreasing as pseudotime progresses; Mrpl15 exhibits peak expression around the midpoint of the pseudotime trajectory; Sox17 displays a distinct peak in expression later in pseudotime, indicating its role in a specific state; Tcea1 has high expression early in pseudotime, followed by a gradual decrease (Figure 6C).
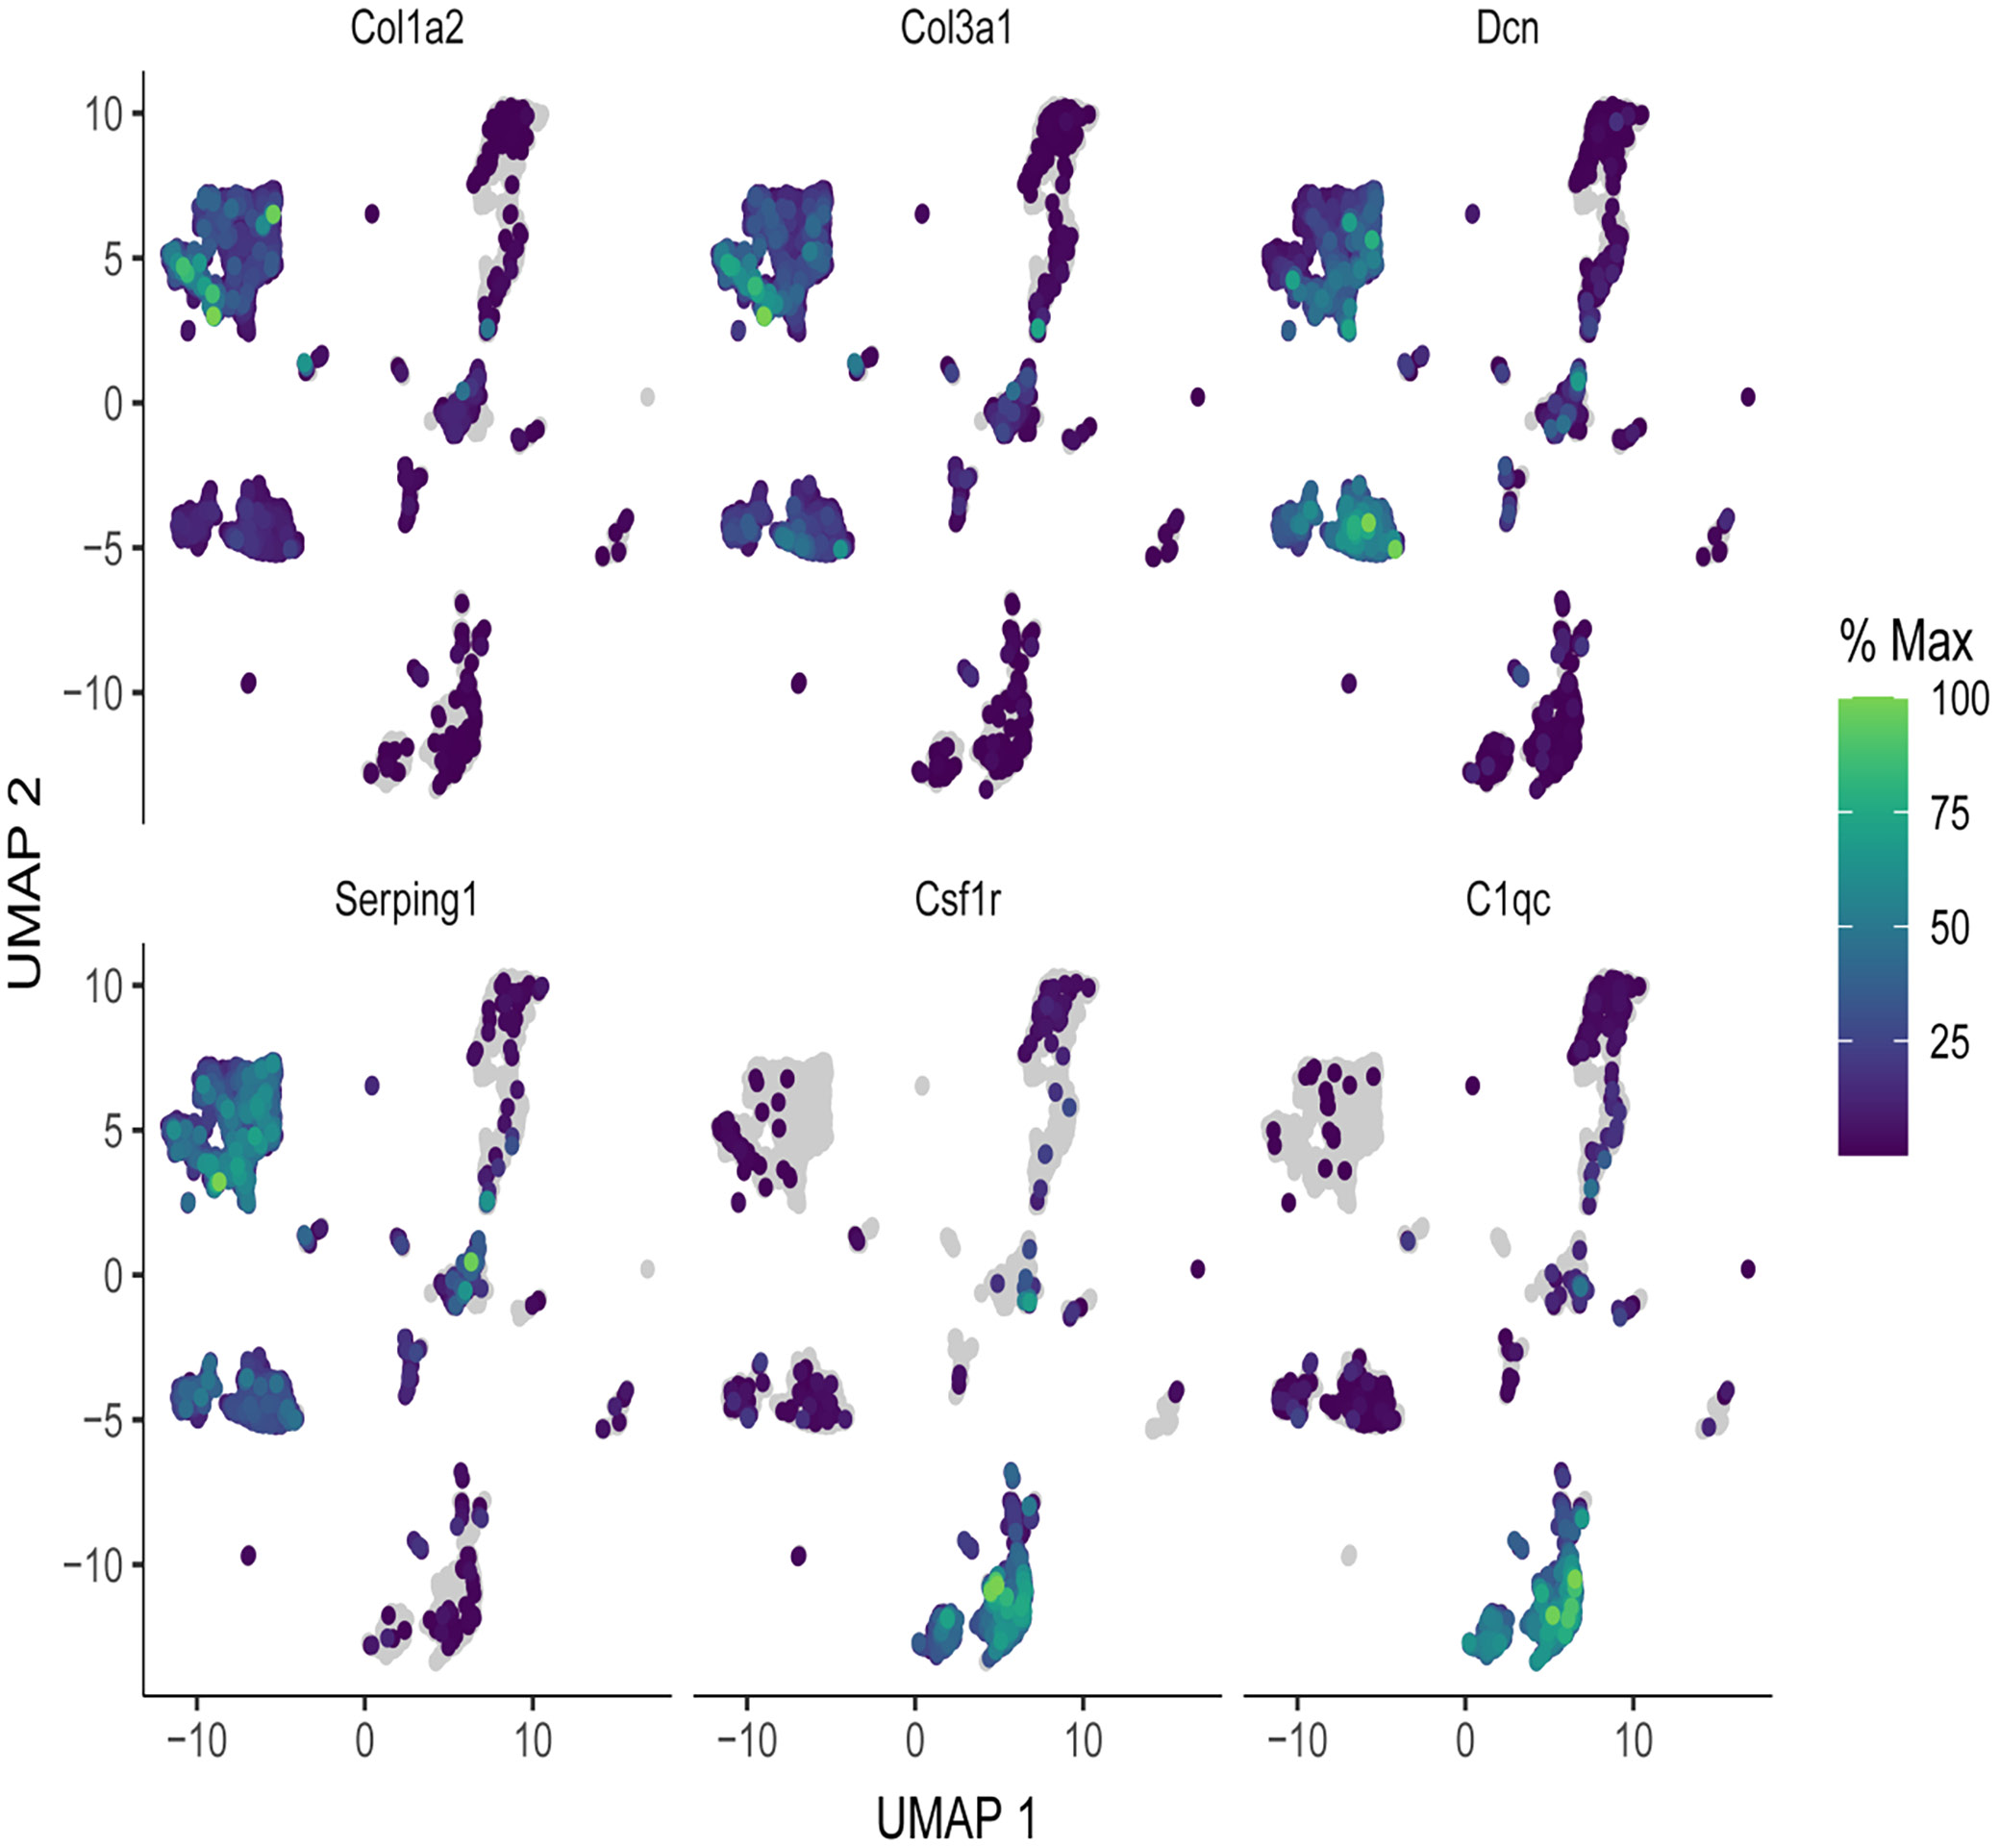
UMAP plots illustrating the expression of specific genes across different cell populations in a single-cell RNA sequencing dataset
As shown in Figure 7, each UMAP plot demonstrates the distribution of cells in 2-dimensional space, with gene expression levels indicated by color intensity. The color gradient ranges from purple (low expression) to green (high expression), representing the percentage of maximum expression for each gene. Areas of high expression (green) exhibit a punctate pattern, implying roles in specific cell types. Col3a1 (collagen type III alpha 1 chain) shows expression in the same clusters as its paralog in certain regions (75), indicating an association with the ECM and connective tissue. Decorin (Dcn) exhibits scattered expression across multiple clusters, with some regions showing higher levels, highlighting its role in collagen fibrillogenesis and ECM organization. Serping1 (decreased expression in cluster L10 but similar levels to P7) displays a highly restricted expression pattern, with high fractional spike-ins limiting its detection. Csf1r (colony stimulating factor 1 receptor) is expressed in existing clusters, indicating its association with specific cell types likely associated with macrophage differentiation and function. C1qc (complement C1q C chain) is uniquely expressed, with clear enrichment in clusters associated with immune response and the complement system.
Surface markers of PSC and its differentiation characteristics
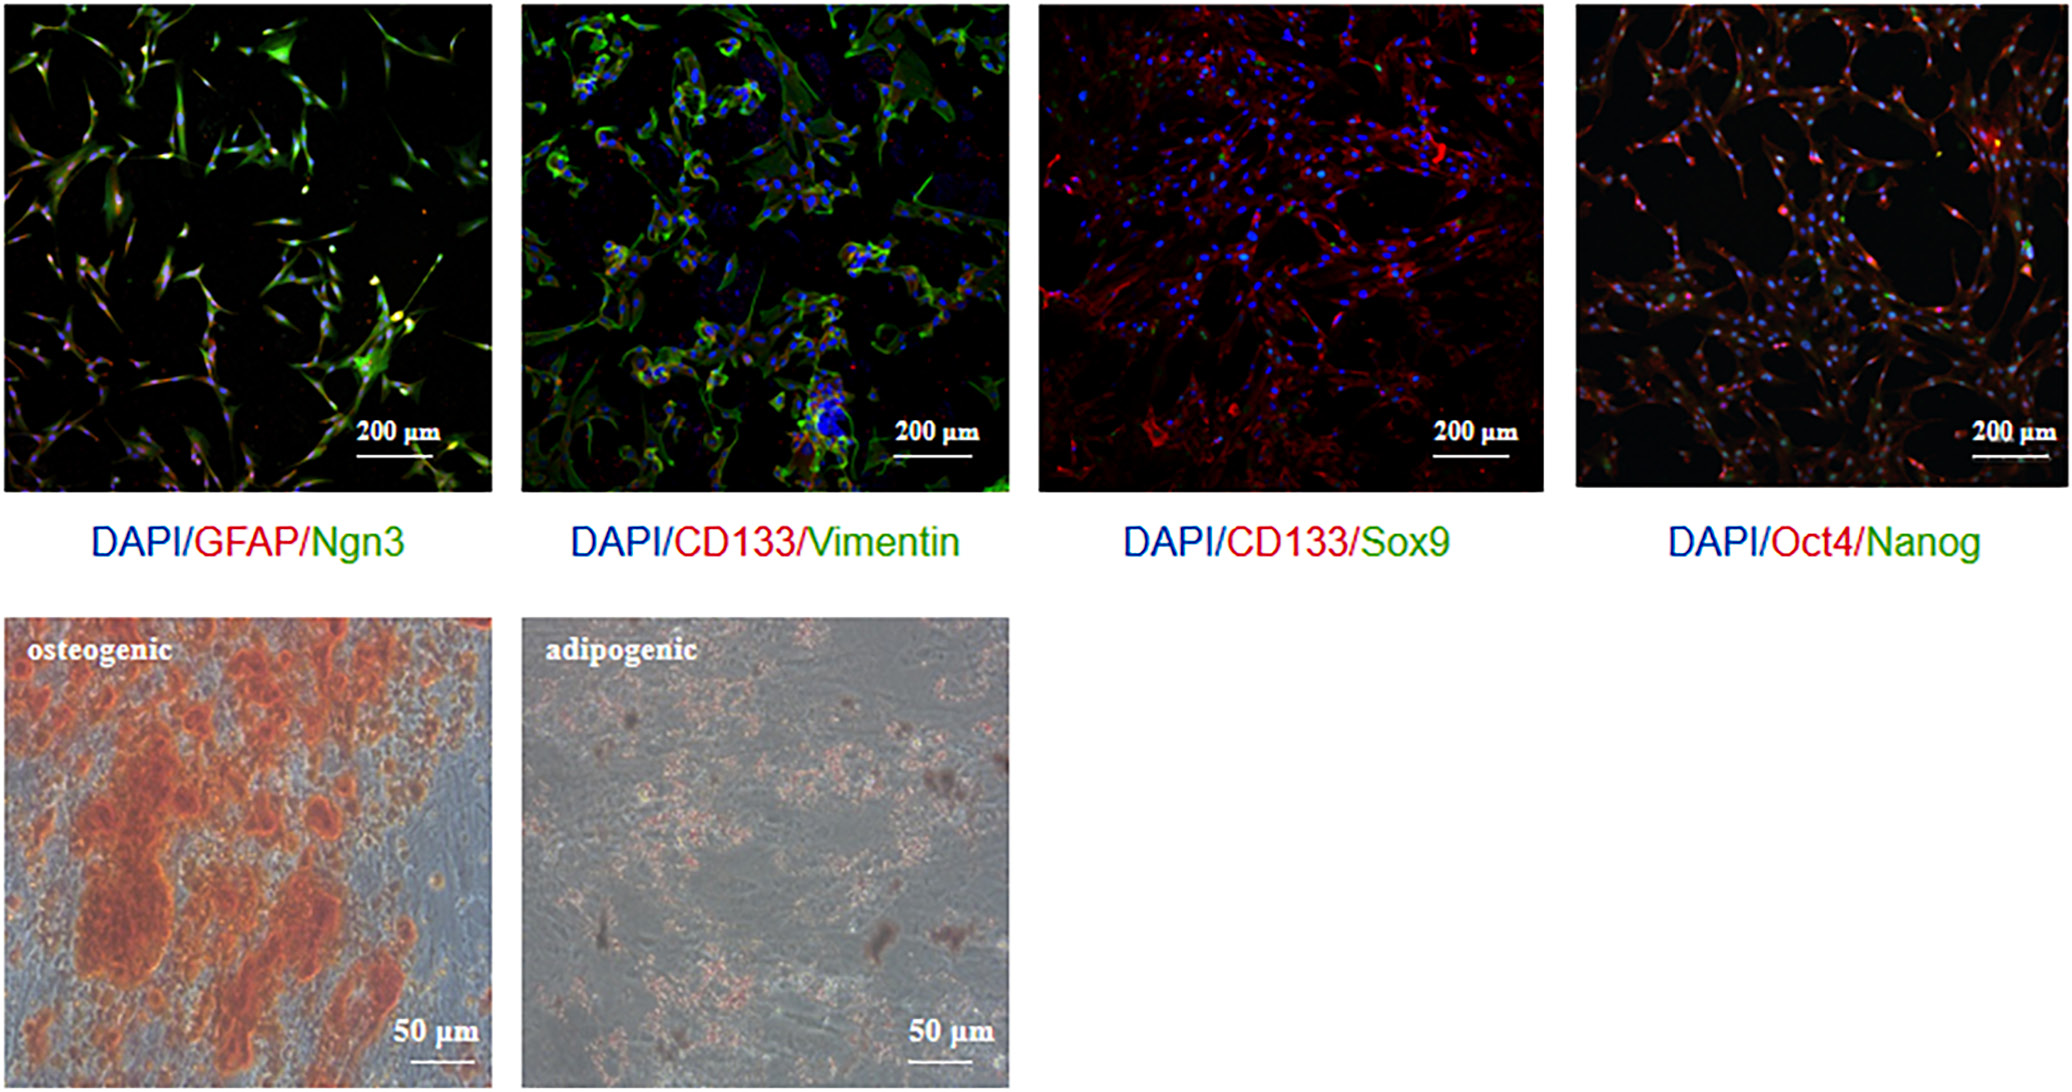
Figure 8 presents a comprehensive list of marker expression in PSC and their differentiation capacity. The top immunofluorescence images depict specific markers indicating co-expression in PSC (Vimentin and GFAP), corresponding to embryonic stem cell markers (Oct4, Nanog and CD133) and pancreatic progenitor cell markers (Ngn3 and Sox9) (Figure 8). The extent to which PSC differentiate into osteogenic, adipogenic, hepatic, and chondrogenic lineages is illustrated through phase-contrast microscopy images, which show the morphological changes associated with each differentiated state (Figure 8). Collectively, these analyses provide valuable insights into the cellular heterogeneity within PSC and their differentiation potential.
Discussion
Pancreatic cancer is among the most lethal forms of cancer, characterized by a dismal prognosis and aggressive behavior. Despite some advancements in medical research, the 5-year relative survival rate for individuals diagnosed with PC remains only 7%.26, 27, 28
The scRNA-seq of pancreatic ductal adenocarcinomas was conducted to provide an extensive analysis of cellular heterogeneity and intercellular communications within the TME. The application of scRNA-seq is rapidly yielding unprecedented insights into cellular dynamics, revealing potential advancements and druggable targets in PC. The construction of pseudotime trajectories has been essential for tracing the developmental pathways of individual cancer cells, identifying critical intermediate states and key regulatory genes that drive these transitions. This has provided a profound understanding of the temporal dynamics of tumor evolution – an essential concept for comprehending the progression of PC from early stages to advanced malignancy. Immunofluorescence studies corroborate the spatial context of scRNA-seq data, particularly regarding the examination of stemness genes. The co-expression of vimentin and GFAP, markers characteristic of PSC, with embryonic stem cell markers (Oct4, Nanog and CD133) and pancreatic progenitor markers (Ngn3 and Sox9), suggests an unrecognized pluripotent potential in these cells. These findings highlight the role of stemness in tumor activity, with implications for various aspects such as cancer recurrence and therapeutic resistance. Pseudotime analysis is pivotal in scRNA-seq studies, as it illuminates the developmental trajectories of cancer cells, identifies key intermediate states, and reveals essential genes that govern these transitions. This analytical framework provides unprecedented insights into the temporal dynamics of tumor evolution, which is crucial for understanding the progression of PC from early disease to advanced malignant states. The selection of parameter settings is critical for validating the results of pseudotime analysis. Several factors must be considered, including biological variability, technical biases and inter-sample variability. For example, methods based on PCA, such as scran and Seurat, perform competitively with default parameters, whereas more sophisticated models like ZinbWave, DCA, and scVI demonstrate enhanced performance with parameter optimization. This indicates that parameter adjustment is a crucial step in optimizing results for various analytical approaches.
CellChat offers ligand-receptor databases for humans and mice, containing extensive validated molecular interaction data essential for understanding and predicting intercellular communication. By comparing ligand and receptor expression across different cell populations or conditions, key molecules related to specific biological processes can be identified. This differential analysis may reveal changes in cell states and variations in intercellular communication.
Our investigation of cell communication has elucidated complex interactions among cancer cells, the stromal compartment, and immune cells within the TME. The findings have illuminated the roles of various cell populations that contribute to tumorigenesis, immune suppression and metastasis by identifying significant signaling crosstalk through ligand-receptor interactions. Understanding the functions of these diverse cell types is critical for developing targeted therapies that address the complexities of the TME. By dissecting cellular heterogeneity, researchers can pinpoint specific cellular interactions and pathways that drive cancer progression, leading to more effective and personalized treatment strategies. Although mutations in genes such as KRAS, TP53 and SMAD4 are prevalent in PC, the specific mutation patterns and their interactions can differ significantly from those in other cancers.
The identification of critical transcription factors and signaling pathways controlling cellular transitions offers potential therapeutic targets. Furthermore, our research has identified disease markers that may facilitate early detection of PC, thereby significantly enhancing patient survival. The findings highlight the efficacy of single-cell technologies in elucidating cancer characteristics and their contribution to precision oncology. These technologies provide a more detailed understanding of the TME, which is essential for personalized treatment approaches.
The integration of these findings into clinical practice will rely on validation in larger cohorts and through clinical trials. A prerequisite for employing this concept, even in its preliminary form, will likely require defining specific genes or pathways modified by these critical drivers (and perhaps several additional alterations) so that targeted agents can be developed. The identification of biomarkers and therapeutic targets has the potential to enable precision diagnostics, prognostics and treatment strategies that could significantly improve patient care. Ultimately, such advances may contribute to increased survival rates and enhanced quality of life for individuals affected by PC.
Limitations
Despite the intriguing results of the study, several limitations exist. Single-cell transcriptome analyses yield highly detailed data but may not capture the dynamic and time-resolved nature of cellular interactions within the TME. Although we identified individual cells as representing fresh and aged states, more dynamic studies must incorporate longitudinal sample collections to map transitions between cellular states.
Conclusions
This study contributes to the growing body of knowledge on PC and demonstrates the potential of single-cell technologies in elucidating, with remarkable clarity, the features that underlie its biology. Immunofluorescence data confirmed the stem-like properties of PSC, revealing their pluripotent potential in tumor dynamics. Analyzing key cellular transitions and intercellular communication provides a foundation for developing innovative therapeutic strategies and underscores the need for further studies to translate these insights into clinically relevant outcomes.. Continued research is essential to validate findings related to personalized treatment and prognostic biomarkers, with the goal of advancing clinical applications and improving patient selection, particularly in the effective management of cancer. This ongoing research is essential for transforming scientific discoveries into effective clinical solutions.
Data Availability Statement
The datasets supporting the findings of the current study are openly available in figshare at https://figshare.com/s/d51989569cd0bf8a0fce.
Consent for publication
Not applicable.
Use of AI and AI-assisted technologies
Not applicable.