Abstract
Background. While observational studies have explored the association between gout, uric acid (UA) levels, and the risk of epilepsy, their findings remain inconsistent.
Objectives. To clarify the potential causal relationship, we performed a Mendelian randomization (MR) analysis.
Materials and methods. We conducted a bidirectional MR analysis using genome-wide association study (GWAS) summary data. Epilepsy data were sourced from the International League Against Epilepsy (ILAE), gout data from the FinnGen consortium and a GWAS of clinically defined gout and its subtypes, and UA data from the BioBank Japan (BBJ) and a genome-wide meta-analysis of serum UA levels in Japanese individuals. The inverse-variance weighted (IVW) method served as the primary causal inference approach. To ensure robustness, we complemented this with 3 additional methods: MR-Egger, weighted median, and MR using Robust Adjusted Profile Score (MR-RAPS) – the latter specifically employed to account for potential weak instrument bias due to the limited number of single-nucleotide polymorphisms (SNPs) included in this analysis.
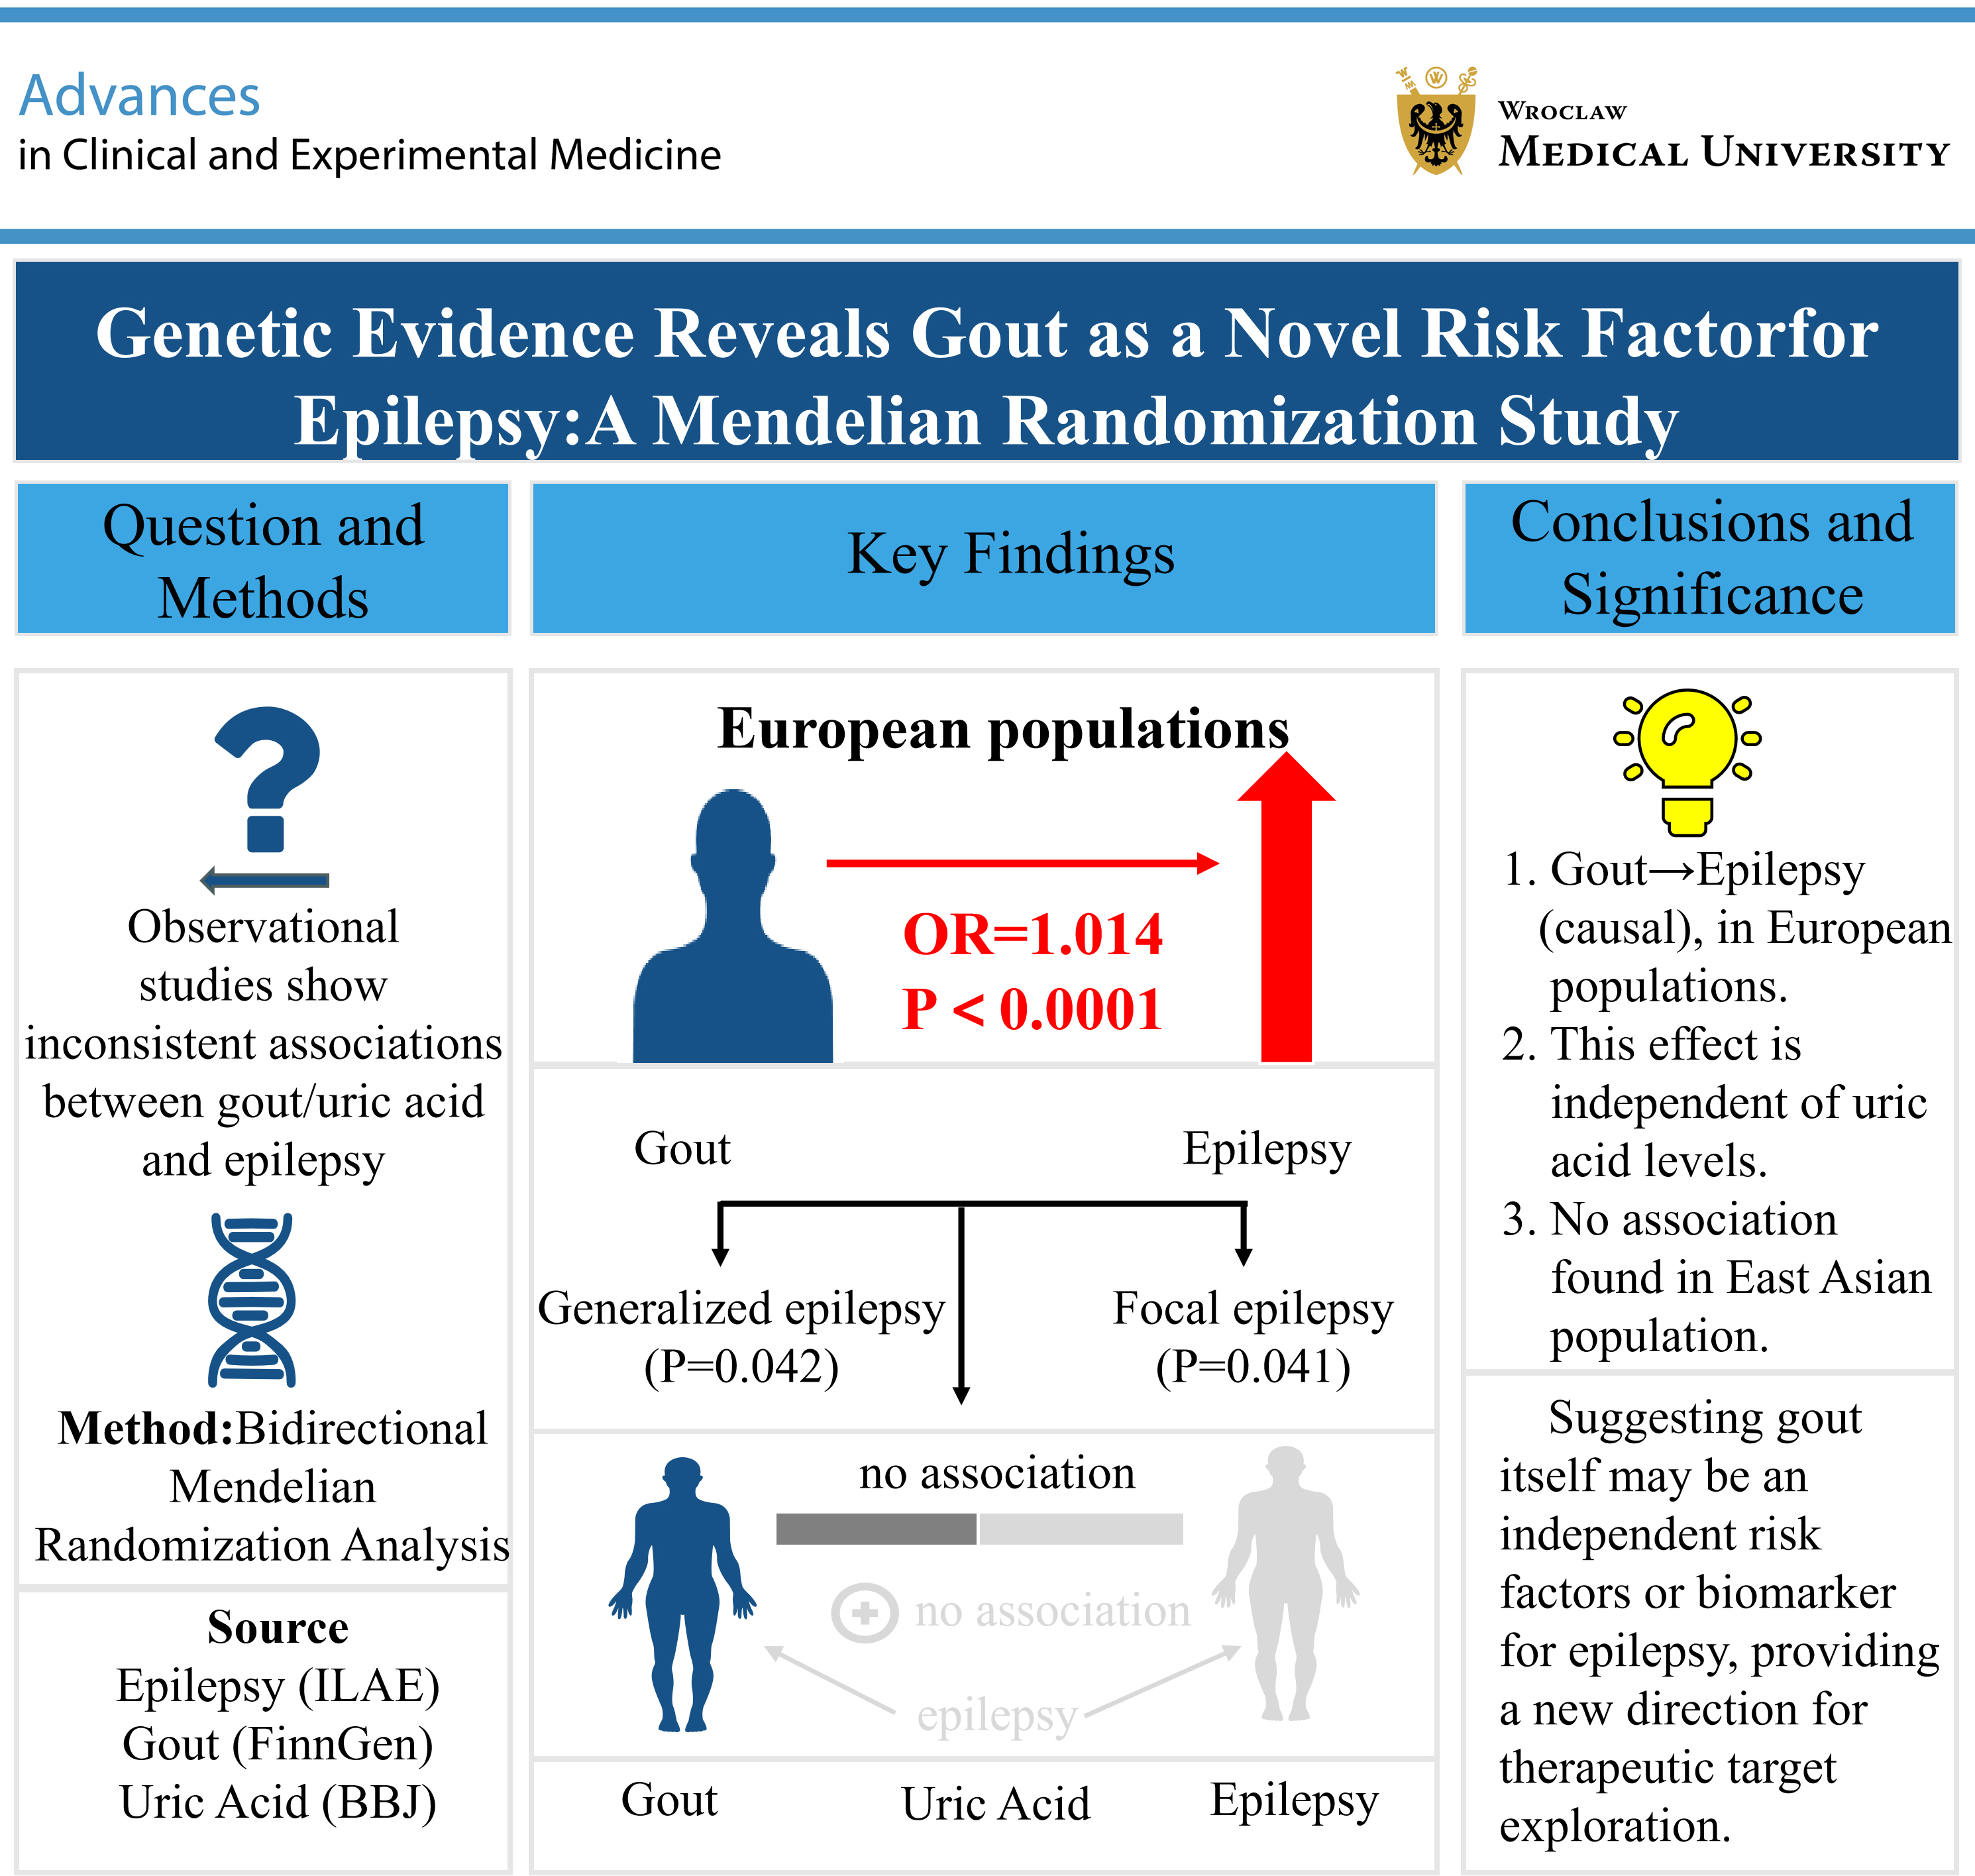
Results. Our analysis identified a causal association between genetically predicted gout and an increased risk of epilepsy (odds ratio (OR) = 1.014, 95% confidence interval (95% CI): 1.011–1.017, p < 0.001), generalized epilepsy (OR = 1.009, 95% CI: 1.000–1.018, p = 0.042), and focal epilepsy (OR = 1.044, 95% CI: 1.002–1.088, p = 0.041) in Europeans. In contrast, UA levels showed no significant association with epilepsy or its subtypes in this population. Similarly, neither gout nor UA levels were linked to epilepsy in East Asians. Sensitivity analyses generally supported the robustness of the primary findings.
Conclusions. This MR study provides genetic evidence supporting a potential causal role of gout in increasing the risk of epilepsy, including generalized and focal epilepsy, in European populations. In contrast, genetically predicted UA levels showed no significant association with epilepsy. These findings support a potential role of gout in epilepsy risk and warrant further investigation into the underlying mechanisms.
Key words: gout, epilepsy, Mendelian randomization analysis, uric acid metabolism, genetic predisposition to disease
Background
Epilepsy is a brain disorder defined by meeting any of the following criteria: 1) at least 2 unprovoked seizures occurring more than 24 h apart; 2) 1 unprovoked seizure with a high subsequent recurrence risk (≥60%); or 3) a diagnosis of an epilepsy syndrome in individuals with a history of unprovoked seizures over a decade.1 Epilepsy is estimated to affect more than 70 million people globally, imposing a substantial global economic and social burden.2 Epilepsy can arise from various etiologies, including structural, infectious, genetic, immune-mediated, and metabolic factors, among others. Identifying the underlying cause of epilepsy and targeting it with precise treatment is crucial. A metabolic etiology denotes a well-defined metabolic deficiency that manifests as systemic biochemical alterations, encompassing conditions such as porphyria, uremia, aminoacidopathies, or pyridoxine-dependent seizures.3 However, there remain numerous unknowns in this field.
Gout is the most prevalent form of inflammatory arthritis, resulting from abnormal purine metabolism and impaired uric acid (UA) excretion. It manifests as elevated serum UA levels and joint pain. When the UA concentration in the blood becomes excessively high, monosodium urate (MSU) crystals can form, potentially leading to severe pain and joint inflammation. Monosodium urate crystals activate the immune response in the body, activating monocyte or macrophage inflammatory mediators and leading to an inflammatory response in the joint. Two population-based cohort studies conducted in German and Chinese populations found that gout patients have a significantly increased risk of epilepsy compared to those who do not suffer from gout.4, 5 Animal experiments have also shown that hyperuricemia may facilitate seizure generalization, whereas a reduction in UA levels can produce anticonvulsant effects.6 However, the mechanism by which gout or hyperuricemia induces epilepsy is still elusive. Given the susceptibility of traditional epidemiological studies to confounding and reverse causality, the relationship between gout, UA levels, and epilepsy risk remains unclear. To address this, we employed Mendelian randomization (MR) to assess their causal associations at the genetic level using single-nucleotide polymorphisms (SNPs).
Mendelian randomization employs genetic variants as instrumental variables to infer causal relationships between exposures and outcomes. A key advantage of this approach is that, since genetic alleles are randomly assigned and fixed at conception, MR estimates are less susceptible to confounding biases and reverse causation than conventional observational studies.7, 8 Moreover, because the genetic code is not influenced by environmental factors or pre-clinical diseases, it is also less susceptible to bias caused by reverse causation. Recently, MR has also been used to explore the potential etiology of epilepsy.9, 10 Large-scale genome-wide association studies (GWAS) have identified multiple susceptibility loci and highlighted diverse biological mechanisms underlying the common epilepsies.11
Objectives
Therefore, this two-sample MR study aims to investigate the causal effects of gout and UA levels on the risk of epilepsy and its subtypes. We want to provide an evidence base for epilepsy prevention and the screening of high-risk groups.
Materials and methods
Study overview
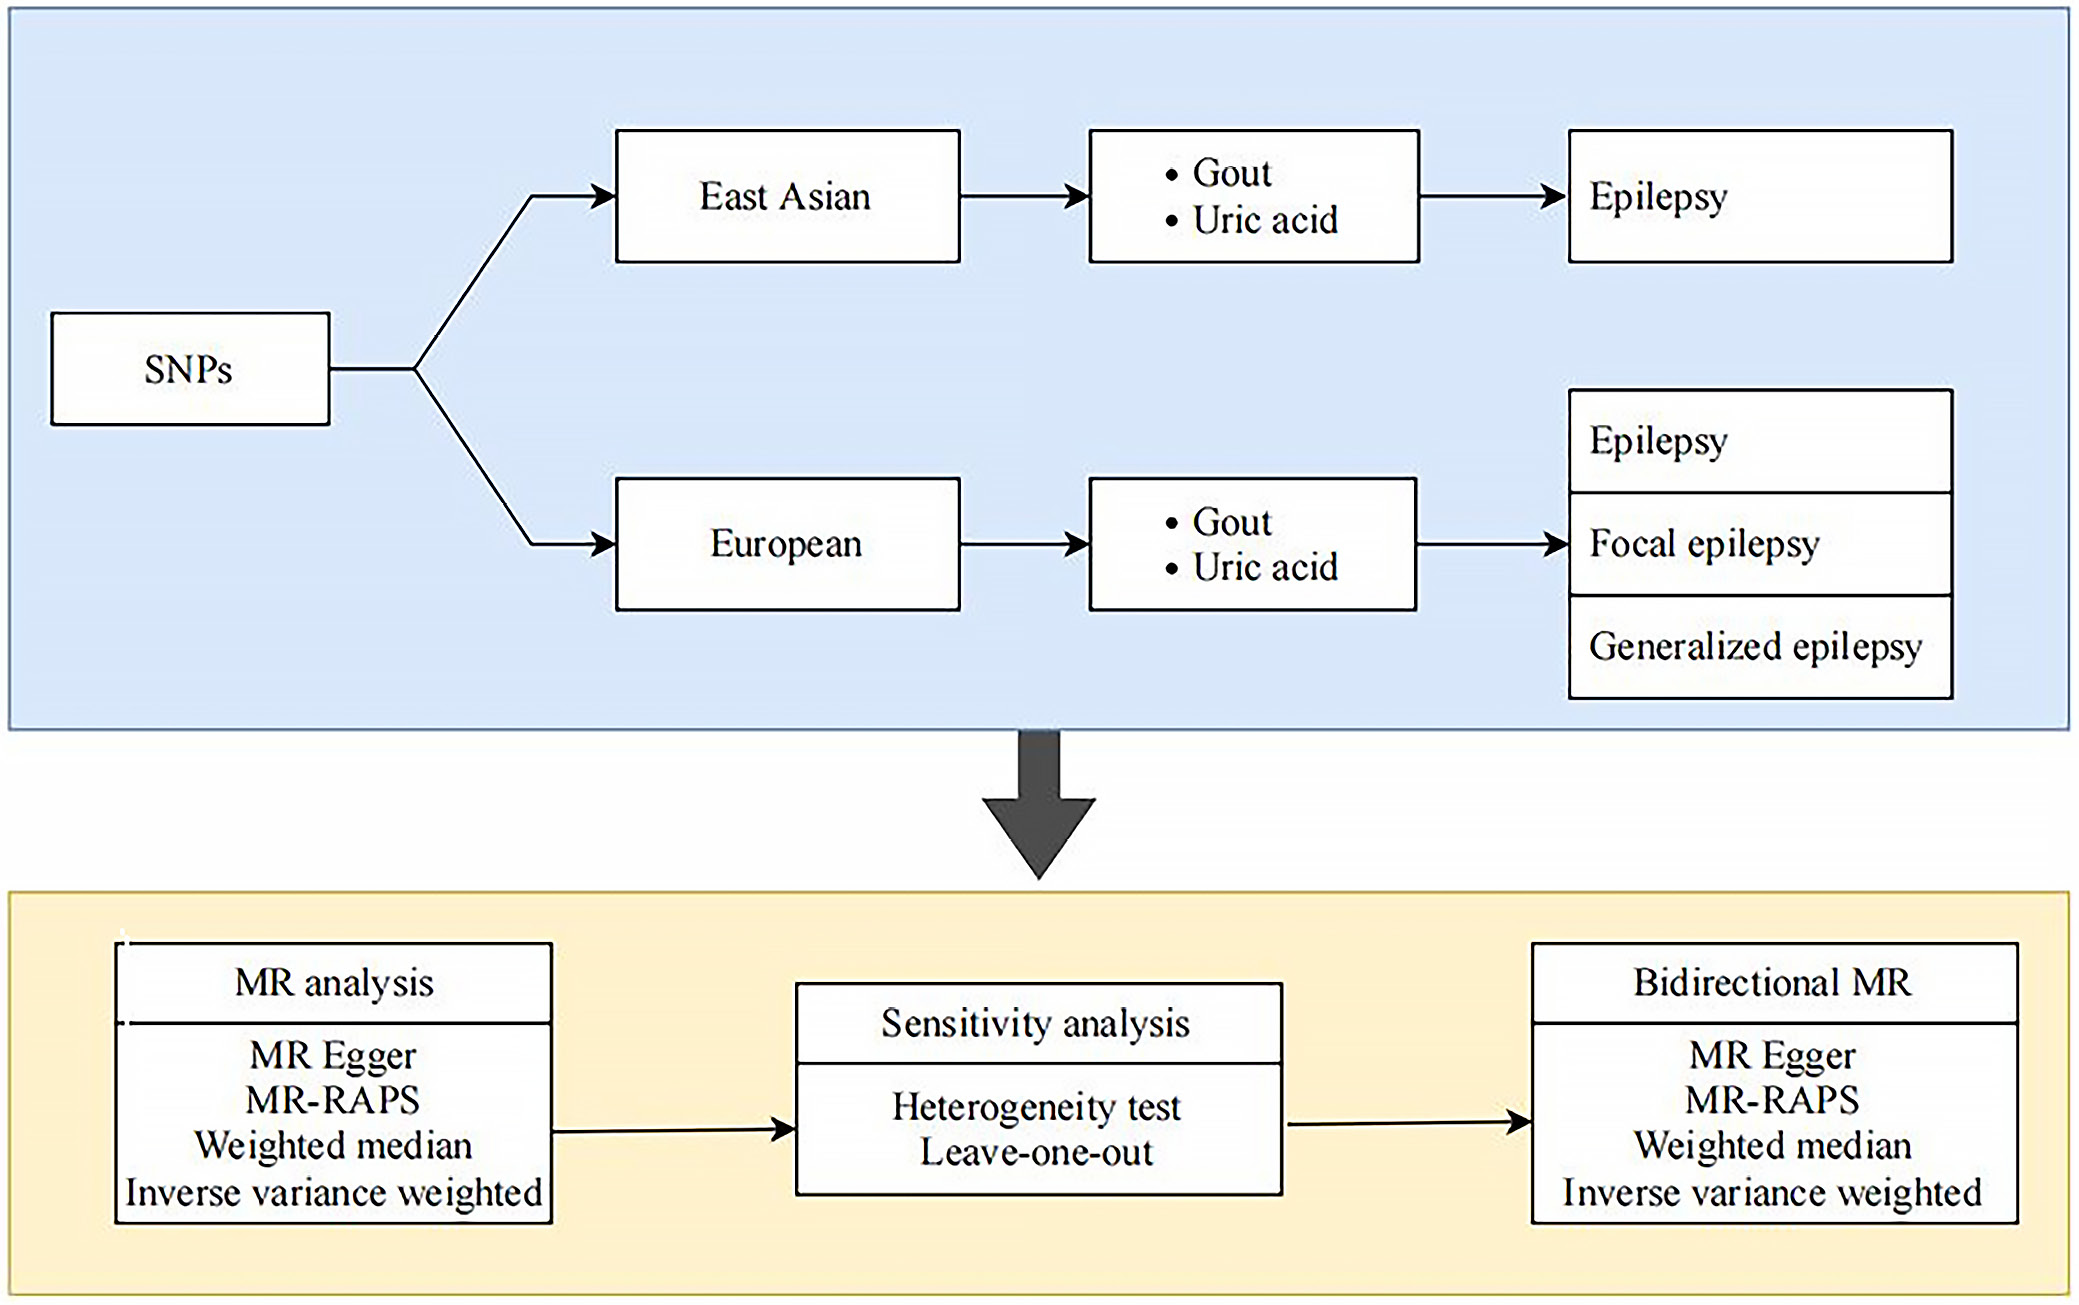
We conducted a two-sample MR analysis using publicly available GWAS summary statistics to assess the causal effects of gout and UA on various epilepsy phenotypes (including generalized and focal subtypes) in European populations (the study design is outlined in Figure 1). The MR methodology is grounded on 3 key assumptions: 1) the genetic instrumental variables (IVs) must be strongly associated with the exposure; 2) the IVs are independent of confounders; and 3) the IVs influence the outcome solely via the exposure.
Data sources for the exposure
Exposure data for genetic variants associated with gout in European populations were obtained from FinnGen, which identified 1,451 gout SNPs (p < 5 × 10⁻⁸). After clumping (r2 < 0.01, kb = 1,000), 3 independent SNPs were retained as IVs for the MR analysis (Table 1).12, 13 Meanwhile, IVs for gout in East Asian populations were obtained from the study by Nakayama et al.,12 which identified 65 gout-related SNPs (p < 5 × 10⁻⁸). After clumping, 30 independent SNPs with a unit decrease and 35 with a unit increase were adopted as IVs for gout (Table 1).
For UA, an analysis of BioBank Japan (BBJ) data from East Asian populations (Table 1)12, 13 identified 32 independent SNPs as IVs for UA. Additionally, a separate East Asian GWAS (Nakatochi et al.13) was included in the UA analyses, with 10–20 SNPs included in the final MR analyses depending on the epilepsy outcome (Table 1).13
Data sources for the outcome
Data for this study were derived from publicly available GWAS summary statistics provided by the International League Against Epilepsy (ILAE) consortium. These studies primarily included individuals of European ancestry. The analysis incorporated 3 phenotypes: all epilepsy (15,212 cases and 29,677 controls), generalized epilepsy (3,769 cases and 29,677 controls), and focal epilepsy (9,671 cases and 29,677 controls) (Table 2). For East Asian populations, epilepsy data were obtained from BBJ (2,143 cases and 210,310 controls) (Table 2). As this research utilized only de-identified, aggregate data from published studies, no additional ethical approval was required. Ethical approvals for the original GWAS were obtained, as reported in their respective primary publications.
Instrumental variable selection
To select IVs, SNPs significantly associated with gout and UA (or with epilepsy in reverse-direction analyses) were initially identified at a genome-wide significance threshold (p < 5×10⁻⁸). Linkage disequilibrium (LD) among these SNPs was mitigated by applying a clumping procedure (r2 < 0.01, distance = 1,000 kb). Each candidate SNP was further evaluated for potential violations of MR assumptions (particularly independence from confounders and absence of direct pathways to the outcome) using the PhenoScanner database (http://www.phenoscanner.medschl.cam.ac.uk). 14 Palindromic SNPs and those absent from the outcome dataset were excluded. The strength of the selected instruments was quantified using the F-statistic; an F-statistic exceeding 10 was taken to indicate minimal risk of weak instrument bias.15
Functional enrichment analysis
Functional enrichment analysis, including Gene Ontology (GO) and Kyoto Encyclopedia of Genes and Genomes (KEGG) pathway analyses, was performed using the DAVID Functional Annotation Tool (https://davidbioinformatics.nih.gov). The results were visualized using the SRplot online bioinformatics platform (https://www.bioinformatics.com.cn). Gene Ontology terms were classified into 3 domains: biological process (BP), cellular component (CC), and molecular function (MF). Enrichment was considered significant at p < 0.05.
Statistical analyses
To analyze the causal associations, we employed multiple MR methods. The inverse-variance weighted (IVW) method under a random-effects model served as the primary analysis. Sensitivity analyses were conducted using the weighted median method and MR-Egger regression, the latter of which also assessed potential pleiotropy. Given the limited number of genetic instruments, Mendelian Randomization using Robust Adjusted Profile Score (MR-RAPS) was additionally applied to account for potential weak instrument bias. All causal estimates are presented as odds ratios (ORs) with 95% confidence intervals (95% CIs). These analyses were implemented using the TwoSampleMR package v. 4.4.1 (https://mrcieu.github.io/TwoSampleMR) in R (R Foundation for Statistical Computing, Vienna, Austria).
Results
Selection of genetic variants
The validity of the MR assumptions was rigorously tested. The IVs exhibited strong correlation with the exposures (F-statistics > 10; Table 3), satisfying the 1st key assumption. The MR-Egger intercept test detected no significant pleiotropy for most outcomes (all p > 0.05), except for the analysis of UA (unit increase) and generalized epilepsy (p = 0.042). In contrast, the corresponding MR-Egger intercept test for gout and generalized epilepsy was not significant (p = 0.932). These results largely satisfied the 2nd assumption. Furthermore, no heterogeneity was detected using Cochran’s Q test (all p > 0.05; Table 3), thus fulfilling the 3rd assumption.
Mendelian randomization analysis
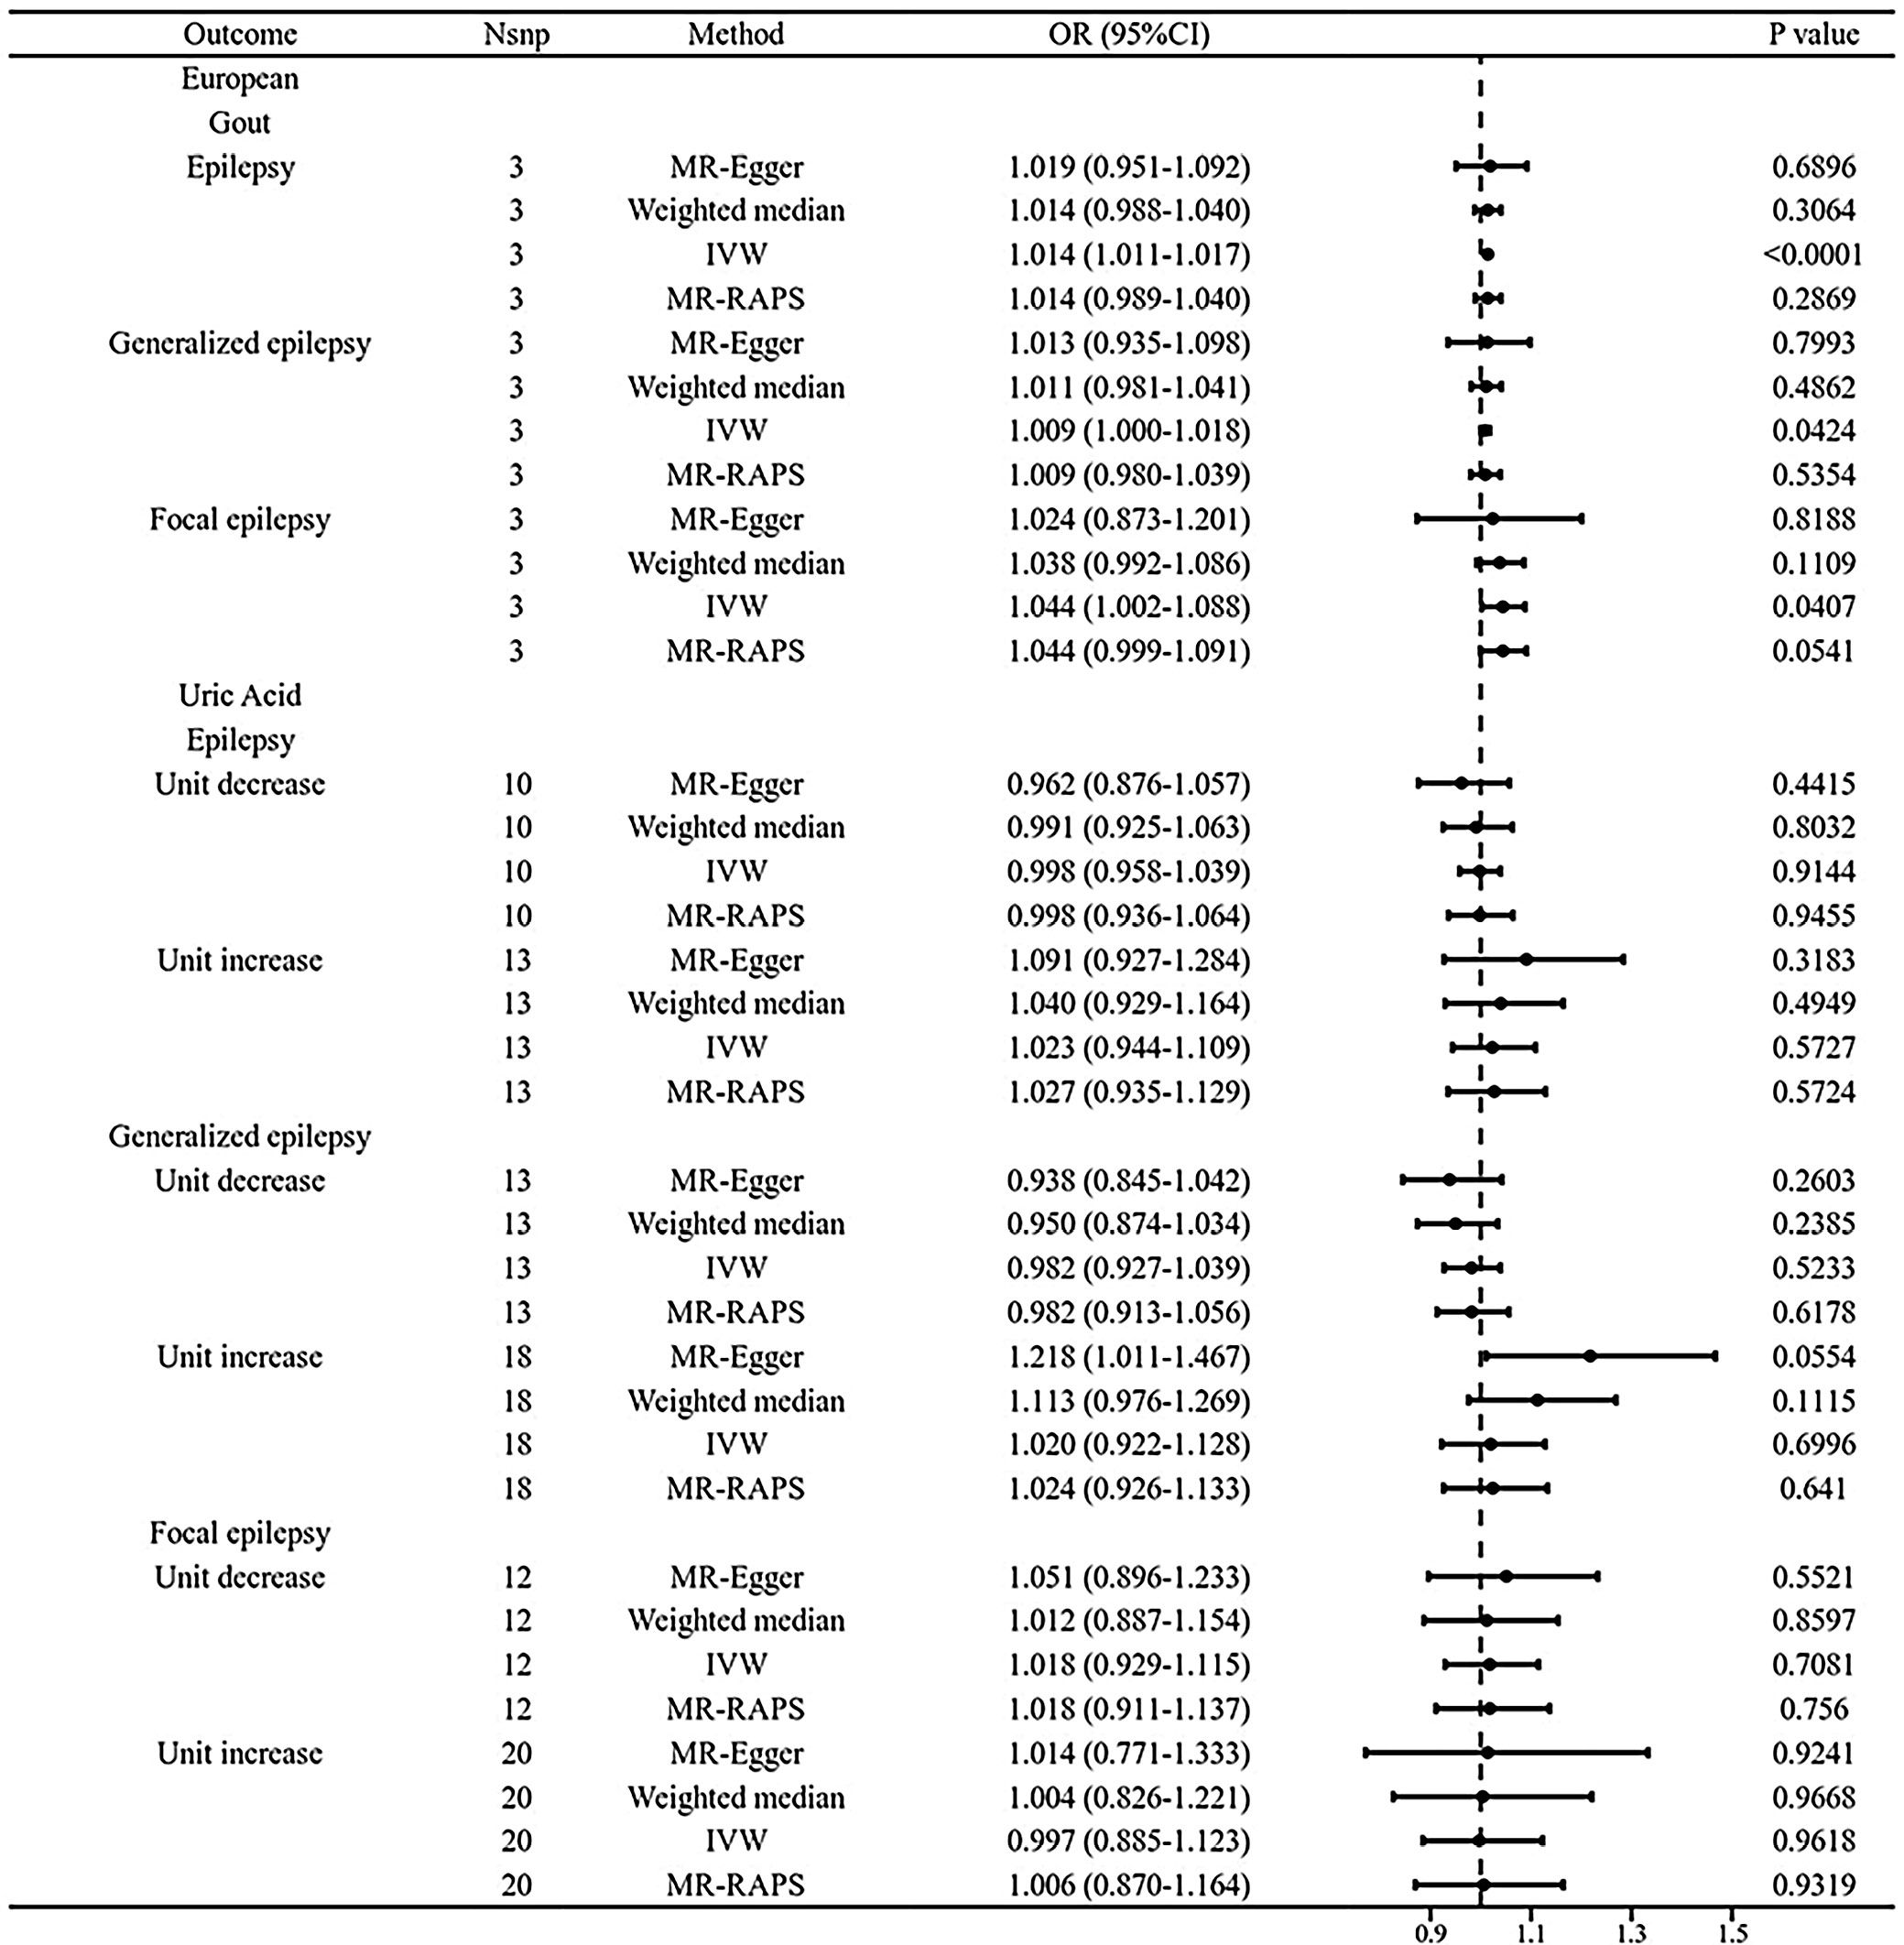
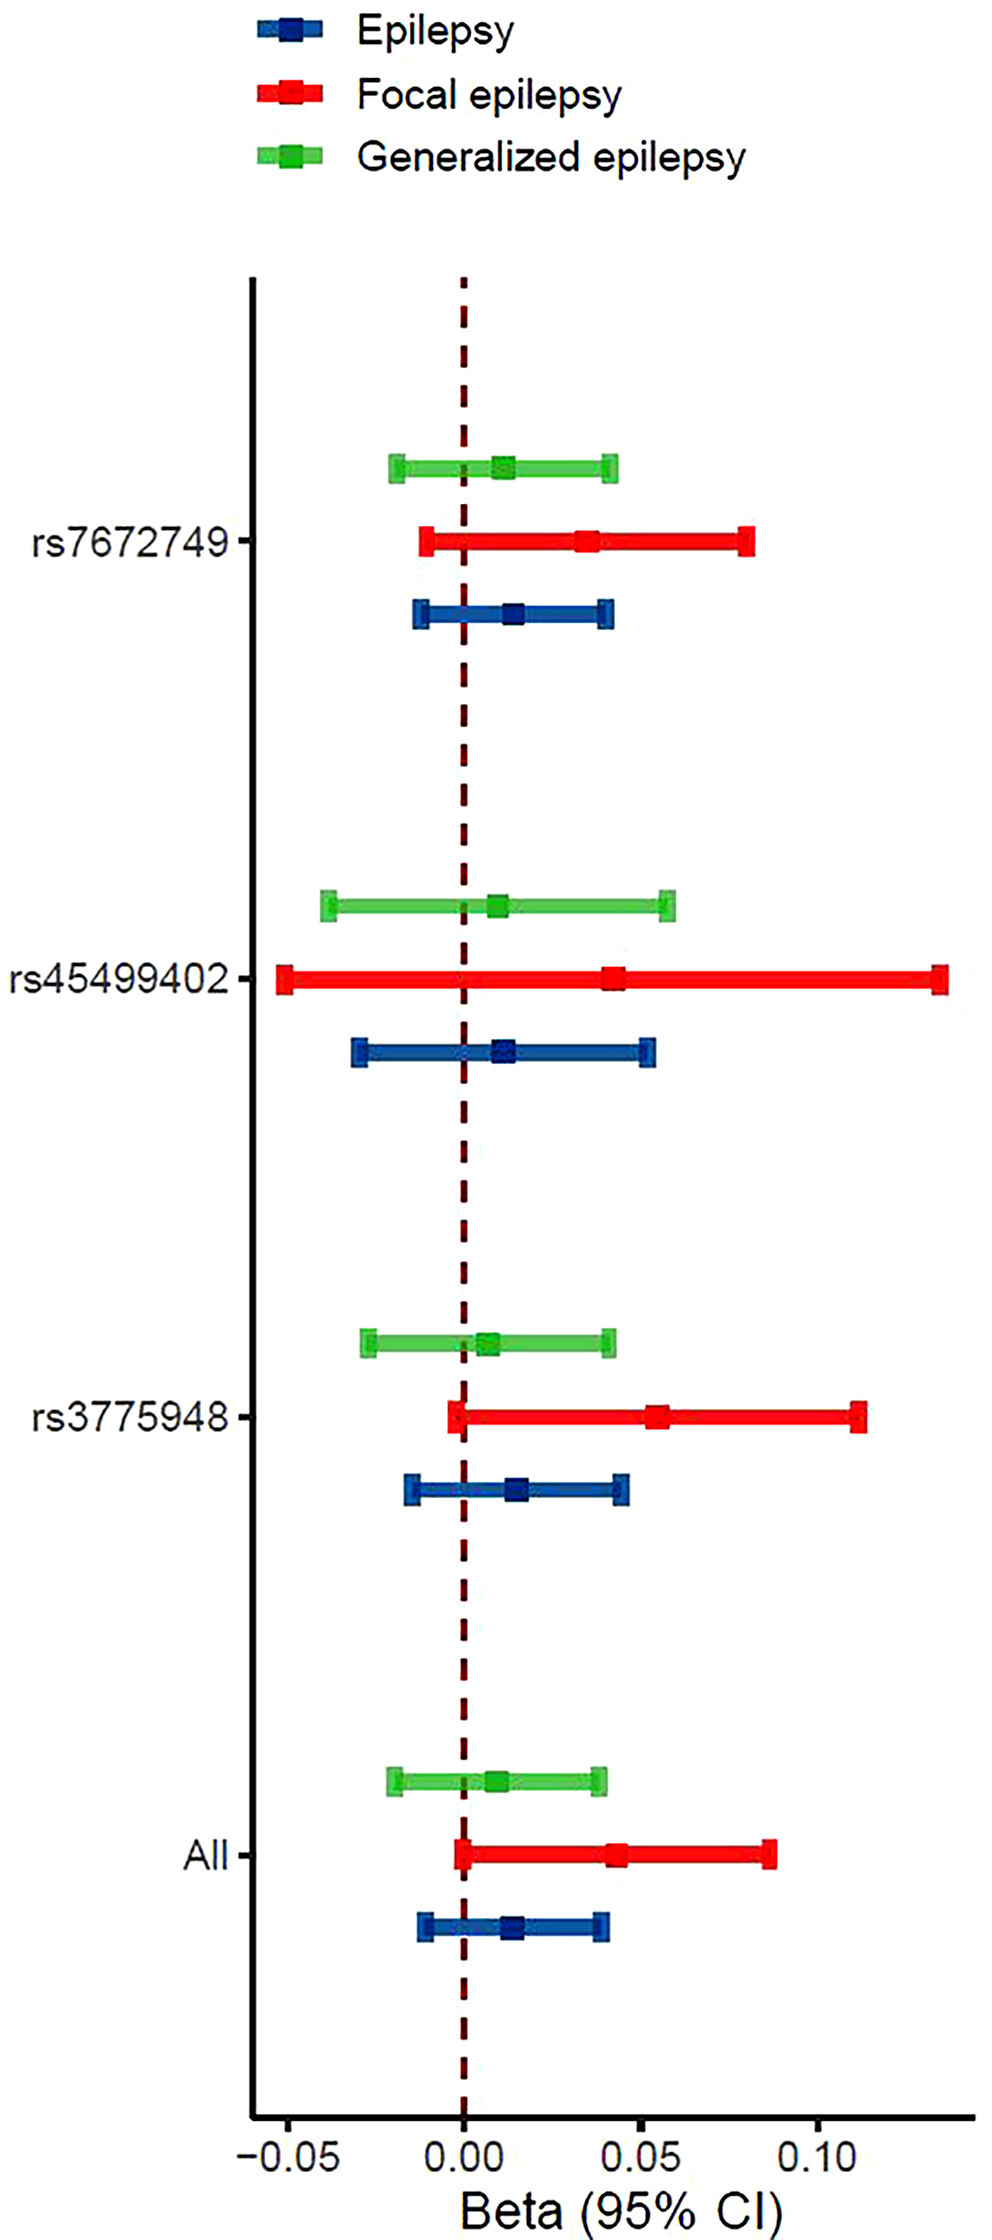
After data preprocessing, we performed MR analyses to assess causal relationships between the exposures (gout, UA) and epilepsy using IVW, weighted median, and MR-Egger methods. At the adjusted significance threshold, the IVW method revealed 3 significant associations between gout and epilepsy (Figure 2). Specifically, gout showed a positive association with epilepsy risk in European populations (OR = 1.014, 95% CI: 1.011–1.017, p < 0.001). A similar trend was observed with the weighted median method, though with a wider CI (OR = 1.014, 95% CI: 0.988–1.040, p = 0.306). Moreover, MR-Egger intercept tests indicated no significant directional pleiotropy (p > 0.05), supporting the robustness of the primary findings.
Genetically predicted gout was found to be associated with an elevated risk of generalized epilepsy in European populations. Specifically, the OR for generalized epilepsy was 1.009 (95% CI: 1.000–1.018, p = 0.042), as illustrated in Figure 2. Consistent trends were observed using the weighted median method, albeit with broader CIs (OR = 1.011; 95% CI: 0.981–1.041, p = 0.486). Notably, for gout and generalized epilepsy, the MR-Egger intercept test provided no indication of directional pleiotropy (p = 0.932), suggesting that the observed association was not confounded by horizontal pleiotropy.
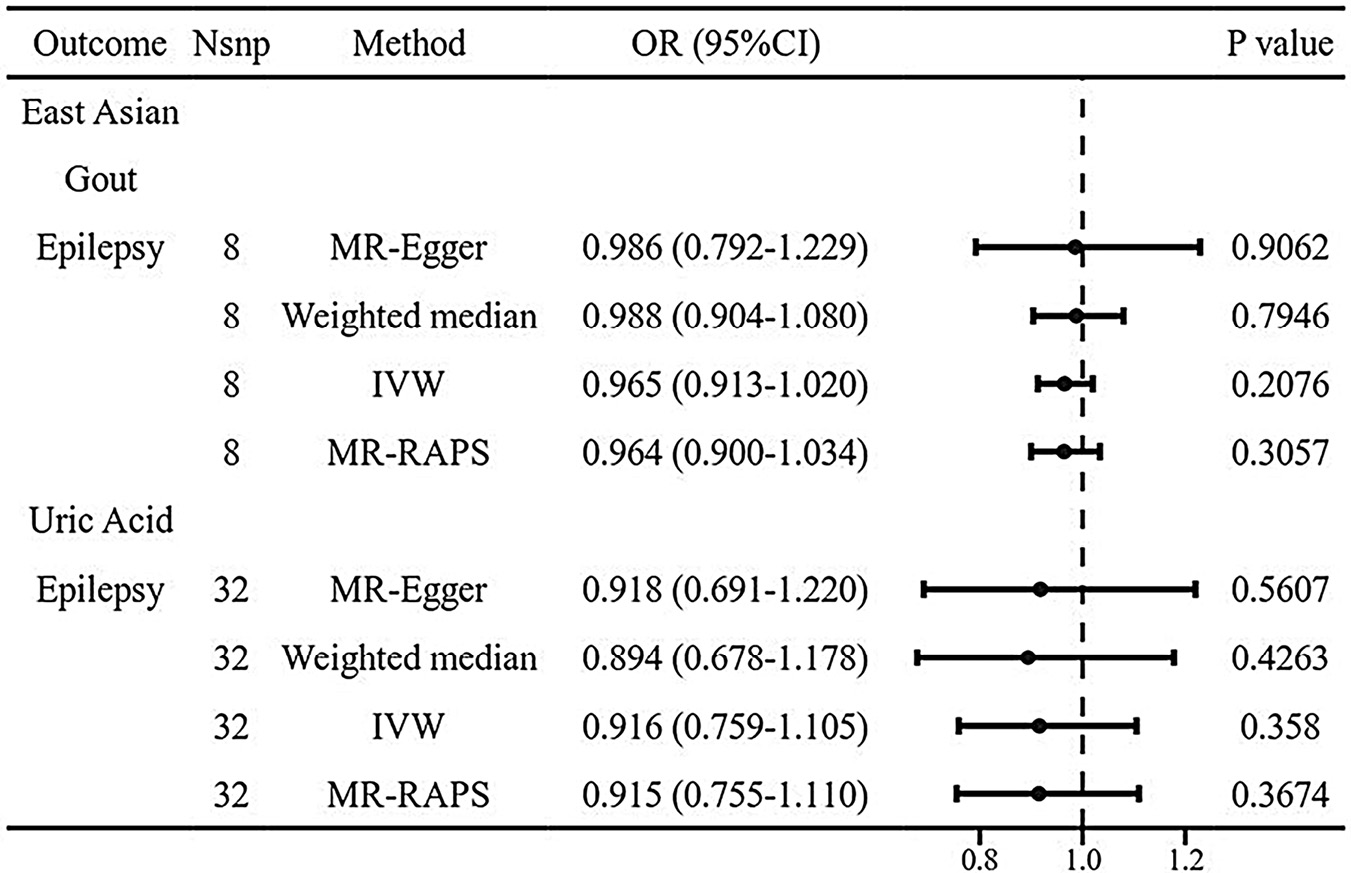
Additionally, genetically predicted gout was associated with an increased risk of focal epilepsy in European populations (OR = 1.044, 95% CI: 1.002–1.088, p = 0.041; Figure 2). A consistent, though nonsignificant, trend was observed with the weighted median method (OR = 1.038, 95% CI: 0.992–1.086, p = 0.111). The absence of directional pleiotropy in the MR-Egger intercept test for gout and focal epilepsy (p = 0.841) further supported this association. In contrast, neither UA levels nor gout showed any significant causal relationship with epilepsy or its subtypes in East Asian populations (Figure 3).
Reverse Mendelian randomization analysis
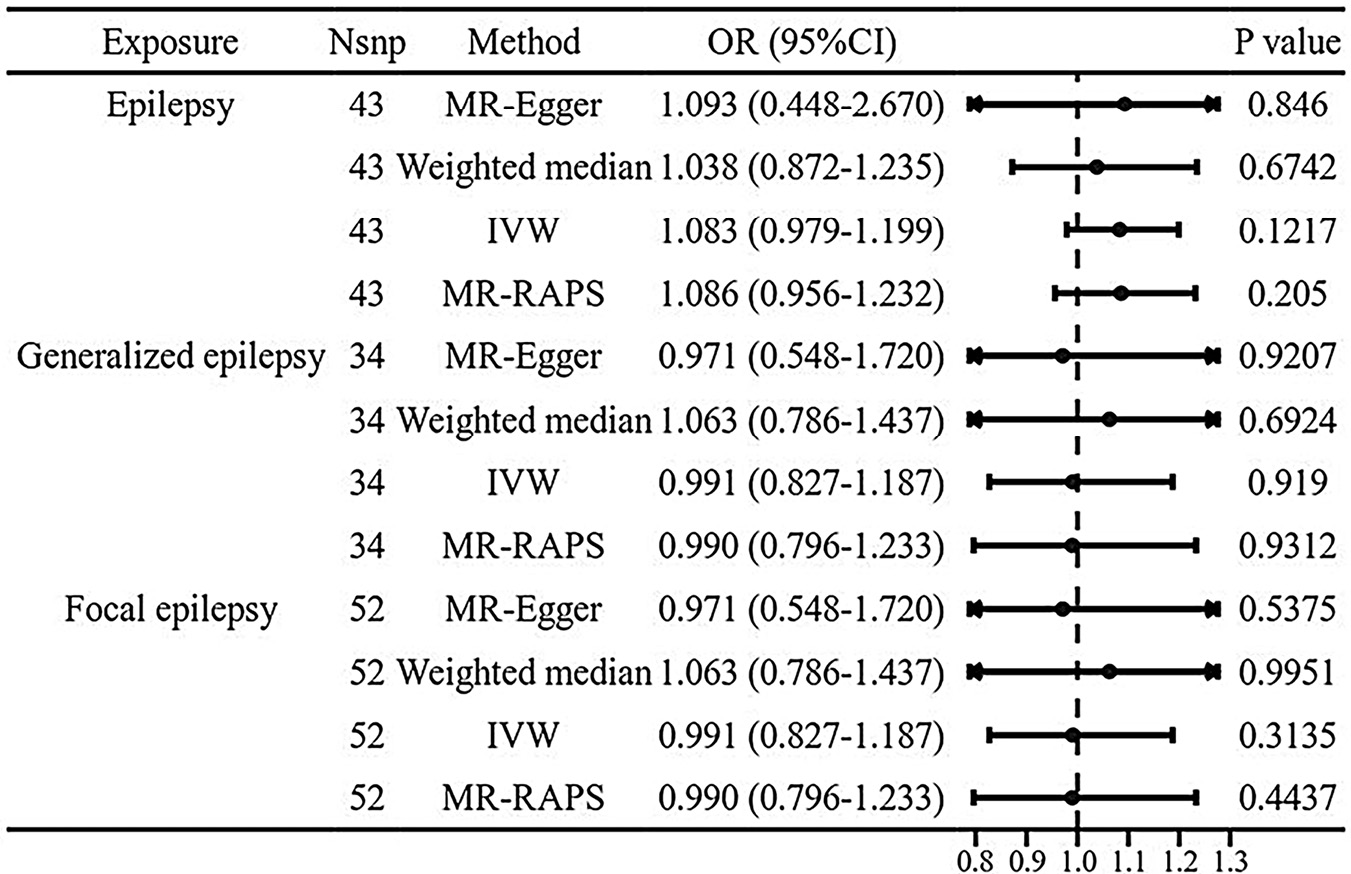
We also performed reverse MR analysis to assess the causal effect of epilepsy and its subtypes on gout in European populations. Genetically predicted epilepsy, generalized epilepsy, and focal epilepsy all showed no significant association with gout risk (IVW ORs: 1.082, 1.083, and 0.991, respectively; all p > 0.05; Figure 4). These null findings were consistent with those obtained using the weighted median method, and the absence of directional pleiotropy (MR-Egger intercept tests: p > 0.05) supported the robustness of these results.
Sensitivity analysis
In the leave-one-out sensitivity analysis, after each SNP was removed in turn, the beta estimate based on the remaining SNPs consistently remained to the right of the null line (β = 0), indicating a positive causal effect (Figure 5). This further demonstrates the robustness of the results.
Gene set enrichment analyses
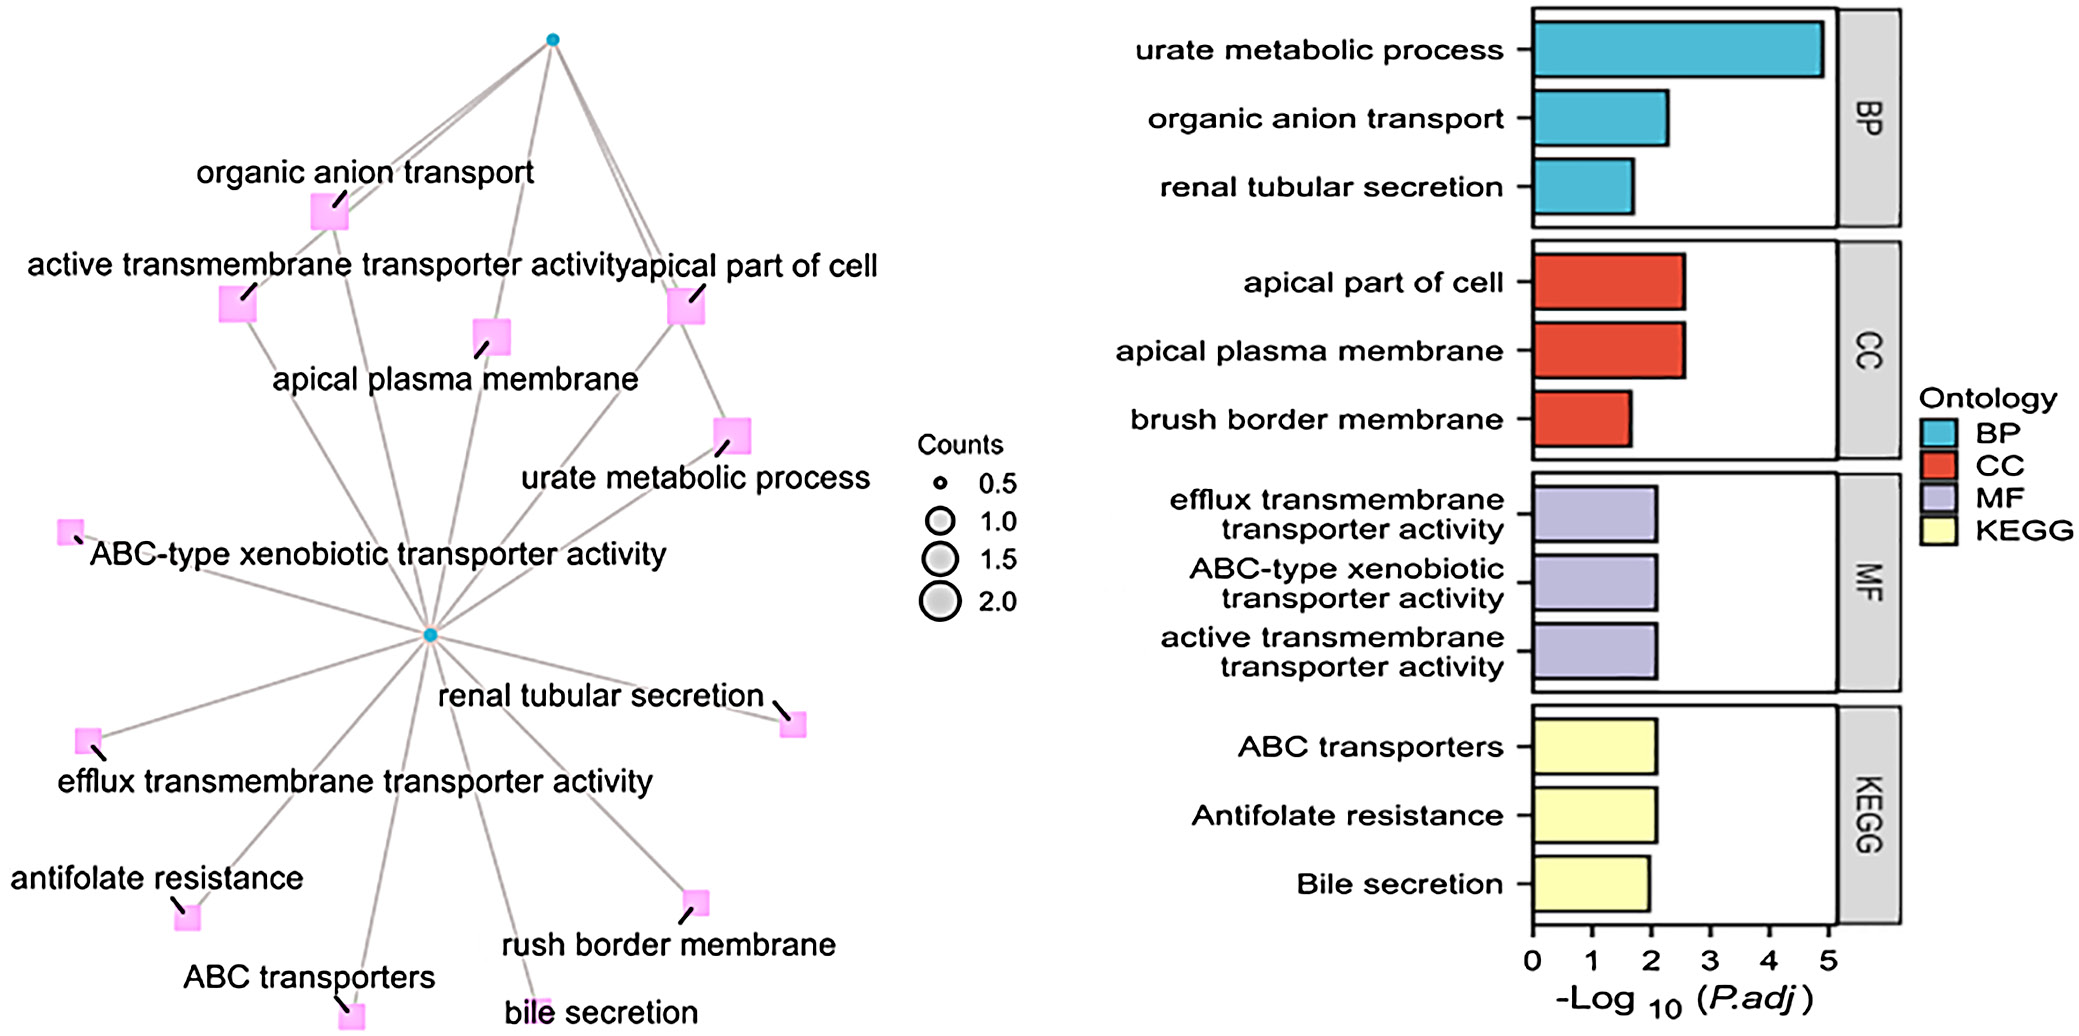
To explore the potential mechanisms linking gout to epilepsy, we performed functional enrichment analyses on 2 candidate genes using the DAVID Functional Annotation Tool. The GO analysis categorized gene functions into 3 domains: molecular function, cellular component, and biological process. Concurrently, pathway enrichment was assessed using the KEGG database. The GO results indicated that the genes were primarily associated with the apical plasma membrane, brush border membrane, and the apical part of the cell at the cellular component level. For molecular function, they were enriched in ABC-type xenobiotic transporter activity and efflux transmembrane transporter activity. Biologically, the genes were implicated in the urate metabolic process, organic anion transport, and renal tubular secretion (Figure 6). The KEGG pathway analysis further revealed significant enrichment in antifolate resistance, ABC transporters, and bile secretion (Figure 6).
Discussion
Despite limited research on the link between gout and epilepsy, our investigation sought to elucidate the causal association between gout and epilepsy risk using an MR design. Our findings indicated that genetically predicted gout was associated with an elevated risk of epilepsy in European populations. Specifically, individuals with a genetically predicted propensity for gout exhibited a higher likelihood of developing epilepsy. To the best of our knowledge, this is the first MR study to provide genetic evidence supporting a causal association between gout and epilepsy risk.
The findings presented herein align with the outcomes derived from 2 cohort studies sourced from the Registry of Catastrophic Illnesses Patient Database (RCIPD)5 and the IQVIA Disease Analyzer data source.4 The former cohort encompassed 104,238 individuals aged 20 years or older, and non-gout controls were frequency-matched to the gout group in a ratio of 2 : 1, considering factors such as demographic and clinical characteristics. The analysis revealed that the gout group exhibited a 1.27-fold increase in the overall crude hazard ratio (HR) for epilepsy, in contrast to the control group. After the analyses were adjusted for potential confounding variables, including age, sex, and comorbidities, the gout patients continued to demonstrate a significantly increased risk of epilepsy compared to the control group. Specifically, the adjusted HR for epilepsy among gout patients was 1.25 (95% CI: 1.15–1.36). Similarly, our findings are consistent with those of a retrospective cohort analysis that used the IQVIA Disease Analyzer database and involved 224,964 primary care outpatients.4 That study identified 112,482 outpatient-managed gout patients and matched them 1 : 1 with non-gout individuals based on sex, age, annual consultation frequency, and pre-existing epilepsy risk factors. Over a 10-year follow-up, epilepsy incidence was significantly higher in the gout cohort (2.2%) than in the non-gout cohort (1.6%; log-rank p < 0.001). These retrospective studies consistently indicate that gout can elevate the risk of epilepsy, aligning with our research findings. However, these retrospective studies are confined to basic demographic information and lack detailed information on the etiology, seizure types, and treatment modalities of epilepsy. Furthermore, genetic factors have not been taken into consideration in these studies. Our research methodology is grounded in Mendel’s laws of inheritance, utilizing genetic variations associated with gout as instrumental variables. By comparing epilepsy occurrence among individuals with various genotypes, we aimed to infer the impact of these genes on the occurrence of epilepsy. This approach enabled us to provide a more precise genetic foundation for future studies in transcriptomics, proteomics, or epigenomics, and furthermore, it holds promise for advancing targeted therapies for epilepsy.
What mechanisms might underlie the association between gout and an increased risk of epilepsy, and could genetic correlations contribute to these mechanisms? Obviously, gout, characterized as an immune-inflammatory disease, is recognized as a prototypical inflammatory arthritis intricately associated with disturbances in purine metabolism and impaired UA excretion, which promote the formation of MSU crystals.16 When blood UA concentrations surpass the solubility limit (typically exceeding 420 μmol/L), MSU crystals may precipitate.17, 18 When MSU crystals deposit within joints and stimulate the synovial membrane,19 they can induce acute attacks of arthritis, manifesting as symptoms such as joint redness, swelling, warmth, and pain. Additionally, MSU crystals induce inflammatory reactions and oxidative stress20 and increase neuronal excitability.21 The deposition of urate crystals triggers the NLRP3 inflammasome via caspase-1 activation, resulting in the release of pro-inflammatory cytokines such as interleukin (IL)-1β and IL-18.22, 23 These cytokines, particularly IL-1β expressed by activated microglia and astrocytes, can modulate glutamatergic neurotransmission, thereby potentially playing a key role in the pathogenesis of epilepsy. Specifically, IL-1β enhances the release of glutamate from astrocytes while concurrently reducing its reuptake, leading to increased glutamate availability within neuronal synapses. This increase in synaptic glutamate availability promotes neuronal hyperexcitability.24 Furthermore, IL-1β is hypothesized to induce seizures by upregulating postsynaptic NMDA receptors, specifically through activation of the GluN2B subunit, consequently enhancing glutamatergic signaling and potentially triggering seizure activity.25 Therefore, gout-induced inflammation, oxidative stress, and increased neuronal excitability may contribute to seizure susceptibility.
Apart from oxidative stress, inflammation, and increased excitability of neurons, studies have indicated that pain itself can also induce epileptic seizures. Over the past decades, numerous studies have demonstrated the involvement of the cerebral cortex and its extensive cortical network in the processing of pain.26 These investigations have revealed that the mechanism underlying seizures encompasses alterations in the circuitry interconnecting the thalamus and cerebral cortex.26 Consequently, it is plausible that the pain associated with gout could provoke seizures by inducing aberrant electrical activity in these circuits. However, this specific link remains hypothetical, as no clinical or experimental studies have directly investigated whether gout-related pain can induce epilepsy, highlighting a valuable direction for future research.
The aforementioned discussion delves into the mechanisms by which gout can elicit inflammation, oxidative stress, and heightened neuronal excitability, either directly or indirectly, with hyperuricemia being a contributing factor in this process. Many studies indicate that UA can inhibit secondary injury and neuronal apoptosis through its antioxidant27, 28 and neuroprotective effects,28, 29 and excessive UA can lead to mitochondrial dysfunction, oxidative stress,30 and apoptosis in cells, which can increase oxidative damage to nerve cells.31, 32 In our study, we observed no significant association between genetically predicted UA levels and the risk of epilepsy, generalized epilepsy, or focal epilepsy in European and East Asian populations. Lack of a linear association in our study may be explained by a U-shaped relationship, as research reports that both high (>322 μmol/L) and low (<248 μmol/L) serum uric acid (SUA) levels increase post-infarction epilepsy risk compared to moderate levels (248–322 μmol/L).8 This indirectly suggests that different UA levels may have different effects. Because UA levels were not provided in the European data, whether this relationship applies to our findings cannot be determined. The neuroprotective mechanism of UA in animal models has primarily been attributed to its antioxidant properties, which are often dependent on astroglia.33, 34 This is exemplified by a study investigating the role of astrocytes in urate-mediated protection of dopaminergic cells in a model of Parkinson’s disease (PD).33 It was confirmed that UA had a neuroprotective effect in the co-culture of astrocytes and dopaminergic cells, reducing oxidative stress-induced cell death and protein damage. Meanwhile, UA has been demonstrated to reduce oxidative stress-induced neuronal damage. In the co-culture of spinal cord cells and astrocytes, UA can protect against glutamate-mediated neuronal injury.34 Furthermore, hyperuricemic mice exhibited increased susceptibility to secondarily generalized tonic-clonic (SGTC) seizures; allopurinol treatment reduced the severity of these seizures.19 Given the potential mechanisms mentioned above and the fact that our study did not provide UA level data, we are unable to determine whether the lack of an association between UA and epilepsy in Asian populations can be explained by the antioxidant effects of UA. Consequently, to elucidate the specific relationship between UA levels and epilepsy, there is an urgent need for more in-depth cohort studies and basic research to further validate and deepen our understanding.
Furthermore, ancestry-related factors may contribute to the observed differences, as genetically predicted gout was not associated with epilepsy in East Asian populations in our study. It is well-established that the German diet is characterized primarily by meat, cheese, bread, and beer, among other staples. Notably, meat and beer are considered high-purine foods. Could this dietary pattern explain the discrepancies observed in outcomes between Germans and East Asians? The dietary culture of East Asians is notably diverse, encompassing rice, noodles, vegetables, and meat as primary ingredients. Currently, there is a lack of research examining the relationship between gout and UA risk across different ancestry groups. However, upon reviewing the available literature, we found that greater adherence to the Southern European Atlantic Diet (SEAD) was associated with decreased concentrations of high-sensitivity C-reactive protein (hs-CRP), triglycerides, and insulin, as well as reduced insulin resistance, lower urine albumin levels, and decreased systolic blood pressure (SBP).35 However, these observations do not adequately explain our research findings.
Beyond etiological and demographic considerations, our findings also prompt an evaluation of potential bidirectional interactions in clinical practice. Notably, anticonvulsant medications themselves are established modulators of SUA levels, creating a complex interplay with gout-related pathophysiology. An early clinical study demonstrated that long-term use of enzyme-inducing anti-seizure medications (ASMs) such as phenytoin, carbamazepine, and primidone is associated with significantly lower SUA levels than those in both healthy controls and patients on valproate (who showed relatively higher levels within the treated cohort).36 This differential effect is unlikely to be an artifact of drug monitoring, as assays for phenytoin and phenobarbital have been shown to be unaffected by high concentrations of UA.37
Regarding the fundamental relationship between gout and UA, the question arises whether gout, characterized by elevated UA levels, possesses anti-epileptic properties or exacerbates epilepsy. Some cohort studies suggest that gout increases the risk of PD38, 39 and dementia,40 whereas others suggest a reduced risk41, 42 or no association.43 Meanwhile, gout also presents a paradoxical association with other neurological disorders, notably PD and dementia. Oxidative stress and inflammatory reactions represent one of the key pathogenic mechanisms underlying PD and dementia.44, 45 This finding may offer a plausible explanation for the phenomenon that gout increases the risk of PD and dementia. Additionally, several cohort studies have confirmed that hyperuricemia may increase the risk of dementia and cognitive dysfunction.46, 47, 48 However, these studies have not demonstrated the presence of MSU crystal formation. Therefore, the observed associations can only be linked to hyperuricemia and cannot be definitively attributed to gout. Gout is characterized as an autoinflammatory disease. Therefore, gout may potentially be categorized as an immune-mediated condition. However, further basic research is required to investigate and validate this possibility.
The functional enrichment analysis identified 2 candidate genes, ABCG2 and SLC2A9. ABCG2, an ATP-binding cassette transporter, has been implicated as a potential drug-related target in epilepsy.49 Other studies have suggested that ABCG2 polymorphisms are associated with resistance to lamotrigine and sodium valproate,50, 51 as well as with urate levels and gout.52, 53 SLC2A9 encodes the UA/glucose transporter GLUT9, which is associated with hyperuricemia or gout.52, 53, 54, 55 To date, no studies have directly linked SLC2A9 to epilepsy.
Limitations of the study
Our study has several limitations. The study was based on GWAS data from individuals of European and East Asian ancestry, and therefore the results may not be generalizable to other populations. In addition, because the data were derived from GWAS summary statistics, we were unable to further explore causal associations in populations with different characteristics.
Conclusions
Our MR study reveals a distinct role for gout in elevating epilepsy risk among Europeans, while genetically predicted UA levels showed no significant association in either European or East Asian populations. These findings suggest a potential epileptogenic role of gout, whereas no evidence of a causal association was observed for genetically predicted UA levels, warranting further investigation into the underlying mechanisms.
Collectively, current cohort studies investigating the associations among gout, UA levels, and epilepsy continue to be impacted by unpredictable confounding variables, which may account for the observed discrepancies in results. These discrepancies may arise from differences in study populations, including variations in race, age range, and gender of the analyzed cohorts, as well as inconsistencies in diagnostic criteria for epilepsy. Furthermore, methodological variations, such as the nature of the studies (prospective, retrospective, or case–control) and the potential factors adjusted for in the statistical models of prior research, may also contribute to these inconsistencies. Conducting retrospective analyses across multiple centers and diverse racial groups poses significant challenges. To address these issues, future research endeavors should delve deeper into the relationship between gout and epilepsy, as well as the underlying mechanisms, through cellular and animal experimentation. Such studies will provide a crucial foundation for advancing our understanding of the etiology, diagnosis, and treatment of epilepsy.
Collectively, these observations underscore that SUA monitoring and the differential metabolic profiles of ASMs could be relevant considerations in managing patients with epilepsy, particularly those with or at risk for hyperuricemia or gout. Future studies are needed to clarify how these drug-induced alterations in urate homeostasis might influence long-term neurologic or metabolic outcomes in epilepsy.
In contrast to traditional observational studies, this MR analysis utilized summary-level data from large-scale GWAS, thereby strengthening causal inference regarding the association between the exposures and epilepsy. The consistency of findings across multiple sensitivity analyses further supports the robustness of the results. A previous population-based cohort study also reported a positive association between gout and the risk of epilepsy (adjusted HR = 1.25; 95% CI: 1.15–1.36), after adjustment for age, sex, and comorbidities.5 As epilepsy remains a serious global neurological disorder, developing effective prevention strategies is of great significance. Our MR findings suggest that gout may represent a potentially modifiable risk factor for epilepsy, warranting further clinical investigation.
Data Availability Statement
The datasets supporting the findings of the current study were already openly available when the research project commenced. The GWAS summary statistics for epilepsy, gout, and UA were obtained from the ILAE consortium, the FinnGen consortium, and the BBJ, respectively. The curated instrumental variable datasets and analysis scripts generated during this study are openly available in the Zenodo repository at https://doi.org/10.5281/zenodo.18298108.
Consent for publication of personal information
Not applicable.
Use of AI and AI-assisted technologies
Not applicable.