Abstract
Background. Preeclampsia is a serious pregnancy complication with significant maternal and fetal morbidity. Mitophagy plays a crucial role in its pathogenesis. The importance of this study lies in evaluating the role of parkin in preeclampsia, which may offer new insights into the management of this disease.
Objectives. This study was designed to evaluate the role of parkin in preeclampsia.
Materials and methods. To induce a preeclampsia model, pregnant female rats were administered N-nitro-L-arginine methyl ester (L-NAME) subcutaneously at a dose of 50 mg/(kg·day) starting on gestational day 14 for 7 consecutive days. Uteroplacental tissues were then collected, and chorionic trophoblast cells were isolated. Systolic blood pressure (SBP) and urine protein content were measured on days 12 and 20 of pregnancy. Hematoxylin-eosin (H&E) staining and TUNEL staining were employed to assess pathological changes and apoptosis in uteroplacental tissues, respectively. Reverse transcription polymerase chain reaction (RT-qPCR) and western blot analysis were performed to evaluate mRNA and protein expression levels associated with cellular function, mitophagy and the PINK1/parkin signaling pathway.
Results. Compared to the negavtive control (NC) group, rats in the model group showed elevated SBP and urine protein levels (p < 0.01). Chorionic trophoblast cells exhibited substantial damage, with significantly increased levels of apoptosis and autophagy. Moreover, parkin mRNA and protein expression levels were markedly upregulated in the model group. Overexpression of parkin in chorionic trophoblast cells enhanced apoptosis and mitophagy, while the autophagy inhibitor 3-methyladenine (3-MA) significantly alleviated the damage caused by overexpression of parkin.
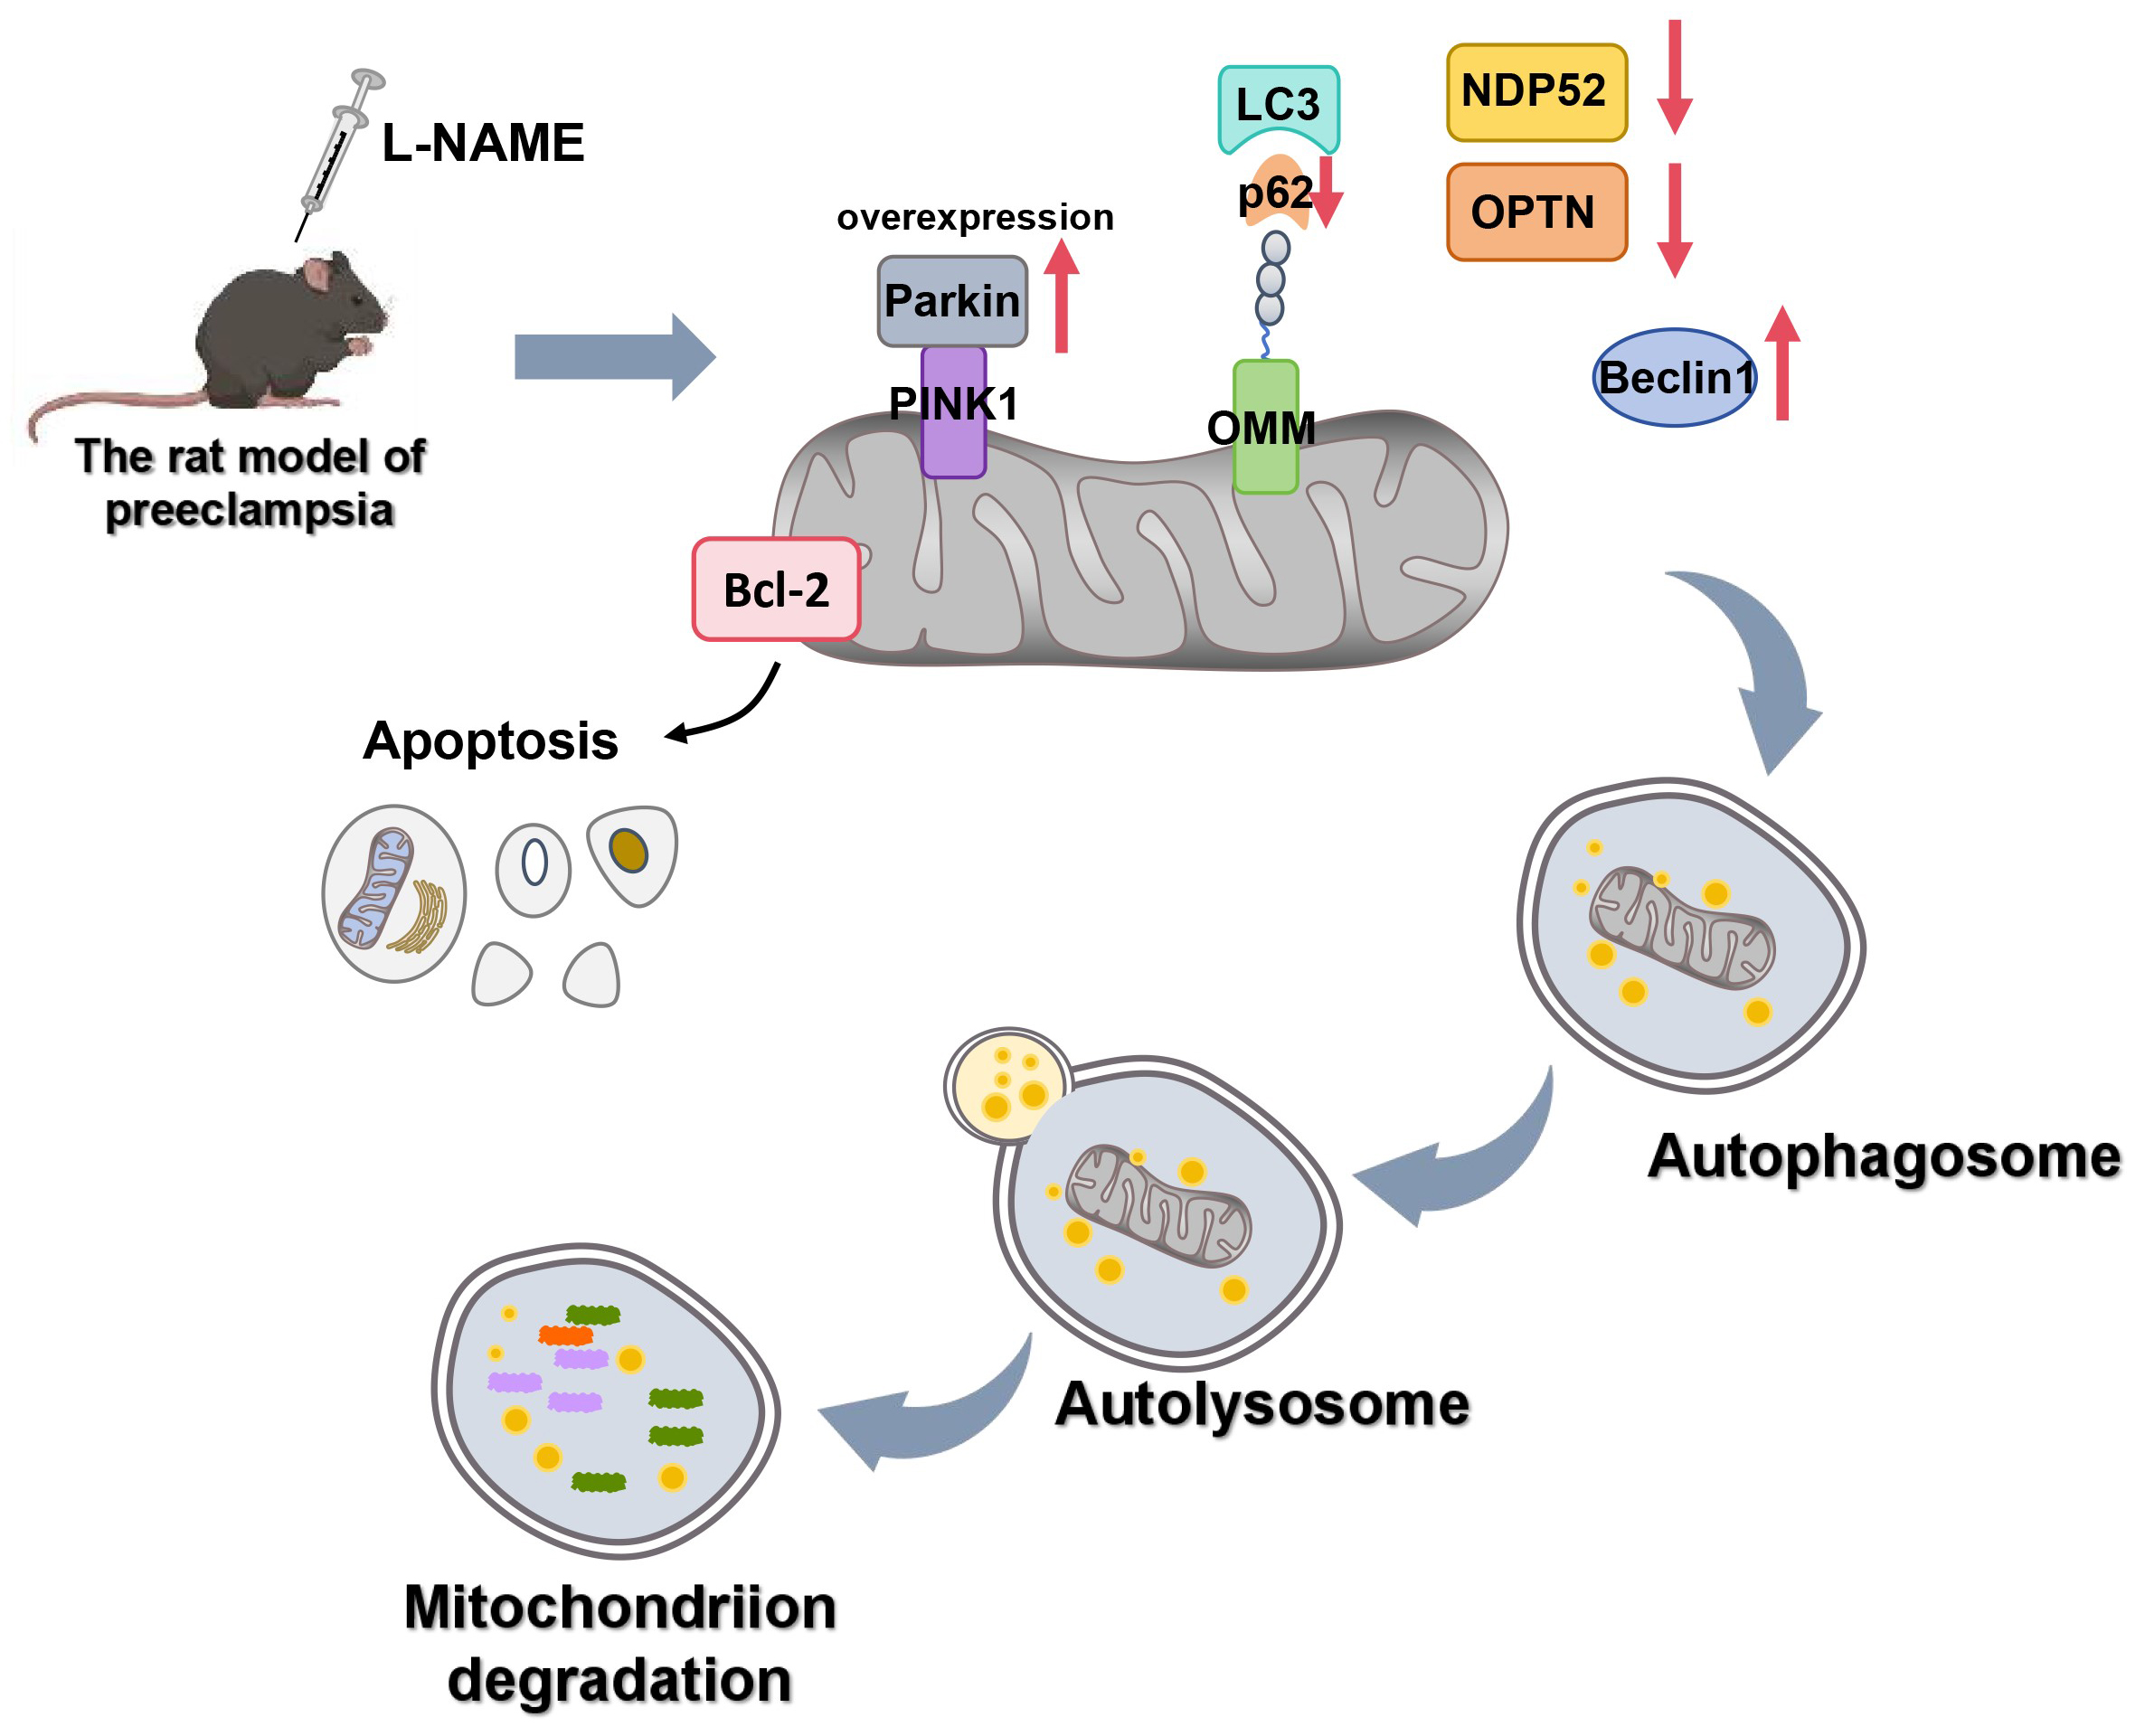
Conclusions. Parkin aggravates the symptoms of preeclampsia by increasing mitophagy and apoptosis.
Key words: apoptosis, preeclampsia, mitophagy, parkin, 3-methyladenine (3-MA)
Background
Preeclampsia, an obstetric disease, affects 1.5–16.7% of pregnant women and results in 60,000 deaths and 500,000 premature births worldwide every year.1 Statistics indicate that preeclampsia is the 2nd leading cause of maternal mortality, with maternal mortality rates due to preeclampsia being at least 16% in low-and middle-income countries and as high as 25% in some Latin American countries.2 Preeclampsia typically develops after the 20th week of pregnancy and is characterized by hypertension, proteinuria, end-organ damage, acute kidney injury(AKI), liver dysfunction, and other systemic complications.3 Moreover, the impact of preeclampsia is long-lasting. Studies have shown that preeclampsia is associated with an increased risk of future cardiovascular, metabolic and cerebrovascular diseases in mothers. It also raises the risk of fetal growth restriction and placental abruption.4 The pathogenesis of preeclampsia is believed to be linked to the failure of extravillous trophoblast (EVT) cells to properly migrate and invade the uterine spiral arteries, leading to neovascularization disorders and increased uteroplacental vascular resistance.5 Currently, aspirin is the only medication recommended for the prevention and treatment of preeclampsia; however, its therapeutic effects are mixed and it is associated with side effects.6 Previous research has shown that aspirin can reduce the risk of early-onset preeclampsia but is ineffective in alleviating symptoms of late-onset preeclampsia.7 Therefore, new therapeutic agents are needed to address these challenges.
Mitochondria are the energy powerhouses of cells, essential for placental formation and development throughout pregnancy.8 They are double-membrane organelles, consisting of an ion-permeable inner membrane and an outer mitochondrial membrane. Mitochondria are crucial for generating the proton gradient and transmembrane potential, with the energy stored in this proton gradient used to synthesize large amounts of adenosine triphosphate (ATP) for energy supply.9 Although mitochondria cannot be synthesized de novo within cells, they possess their own self-replicating genomes. The coordination between mitophagy and energy production is vital for managing irreparably damaged mitochondria, maintaining mitochondrial volume and ensuring mitochondrial turnover.10 Mitophagy is the selective process by which autophagosomes and lysosomes remove damaged mitochondrial proteins and dysfunctional mitochondria.11 When mitochondrial dysfunction occurs, impaired mitophagy can lead to cellular damage and even cell death.12 Therefore, normal mitophagy is crucial for cell survival. Previous studies have shown that mitophagy primarily relies on parkin mediation.13 Parkin substrates can generate various ubiquitin chains, including K6, K11, K48, and K63 bonds.14 Additionally, parkin can facilitate the specific phagocytosis of damaged mitochondria by autophagosomes through ubiquitination-labeled receptor proteins.15 While the role of parkin in mitophagy is well-established, its impact on preeclampsia remains unclear.
Objectives
The objective of this study was to investigate the specific functions and mechanisms of parkin in preeclampsia by modulating its expression levels in a cell model of the disease. We aimed to provide new insights into the pathogenesis of preeclampsia by uncovering how parkin regulates mitophagy and apoptosis in chorionic trophoblast cells, and to explore its potential as a therapeutic target.
Materials and methods
Study design
All animal-related experiments were approved and supervised by the Animal Ethics Committee of Hainan Affiliated Hospital of Hainan Medical University, Haikou, China (approval No. Med-Eth-Re(2024)254). The Specific Pathogen-Free Sprague Dawley (SPF SD) female rats weighing about 200 g each were purchased from Beijing Vital River Laboratory Animal Technology Co., Ltd. (Beijing, China). All purchased rats were housed in an environment at room temperature of 22–24°C and relative humidity of 50–70%, with free access to food and water.
Participants
Consistent with the previous report, the phase of the estrus cycle was determined by observing cell morphology through vaginal smear.16 Briefly, female rats in estrus were paired with SPF SD male rats at a ratio of 1:2. Sperm presence was monitored daily through vaginal smears to determine fertilization. Day 0 of pregnancy was defined as the day sperm was first detected. Pregnant rats were then randomly divided into 2 groups: the negative control (NC) group (n = 40) and the model group (n = 40). From the 14th day to 20th day of pregnancy, rats in the model group received subcutaneous injections of 50 mg/(kg·d) N-nitro-L-arginine methyl ester (L-NAME) to induce a preeclampsia model,17 while rats in the NC group received an equivalent volume of normal saline. On the 20th day, the rats were anesthetized with CO2 and euthanized. Uteroplacental tissues were collected from the mother rats, with some used for subsequent experiments and others for trophoblast cell isolation. Tissues designated for further experiments were quickly frozen in liquid nitrogen and stored at −80°C.
Variables
The primary variables include blood pressure, urine protein levels, gene expression levels (Beclin-1, p62, mt-parkin (mitochondrial parkin), total-parkin (total cellular parkin) PINK1, NDP52, OPTN), apoptosis rates, and protein expression levels (LC3, Beclin-1, p62, PINK1, parkin, GAPDH).
Data sources and measurements
Isolation and treatment of trophoblast cells
As described in a previous study,18 uteroplacental tissues from mother rats were meticulously dissected using ophthalmic scissors under aseptic conditions. The tissues were then treated with 2.5 g/L trypsin and digested in a water bath at 37°C for 10 min. This process was repeated 3 times to obtain a cell suspension. The cell suspension was washed twice, re-suspended in Dulbecco’s modified Eagle’s medium (DMEM)/F12 culture medium containing 10% fetal bovine serum (FBS), and seeded in a culture plate. The cells were then cultured in an incubator with 5% CO2 at 37°C. Under an optical microscope (model CX43; Olympus Corp., Tokyo, Japan) the isolated cells exhibited typical epithelial-like morphology of trophoblast cells and demonstrated a tendency to spread and grow in sheets. Subsequently, the isolated trophoblast cells were transfected using X-tremeGENE™ (6366244001, MilliporeSigma, St. Louis, USA) with either an overexpression vector for parkin (OE-parkin group) or a corresponding control vector (OE-NC group). Additionally, trophoblast cells transfected with overexpressed parkin and treated with the mitophagy inhibitor 3-methyladenine (3-MA) were designated as the OE-parkin+3-MA group.
Test for blood pressure and urine protein in rats
To measure the systolic blood pressure (SBP) of rats in each group, female rats were fixed in the BP-2000 blood pressure analysis system (Visitech Systems, Apex, USA) on the 12th and 20th days of pregnancy. Once the rats were stabilized, SBP readings were recorded for both the NC group and model group. Additionally, urine samples from the 12th and 20th days of pregnancy were collected. Briefly, rats were placed in a metabolic cage, and urine was collected over a 12-h period. The collected urine was then centrifuged at 4°C and 12,000 rpm for 5 min, and the supernatant was obtained. Total urine protein levels were subsequently measured using a urine protein quantitative test kit (C035-2-1; Jiancheng, Nanjing, China).
Hematoxylin and eosin staining
The obtained uteroplacental tissues were soaked in 4% paraformaldehyde overnight for complete fixation, and then sectioned into 5-μm thick slices. The sections were placed on slides, with resin applied around the edges to prevent slipping. Following the instructions of the hematoxylin and eosin (H&E) staining kit (Beyotime Biotechnology, Shanghai, China), the sections were stained as follows: the nuclei were stained with hematoxylin staining solution for 5 min, then washed with running water and differentiated using 1% hydrochloric acid alcohol for a few seconds. The sections were washed again with running water, blued with 0.6% ammonia, and rinsed with running water. The cytoplasm was then stained with eosin for 3 min, followed by dehydration and mounting. Finally, the sections were observed under an optical microscope (Olympus BX51; Olympus Corp., Tokyo, Japan) and photographed.
RT-qPCR
To extract RNA from mitochondria, mitochondrial isolation kit (C3606; Beyotime Biotechnology) was first used to purify the mitochondria. Subsequently, total RNA from uteroplacental tissues, mitochondria or trophoblast cells was extracted using Trizol reagent (R0016; Beyotime Biotechnology). The RNA concentration from different sources was determined with a NanoDrop spectrophotometer (840-317400; Thermo Fisher Scientific, Waltham, USA). According to the instruction of FastKing cDNA synthesis kit (KR116; Tiangen, Beijing, China), 2 μg of RNA was reverse transcribed into complementary deoxyribonucleic acid (cDNA). The expression levels of Beclin-1, p62, mt-parkin, total-parkin, PINK1, NDP52, and OPTN in tissue or cell samples, along with the internal control GAPDH were detected using RealUniversal Color PreMix (FP201; Tiangen). Relative gene expression was calculated using the 2−ΔΔCt method. All primer sequences are listed in Table 1 and were synthesized by Sangon Biotech Co., Ltd. (Shanghai, China).
Tunel staining
The collected uteroplacental tissue sections were deparaffinized in xylene, rehydrated through a graded ethanol series, and subsequently treated with Proteinase K working solution for 15–30 min. For the cells, the treated samples were washed twice with phosphate-buffered saline (PBS), fixed with 4% paraformaldehyde for 1 h, and then permeabilized with cell permeabilization solution for 8 min. Following this, tissues and cells were rinsed twice with PBS and stained according to the instructions of TUNEL cell apoptosis detection kit (green fluorescence) (C1086; Beyotime Biotechnology) using the one-step method. Briefly, 50 μL of TUNEL detection solution was added to the cells or sections, which were then incubated in the dark at 37°C for 60 min. Then, the nucleus was stained with DAPI (4′,6-diamidino-2-phenylindole) for 5 min. Finally, cell apoptosis was observed under a fluorescence microscope (Leica DM2500 LED; Leica Camera AG, Wetzlar, Germany) and photographed. The excitation wavelength of TUNEL was 450 nm, and the detection wavelength was 565 nm.
Western blot
Total protein was extracted from tissues, cells and isolated mitochondria using radioimmunoprecipitation assay (RIPA) lysis buffer (P0013B; Beyotime Biotechnology). For cell samples, ultrasonic disruption was performed after collection, while tissues were further homogenized. The cell/mitochondrial lysate and tissue homogenate were then centrifuged at 4°C and 12,000 rpm for 10 min, and the supernatant was collected. Protein concentration was determined using a bicinchoninic acid (BCA) protein assay kit (P0009; Beyotime Biotechnology). Next, 25 μg of total protein was mixed with 5×sodium dodecyl sulfate (SDS) loading buffer and denatured at 99°C for 10 min. Proteins were separated using 10% SDS-polyacrylamide gel electrophoresis (SDS-PAGE), then transferred to a polyvinylidene fluoride (PVDF) membrane via electrotransformation. After transfer, the PVDF membrane was blocked with 5% BCA at ambient temperature for 2 h. The membrane was then incubated overnight at 4°C with primary antibodies (all from Abcam, Cambridge, UK): Anti-LC3 (1:1,000; ab192890), Anti-Beclin1 (1:1000; ab207612), Anti-p62 (1:1, 000; ab211324), Anti-PINK1 (1:1,000; ab300623), anti-parkin (1:1,000; ab77924), or Anti-GAPDH (1:1,000; ab8245). On the next day, the membrane was incubated with sheep anti-rabbit or anti-mouse secondary antibodies (1:3,000; ab6721, ab205719) for 1 h of incubation at room temperature. Enhanced chemiluminescence (SuperSignal ECL; Thermo Fisher Scientific) was then used to develop the protein signals on the PVDF membrane. Finally, the expression levels of each protein were visualized using the iBright CL 750 (Thermo Fisher Scientific).
Statistical analyses
All data are presented as mean ± standard deviation (SD), and differences were analyzed using IBM SPSS v. 22.0 software (IBM Corp., Armonk, USA). A t-test was used for analyzing differences between 2 independent samples, while one-way analysis of variance (ANOVA) was employed for comparing multiple independent samples. Post hoc tests were performed using Tukey’s test to identify specific group differences. A p < 0.05 indicated a significant difference.
Results
Establishment of rat model of preeclampsia
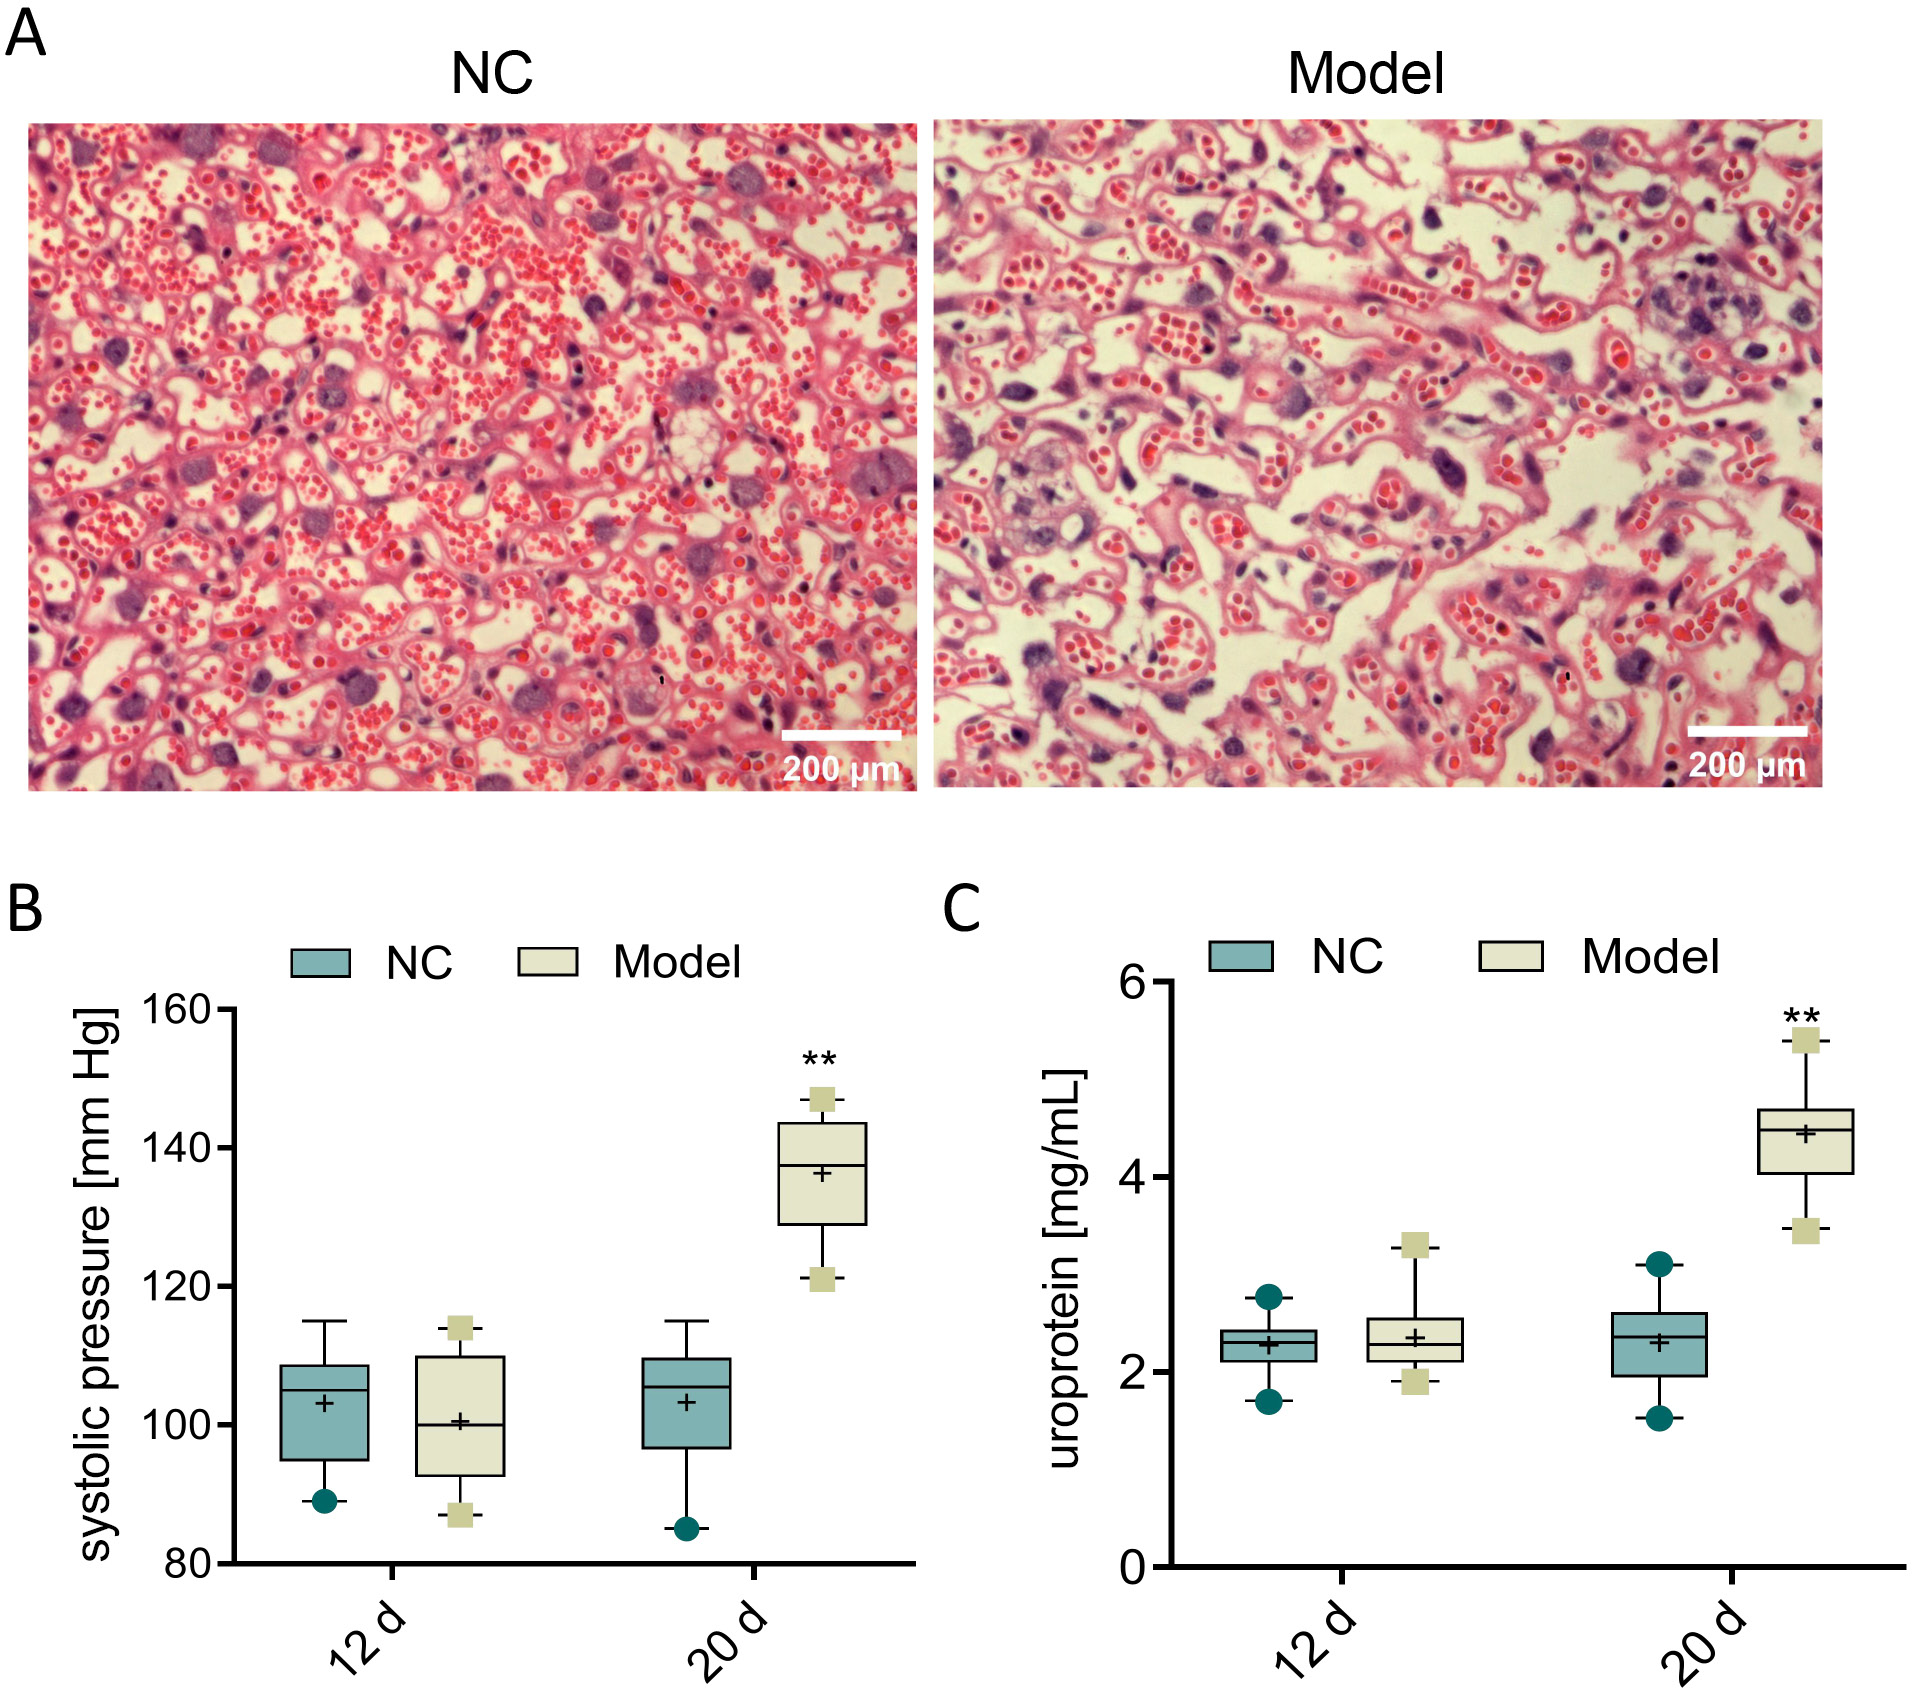
To evaluate the role of parkin in preeclampsia, female rats at 14 days of pregnancy were subcutaneously injected with L-NAME for 7 days to establish a preeclampsia model. Subsequently, the pathological changes in chorionic trophoblast tissues were observed using H&E staining. The H&E staining results showed that, compared to the NC group, the model group exhibited disordered cell arrangement, widened intercellular spaces and thickened basement membrane, indicating severe damage to the chorionic trophoblast tissues in the model group (Figure 1A). Additionally, SBP and urine protein levels were measured on the 12th and 20th day of pregnancy. The results revealed no significant differences between the 2 groups on the 12th day. However, on the 20th day, the L-NAME-induced preeclampsia rats showed increased blood pressure and urine protein levels, reaching 136.35 mm Hg and 4.4 mg/mL, respectively, compared to the NC group (p < 0.001, Figure 1B and Table 2; Figure 1C, Table 3). In summary, L-NAME-induced rats displayed clear characteristics of preeclampsia, validating the model for further experiments.
L-NAME induction increases the apoptosis level of chorionic trophoblast cells in preeclampsia rats
Additionally, TUNEL staining was used to observe the level of apoptosis in chorionic trophoblast tissues across each group of rats. Compared to the NC group, the TUNEL fluorescence signal in the chorionic trophoblast tissues significantly increased after 7 days of subcutaneous L-NAME injection (Figure 2). These results indicate a marked upregulation of level of apoptosis in the chorionic trophoblast tissues of the model group.
L-NAME induces the increase of parkin-dependent mitophagy in chorionic trophoblast tissues of preeclampsia rats
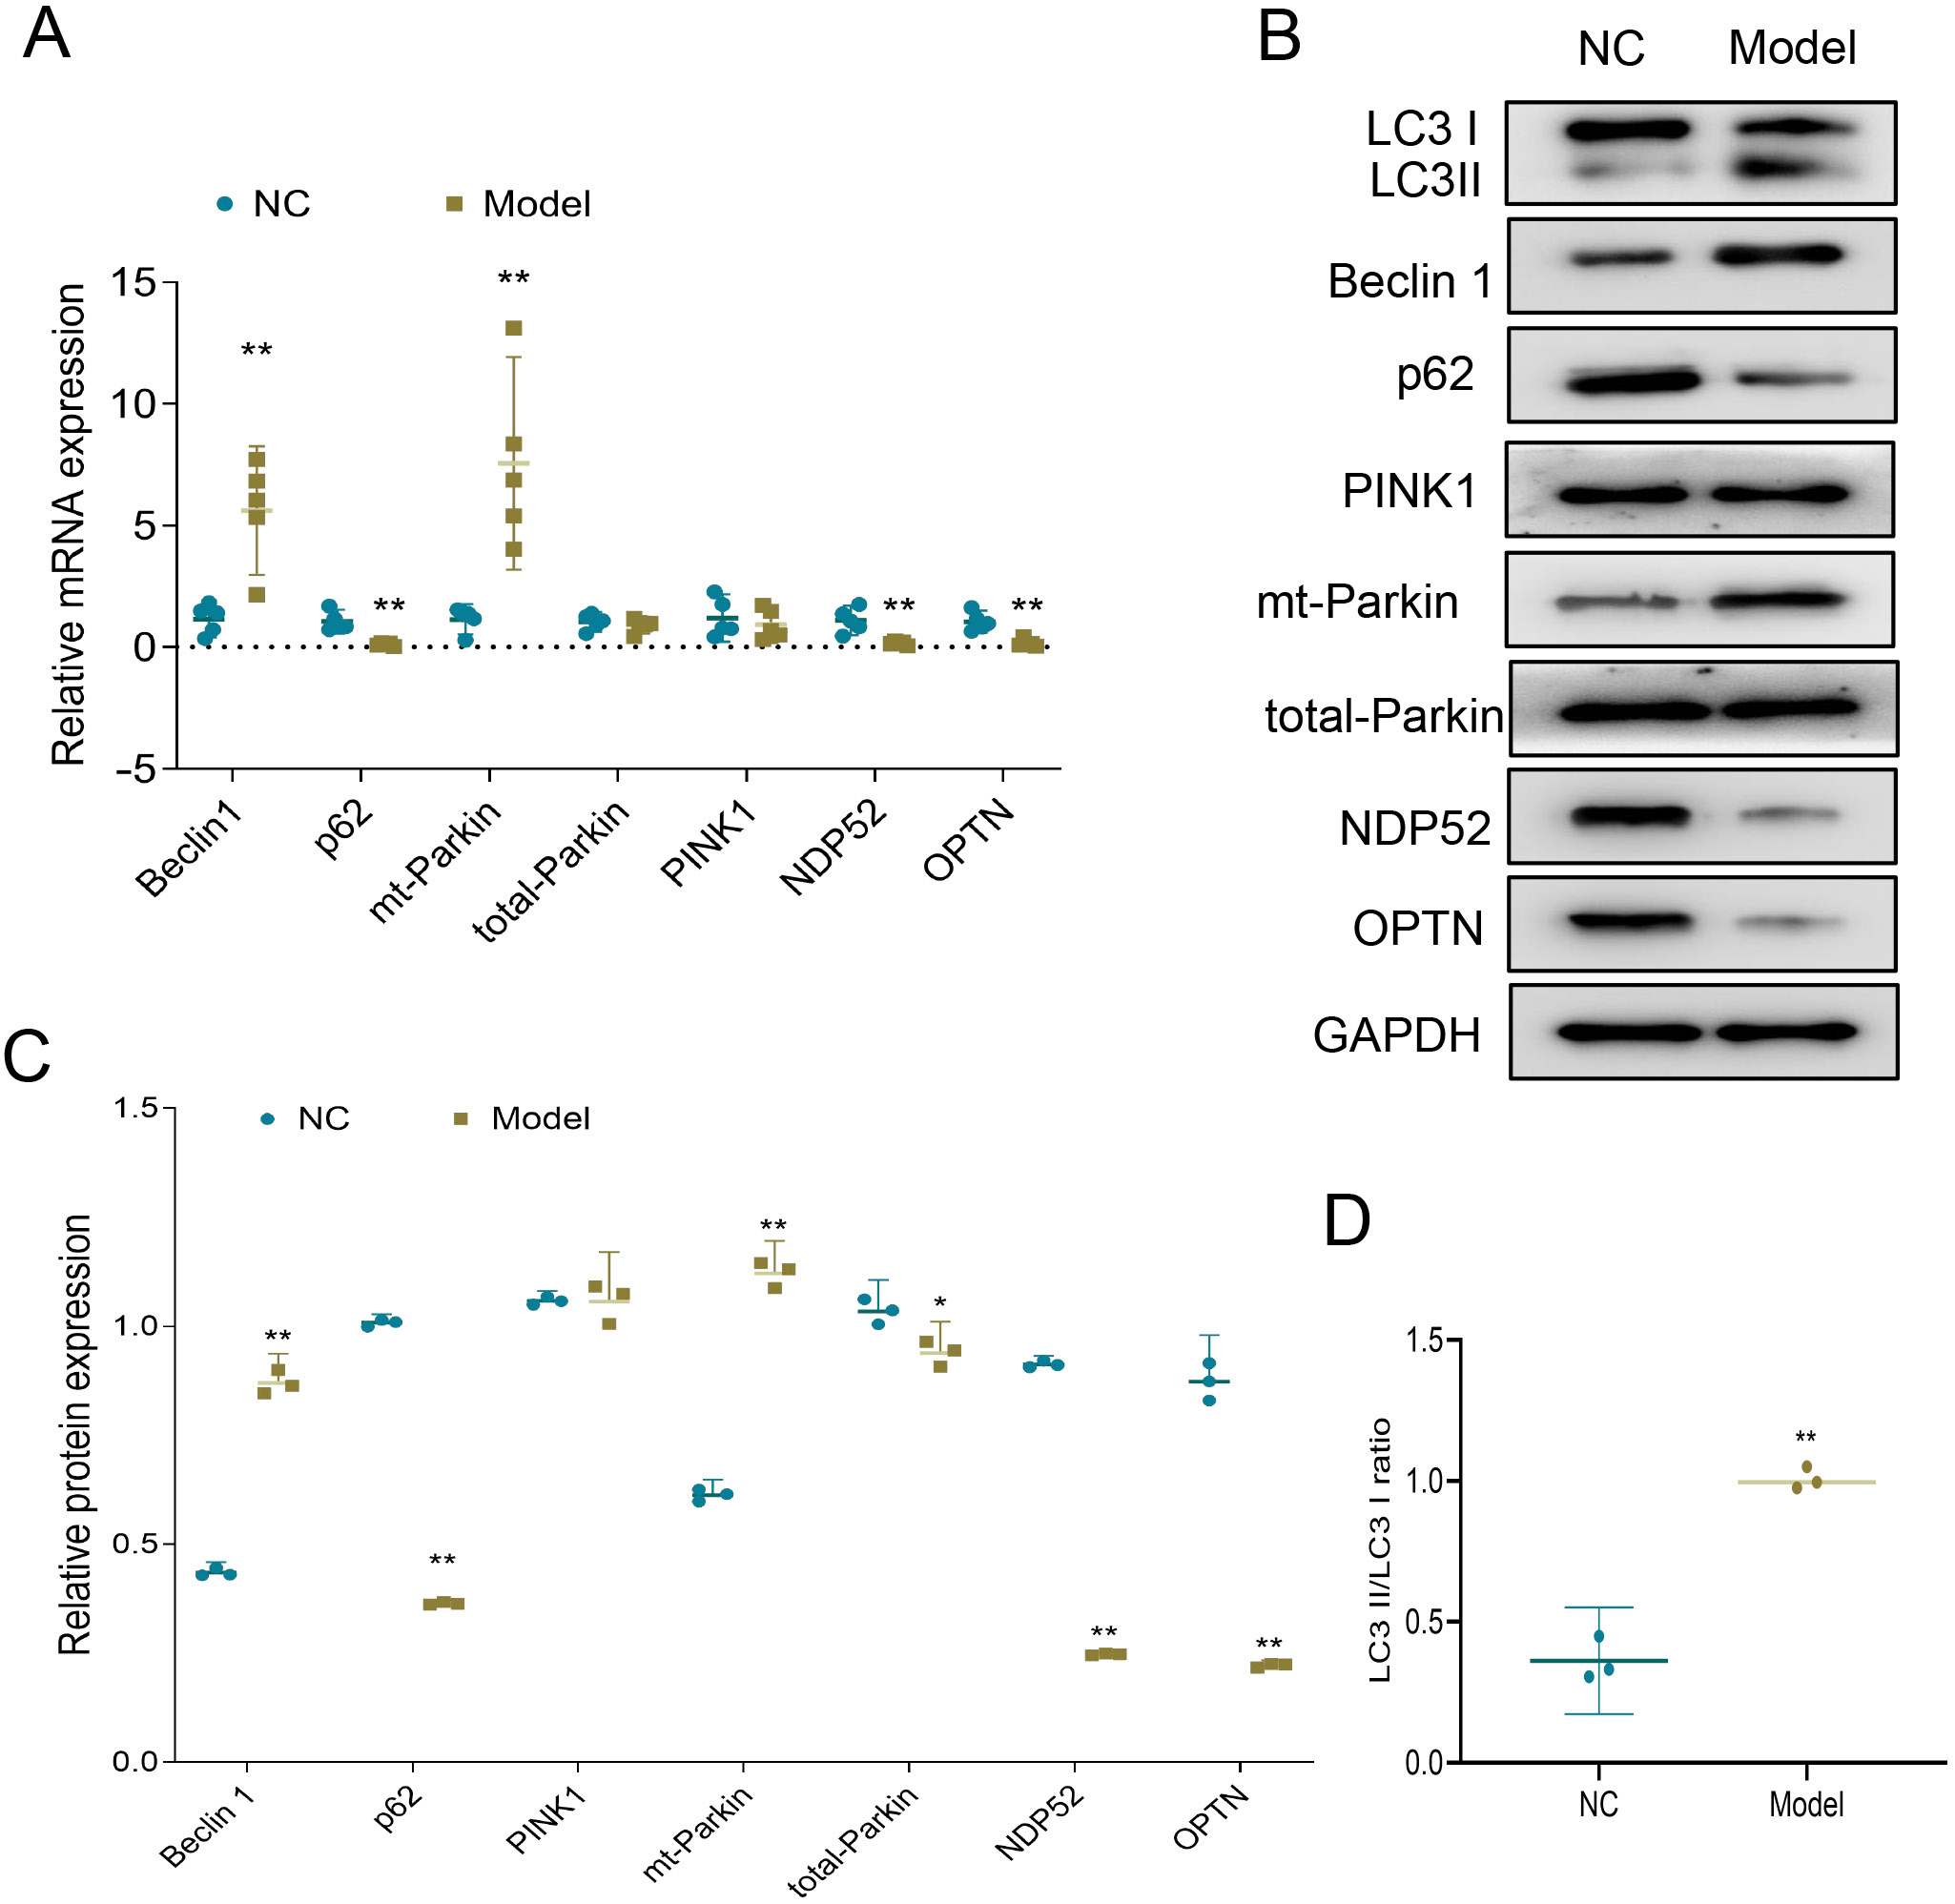
Previous studies have identified the presence of PINK1 and parkin-dependent mitophagy in preeclampsia placenta.19, 20 To further investigate this, we assessed the activities of Beclin-1, PINK1, parkin, p62, NDP52, and OPTN pathways in the chorionic trophoblast tissues of rats at both the mRNA and protein levels. The results showed that, compared to the NC group, the model group exhibited increased mRNA and protein expression levels of Beclin-1 and mt-parkin in chorionic trophoblast tissues, along with decreased mRNA and protein expression levels of p62, NDP52 and OPTN. Additionally, a significant increase in the LC3-II/LC3-I ratio was observed (Figure 3A–D; Table 4, Table 5). These findings indicate a significant increase in mitophagy in the model group. Taken together, L-NAME induced a notable increase in parkin-dependent mitophagy in the chorionic trophoblast tissues of preeclampsia rats.
3-methyladenine partly reversed the increase of mitophagy and apoptosis of trophoblast cells in preeclampsia rats caused by overexpression of parkin
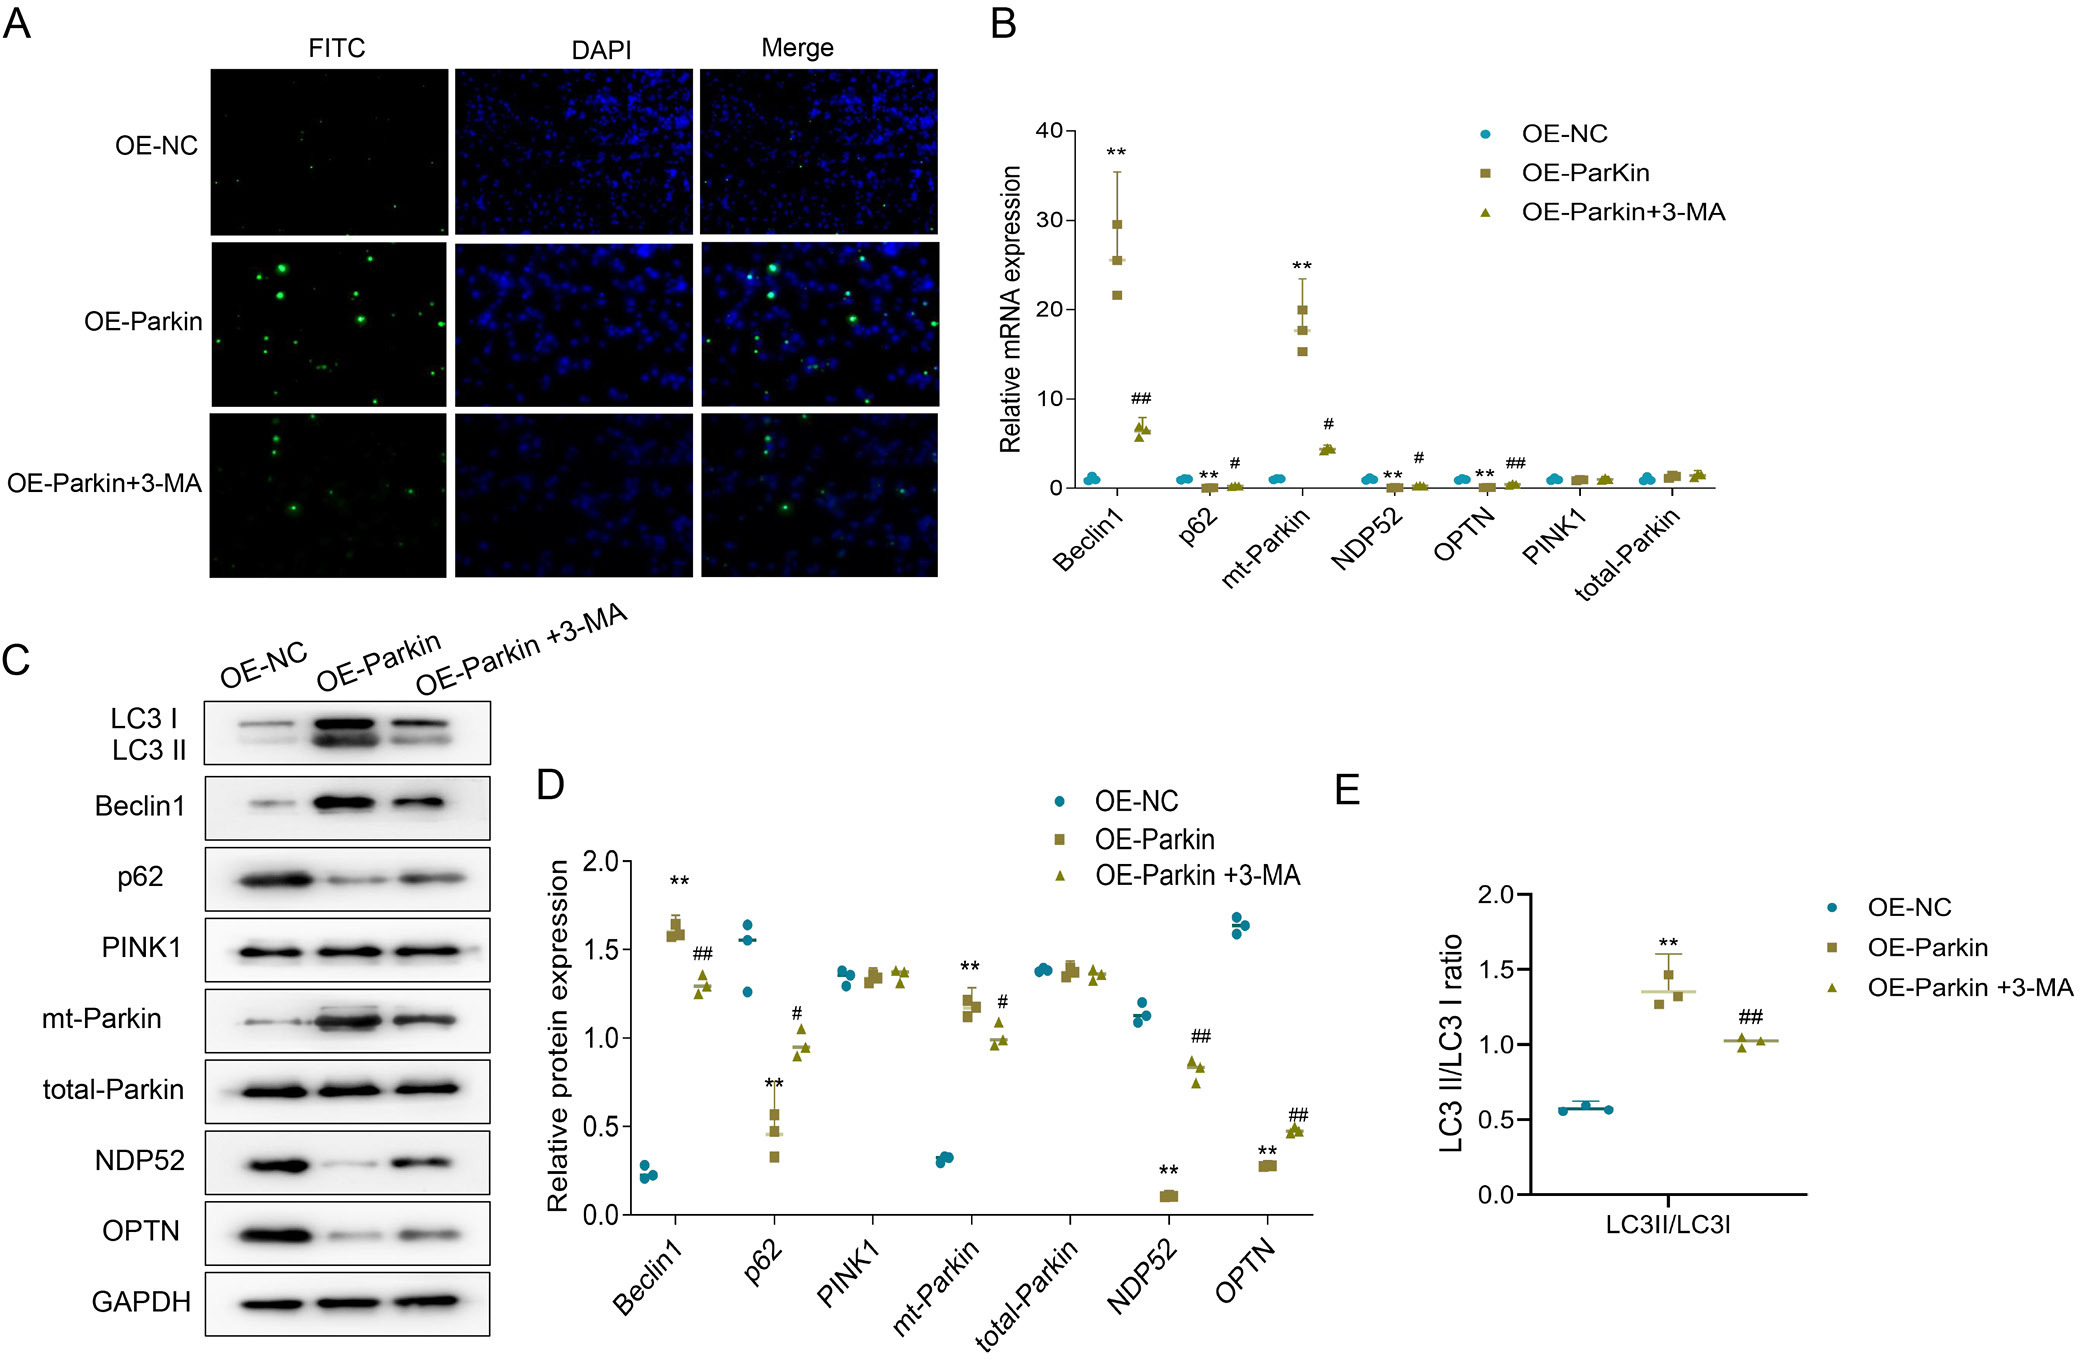
To clarify the effect of parkin on autophagy and apoptosis in preeclampsia tissues, primary trophoblast cells were isolated from the uteroplacental tissue of preeclampsia rats, and parkin was overexpressed in these cells. Additionally, cells were treated with the autophagy inhibitor 3-MA to determine whether parkin exacerbates preeclampsia symptoms by promoting autophagy and apoptosis. Specifically, compared to the OE-NC group, the OE-parkin group showed increased levels of apoptosis in trophoblast cells. However, when compared to the OE-parkin group, the level of apoptosis in the OE-parkin+3-MA group was reduced (Figure 4A). Similar results were observed for autophagy. In the OE-parkin group, mRNA and protein expression levels of Beclin-1 and mt-parkin were elevated, while those of p62, NDP52 and OPTN were reduced; the LC3II/LC3I ratio also significantly increased. Notably, in the OE-parkin+3-MA group, mRNA and protein expression levels of LC3I, Beclin-1 and mt-parkin decreased compared to the OE-parkin group, while those of p62, NDP52 and OPTN increased; the LC3II/LC3I ratio also significantly decreased (Figure 4A–E and Table 6, Table 7, Table 8, Table 9). These findings suggest that 3-MA partially reversed the parkin overexpression-induced increase in mitophagy and apoptosis in trophoblast cells of preeclamptic rats.
Discussion
This study explored the role of parkin in preeclampsia by establishing an L-NAME-induced rat model of the condition. The results showed that rats treated with L-NAME exhibited typical symptoms of preeclampsia, including significantly elevated SBP and urine protein levels. Further experiments demonstrated that in the preeclampsia model, the levels of apoptosis and mitophagy in chorionic trophoblast cells were significantly increased, and these changes were closely associated with elevated parkin expression. By overexpressing parkin, it was found that it could promote apoptosis and mitophagy in chorionic trophoblast cells, while the use of the mitophagy inhibitor 3-MA partially reversed these effects. These results indicate that parkin plays a promotive role in the pathological progression of preeclampsia, particularly in terms of mitophagy and apoptosis.
Preeclampsia poses a serious threat to both mother and fetus, yet its pathophysiology remains unclear, and no definitive treatment exists beyond early delivery. Therefore, addressing the current challenges in treating preeclampsia is of critical importance.21 It is widely believed that insufficient invasion of trophoblast cells into the uterine wall and spiral arteries disrupts uteroplacental circulation, leading to progressive damage as pregnancy progresses.21, 22 Consequently, trophoblast cell damage is considered a key contributing factor in the development of preeclampsia. Many studies have focused on understanding the mechanisms of preeclampsia and exploring new treatment options, often using chorionic trophoblast tissues as a basis for investigation.23, 24 In the present study, a rat model of preeclampsia was established through continuous L-NAME injections. Notably, preeclampsia is characterized by the onset of hypertension and proteinuria in the 2nd half of pregnancy.7 Consistent with this, our findings showed a significant increase in SBP and urine protein levels in the model group on the 20th day of pregnancy. Furthermore, research indicates that imbalances in apoptosis and proliferation of chorionic trophoblast cells contribute to trophoblast dysfunction and the development of preeclampsia.25, 26 In this study, we observed a marked increase in apoptosis in chorionic trophoblast cells within the model group, confirming the successful construction of an animal model with typical symptoms of preeclampsia. These results further suggest that elevated apoptosis levels in chorionic trophoblast cells may be a key factor in the pathogenesis of preeclampsia.
Mitophagy, an organelle-specific autophagy pathway, plays a crucial role in mitochondrial quality control and in maintaining cellular structure and function.27 However, excessive mitochondrial damage can also trigger programmed cell death (apoptosis).28 Previous study have highlighted that mitochondria function in the placental tissue of preeclampsia is severely compromised, including a decrease in ATP production and mitochondrial DNA copy number.29 Zhou et al. observed an accumulation of mitochondria with impaired mitophagy in preeclamptic placental tissue using a scanning electron microscope.30 Similarly, Vangrieken et al. discovered a significant increase in the number of mitochondria with impaired mitophagy and notably upregulated mitophagy-related protein expression in preeclamptic placental tissue.31 These findings collectively suggest that mitophagy plays an important role in the pathogenesis of preeclampsia. In this research, we observed a significant increase in Beclin-1 expression levels, accompanied by a significant decrease in the proteins p62, NDP52 and OPTN in the chorionic trophoblast tissues of rats in the model group. Beclin-1 is widely recognized as a marker protein for measuring autophagy, and the relative binding between Beclin-1 and bcl-2 in cells is indicative of the autophagy level. Generally, a significant increase in Beclin-1 expression reflects an elevated level of cellular autophagy.32 Additionally, p62 functions as a receptor for autophagic vesicles and ubiquitinated protein aggregates; therefore, reduced p62 expression is indicative of increased autophagic activity.33 Similarly, NDP52 and OPTN act as receptors that recognize and target vesicles for autophagic degradation.34, 35 These findings suggest that mitophagy levels are significantly elevated in preeclamptic rats. More importantly, after overexpressing parkin in trophoblast cells from preeclampsia placental tissues, we observed a significant upregulation of both apoptosis and mitophagy levels in this study. This suggests that parkin-dependent autophagy is significantly increased in the chorionic trophoblast of preeclampsia rats. Interestingly, mitophagy does not strictly follow a linear model in which damage sensors and parkin function solely as downstream effectors. The recruitment of autophagy receptor protein mediated by phosphorylated ubiquitin requires PINK1 activity but does not rely solely on parkin.36 However, previous studies have demonstrated that parkin-mediated ubiquitination of intracellular proteins is also a key signal promoting apoptosis.37 Consequently, parkin may affect mitophagy and apoptosis in trophoblast cells of preeclamptic rats through multiple pathways.
According to previous studies, 3-MA is a highly effective mitophagy inhibitor.38 Some studies have also shown that 3-MA can effectively inhibit cell apoptosis.38 For instance, the study by Seno et al. suggested that 3-MA could effectively inhibit the senescence and autophagy of trophoblast cells.39 In our study, we similarly found that the levels of apoptosis and autophagy were significantly reduced after parkin overexpression and the incubation of preeclampsia trophoblast cells with 3-MA. However, Dai et al. observed that when trophoblast cells were incubated with 3-MA, the apoptosis level increased significantly when exposed to zearalenone.40 These differing results may be attributed to the varying states of the cells under different conditions. Additionally, after overexpression of parkin, 3-MA significantly reduced the expression level of mt-parkin, thereby impacting mitophagy and apoptosis in preeclampsia trophoblast cells. Overall, elevated levels of parkin are a key factor in promoting the functional impairment of trophoblast cells in preeclampsia. Thus, inhibiting the parkin pathway may be a promising therapeutic approach for preeclampsia. However, the efficacy of treating preeclampsia by inhibiting parkin requires further validation through in vivo experiments. Although this study primarily focuses on the roles of mitophagy and apoptosis in preeclampsia, it is important to acknowledge that existing research has demonstrated that inflammatory processes play a significant role in the pathophysiology of both preeclampsia and intrauterine growth restriction. Future research could explore the interactions between inflammation, mitophagy and apoptosis to gain a more comprehensive understanding of the mechanisms underlying preeclampsia.41, 42 Furthermore, while this study underscores the critical role of parkin in preeclampsia, these findings require validation in clinical settings. Prioritizing clinical trials to evaluate the potential of parkin inhibitors in the prevention and treatment of preeclampsia is crucial. Additionally, bioinformatics analyses could be employed to further elucidate the specific mechanisms of parkin inhibitors, thereby enhancing our understanding of this therapeutic strategy.
Limitations
This study has several limitations. First, although the rat model of preeclampsia induced by L-NAME closely mimics key clinical features of the disease, it may not fully replicate the complex pathophysiological processes occurring in human pregnancies. Second, the experimental findings were derived primarily from animal tissues and isolated trophoblast cells, without validation in human placental samples or clinical patient cohorts, which limits the translational relevance. Third, the mechanistic exploration was focused mainly on the PINK1/parkin pathway and its influence on mitophagy and apoptosis; other potentially interacting pathways, such as inflammation or oxidative stress, were not evaluated. Fourth, the mitophagy inhibitor 3-MA used in this study may have off-target effects, and more specific tools (e.g., genetic knockdown or clustered regularly interspaced short palindromic repeats (CRISPR)-based editing) are needed to confirm the observed roles of parkin. Finally, the sample size for molecular experiments was relatively small, and the lack of long-term in vivo observations restricts our ability to assess the chronic impact of parkin modulation on pregnancy outcomes.
Conclusion
The overexpression of parkin can aggravate the symptoms of preeclampsia by promoting mitophagy and apoptosis in trophoblast cells in preeclampsia. This study has laid a foundation for clarifying the function of parkin in preeclampsia and suggests that parkin may be an important marker in the treatment of preeclampsia.
Data availability
The datasets generated and/or analyzed during the current study are available from the corresponding author on reasonable request.
Consent for publication
Not applicable.
Use of AI and AI-assisted technologies
Not applicable.
.jpg)