Abstract
Background. A correlation between thyroid function and cognitive impairment has been well established; however, the impact of thyroid dysfunction on structural changes in the brain cortex remains largely unexplored.
Objectives. The study describes a 2-sample Mendelian randomization (MR) analysis to elucidate the relationship between thyroid malfunction and brain structure and function.
Materials and methods. Eight phenotypes of thyroid function were extracted from THYROIDOMICS consortium by determining free thyroxine (FT4) and thyroid-stimulating hormone (TSH) levels in both men and women separately and together, as well as in individuals with increased or decreased TSH levels. The results were assessed in terms of overall brain cortical thickness and the surface area (SA) of grey matter, along with 34 specific measurements for various regions. The primary method employed for the analysis was the inverse-variance weighted (IVW) approach.
Results. The data were subjected to MR Egger regression, Cochrane’s Q statistic and leave-one-out analysis to determine the correlation between the variables. The FT4 in men, women and overall was statistically associated with cortical thickness of entorhinal cortex (EC). Overall TSH and TSH in men were associated with cortical thickness of caudal anterior cingulate. Additionally, in men, TSH levels showed an association with cortical thickness in the cuneus gyrus. Increased TSH was associated with decreased SA of lateral occipital (LO) and increased SA of lateral orbitofrontal, medial orbitofrontal and superior frontal cortex. Decreased TSH was negatively associated with the SA of pars opercularis (PO) and the cortical thickness of posterior cingulate cortex. No pleiotropy was detected.
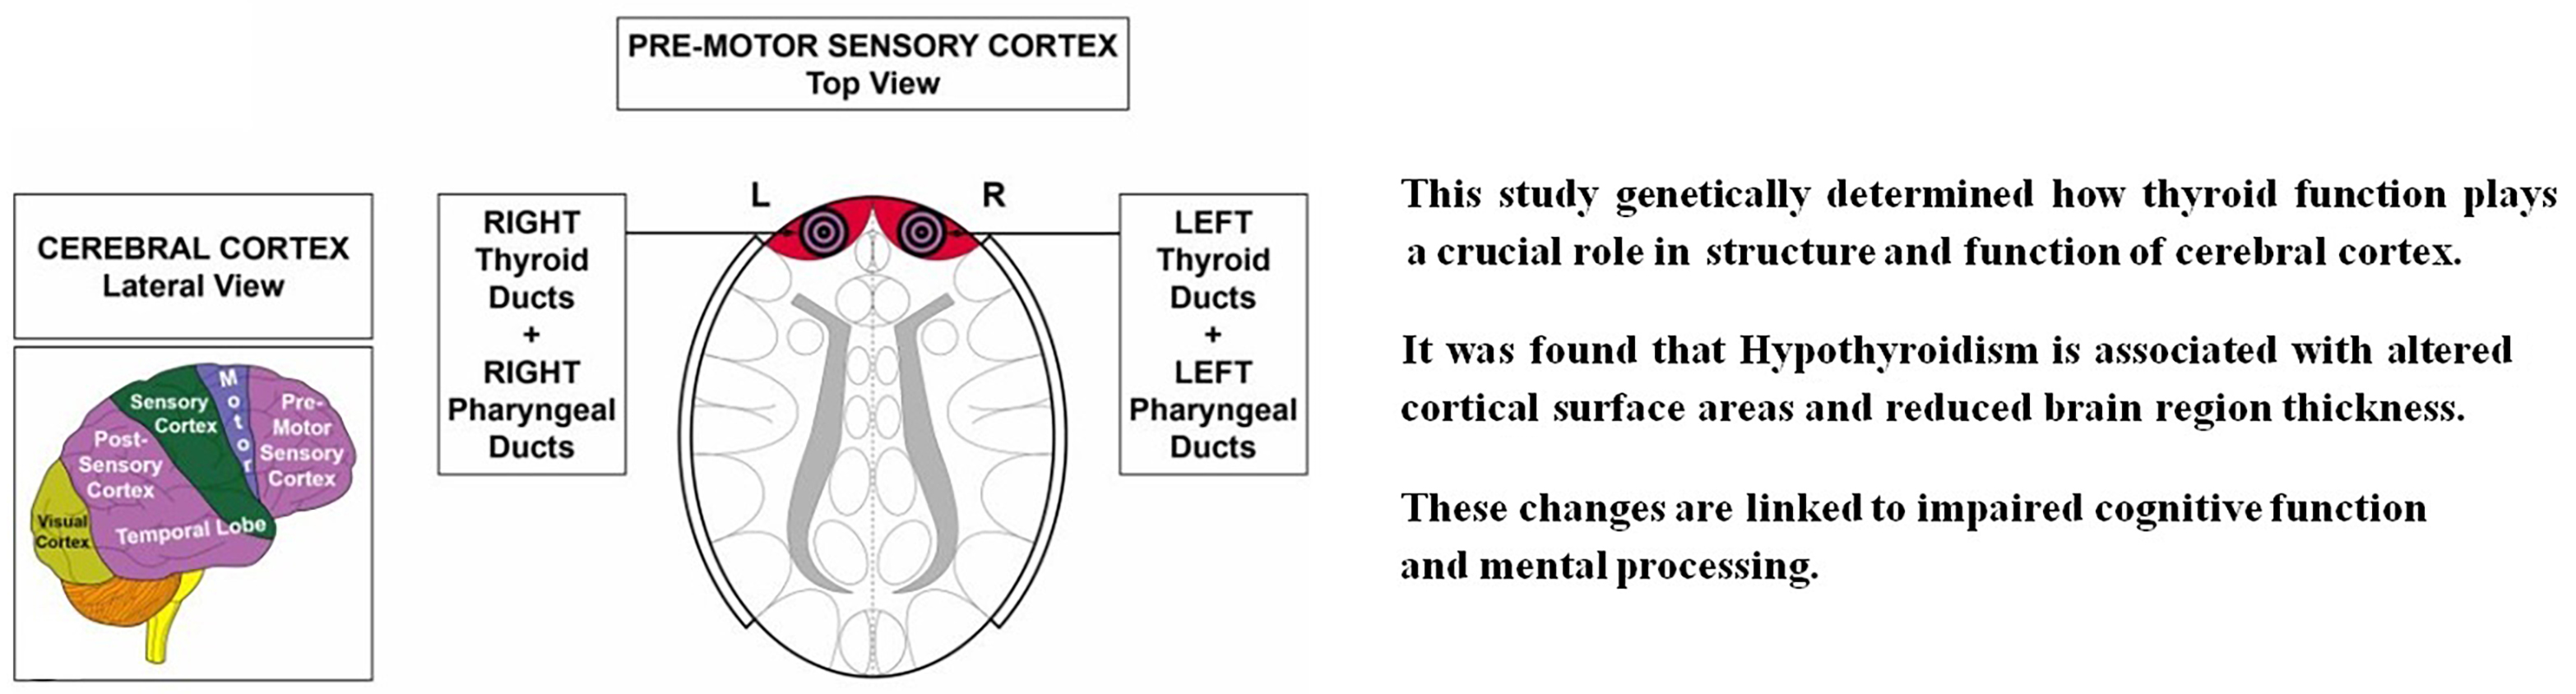
Conclusions. Our findings indicate a possible causal link between thyroid function and the cortical architecture of particular functional areas associated with neurodegenerative and psychiatric conditions.
Key words: cognitive function, thyroid function, Mendelian randomization, cerebral cortex structure, psychological diseases
Background
The central nervous system (CNS) and the endocrine system are inextricably connected. Thyroid hormones (THs) are critical for the regulation of the development and differentiation of neurons and neuroglia, as well as the development and function of the CNS. Tri-iodothyronine (T3) stimulates the nervous system, enabling vigilance, wakefulness and responsiveness to external stimuli. Moreover, TH stimulates the peripheral nervous system, enhancing gastrointestinal tone, motility and peripheral reflexes. Neurological impairments and psychiatric abnormalities can result from aberrant TH levels, which are essential for the maintenance of normal brain functions.1, 2 Emerging evidence suggests a potential causal relationship between TH regulation and specific cortical structures, providing novel insights into the neurobiological mechanisms underlying the cognitive and psychiatric manifestations of thyroid dysfunction. This association has significant implications for understanding the pathophysiology of conditions like hypothyroidism-induced depression and cognitive impairment, informing novel therapeutic strategies.3 The relationships between thyroid function and specific cortical structures may be mediated by neural substrates involving the hypothalamic–pituitary–thyroid axis, influencing neuroplasticity and synaptic pruning. Key regions include the hippocampus, amygdala and prefrontal cortex, where THs regulate gene expression, neurotrophic factors and neurotransmitter modulation, impacting cognitive and emotional processing.4 Patients with hypothyroidism frequently experience neurological and psychiatric symptoms, such as mood disorders, impaired memory and lack of concentration.5 Untreated long-term hypothyroidism can cause peripheral neuropathy. Hyperthyroidism can induce various neuropsychiatric symptoms, including anxiety, restlessness, mood instability, insomnia, memory loss, and psychosis.6, 7, 8, 9 Moreover, cognitive decline can occur due to variations in serum TH levels, even within the reference range.10, 11, 12
By altering the structure of the cerebral cortex, it is possible to visualize psychiatric disorders and cognitive decline.13, 14 Consequently, numerous studies have documented the impact of thyroid function on the structural characteristics of the cerebral cortex. For instance, investigations have indicated that subclinical hypothyroidism notably decreases the gray matter volume (GMV) in several brain areas, including the orbitofrontal gyrus and right inferior occipital gyrus, which are involved in sensory functions, impulses and learning.15 Su et al. found that the GMV of specific functional regions, such as the right superior frontal gyrus, superior temporal gyrus, medial frontal gyrus, and supplementary motor area, showed notable decreases in patients with untreated hypothyroidism.16
Similarly, Göbel et al. observed changes in GMV in specific brain regions among individuals with hyperthyroidism.17 The condition results in a reduction of GMV in the bilateral hippocampus and para-hippocampal gyrus, left temporal pole and bilateral primary visual cortex.18 Nevertheless, these studies failed to elucidate the directionality of these relationships. Moreover, the studies conducted with a limited sample size present several significant limitations, such as the challenge of determining reverse causality, the presence of potential confounding variables and discrepancies in interpretations. In light of this, it is crucial to investigate the possible causal impacts of thyroid function on the structure of the cerebral cortex. Examining causal effects can aid in pinpointing risk factors and mitigating the occurrence of thyroid disorders linked to neurological or psychological conditions.
Randomized controlled trials have proven to be valuable in exploring causal relationships; nonetheless, they face challenges such as inadequate long-term compliance from participants and several other complications. The examination of various genetic factors for their correlation with particular studies was facilitated by the accessibility of data from extensive genome-wide association studies (GWAS). As a result, methodologies based on Mendelian randomization (MR) were developed to determine the possible interaction between genetically influenced exposures and clinical outcomes. Genetic variations are considered crucial components in these methodologies.19 Marouli et al.20 previously conducted a study utilizing MR to clarify the risk linked to a reduced likelihood of developing Alzheimer’s disease (AD). The findings indicated that individuals with AD showed an elevation in genetically anticipated thyroid-stimulating hormone (TSH) levels, all while remaining within the normal range. A separate MR study indicated that hypothyroidism may lower the risk of developing schizophrenia. Consequently, it was hypothesized that THs could impact cognitive function and mental state by modifying the structure of particular cerebral functional regions.21
Consequently, we utilized the MR method to explore the causal relationships between thyroid function, both within normal and aberrant ranges, and the structure of the cerebral cortex, which includes the global cerebral cortex along with its 34 functional subdivisions.22 The MR method is utilized for its ability to leverage genetic diversity in examining the causal relationship between exposures and outcomes. This approach utilizes genetic variants as natural experiments, randomly distributed during meiosis, which helps to reduce confounding and misinterpretation of results from epidemiological studies. It effectively avoids reverse causation, ensuring that the genetic variations used in these studies are not influenced by the onset or progression of outcomes. This method provides unbiased estimates of the effects of a causal variable without requiring a traditional randomized controlled trial. As a result, MR is primarily utilized in conjunction with various forms of information for the purpose of causal inference. We investigated single nucleotide polymorphisms (SNPs) to assess whether there is a relationship between an SNP and thyroid function, and how it may influence specific cortical thickness (CT) or surface area (SA) outcomes. After performing a comprehensive literature review, no MR-based study was identified that explored the relationship between cortical thickness, SA of the cerebral cortex and thyroid function phenotypes.
Objectives
This paper presents a 2-sample MR analysis to elucidate the relationship between thyroid dysfunction and brain structure and function.
Materials and methods
Study design and data sources
The guidelines outlined in Strengthening the Reporting of Observational Studies in Epidemiology using MR (STROBE-MR) were followed.23 We accessed the online database (Datasets – The ThyroidOmics Consortium, uni-greifswald.de), which includes GWAS summary data from a meta-analysis conducted by the THYROIDOMICS consortium, to obtain TH measurements. The database includes participants of European ancestry. We analyzed data from 54,288 individuals across 22 independent cohorts for TSH and 49,269 study participants across 19 independent cohorts for free thyroxine (FT4), providing sufficient power (≥80%) to detect small-to-moderate effects (0.1–0.3 standard deviations (SDs)) with a type I error rate of 0.05. The analysis employed MR methods (inverse-variance weighted (IVW), weighted median and MR-Egger regression) and addressed pleiotropy and heterogeneity, ensuring robust estimates of causal relationships. We excluded the data from participants taking thyroid medications or undergoing thyroid surgery. We considered the eligible participants with hormone levels within the cohort-specific reference range to have continuous phenotypes. To gain a comprehensive perspective, we also identified participants with TSH levels exceeding the upper and lower cohort-specific reference ranges, both elevated and decreased, using the summary data.
Assumptions
Three basic assumptions provided the basis of the MR analysis. First, the relevance assumption established a robust correlation between the exposure and the genetic variants. Second, we analyzed the genetic variants to ensure they were not associated with any confounding factors that could influence the exposure–outcome relationship. Finally, we examined the SNPs as genetic variants that influenced the outcome, such as changes in TH levels and/or brain structure, without being affected by alternative pathways. We primarily collected data on normal range thyroid function, as indicated by TSH and FT4 levels, and correlated them with functional regions of the brain. We assessed changes in brain regions by considering variations in cortical thickness and SA. Consequently, we analyzed the causal effects of thyroid dysfunction, specifically hyperthyroidism or hypothyroidism, as indicated by TSH levels, on the cortical structure of 34 distinct brain regions. Figure 1 depicts the overview of this study.
Statistical analyses
Thirty-four specific brain regions were considered as phenotypes. Bonferroni-corrected p-values (i.e., 0.05/544 = 9.192 × 10⁻⁵) were used to analyze brain region-level data in 544 MR estimates, accounting for multiple testing. The correlation data were considered significant if the p-value exceeded the Bonferroni-corrected threshold but remained below 0.05. A stronger association between the parameters was declared if the p-value was below 0.01. The study employed Bonferroni correction to adjust for multiple testing, reducing the risk of type I errors. However, the stringent p-value threshold (p < 0.001) may have increased the risk of type II errors in this study, potentially obscuring true associations. For the analysis of changes in cortical regions at the global cortical level, statistical significance was considered if the p-value was < 0.05.
Mendelian randomization analysis
To address pleiotropy, SNPs were selected using thyroid-related GWAS data and proxy SNPs (R2 > 0.8) for index SNPs that had not been explicitly genotyped in this study. The MR methods used were the IVW method for estimating causal effects using SNPs as instruments to account for multiplicative random effects,24 the weighted median method and the MR-Egger regression. In order to mitigate the potential influence of horizontal pleiotropy on IVW estimations, MR-Egger regression was used for analyzing pleiotropy and estimated causal effects, and weighted median, weighted mode and simple mode methods were employed for addressing the potential heterogeneity. The MR-Egger method is commonly employed to detect instances of directional pleiotropy caused by genetic variants. Additionally, it can identify pleiotropic effects that are not associated with genetic variant exposure in general.25 The presence of horizontal pleiotropy was assessed using the weighted median approach. The instrument variables were considered valid if they accounted for more than 50% of the variation.26 The utilization of the weighted mode approach can effectively yield reliable estimates for both valid and invalid cases in general.27
Sensitivity analyses and outlier analyses
Several sensitivity studies were conducted to account for pleiotropy and obtain dependable MR outcomes. The presence of putative directional horizontal pleiotropy was assessed using Merger regression, with a p-value of less than 0.05 for the intercept term.28 The occurrence of pleiotropy was assessed for heterogeneity using Cochran’s Q statistic,25 with a significance level of p < 0.001. In addition, the existence of horizontal pleiotropy (p < 0.001) was assessed using the MR Pleiotropy Residual Sum and Outlier (MR-PRESSO) global tests.29 To assess an outlier, a leave-one out study was conducted. In this analysis, a p-value of less than 0.05 was used to determine if the MR results were significantly influenced by the exclusion of a single SNP.
Assessment of assumptions
For the MR analysis, this study considered the SNP as a genetic instrument. The associations between SNPs and the disorder were included if they exhibited genome-wide significance with p < 0.001 and the same was ascertained by excluding SNPs in linkage disequilibrium (R2 > 0.001 and clump window <10,000 kb). The strength of genetic instruments was determined through F-statistics and SNPs with an F-value <10 were excluded. The data were harmonized, and SNPs with either palindromic or intermediate allele frequencies were excluded, as were outcome-related SNPs that did not meet the genome-wide significance threshold (p ≥ 0.001). To exclude potential bias by risk factors and fulfill the requirements of the 2nd MR hypothesis, the reminding SNPs were searched in the PhenoScanner database.30 The study included 9 possible confounders31, 32, 33, 34, 35, 36, 37, 38: habits of smoking, coffee, and alcohol, diagnosed psychiatric disorders, years of educational attainment, migraine, diagnosed coronary artery diseases, body mass index (BMI), and sleep disorders. The PhenoScanner database revealed that no SNP was associated with migraine, educational attainment, psychiatric disorders, sleep disorders, or coffee intake. However, we identified 1 SNP (rs597808) associated with smoking and cardiovascular diseases, while 3 SNPs (rs1045476, rs4445669 and rs11039355) were linked to BMI. The remaining SNPs were excluded from further analysis due to their lack of direct association with brain structure and related confounders.
Software and data analysis
An online database (https://enigma.ini.usc.edu/research/download-enigma-gwas-results) was browsed and the summary of statistical data from the ENIGMA consortium was downloaded.39 The data on cerebral cortical SA [mm2] and CT [mm] were obtained from a meta-analysis. This GWAS summary data provided access to 51,665 individuals, mainly from the European population (94%). The data were analyzed across 60 cohorts using T1-weighted magnetic resonance imaging (MRI). An additive model was constructed for adjusted routine personal data (including sex, age, their squared values, their interaction, and their squared value), and the genetic associations for each cohort were analyzed. The Desikan–Killiany atlas40 was referred to as state 34 brain regions with known functional specializations. These functional regions of brains were analyzed through the MR approach by using globally weighted estimates and excluding the measures of regional phenotypes. It was carried out to avoid neuroanatomical variability between different individuals in regional phenotypes.
Results
Thyroid function is linked to specific brain regions, impacting neurobiological mechanisms. Hypothyroidism is associated with reduced hippocampal volume, leading to impairments in memory and learning. It affects amygdala activity, altering emotional regulation. Thyroid hormones modulate neurotransmitter balance, impacting cerebral cortex, basal ganglia and cerebellum, influencing mood, cognition and motor function, respectively.
Causal estimation for all brain regions
Initially, 4 indicator SNPs were screened separately for the data related to FT4 of men (FT4_men) and women (FT4_women) prediction while 10 indicator SNPs were analyzed for FT4 overall (FT4_overall). Likewise, 16 indicator SNPs were separately tested for TSH of men (TSH_men) and women (TSH_women) and 25 indicator SNP for overall TSH (TSH_overall). For increased TSH (inc_TSH) and decreased TSH (dec_TSH), 5 and 6 SNPs were included, respectively. As a criterion, the F-statistics of these genetic tools were considered significant if found greater than the normal selection value of 10. The complete results of causal estimation for all brain regions are shown in Figure 1, Figure 2, Figure 3, Figure 4, Figure 5, Figure 6.
Mendelian randomization Egger
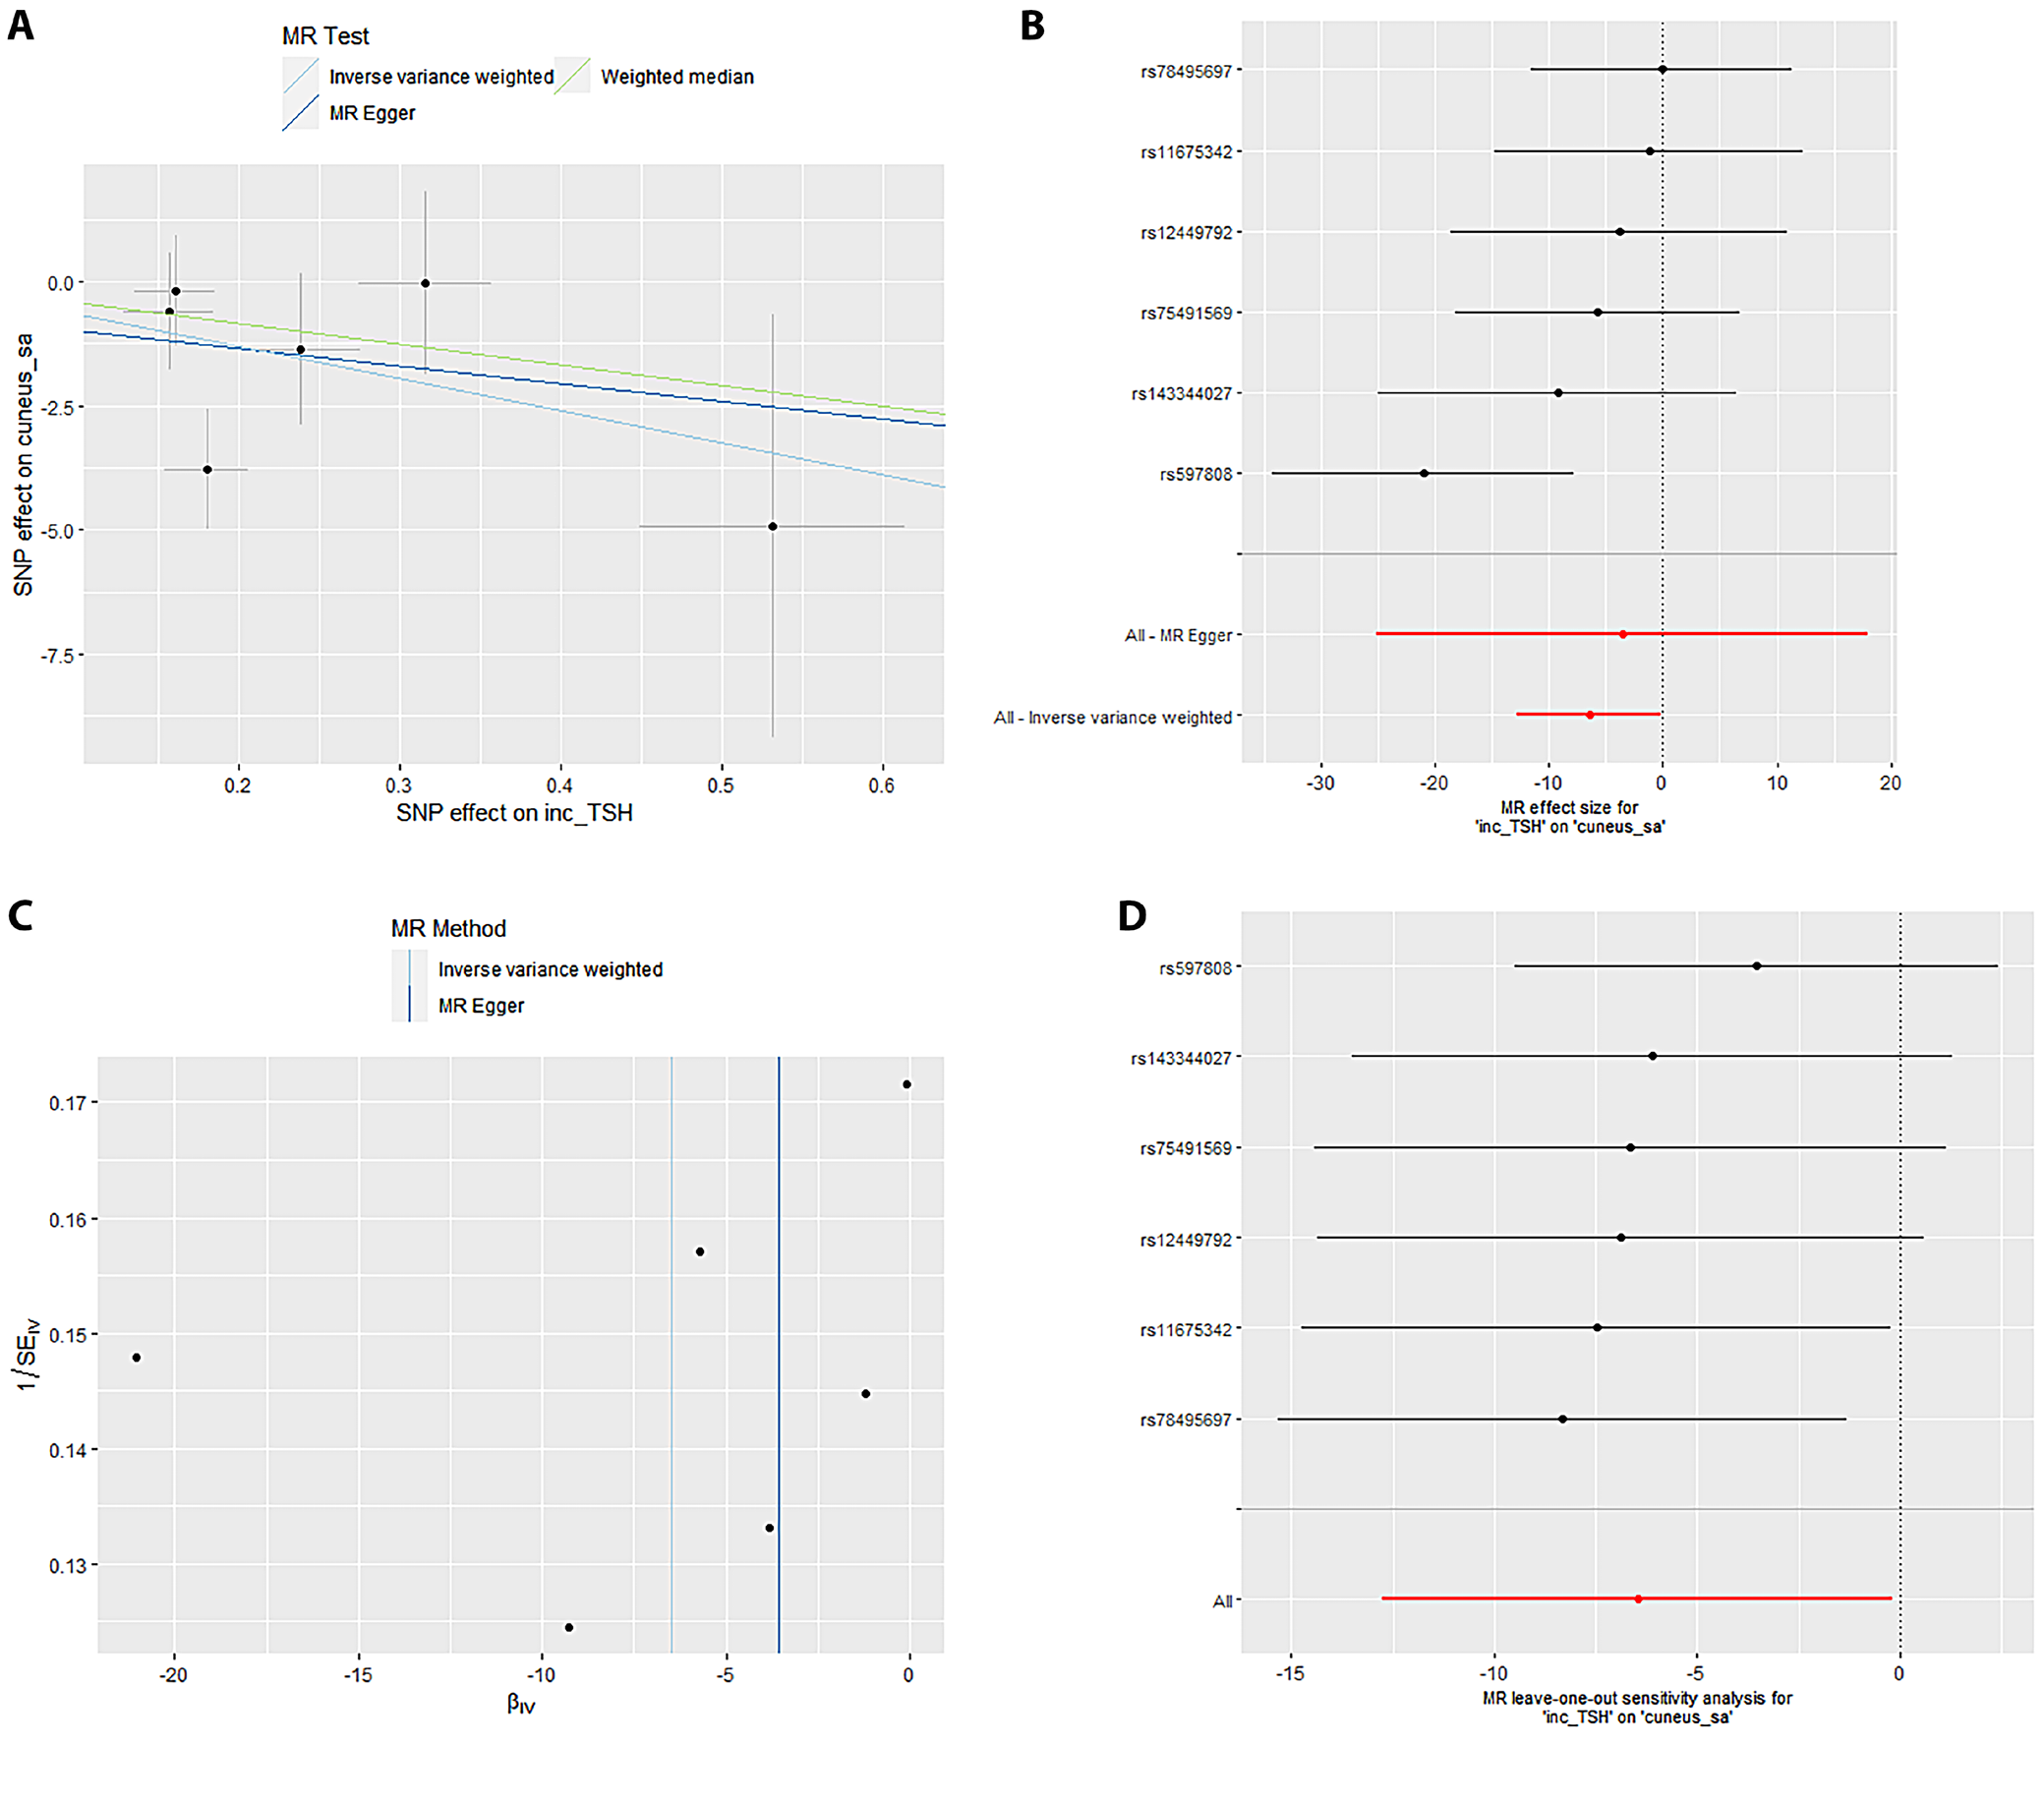
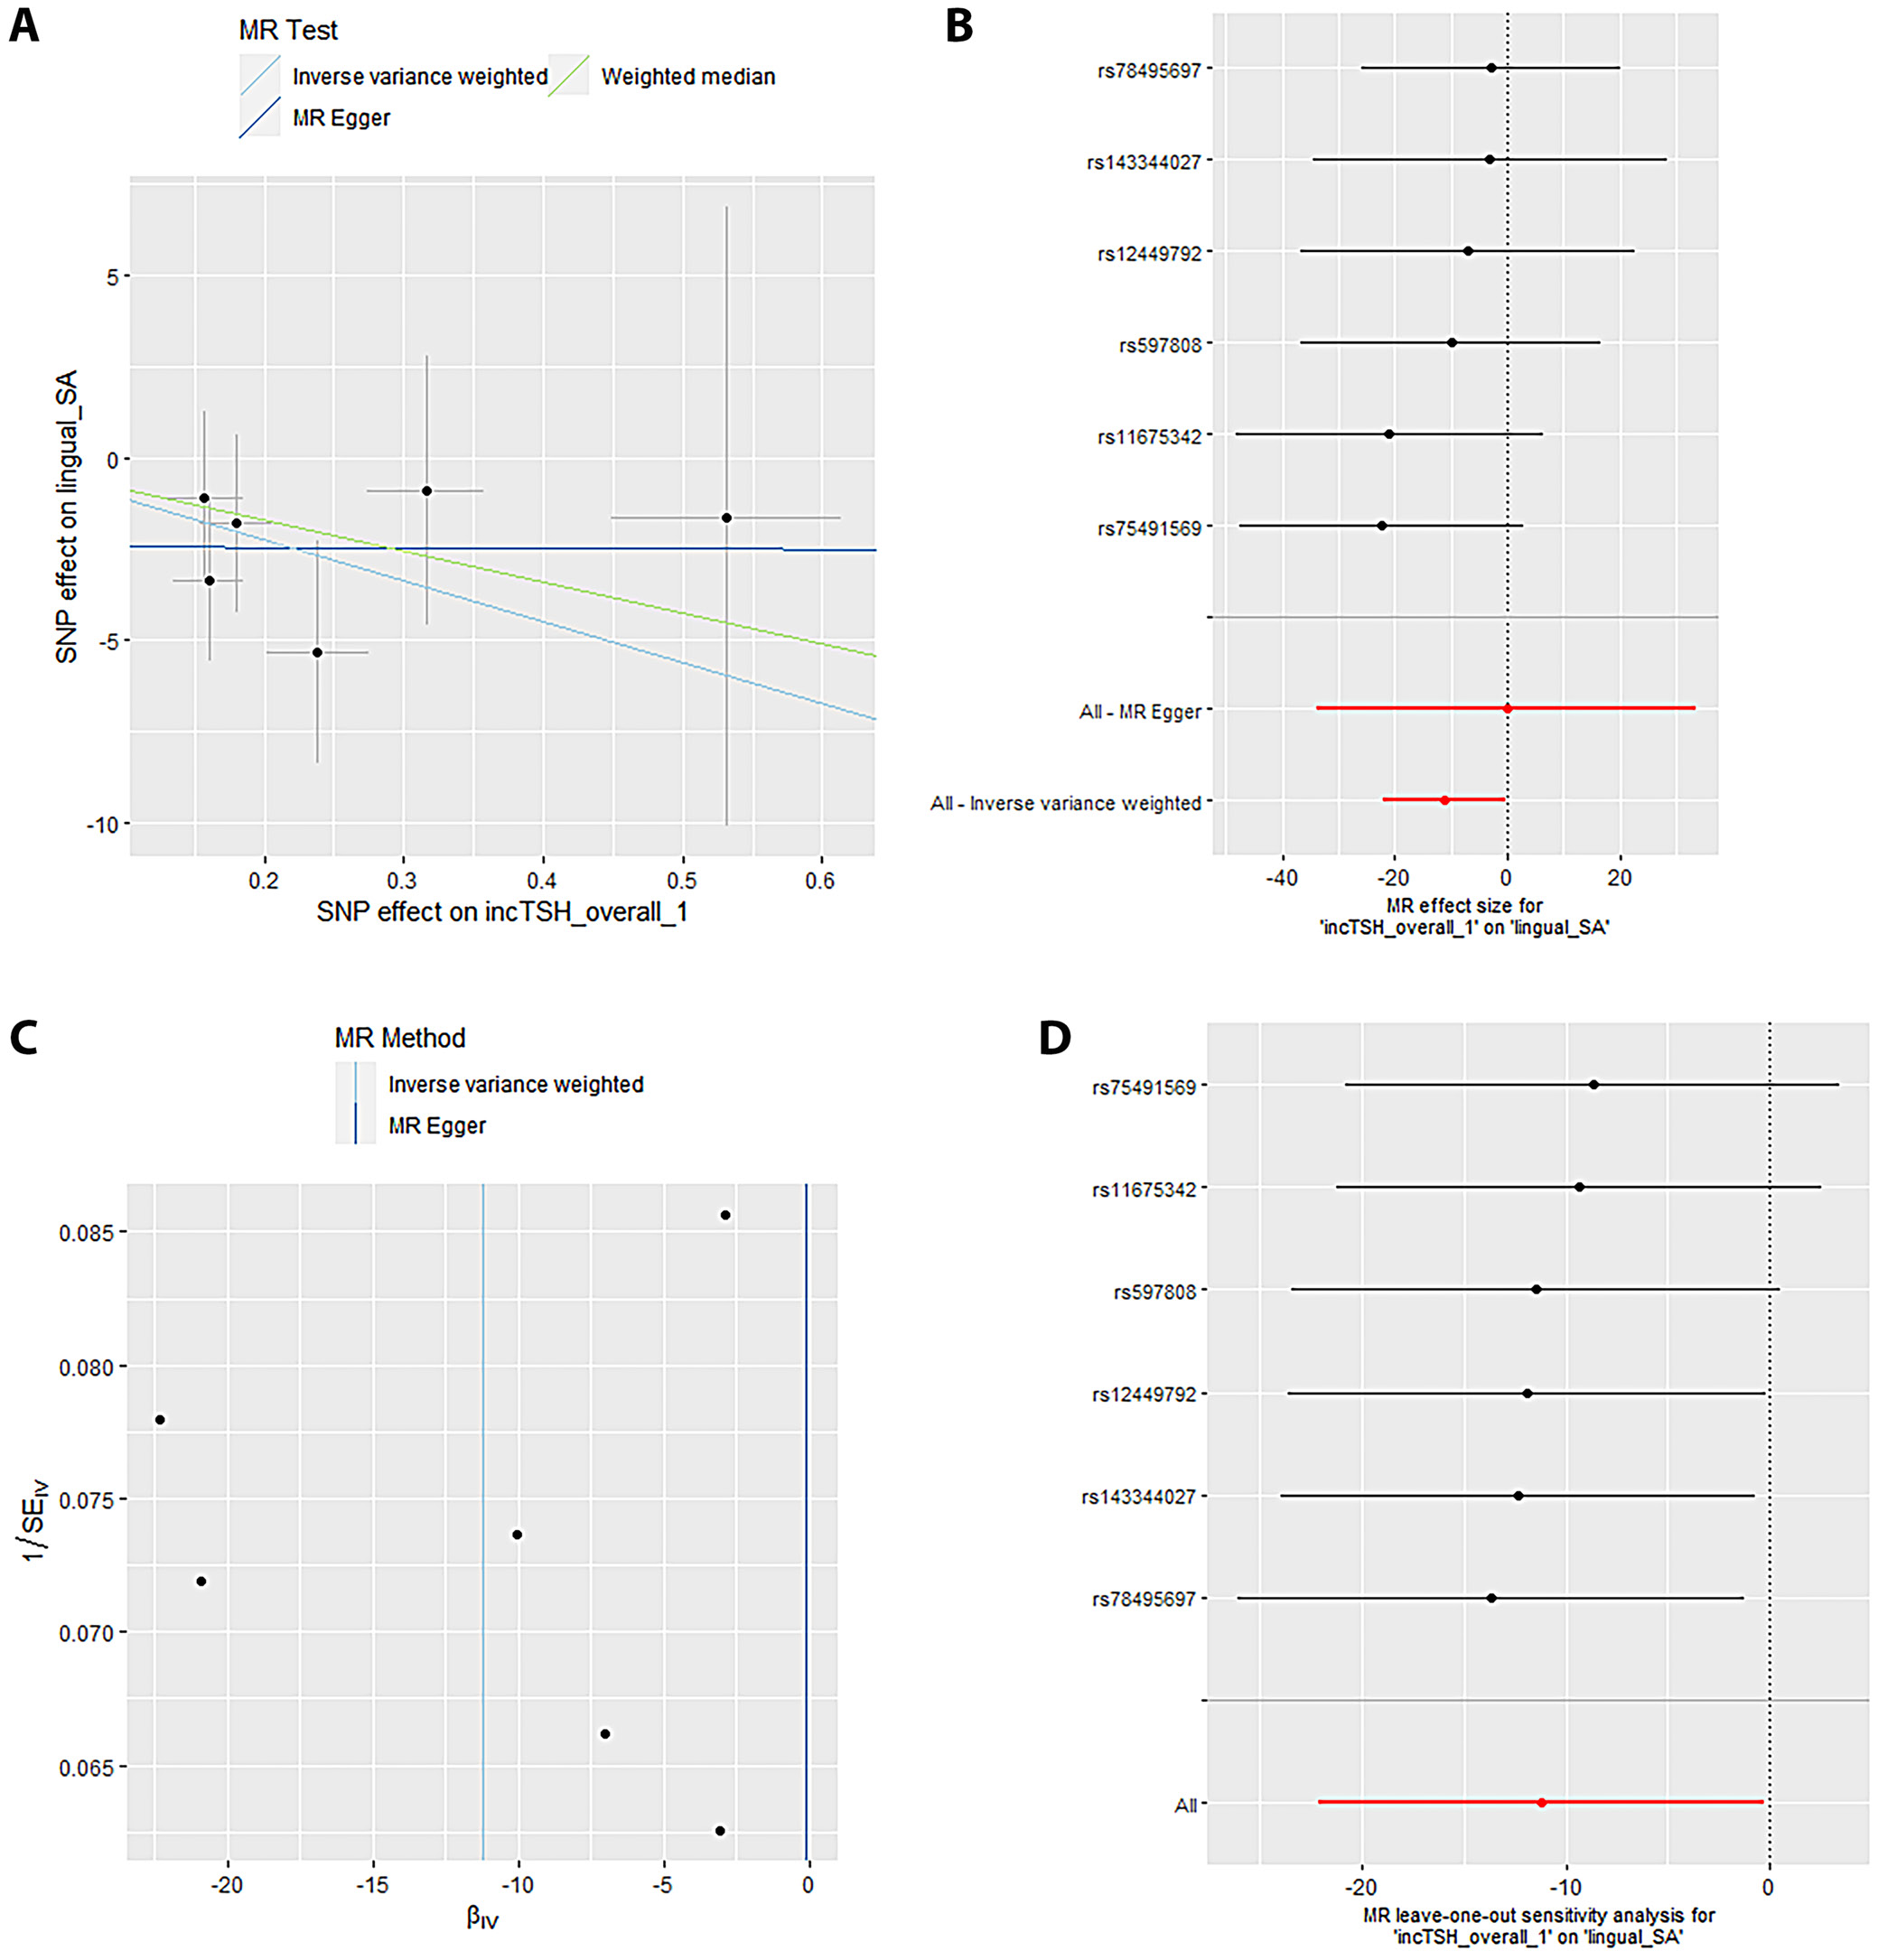
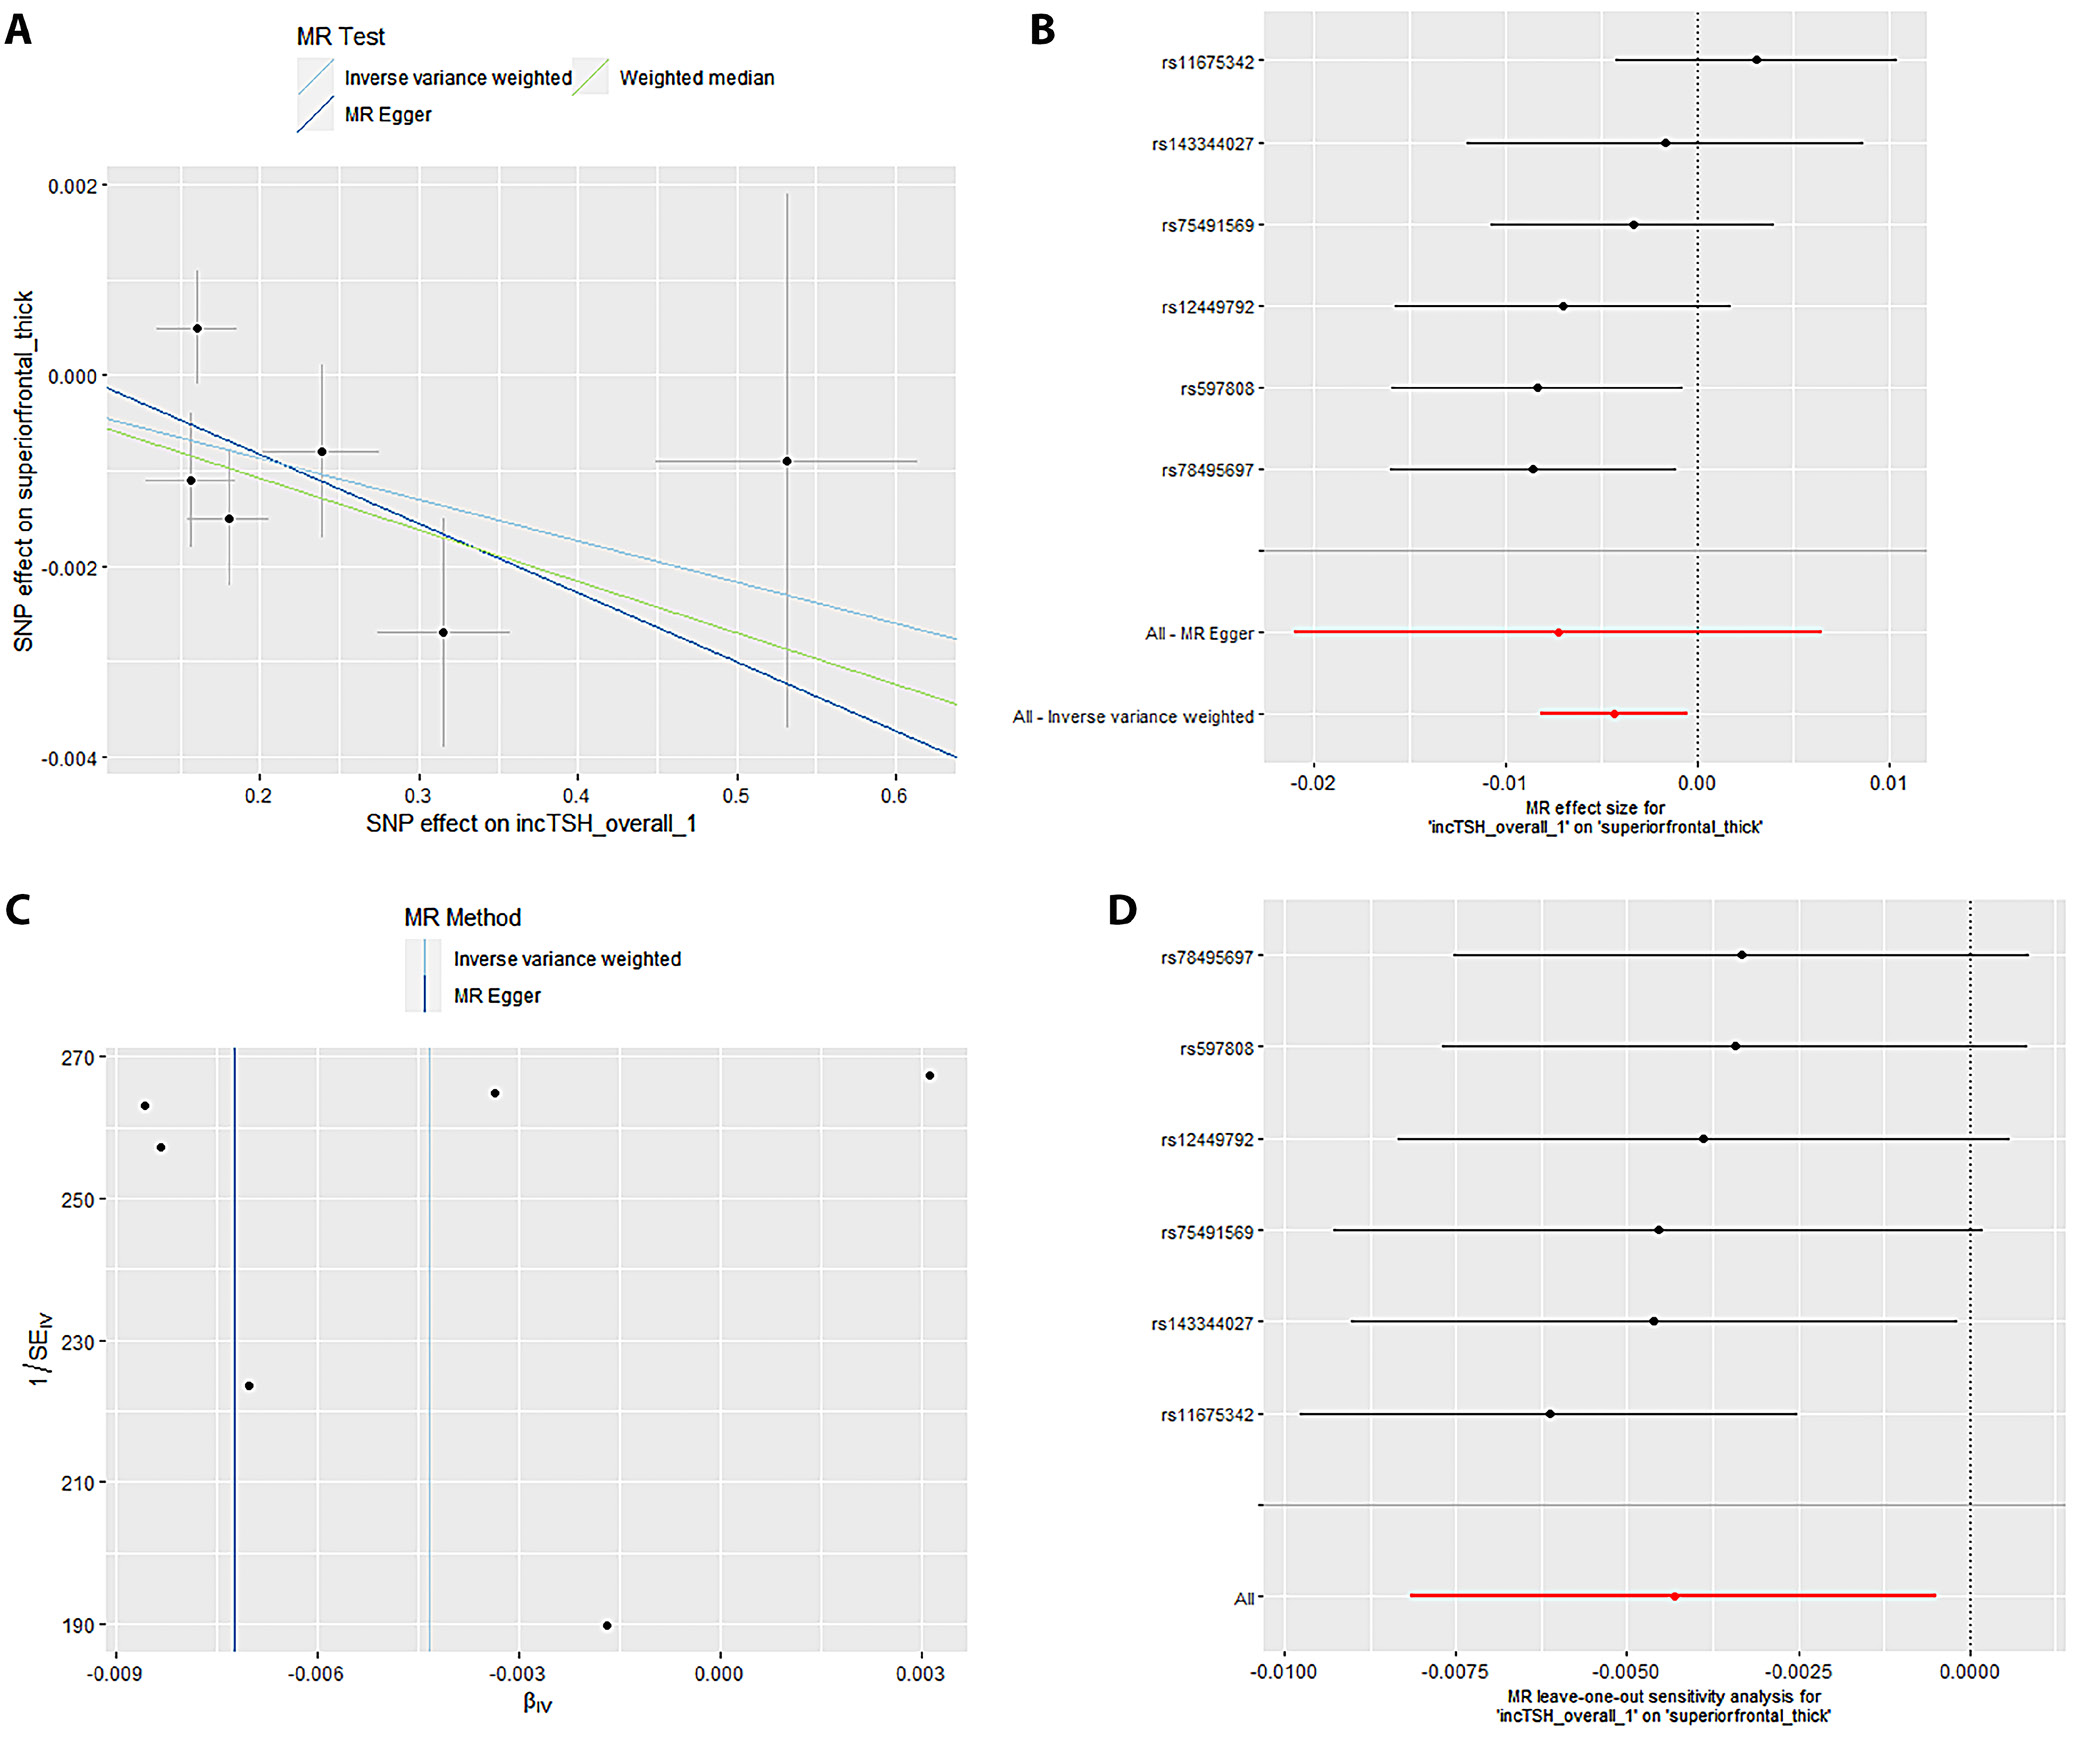
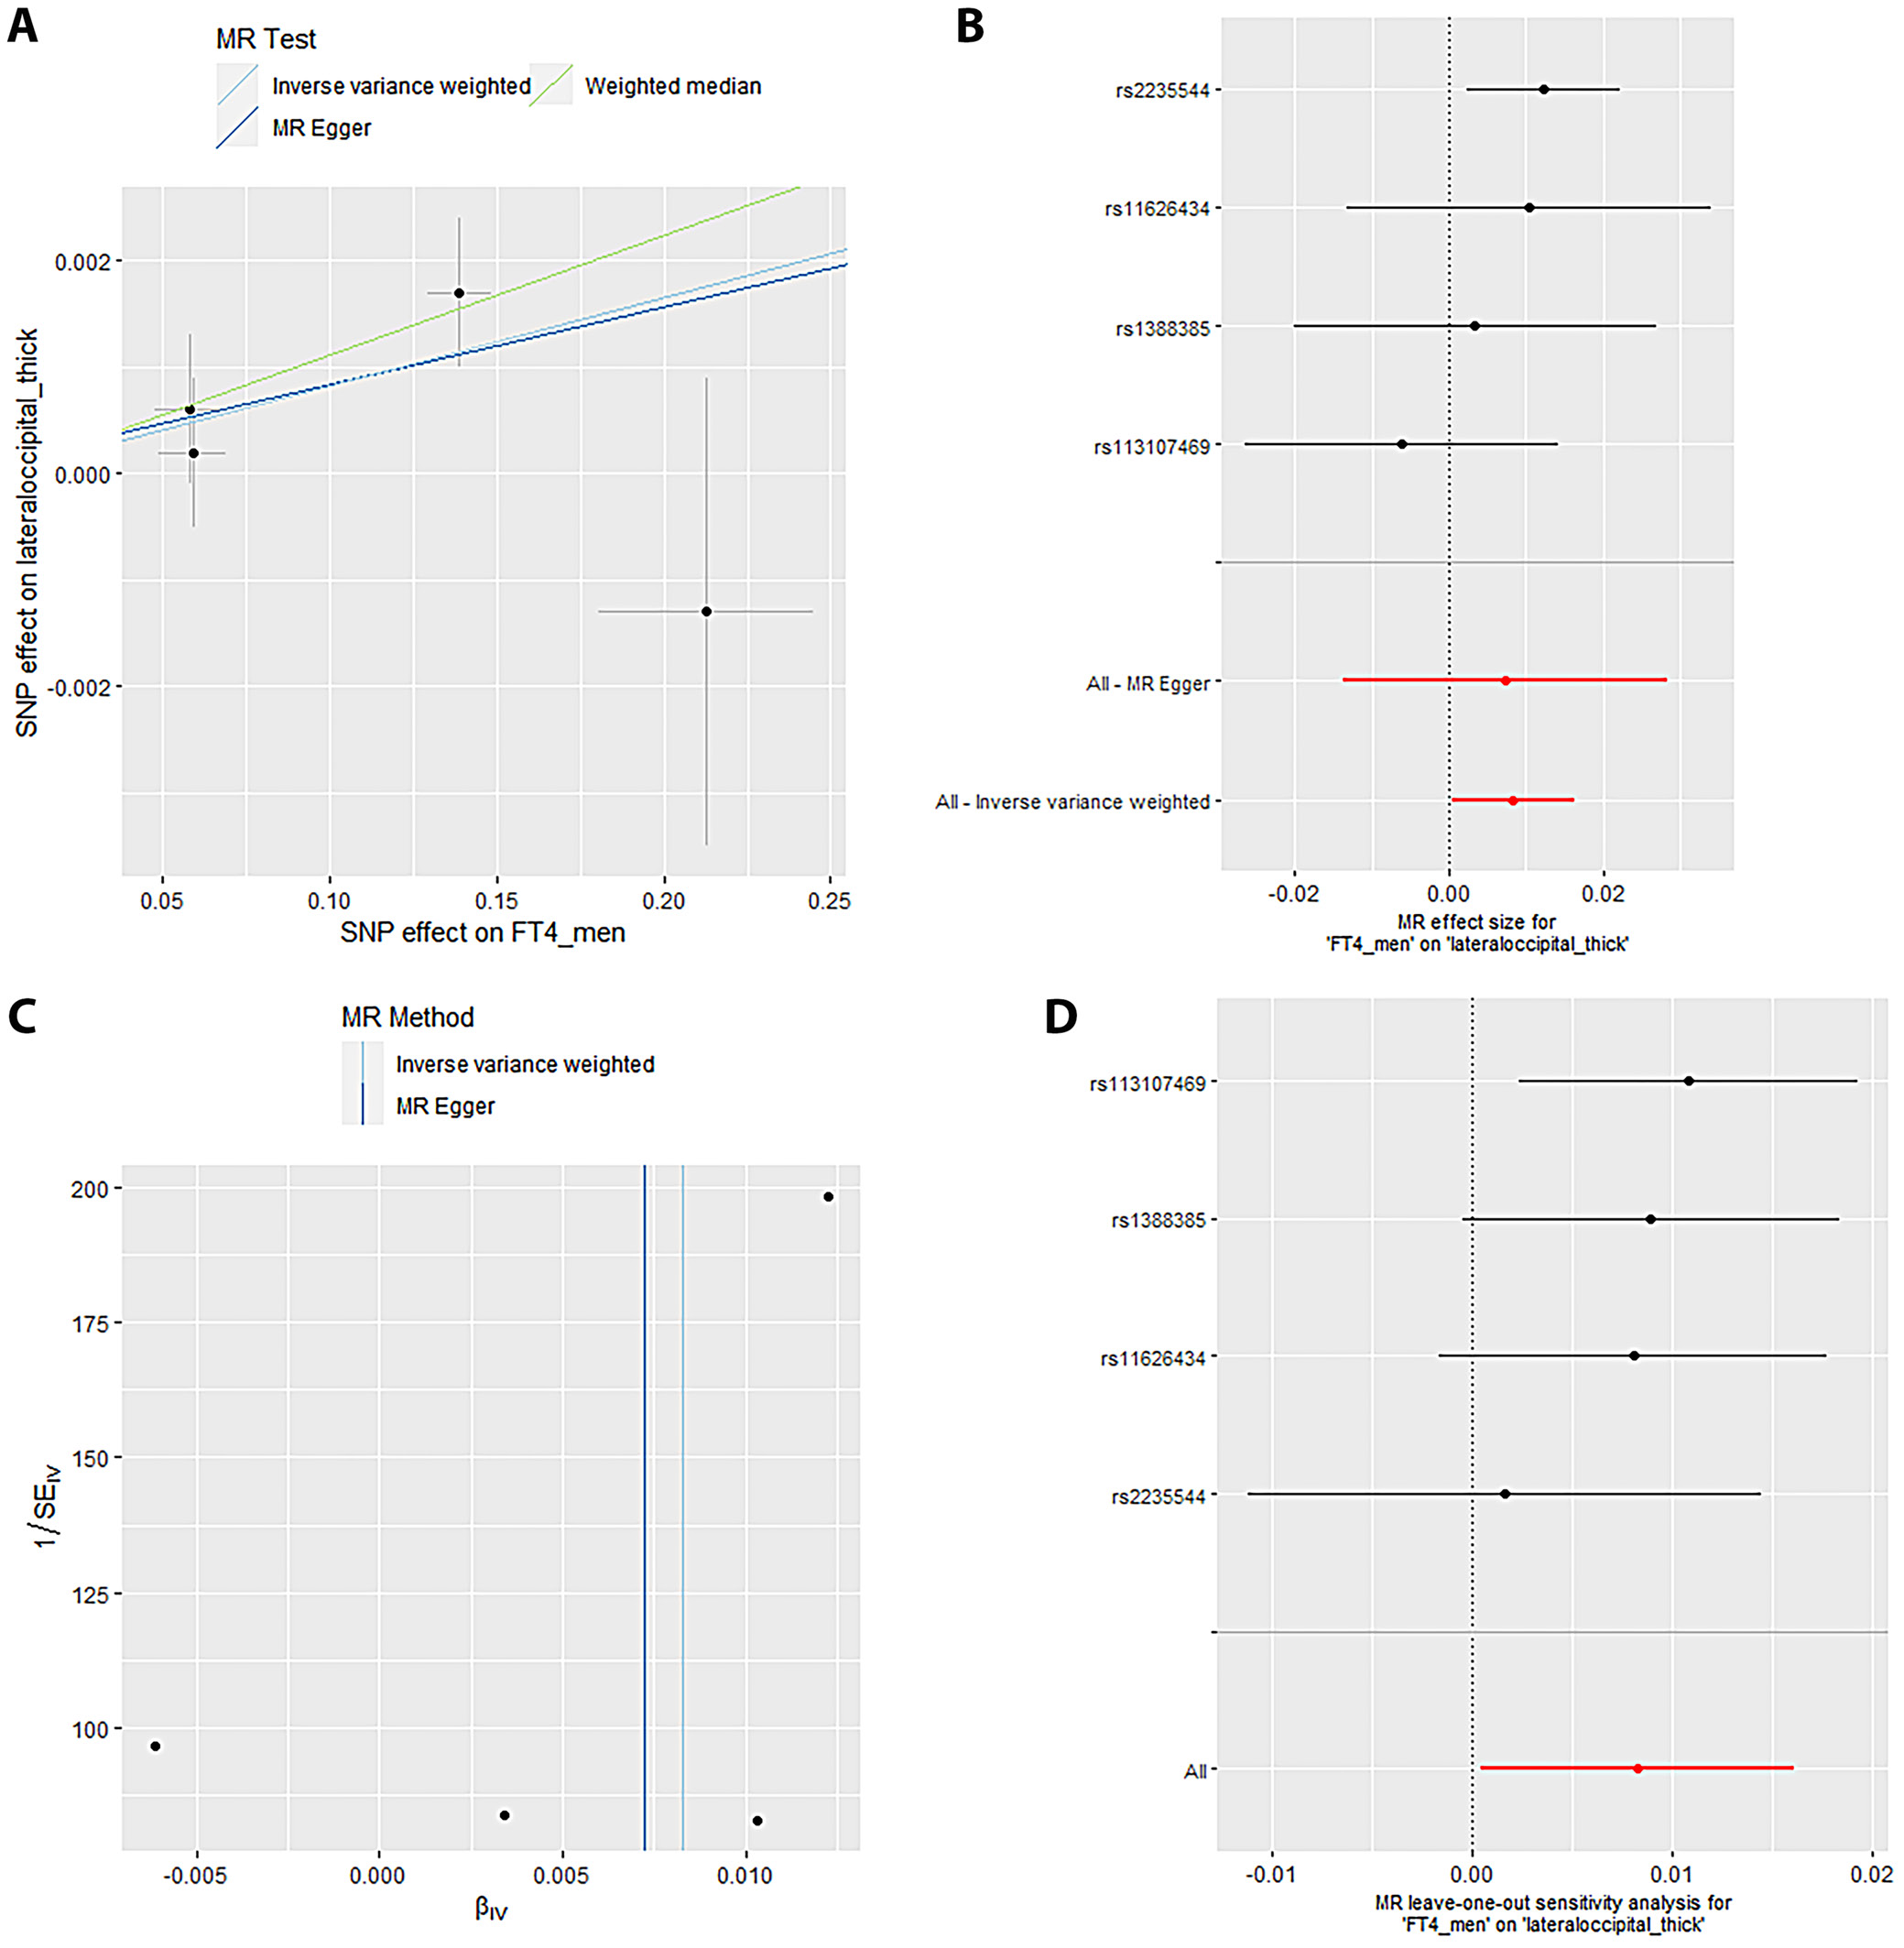
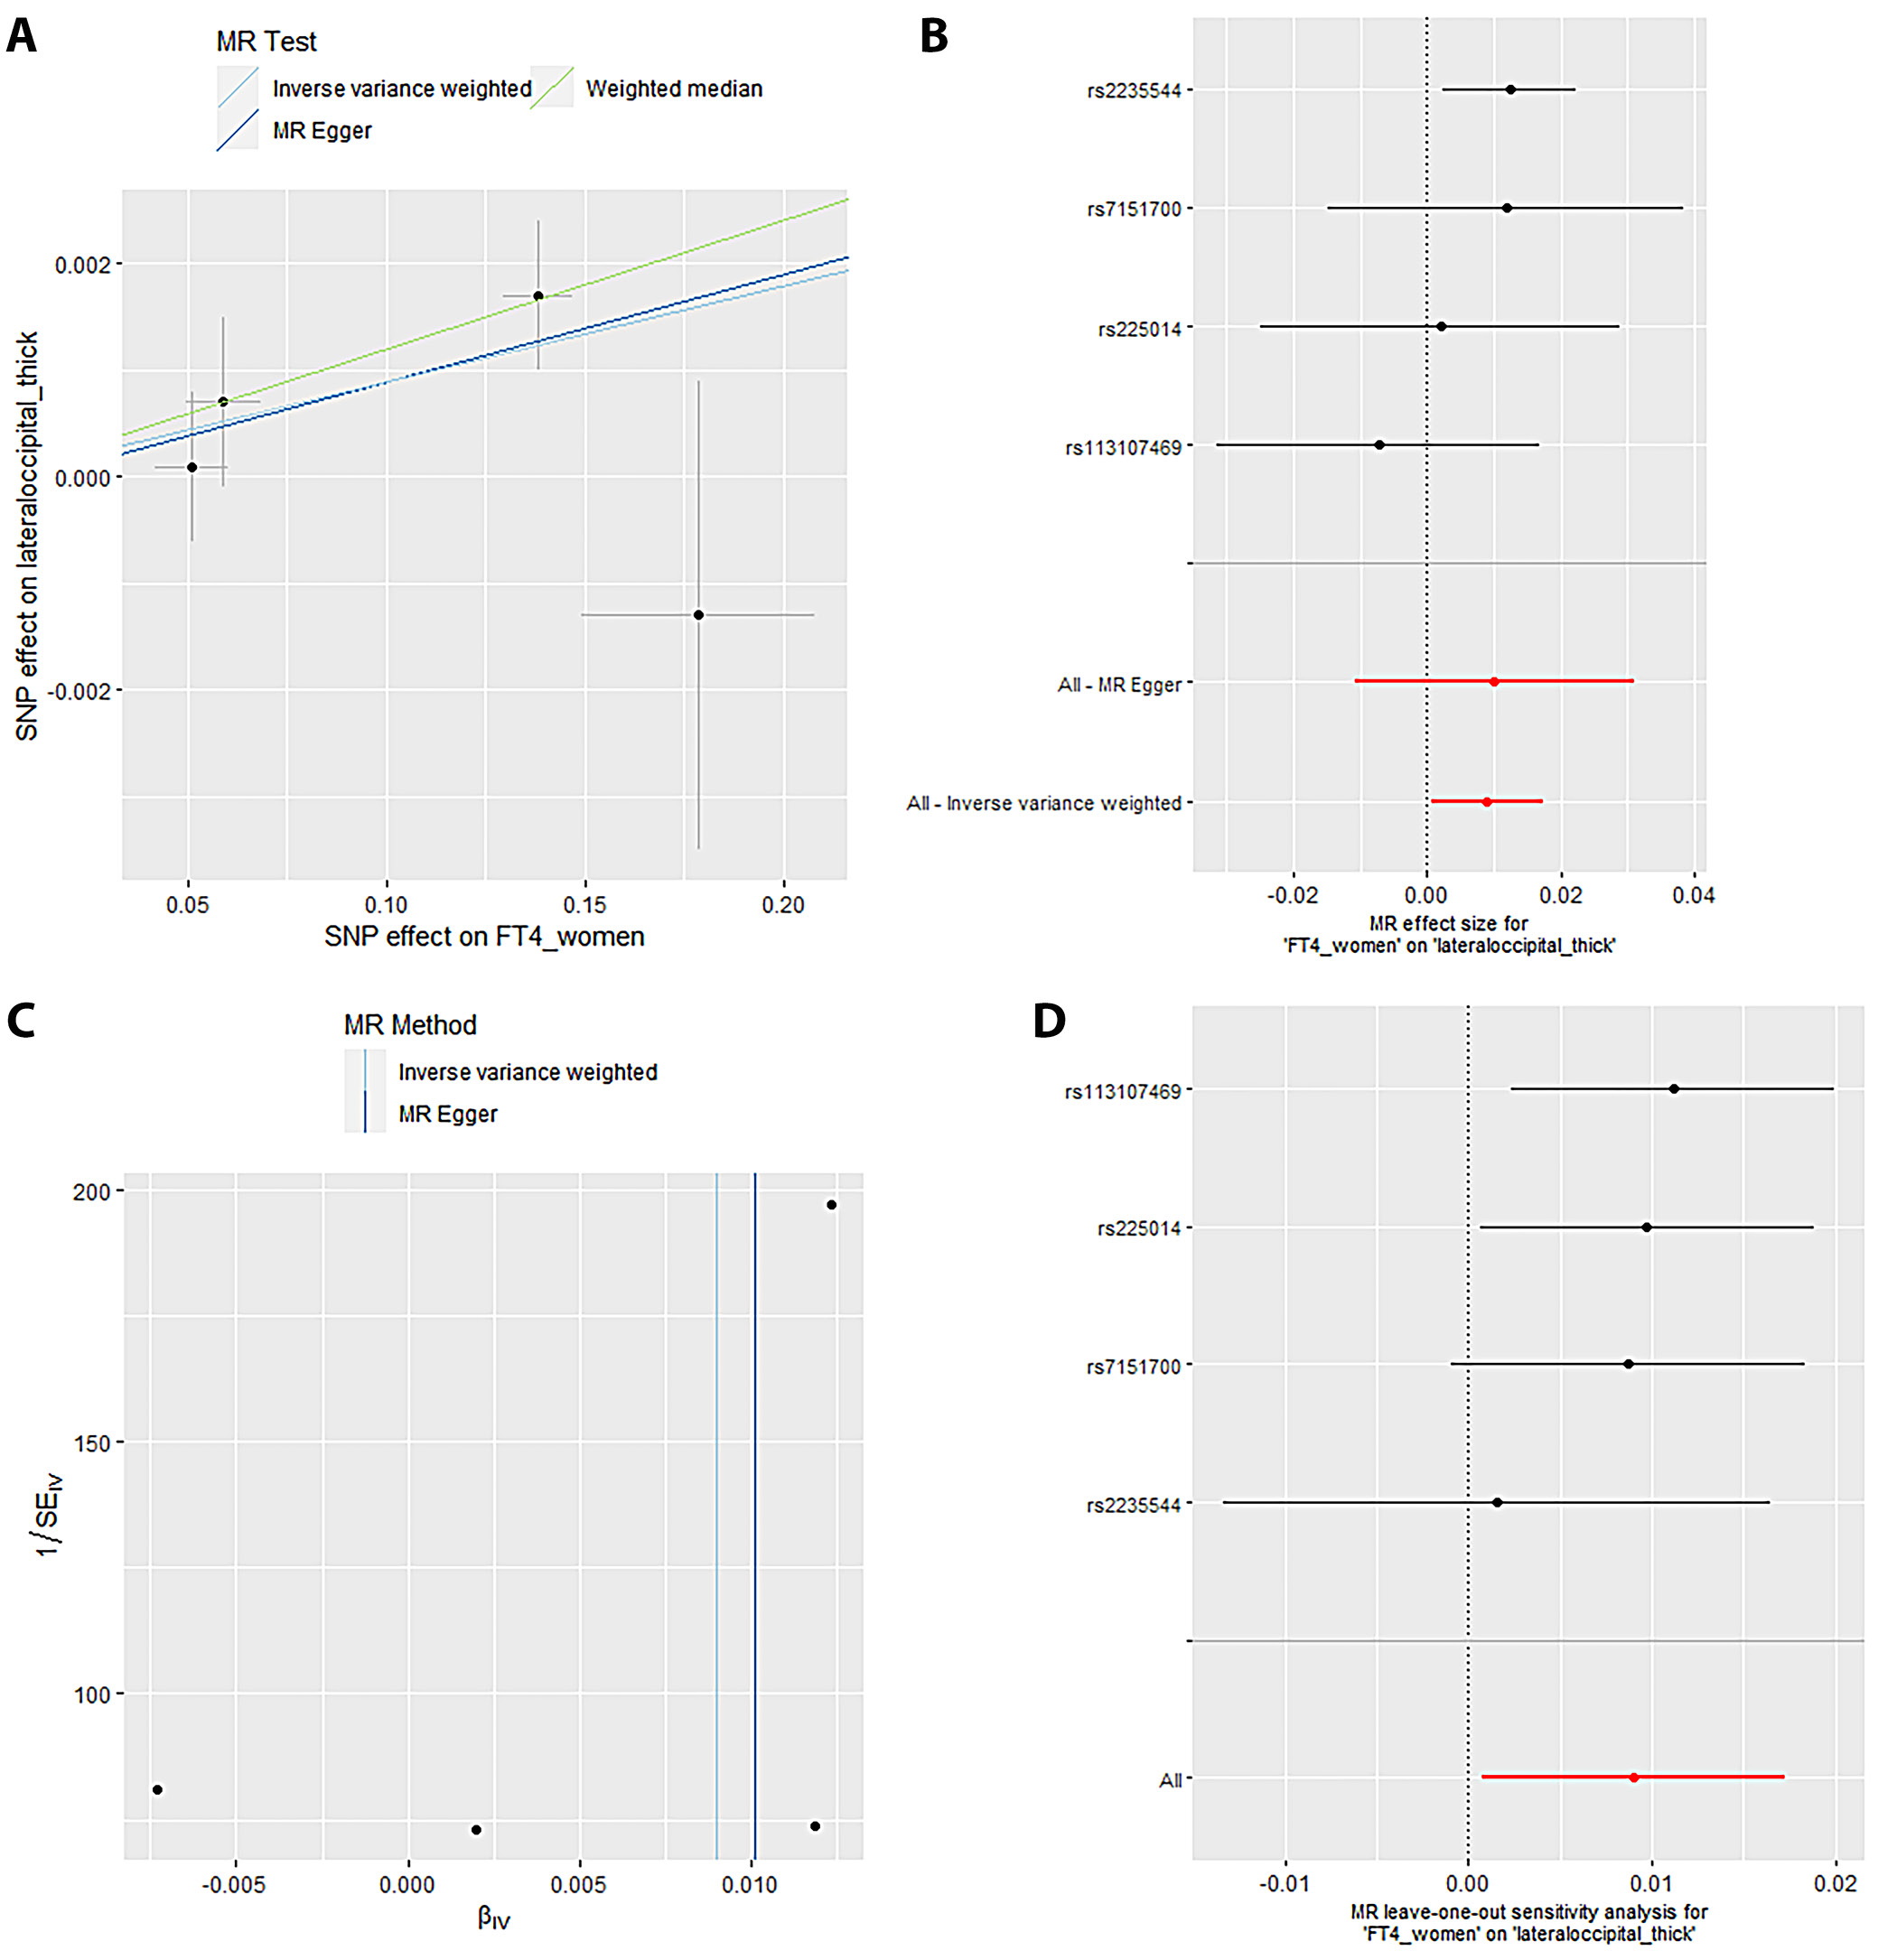
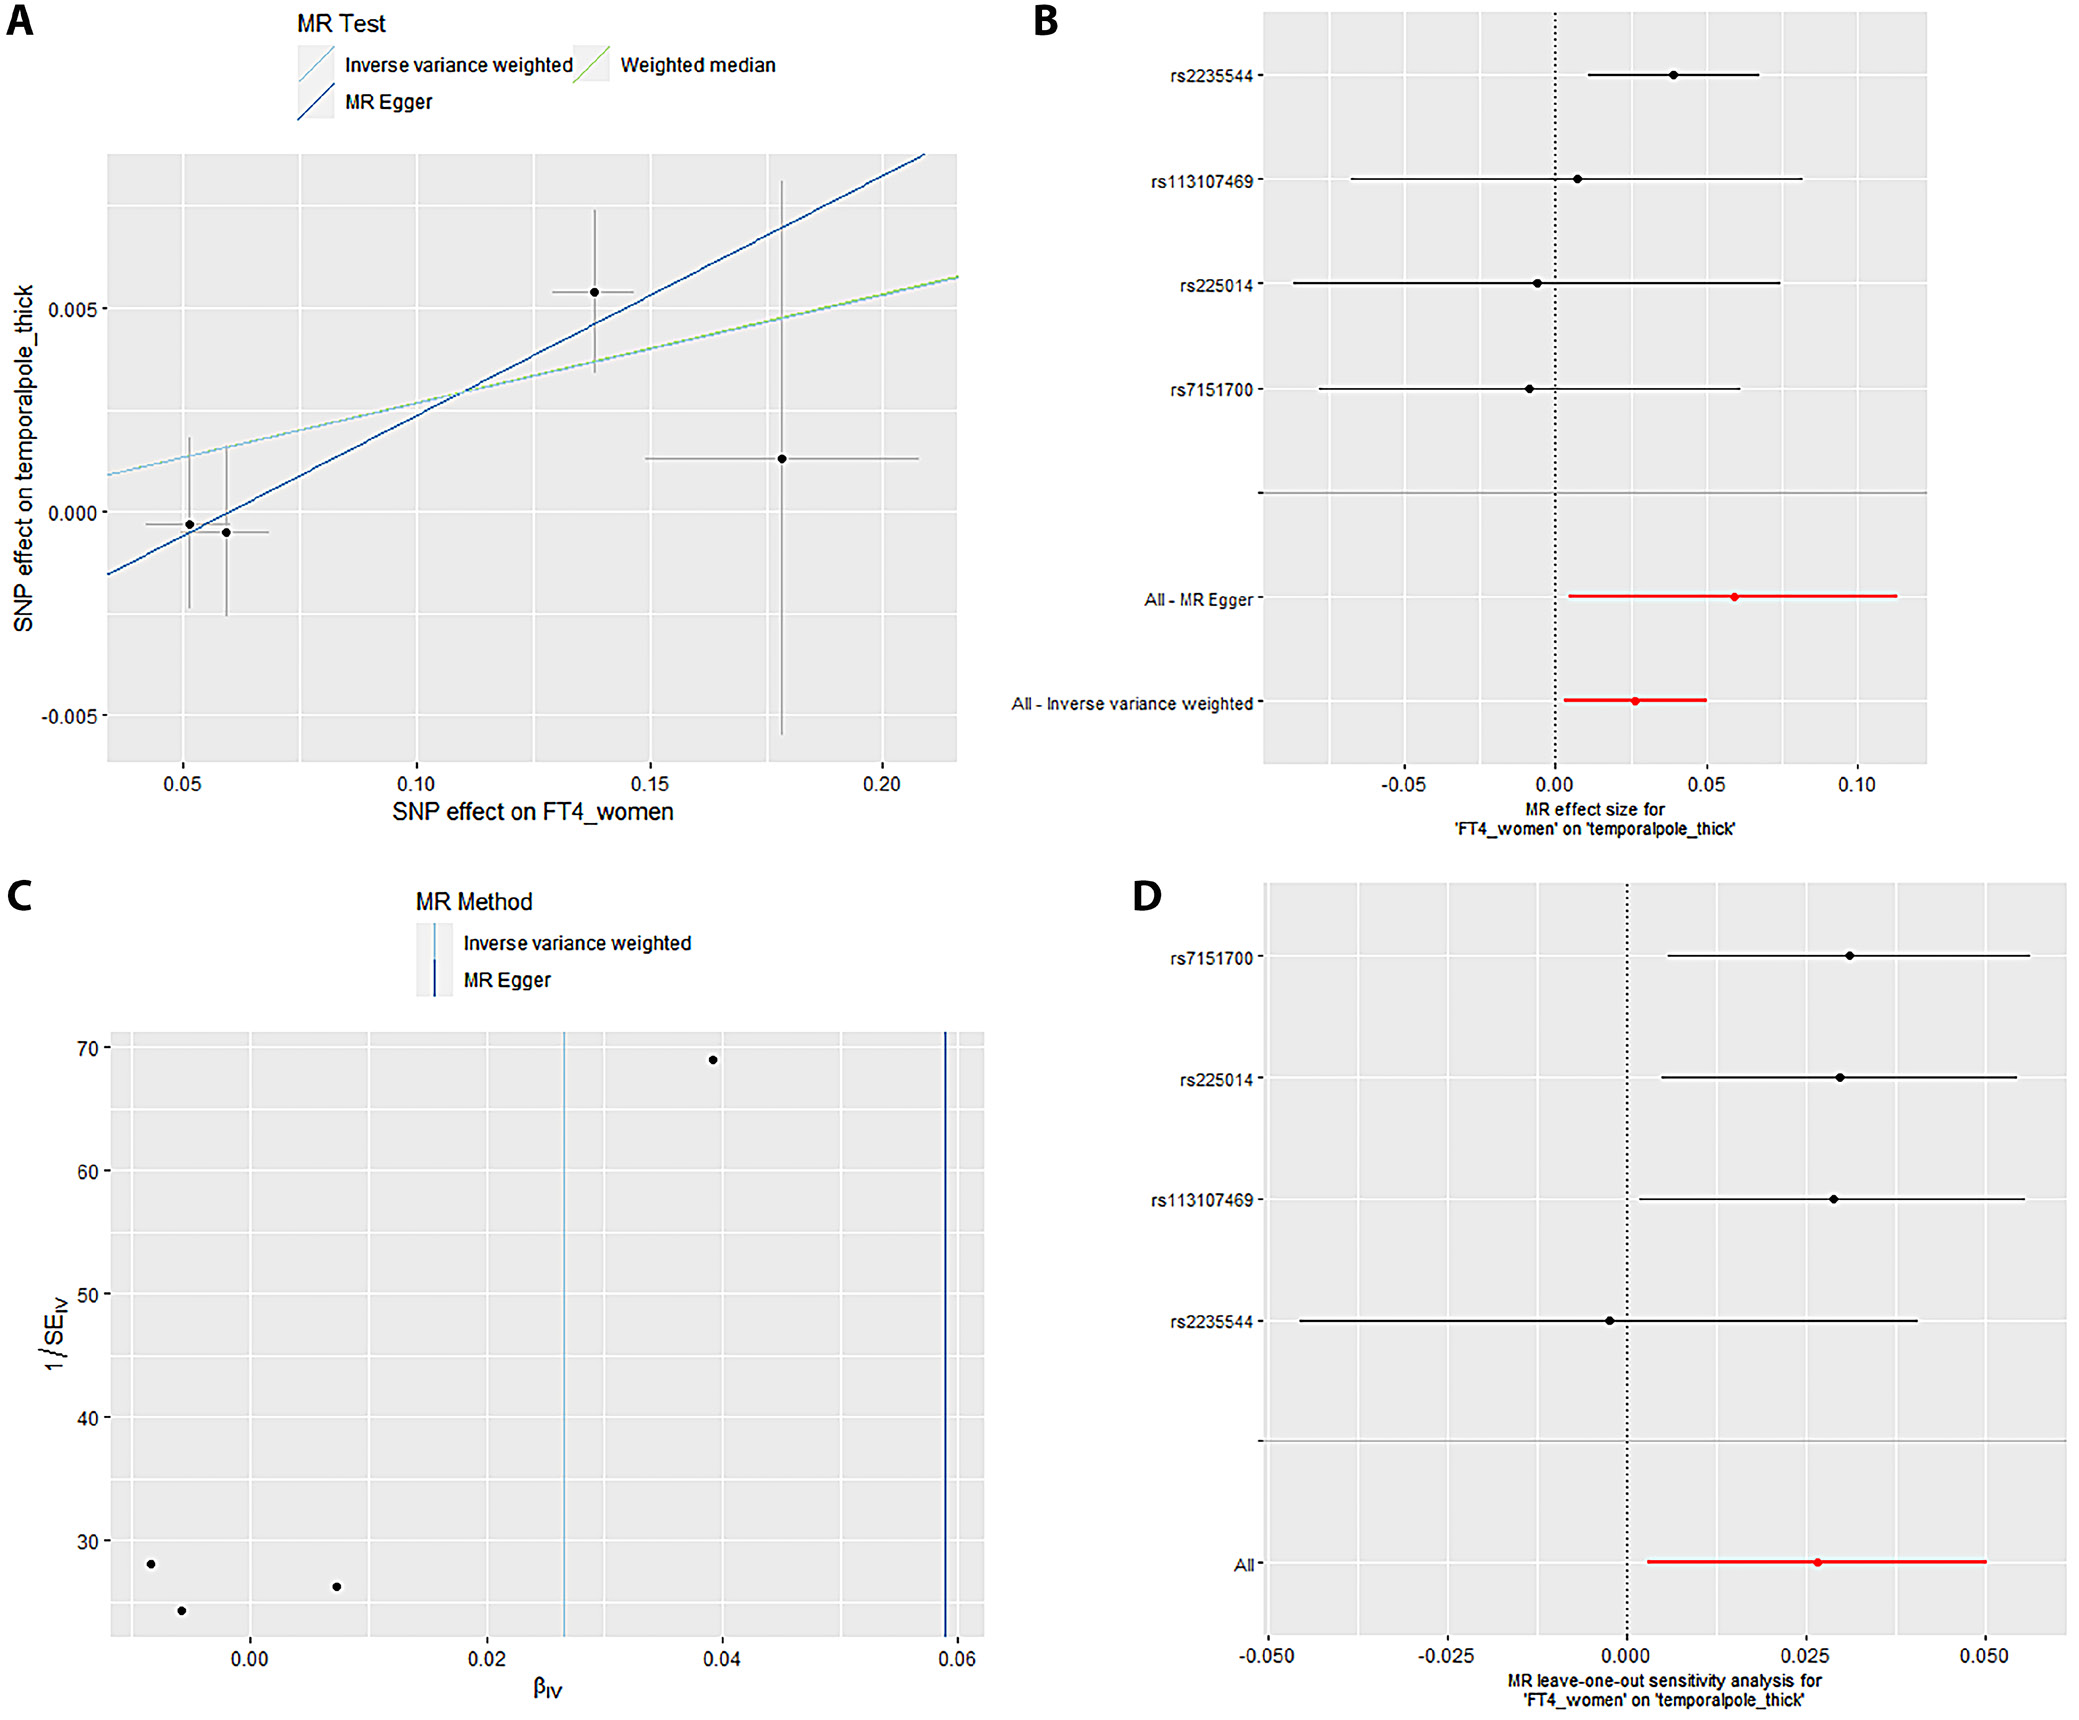
Mendelian randomization Egger (MR-Egger) was performed to analyze a directional pleiotropy test, a causal effect test and an estimation of the causal impact assuming that all genetic variants met the primary assumptions. However, the MR-Egger method can determine if genetic variants have pleiotropic effects on the outcome that deviate from 0 on average (directional pleiotropy). Figure 1 displays an analysis of the incTSH_cuneus_SA. Figure 1A depicts a scatter plot that shows the correlation between the effect of SNP on cuneus_SA and its influence on cuneus_TSH. It demonstrates that SNPs influence not only the composition and functionality of the gene product but also its quantity. Meanwhile, Figure 1B presents a forest plot illustrating the results of the MR analysis, which assesses the relationship between cuneus SA (cuneus_SA) and TSH levels (cuneus_TSH). Point estimations are quantified as the alteration in the magnitude of the MR effect size. Figure 1C depicts the funnel plot, which exhibits asymmetry caused by certain genetic variations that have exceptionally powerful influence on the result despite having poor precision. This asymmetry suggests the presence of directional pleiotropy. Figure 1D presents the leave-one-out sensitivity analysis. This method systematically excludes each genetic variant from the MR analysis one at a time to assess the robustness of the results and identify any influential variants that may disproportionately affect the overall findings. Likewise, Figure 2 displays the similar analysis of the incTSH_overall_1 lingual_SA, Figure 3 for incTSH_overall_1 superiorfrontal_thick, Figure 4 displays a research analysis of the thickness of the lateral occipital (LO) region in men, utilizing FT4 data, Figure 5 shows analysis of LO thickness in women with FT4, and Figure 6 presents the study of temporal pole thickness in women with FT4.
The data revealed 7 causal relationships between thyroid function traits and regional cortical thickness, which exhibited nominal statistical significance. Additionally, 5 causal relationships between thyroid function traits and regional cortical SA were observed to be statistically significant. Unfortunately, the study did not find any statistically significant results indicating the impact of thyroid function features on cortical structure in 34 brain functional regions (all p > 0.001). The data showed 7 causal relationships between thyroid functional trait and regional cortical thickness, which were found to have nominal statistical significance while 5 causal relationships between thyroid function traits and regional cortical SA were observed to be statistically significant. However, the impact of thyroid function traits on cortical structure could not be determined in 34 brain functional regions as the results were not statistically significant (all p > 0.001).
The data from the IVW model indicated that, at the functional area level with overall weighted analysis, genetically predicted levels of FT4 in men, women and the overall population were all positively associated with the thickness of the EC. Likewise, for FT4_men and FT4_women, weighted median method was of similar significance. Nonetheless, the consistent direction of association was determined through MR-Egger, simple mode and weighted mode methods. For FT4_overall, the other 4 methods also yielded consistent directions of association with IVW. The data analyzed with overall weighted analysis the IVW model showed that in the functional area level, genetic predicted levels of FT4_men, FT4_women were associated with the thickness of LO sulcus positively with weighted median of similar significance. Moreover, the consistency in the direction of association was strengthened by analysis made through MR-Egger, simple mode and weighted mode methods. Moreover, for another functional area, caudal anterior cingulate cortex (cACC), overall weighted analysis in the IVW model predicted that the level of TSH_overall and TSH_men were separately associated positively with the thickness of this area. For the former, the results were found consistent in the directions of association when analyzed through MR-Egger, weighted median method, simple mode, and weighted mode methods. For the latter, except for MR-Egger, the outcome of other methods affirmed the findings obtained with IVW. The genetic predicted level of TSH_men was also found associated with the thickness of cuneus gyri positively (β (SE): 0.007 (0.004, p = 0.040) through overall weighted analysis by the IVW model. Indeed, the weighted median method and simple mode method yielded consistent directions of association. However, MR-Egger and weighted mode methods obtained opposite directions of association. The data from overall weighted analysis and the IVW model showed that genetic predicted level of FT4_women was associated with the thickness of temporal pole positively. Except for simple mode method, MR-Egger, weighted median method and weighted mode methods supported the directions of association with IVW. The IVW model in the functional area level with overall weighted analysis revealed a reduction in the mean SA of LO (β (SE): –20.246 (8.640), p = 0.019) due to genetic predicted hypothyroidism (inc_TSH) and an increase in the mean SA of lateral orbitofrontal gyri (LOF), medial orbitofrontal gyri (MOF) and superior frontal gyrus (SFG). The consistency in the direction of this association was affirmed by MR-Egger, weighted median method, simple mode, and weighted mode methods. Moreover, the weighted median method also exhibited similar significance for the association of inc_TSH and the SA of MOF. Regarding genetic predicted hyperthyroidism (dec_TSH), the IVW model presented a reduction in the mean SA of PO and the mean thickness of posterior cingulate cortex (PCC). The weighted median method corroborated this significance. The consistency in the data, particular for the directionality of association was affirmed through MR-Egger, simple mode and weighted mode methods. No significant horizontal pleiotropy (all p > 0.05) was detected for the reported significant causalities as was analyzed through MR-Egger intercept test, the MR-PRESSO test and Cochran’s Q test. The leave-one-out analyses also confirmed that no SNP could significantly influence the causal estimates.
Examination of horizontal pleiotropy for 6 distinct outcomes
Table 1 displays the examination of horizontal pleiotropy for 6 distinct outcomes linked to FT4 and TSH levels. The Egger intercept for cuneus_SA was –0.6405, with an standard error (SE) of 2.294 and a p-value of 0.794. The observed residual sum of squares (RSS) for the MR-PRESSO global test was 9.86, with a p-value of 0.293. Additionally, the p-value for Cochran’s Q test was 0.1619. The lingual_SA had an Egger intercept value of –0.1138, with SE of 17.21 and a p-value of 0.665. The observed RSS for the MR-PRESSO global test was 3.134, with a p-value of 0.836. Additionally, the p-value for Cochran’s Q test was 0.0264. The value of the Egger intercept for superior frontal pole thickness was –0.0072, with SE of 0.007 and a p-value of 0.361. The observed RSS for the MR-PRESSO global test was 10.150, with a p-value of 0.223. Additionally, the p-value for Cochran’s Q test was 0.078.
The lateral occipital pole thickness value for men had an Egger intercept of –0.0001 with SE of 0.00106 and a p-value of 0.924. The observed RSS for the MR-PRESSO global test was 2.753 with a p-value of 0.431. Additionally, the p-value for Cochran’s Q test was 0.2546. The lateral occipital pole thickness in women had an Egger intercept of –0.00011, with SE of 0.00104 and a p-value of 0.919. The observed RSS for the MR-PRESSO global test was 7.1135, with a p-value of 0.491. Additionally, the p-value for Cochran’s Q test was 0.29154. The temporal pole thickness in women had an Egger intercept value of –0.00349, with SE of 0.00267 and a p-value of 0.324. The observed RSS for the MR-PRESSO global test was 10.542, with a p-value of 0.413. Additionally, the p-value for Cochran’s Q test was 0.634.
R2_F statistics for single nucleotide polymorphisms
Table 2 presents the R2_F statistics for various SNPs associated with 6 different outcomes related to FT4 and TSH levels. The IVW test computed odds ratios (ORs) for different brain regions (Table 3). The estimated OR for cuneus_SA was 1.147 (with a 95% confidence interval (95% CI) of 1.045–1.457) and a p-value of 0.008. The OR for lingual_SA was calculated to be 1.124 (95% CI: 1.027–1.241), and the p-value associated with this finding was 0.003. The OR for superior frontal thickness was 1.054 (1.004–1.147), and the p-value was 0.002. The OR for lateral occipital _ thickness in men was found to be 1.122 (1.031–1.234), with a p-value of 0.001. The OR for lateral occipital thickness in women was found to be 1.078 (1.005–1.161), accompanied by a p-value of 0.003. Finally, for women, the OR for temporal pole thickness was 1.114 (1.031–1.248) with a p-value of 0.001. Cochran’s Q-test was utilized to assess horizontal multiplicity and to obtain more robust association estimates. The analysis revealed no evidence of horizontal multiplicity, as all p-values for the MR-Egger intercept test exceeded 0.05. Indeed, all p-values from Cochran’s Q analysis were greater than 0.05.
Leave-one-out analyses
Sensitivity analyses are crucial in MR studies to assess the robustness and reliability of causal estimates, identifying potential biases, outliers or assumption violations. These analyses, including leave-one-out, influence, bootstrap, and robustness checks, increase confidence in findings and provide insight into underlying biological mechanisms. Sensitivity analyses, particularly leave-one-out tests, revealed that SNP (rs2235544) substantially influenced the MR estimates for FT4_women on temporal pole and LO thickness, as well as FT4_men on LO thickness in this study. Notably, removing this SNP (rs2235544) resolved the causal effects, underscoring the importance of sensitivity analyses in MR studies to identify and address potential outliers and biases. In contrast, other estimates remained robust across all SNPs. Importantly, this study highlights the necessity of rigorous sensitivity testing to ensure reliable causal inference. Moreover, our findings emphasize that normal-range thyroid function does not have a discernible causal effect on global brain cortex thickness or SA, suggesting region-specific effects of THs on brain structure. These results underscore the value of comprehensive sensitivity analyses in MR studies to validate and refine causal relationships.
Our analysis exhibits several notable strengths, ensuring robust and reliable findings. With a substantial sample size, we achieved sufficient statistical power, exceeding 80%, to detect moderate effects. Rigorous multiple testing corrections via Bonferroni adjustment minimized false positives. Leveraging MR, we established causal inference using genetic instruments. Comprehensive sensitivity analyses verified the stability of estimates, and our region-specific examination uncovered novel associations between THs effects and brain structure. These methodological strengths collectively enhance confidence in our findings, providing valuable insights into the complex relationship between thyroid function and brain anatomy. The findings of present MR analysis reveal a causal link between thyroid function and cortical structure, impacting cognitive and emotional processing. Thyroid malfunction, particularly hypothyroidism, alters SA and thickness in brain regions responsible for emotional regulation, cognitive processing and sensory processing, underscoring TH crucial role in maintaining optimal brain health.
Discussion
Although certain observational studies indicate a potential link between thyroid function and the structure of the cerebral cortex, the definitive causal relationship remains to be determined. The advent of GWAS data has enabled the analysis of genetic factors for their potential links to alterations in brain structure, psychological disorders and TH levels. Recent studies indicate that hypothyroidism may lead to a reduction in gray matter; however, there is still no thorough analysis on this subject.41, 42 This report represents a pioneering investigation that employs MR to elucidate the data concerning the causal relationship between thyroid function and the structure of the cerebral cortex. This includes 34 cortical regions regarding SA and thickness. The findings indicate that the TH or SA of the cortex in particular brain regions linked to cognitive and psychological functions is affected by the characteristics of thyroid function, with no evidence of pleiotropy or heterogeneity.
The entorhinal cortex (EC), situated in the medial temporal lobe, is primarily associated with the regulation of episodic memory; however, its role encompasses functions that go beyond merely facilitating spatial navigation.43 The stimulation has a beneficial impact on memory and learning processes.44
This study investigated a gender-independent positive correlation between FT4 and the thickness of the EC within the normal reference range, suggesting that THs plays a critical role in a variety of brain functions. The influence of AD on EC has been documented in the preclinical stages of the disease.45, 46, 47 Meanwhile; thyroid function has been identified as a critical factor in the pathological progression of AD even within the normal range. Consequently, it is possible to infer that the modulation of EC thickness by THs has an impact on cognitive functions that are involved in the onset and progression of AD.48
The cACC serves as a vital neural structure located in the medial prefrontal cortex and plays a significant role in cognitive control, goal-directed cognition and emotional responses.49 Consequently, the discovery of a positive correlation between the TH of the cACC and the level of TSH_men holds considerable importance.49 Research has identified a diminished cACC volume in both schizophrenia and autism spectrum disorder (ASD). Consequently, further investigation is essential to clarify the specific role of elevated TSH levels within the normal range in alleviating the symptoms associated with ASD, schizophrenia and depression.50, 51
The PCC experiences thinning due to a decrease in TSH (dec_TSH), which plays a crucial role in the encoding of episodic memory and self-spatial orientation.52, 53, 54 The PCC has been linked to numerous psychiatric disorders, including schizophrenia, autism, depression, and attention deficit hyperactivity disorder (ADHD), via metabolic abnormalities, functional connectivity challenges and volumetric atrophy.55, 56, 57, 58, 59, 60 Therefore, it is plausible that the structural atrophy of the PCC could be associated with the psychiatric disorders seen in individuals with hyperthyroidism.
The observation in this study that inc_TSH results in an increase in the SA of the cortical region of the SFG without a significant impact on its thickness is incongruous with observational studies that have reported a decrease in the volume of the SFG in such patients. The superior frontal gyrus, which is situated in the upper portion of the frontal lobe cortex, is comprised of Brodmann areas 6, 8, 9, and 32.61 It is intricately involved in a variety of cognitive functions and motor control tasks, including attention, working memory, cognitive control, and emotional regulation.62 The SFG also plays a role in psychiatric disorders associated with self-consciousness, introspection and self-awareness.62 However, this observed correlation suggests that the SA of the SFG region may be influenced by genetically predicted hypothyroidism, underscoring the intricate relationship between brain morphology and thyroid function. This study also observed a decrease in the SA of the PO as a result of hypothyroidism, in addition to SFG. The PO is predominantly involved in language production,63 lexical selection, phonological processing, and speech encoding.64, 65, 66 Negative changes in PO have been linked to decreased verbal fluency in individuals experiencing normal aging,67 those with schizophrenia,68 and patients with AD.69 Moreover, the volume of this region is reduced in healthy young individuals exhibiting heightened anxiety levels.70 As a result, this finding suggests that hyperthyroidism could play a role in the deficits observed in advanced language functions and emotional regulation due to a reduction in the TH of the PO.
The medial orbitofrontal cortex (mOFC) and the lateral orbitofrontal cortex (lOFC) are 2 distinct regions of the orbitofrontal cortex (OFC). Our study found that hypothyroidism increased cortical SA in the mOFC and lOFC. Damage to the lOFC can disrupt credit allocation in the value learning process, while damage to the mOFC can impede value-oriented decision-making.71 A recent MR analysis72 that links thyroid function and schizophrenia can also be interpreted as a reduction in the mOFC volume in adolescents at familial risk for schizophrenia. This suggests that hypothyroidism may mitigate the risk of developing schizophrenia. Additionally, the GMV in the lOFC has been reduced in patients with depression,73, 74 including school-aged children.75 Our results indicate a potential inverse relationship between hypothyroidism and depression. In contrast, hypothyroidism has been linked to an elevated incidence of depression in observational studies. As a result, a comprehensive examination is necessary to uncover this correlation. Similarly, patients with obsessive-compulsive disorder, generalized anxiety disorder and ASD have been observed to have expanded OFC SA, reduced mOFC SA and decreased OFC SA, respectively.76, 77, 78, 79 Therefore, comprehending the function of TSH in these conditions would provide a new perspective on the management of these disorders.
In the context of neurodevelopment and neuropsychiatric conditions, the observation made in this study regarding a positive correlation between normal-range TSH levels in men and increased thickness in the cuneus region, while hypothyroidism reduced the SA of the LO cortex, is of particular interest. The cuneus is involved in primary visual processing, which encompasses the interpretation of visual field inputs, face recognition, complex affective expression processing, and visual imagery.80 The LO cortex is essential for the identification of fundamental features of external objects and extends its capabilities to more complex cognitive tasks.81, 82, 83, 84, 85 The LO and cuneus regions have been observed to exhibit reductions in both functional activity and SA in children with ASD.86 Similarly, patients with bipolar disorder show a significant reduction in the bilateral SA of the cuneus.87 In a bidirectional MR study,88 the diminished cuneus thickness was also discovered to be associated with an increased risk of AD. Consequently, the results of the present study have exacerbated a complex yet substantial correlation between thyroid function and the emergence of a variety of neuropsychiatric disorders.
It is important to highlight that our study did not find a relationship between the SA of 34 brain regions or the overall cerebral cortex and normal-range thyroid function. This suggests that thyroid function primarily affects the thickness of the cerebral cortex within the normal reference range. Nonetheless, SA of the cerebral cortex is the main focus when considering hypo- or hyperthyroidism. It is crucial to acknowledge that cortical TH and SA serve as 2 relatively independent morphological indicators within the structure of the cerebral cortex.89 As a result, they are shaped by unique genetic influences and pursue different developmental paths.90 As a result, the same exposure factor might not produce a simultaneous or symmetrical effect on both indicators. There is evidence to suggest that thyroid function may have an impact on cerebral blood flow and metabolism. Hypothyroidism can lead to reduced cerebral blood flow in various areas, such as the cuneus and the anterior cingulate cortex.91 Conversely, metabolic irregularities within the limbic lobe may stem from hyperthyroidism.92 Our MR analysis incorporated stringent quality control protocols, encompassing data cleaning, outlier elimination and validation of genetic instruments. We conducted an evaluation of potential biases via sensitivity analyses, examining for pleiotropy and population stratification. Additionally, we utilized IVW and Egger regression to assess causal estimates, thereby ensuring resilience against horizontal pleiotropy and heterogeneity. The implementation of these measures effectively reduced biases, thereby increasing confidence in our findings and confirming the causal relationships between thyroid function and brain anatomy.
Thyroid hormone influences brain regions by interacting with its receptors in essential areas such as the cingulate gyrus, hippocampus and amygdala.92 An investigation into the human limbic system carried out through autopsy revealed the existence of TSH receptors in neurons.93 This finding suggests that variations in FT4 and TSH levels may influence metabolism in this region, resulting in structural alterations. Thyroid hormones play a crucial role in shaping neural development, differentiation and functionality in areas such as the EC, caudal anterior cingulate and cuneus gyri. They regulate neuroplasticity, synaptic function, and neurotrophic factors, such as brain-derived neurotrophic factor (BDNF) and nerve growth factor (NGF), crucial for cognitive processes and emotional regulation. Alterations in TH levels impact neural circuit structure and function, affecting gene expression, axonal growth and synaptic transmission. Thyroid hormones also modulate neurotransmitter systems, including serotonin, dopamine and gamma-aminobutyric acid (GABA), influencing mood and cognition.94, 95, 96, 97
Existing literature emphasizes the importance of THs in neuronal survival, synaptogenesis and neuronal connectivity, shedding light on the mechanisms that explain the noted relationships between thyroid function and brain structure. The relationship between thyroid function and brain structure carries important clinical implications, indicating that thyroid disorders could play a role in neurodegenerative diseases, cognitive decline and mood disorders. Future studies should explore the neuroprotective effects of THs, optimal treatment strategies and biomarkers for early detection.94 Possible clinical applications encompass tailored TH therapy, neuroprotective strategies and innovative approaches for AD, depression and anxiety disorders. Recent MR-based studies have uncovered a link between obesity, sleep disorders and cortical structure. The thickness and SA of certain cortical regions can be affected by these conditions.98, 99 Individuals with hypothyroidism often face an increased risk of obesity and sleep disorders.100 Therefore, it is essential to conduct additional inquiries into the interactive effects of these factors. Future studies on genetically determined thyroid function and cerebral cortex structure should concentrate on exploring the mechanisms that influence the effects of THs on neurogenesis, synaptogenesis and neuronal plasticity. Furthermore, investigating connections with cognitive decline, mood disorders and neurodegenerative diseases will be essential. Longitudinal studies will investigate the impact of thyroid function on brain development and maturation, while genetic and epigenetic analyses will assist in identifying regulatory variants. Investigations will also focus on therapeutic strategies, including hormone supplementation, for addressing thyroid-related brain health issues. Through the integration of knowledge from various fields such as endocrinology, neuroscience, genetics and epidemiology, these studies seek to clarify intricate relationships and enhance clinical practice, with the ultimate goal of advancing brain health outcomes.
Limitations
This investigation is subject to certain limitations. Primarily, the GWAS data used in this research was derived from European populations. Consequently, the applicability of these findings to other ethnic groups should be approached with caution. Second, the absence of age information in the GWAS data is a significant limitation, as age is a crucial factor influencing both thyroid function and brain structure. Furthermore, the objective of this investigation was to investigate the causal relationship between thyroid function and cortical structure by employing specific metrics, including volume, thickness, SA, and gyrification index. A broader array of indicators could be incorporated into comprehensive studies to further investigate the correlation between brain structure and thyroid function. However, these approaches have certain limitations as well such as MR-Egger assumes instrumental variable independence, potentially leading to biased estimates if pleiotropy exists. Similarly, weighted median methods can be sensitive to outliers and may not perform well with weak instruments or non-causal associations. Additionally, both methods assume linear relationships, potentially masking non-linear effects. Moreover, MR findings should be interpreted cautiously due to limitations, including potential unmeasured confounding variables, pleiotropy and population stratification. Additionally, MR assumes a linear relationship between genetic variants and outcomes, and instrumental variable validity relies on strong assumptions. These limitations may bias or distort causal estimates. It is important to consider the possibility that the exposed and outcome groups may overlap in the 2-sample MR analysis. This overlap could introduce bias into the results, potentially affecting the conclusions.
Conclusions
This innovative MR analysis investigated the causal relationship between thyroid function and cortical structure. The results demonstrate that thyroid dysfunction, especially hypothyroidism, affects the SA of various cortical regions linked to mental and emotional processing. Moreover, optimal thyroid function significantly impacts the thickness of brain regions intricately linked to cognitive function, including the EC. This study provides new evidence that highlights the link between thyroid function and cognitive abilities, along with mental and psychological health. Furthermore, it offers valuable insights into improving the management of related conditions. However, additional studies are needed to validate the relationship between thyroid function and brain structure.
Ethics statement
The dataset mentioned above were all publicly available. The corresponding inform consents from participants were received in the original research. Thus, no ethics was required for our study.
Data availability statement
The thyroid function datasets studied in this study are accessible through the GWAS Public database (Datasets – The ThyroidOmics Consortium (https://www.uni-greifswald.de)). The datasets evaluated in the current study of the human cerebral cortex are available on the ENIGMA Consortium website (https://enigma.ini.usc.edu/research/download-enigma-gwas-results).
Consent for publication
Not applicable.
Use of AI and AI-assisted technologies
Not applicable.