Abstract
Background. Hepatic stellate cell (HSC) activation is a critical factor in the development of liver fibrosis. Recent research indicates that mesoderm/mesenchyme homeobox 1 (Meox1) contributes to fibrosis in organs like the skin and heart.
Objectives. To investigate the potential impact of Meox1 on HSC activation and provide an available target for hepatic fibrosis research.
Materials and methods. The human HSC cell line LX-2 was utilized to investigate the role of Meox1 in HSC activation. Fibrotic gene expression was analyzed, and assays were conducted to assess cell proliferation, migration and the cell cycle.
Results. Meox1 was identified as a positive regulator of HSC activation. We found that transforming growth factor-β1 (TGF-β1) treatment significantly upregulated Meox1 expression in a dose-dependent manner in LX-2 cells, and the expression levels of α-smooth muscle actin (α-SMA), collagen type I (collagen-I) and matrix metalloproteinase-2 (MMP-2) also increased progressively with higher concentrations of TGF-β1. Knockdown of Meox1 via small interfering RNA (siRNA) inhibited TGF-β1-induced expression of HSC activation markers and fibrotic genes, including α-SMA, collagen-I and MMP-2. Conversely, Meox1 overexpression promoted HSC activation, evidenced by increased levels of α-SMA, collagen-I and MMP-2. Meanwhile, Meox1 overexpression accelerated cell proliferation and enhanced cell migration. Additionally, forced expression of Meox1 in LX-2 cells elevated Smad3 phosphorylation level, although TGF-β1 and total Smad3 protein levels remained unchanged. Furthermore, we observed that Meox1 could induce a redistribution of the cell population, extending the G1 phase, and that Meox1-upregulated p21CIP1/WAF1 expression in LX-2 cells was independent of p53.
Conclusions. Our findings suggest that Meox1 plays a pivotal role in HSC activation and may be involved in the canonical TGF-β1/Smad pathway.
Key words: transforming growth factor-β1, fibrosis, Smad3, hepatic stellate cell, mesoderm/mesenchyme homeobox l
Background
Liver fibrosis is a common pathological change seen in various chronic hepatic diseases, including alcoholic liver disease, nonalcoholic steatohepatitis (NASH), chronic hepatitis C virus (HCV), and hepatitis B virus (HBV) infections, as well as autoimmune diseases. These conditions can ultimately progress to cirrhosis and hepatocellular carcinoma (HCC).1, 2, 3, 4 A defining feature of liver fibrosis is the extensive accumulation of extracellular matrix (ECM), which is continuously synthesized by myofibroblasts, leading to abnormal connective tissue proliferation. Recent studies have identified activated hepatic stellate cells (HSCs) as the primary source of myofibroblasts, highlighting their crucial role in liver fibrosis.5, 6, 7
Hepatic stellate cells (HSCs) constitute about 1/3 of the liver’s nonparenchymal cells.6, 7, 8, 9 When the liver is subjected to pathological stimuli, quiescent HSCs become activated and differentiate into myofibroblasts, producing ECM to aid tissue regeneration during wound healing. However, prolonged HSC activation disrupts the balance between ECM synthesis and degradation, leading to excessive accumulation of ECM components such as collagen type I (collagen-I), tissue inhibitors of metalloproteinases (TIMPs) and matrix metalloproteinases (MMPs). This imbalance contributes to liver fibrosis and organ dysfunction. Inhibiting HSC activation may help alleviate liver fibrosis.10, 11, 12, 13, 14 Therefore, investigating the molecular mechanisms of HSC activation is crucial for understanding liver fibrosis and identifying potential therapeutic targets to reverse this process.
Mesoderm/mesenchyme homeobox 1 (Meox1) is a member of the homeobox transcription factor subfamily.15, 16, 17 Previous research has demonstrated that Meox1 is essential for organ and cell differentiation during embryonic development, including somite differentiation,18 axial skeleton formation,19, 20 and the development of muscles21, 22 and blood vessels.23, 24 In pathological conditions, Meox1 plays a role in tissue repair, such as neointima formation following vascular injury25 and osteoblastic differentiation in skeletal diseases.26
Recent studies have increasingly focused on the role of Meox1 in the pathogenesis of organ fibrosis. In the skin, Meox1 significantly enhances the proliferation and migration of human dermal fibroblasts and contributes to hypertrophic scar formation in burn patients.27, 28 In vascular diseases, Meox1 induces endothelial cell senescence, promoting atherosclerosis progression,29 and is upregulated in arterial smooth muscle cells following balloon injury, driving their phenotypic transformation and pathological vascular remodeling.30 In the heart, Meox1 expression is markedly increased in hypertrophic cardiomyopathy patients and accelerates hypertrophy decompensation through interaction with the transcriptional target gene GATA4.31 Furthermore, a recent study identified Meox1 as a central regulator in the transition from fibroblasts to profibrotic myofibroblasts in myocardial fibrosis, essential for TGF-β-induced fibroblast activation.32 Additionally, Meox1 is upregulated in lung tissue of idiopathic pulmonary fibrosis patients.33 However, the role of Meox1 in hepatic stellate cell (HSC) activation and its relationship with liver fibrosis remain largely unexplored.
LX-2 cells, an immortalized human hepatic stellate cell line, exhibit typical characteristics of primary HSCs, including expression of glial acidic fibrillary protein and desmin, and responsiveness to platelet-derived growth factor BB and transforming growth factor-β (TGF-β), making them ideal for studying liver fibrosis.34 In this study, we not only evaluated the expression level of Meox1 in TGF-β1-induced LX-2 cells and observed the role of Meox1 in regulating HSC activation, but also tentatively explored the potential mechanism of Meox1-orchestrated HSC activation.
Objectives
The aim of this study was to investigate the potential impact of Meox1 on HSC activation and provide an available target for hepatic fibrosis research.
Materials and methods
Data sources/measurement
Cell culture and reagent
The LX-2 cell lines (Procell CL-0560; Procell Life Science & Technology Co., Ltd., Wuhan, China) were authenticated via short tandem repeat (STR) profiling. Cells were cultured in Dulbecco’s modified Eagle’s medium (DMEM; Thermo Fisher Scientific, Waltham, USA) supplemented with 10% fetal bovine serum (FBS; Lanzhou Minhai Bio-Engineering Co., Ltd., Gansu, China) at 37°C in a humidified atmosphere with 5% CO2. TGF-β1 (ab50036; Abcam, Cambridge, UK) was stored at –20°C. For TGF-β1 stimulation experiments, cells were starved overnight and then treated with increasing concentrations of TGF-β1 (0, 0.5, 1, 5, 10, and 20 ng/mL) for 72 h to collect protein.12, 27, 35
The full-length peptide coding sequence of homo sapiens Meox1 was synthesized by Sangon Biological Engineering Technology & Services Co., Ltd. (Shanghai, China) and inserted into the multiple cloning sites of pCDNA3.1(+) to generate the expression plasmid pcDNA3.1-Meox1. LX2-Meox1 cell lines were established by stable transfection of pcDNA3.1-Meox1 into LX-2 cells using hygromycin B selection. Plasmid transfection was performed using Lipofectamine™ 3000 reagent according to the manufacturer’s instructions (Invitrogen, Thermo Fisher Scientific, Waltham, USA).
Study design and setting
RNA interference
For Meox1 inhibition experiments, LX-2 cells were transfected with either Meox1-specific small interfering RNA (siRNA) or a negative control using Lipofectamine RNAiMAX reagent, following the manufacturer’s instructions (Invitrogen, Thermo Fisher Scientific). The siRNAs were synthesized by Genepharma Co., Ltd. (Shanghai, China). The sequence for the negative control siRNA was:
5’-TTC TCC GAA CGT GTC ACG TTT-3’ (sense) and
5’-ACG TGA CAC GTT CGG AGA ATT-3’ (antisense).
The sequence for Meox1-specific siRNA was:
5’-CTG CCA ATG AGA CAG AGA ATT-3’ (sense) and
5’-TTC TCT GTC TCA TTG GCA GTT-3’ (antisense).27
RT-qPCR
Total RNA was extracted from the cells using TRIzol Reagent following the manufacturer’s instructions (TaKaRa, Otsu, Japan). Reverse transcription was then performed using the PrimeScript™ RT reagent kit according to the manufacturer’s protocol (TaKaRa). Quantitative reverse transcription polymerase chain reaction (RT-qPCR) was performed using the TB Green® Premix Ex Taq™ II kit (TaKaRa) on a QuantStudio 5 Real-Time PCR System (Applied Biosystems, Thermo Fisher Scientific, Waltham, USA). All primers were synthesized by Sangon. The primer sequences used were as follows:
α-SMA forward
5′-CTTCGTTACTACTGCTGAGCGTGAG-3′,
α-SMA reverse
5′-CCCATCAGGCAACTCGTAACTCTTC-3′,
collagen-1(1A1) forward
5′-TGATCGTGGTGAGACTGGTCCTG-3′,
collagen-1(1A1) reverse
5′-CTTTATGCCTCTGTCGCCCTGTTC-3′,
MMP-2 forward
5′-CACCTACACCAAGAACTTCCGTCTG-3′,
MMP-2 reverse
5′-GTGCCAAGGTCAATGTCAGGAGAG-3′,
TGF-β1 forward
5′-TACAGCAACAATTCCTGGCGATACC-3′,
TGF-β1 reverse
5′-CTCAACCACTGCCGCACAACTC-3′,
Meox-1 forward
5′-AAGGATGAAGTGGAAGCGTGTGAAG-3′,
Meox-1 reverse
5′-TCTGAACTTGGAGAGGCTGTGGAG-3′,
The GAPDH internal reference primer was purchased from Sangon (B661104-0001).
Western blotting
Cellular total protein extraction utilized radioimmunoprecipitation assay (RIPA) lysis buffer (Solarbio, Beijing, China) supplemented with freshly added phenylmethylsulfonyl fluoride (PMSF) and a protein phosphatase inhibitor (Solarbio). Protein concentrations were determined using a bicinchoninic acid (BCA) protein assay kit (Solarbio). Equal amounts of protein were separated by sodium dodecyl sulfate‒polyacrylamide gel electrophoresis (SDS-PAGE) and transferred onto nitrocellulose or polyvinylidene difluoride (PVDF) membranes (Millipore, Bedford, USA), each blocked with 5% bovine serum album (BSA) or 5% nonfat dry milk.
Primary antibodies included: anti-Meox1 (1:1,000, ab105349; Abcam), anti-α-SMA (1:500, ab5694; Abcam), anti-collagen-I (1:2,000, 66761-1-Ig; Proteintech, Chicago, USA), anti-MMP-2 (1:1,000, 66366-1-Ig; Proteintech), anti-TGF-β1 (1:1,000, 21898-1-AP; Proteintech), anti-Smad3 (1:1,000, 66516-1-Ig; Proteintech), anti-phospho-Smad3 (1:1,000, 9520T; Cell Signaling Technology (CST), Danvers, USA), anti-p53 (1:5,000, 60283-2-Ig; Proteintech), anti-p21 (1:1,000, 10355-1-AP; Proteintech), anti-p16 (1:2,000, 10883-1-AP; Proteintech), and anti-GAPDH (1:10,000, ab181602; Abcam).
Due to the host of primary antibodies, including anti-Meox1 (1:1,000, ab105349; Abcam), anti-α-SMA (1:500, ab5694; Abcam), anti-TGF-β1 (1:1,000, 21898-1-AP; Proteintech), anti-phospho-Smad3 (1:1,000, 9520T; CST), anti-p21 (1:1,000, 10355-1-AP; Proteintech), anti-p16 (1:2,000, 10883-1-AP; Proteintech), and anti-GAPDH (1:10,000, ab181602; Abcam), was rabbit, we performed western blotting utilized horseradish peroxidase (HRP)-conjugated AffiniPure goat anti-rabbit IgG (H+L) (1:5,000, SA00001-2; Proteintech) as secondary antibodies.
Due to the host of primary antibodies, including anti-collagen-I (1:2,000, 66761-1-Ig; Proteintech), anti-MMP-2 (1:1,000, 66366-1-Ig; Proteintech), anti-Smad3 (1:1,000, 66516-1-Ig; Proteintech), and anti-p53 (1:5,000, 60283-2-Ig; Proteintech), was mouse, we performed western blotting utilizing HRP-conjugated AffiniPure goat anti-mouse IgG (H + L) (1:5,000; SA00001-1; Proteintech) as secondary antibodies.
Protein expression levels were visualized using an enhanced chemiluminescence (ECL) kit (New Cell & Molecular Biotech Co., Ltd., Suzhou, China) and imaged with the ChemiDocTM Touch imaging system (Thermo Fisher Scientific).
Cell proliferation assay
Cell Counting Kit-8 (CCK-8; Dojindo Lab, Kumamoto, Japan) was used to assess cell proliferation. Cell lines in the logarithmic growth phase were resuspended and seeded into 96-well plates at a density of 1 × 10³ cells/well. At designated time points (0, 24, 48, 72, and 96 h), 10 mL of CCK-8 solution was added to each well, followed by a 2-h incubation at 37°C in a 5% CO2 humidified atmosphere. Optical density (OD) at 450 nm was measured every 24 h using a microplate reader (Bio-Tek Instruments, Winooski, USA).
Cell migration assay
Transwell chambers with 8-micrometer polycarbonate filters (Corning Company, Corning, USA) were used for the cell migration assay. Cell lines in the logarithmic growth phase were resuspended in serum-free DMEM and seeded into the Transwell upper chamber at a density of 1 × 10⁴ cells/well. Then, 600 μL of DMEM containing 10% FBS was added to the Transwell lower chamber. After a 24-h incubation period, the filters were fixed with methyl alcohol for 1 h and stained with 0.5% crystal violet for 20 min. Stained cells were observed and photographed under an inverted microscope (model DMI6000 B; Leica Camera AG, Wetzlar, Germany) in 5 randomly selected fields (including 1 each from the upper, lower, central, left, and right positions) at ×100 magnification. Subsequently, ImageJ v. 1.8.0 (National Institutes of Health (NIH), Bethesda, USA) was used for cell counting.
Flow cytometry assay
Flow cytometry was used to analyze the cell cycle using the Cell Cycle Assay Kit Plus (C6078; Shanghai Bioscience Technology Co. Ltd., Shanghai, China), following the manufacturer’s instructions. Cells were collected during the logarithmic growth phase, washed twice with pre-cooled PBS, and then resuspended in approx. 1 mL of pre-cooled staining buffer to prepare a single-cell suspension.
The single-cell suspension was mixed with 1 mL of pre-cooled 75% ethanol and stored at –20°C overnight for fixation. After incubation, cells were collected and resuspended in 1 mL of PBS. Then, 4 μL of RedNucleus I staining solution was added to each tube, mixed gently and thoroughly and incubated at room temperature in the dark for 20 min. Following staining, the cell suspension was filtered through a nylon mesh into a flow cytometry tube.
Flow cytometry assays were conducted using a fluorescence-activated cell sorting (FACS) Aria II flow cytometer (BD Biosciences, Pharmingen, San Diego, USA).
Statistical analyses
Statistical analysis was conducted using IBM SPSS software v. 26.0 (IBM Corp., Armonk, USA) and R v. 4.4.2 (R Foundation for Statistical Computing, Vienna, Austria). Each experiment (RT-qPCR, western blotting, cell proliferation, cell migration, and flow cytometry assay) was performed in triplicate. Medians (1st and 3rd quartile; Q1–Q3) was used to represent the values. For small samples, testing for normality was not feasible with sufficient reliability; therefore, a nonparametric test was used. The nonparametric Mann–Whitney U test and Kruskal–Wallis H test with Dunn’s post hoc tests were utilised for examining the data as appropriate. For comparisons between the 2 groups, we utilized the nonparametric Mann–Whitney U test. For comparisons involving more than 2 groups, we utilized the Kruskal–Wallis H test with Dunn’s post hoc tests, with significance values adjusted using the Bonferroni correction for multiple testing. In the case of repetition measurements, differences in characteristics between groups were analyzed using the ARTool package in R.36, 37 All comparisons were 2-tailed, with statistical significance set at p < 0.05.
Results
Meox1 was upregulated in TGFβ1-induced HSC activation
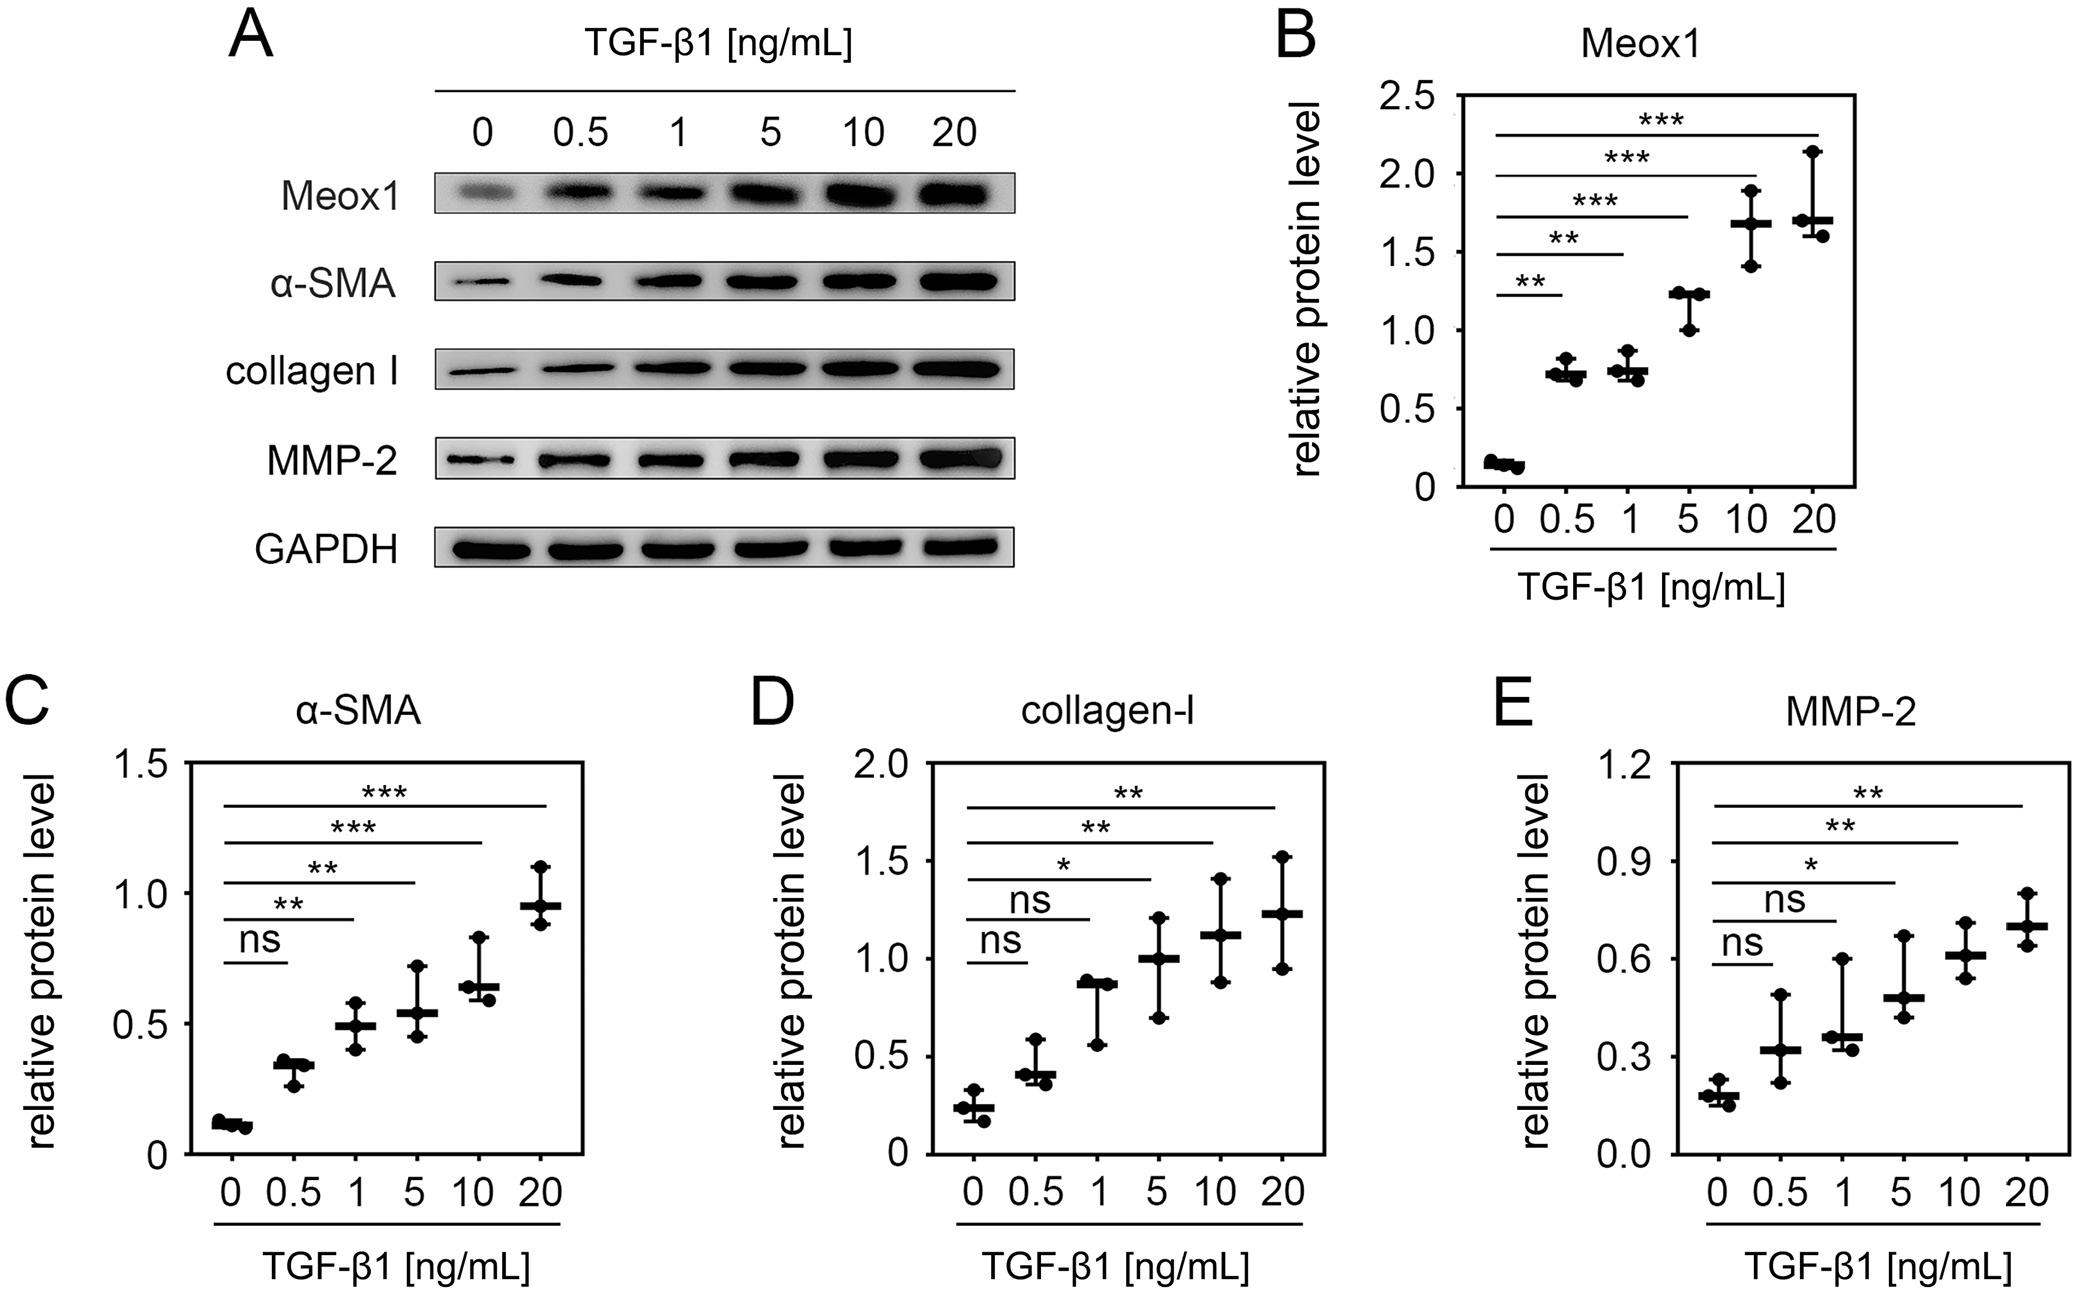
To determine if Meox1 was upregulated in activated HSCs, we used LX-2 cells, a commonly employed model for studying fibrogenesis and HSC activation.34 Transforming growth factor-β1 is well known for inducing HSC activation.9, 38, 39, 40 Therefore, we examined the effect of TGF-β1 on Meox1 expression in LX-2 cells. Treating the cells with increasing concentrations of TGF-β1 resulted in a dose-dependent upregulation of Meox1, with significant increases observed at concentrations up to 10 ng/mL (Figure 1A,B). We also evaluated the expression levels of HSC activation markers and fibrosis-related factors in TGF-β1-treated LX-2 cells. Consistent with previous reports,12, 35, 41, 42 the expression levels of α-smooth muscle actin (α-SMA) (Figure 1A,C), collagen-I (Figure 1A,D) and MMP-2 (Figure 1A,E) increased progressively with higher concentrations of TGF-β1. These results indicate that Meox1 is induced during HSC activation.
Meox1 was essential for TGFβ1-induced HSC activation
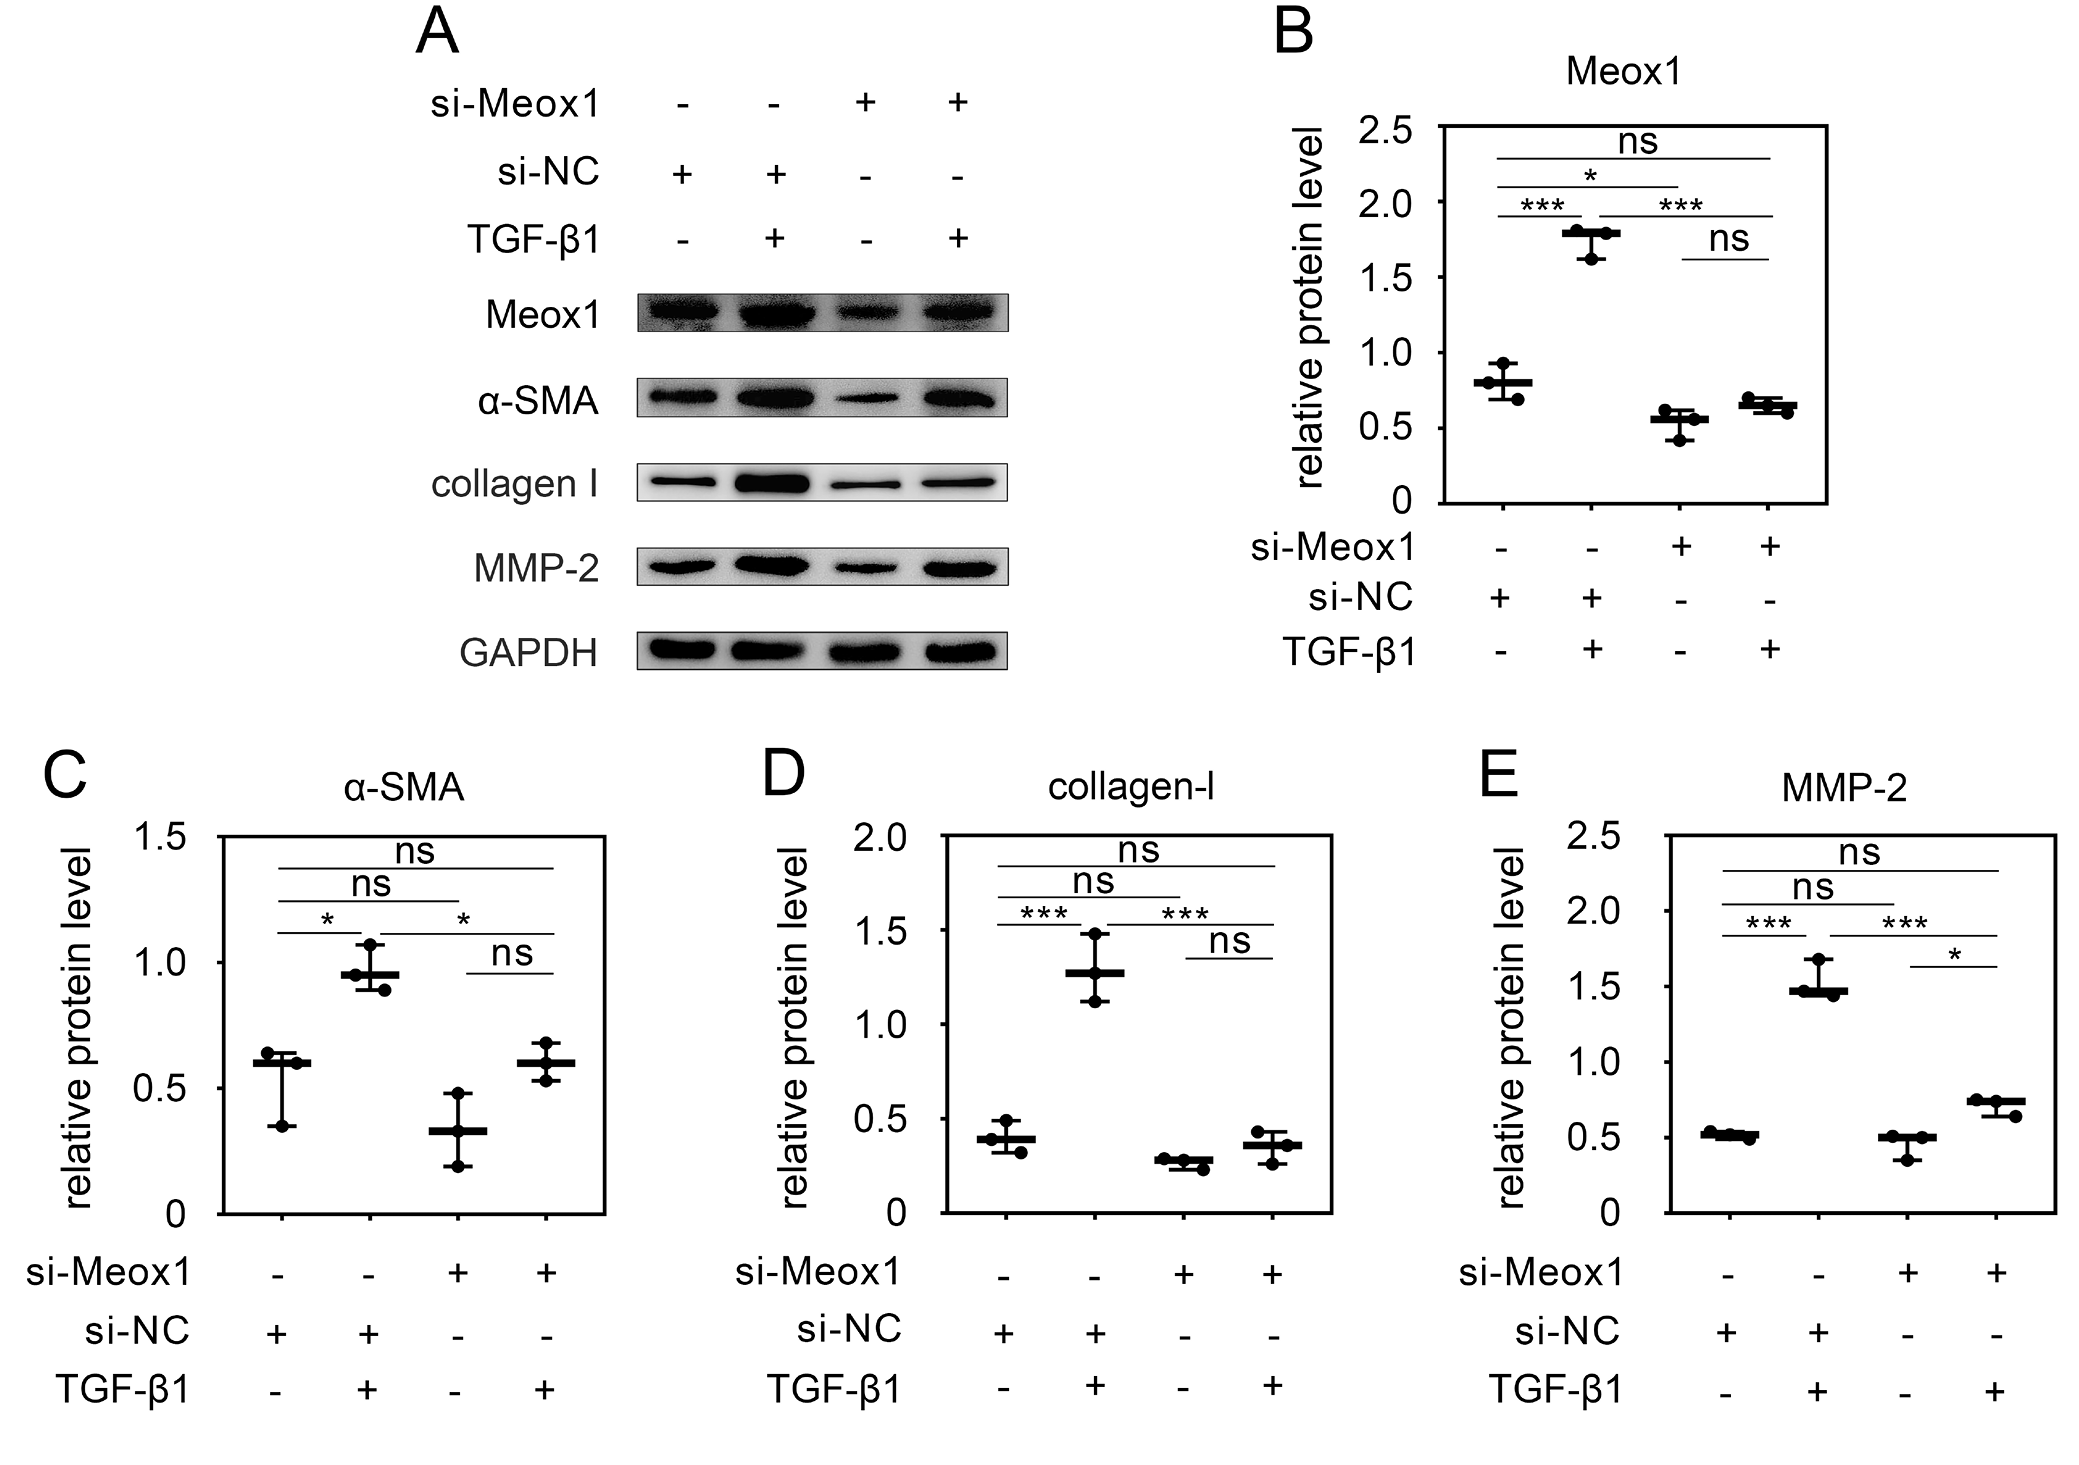
To further investigate the role of Meox1 in TGF-β1-stimulated HSC activation, we knocked down Meox1 in LX-2 cells using specific siRNA (si-Meox1). As shown in Figure 2A,B, TGF-β1 stimulation increased the expression of Meox1 and HSC activation markers. However, Meox1 expression was significantly reduced by its specific siRNA. Upon Meox1 knockdown, the expression of TGF-β1-induced HSC activation markers, including α-SMA (Figure 2A,C), collagen-I (Figure 2A,D) and MMP-2 (Figure 2A,E), was significantly reduced.
Notably, Meox1 knockdown also reduced the expression of these markers at the basal level, without TGF-β1 stimulation. These findings confirm that TGF-β1 enhances the expression of HSC activation markers and that this activation can be inhibited by Meox1 knockdown, suggesting that Meox1 is essential for TGF-β1-induced HSC activation.
Overexpression of Meox1 promoted HSC activation
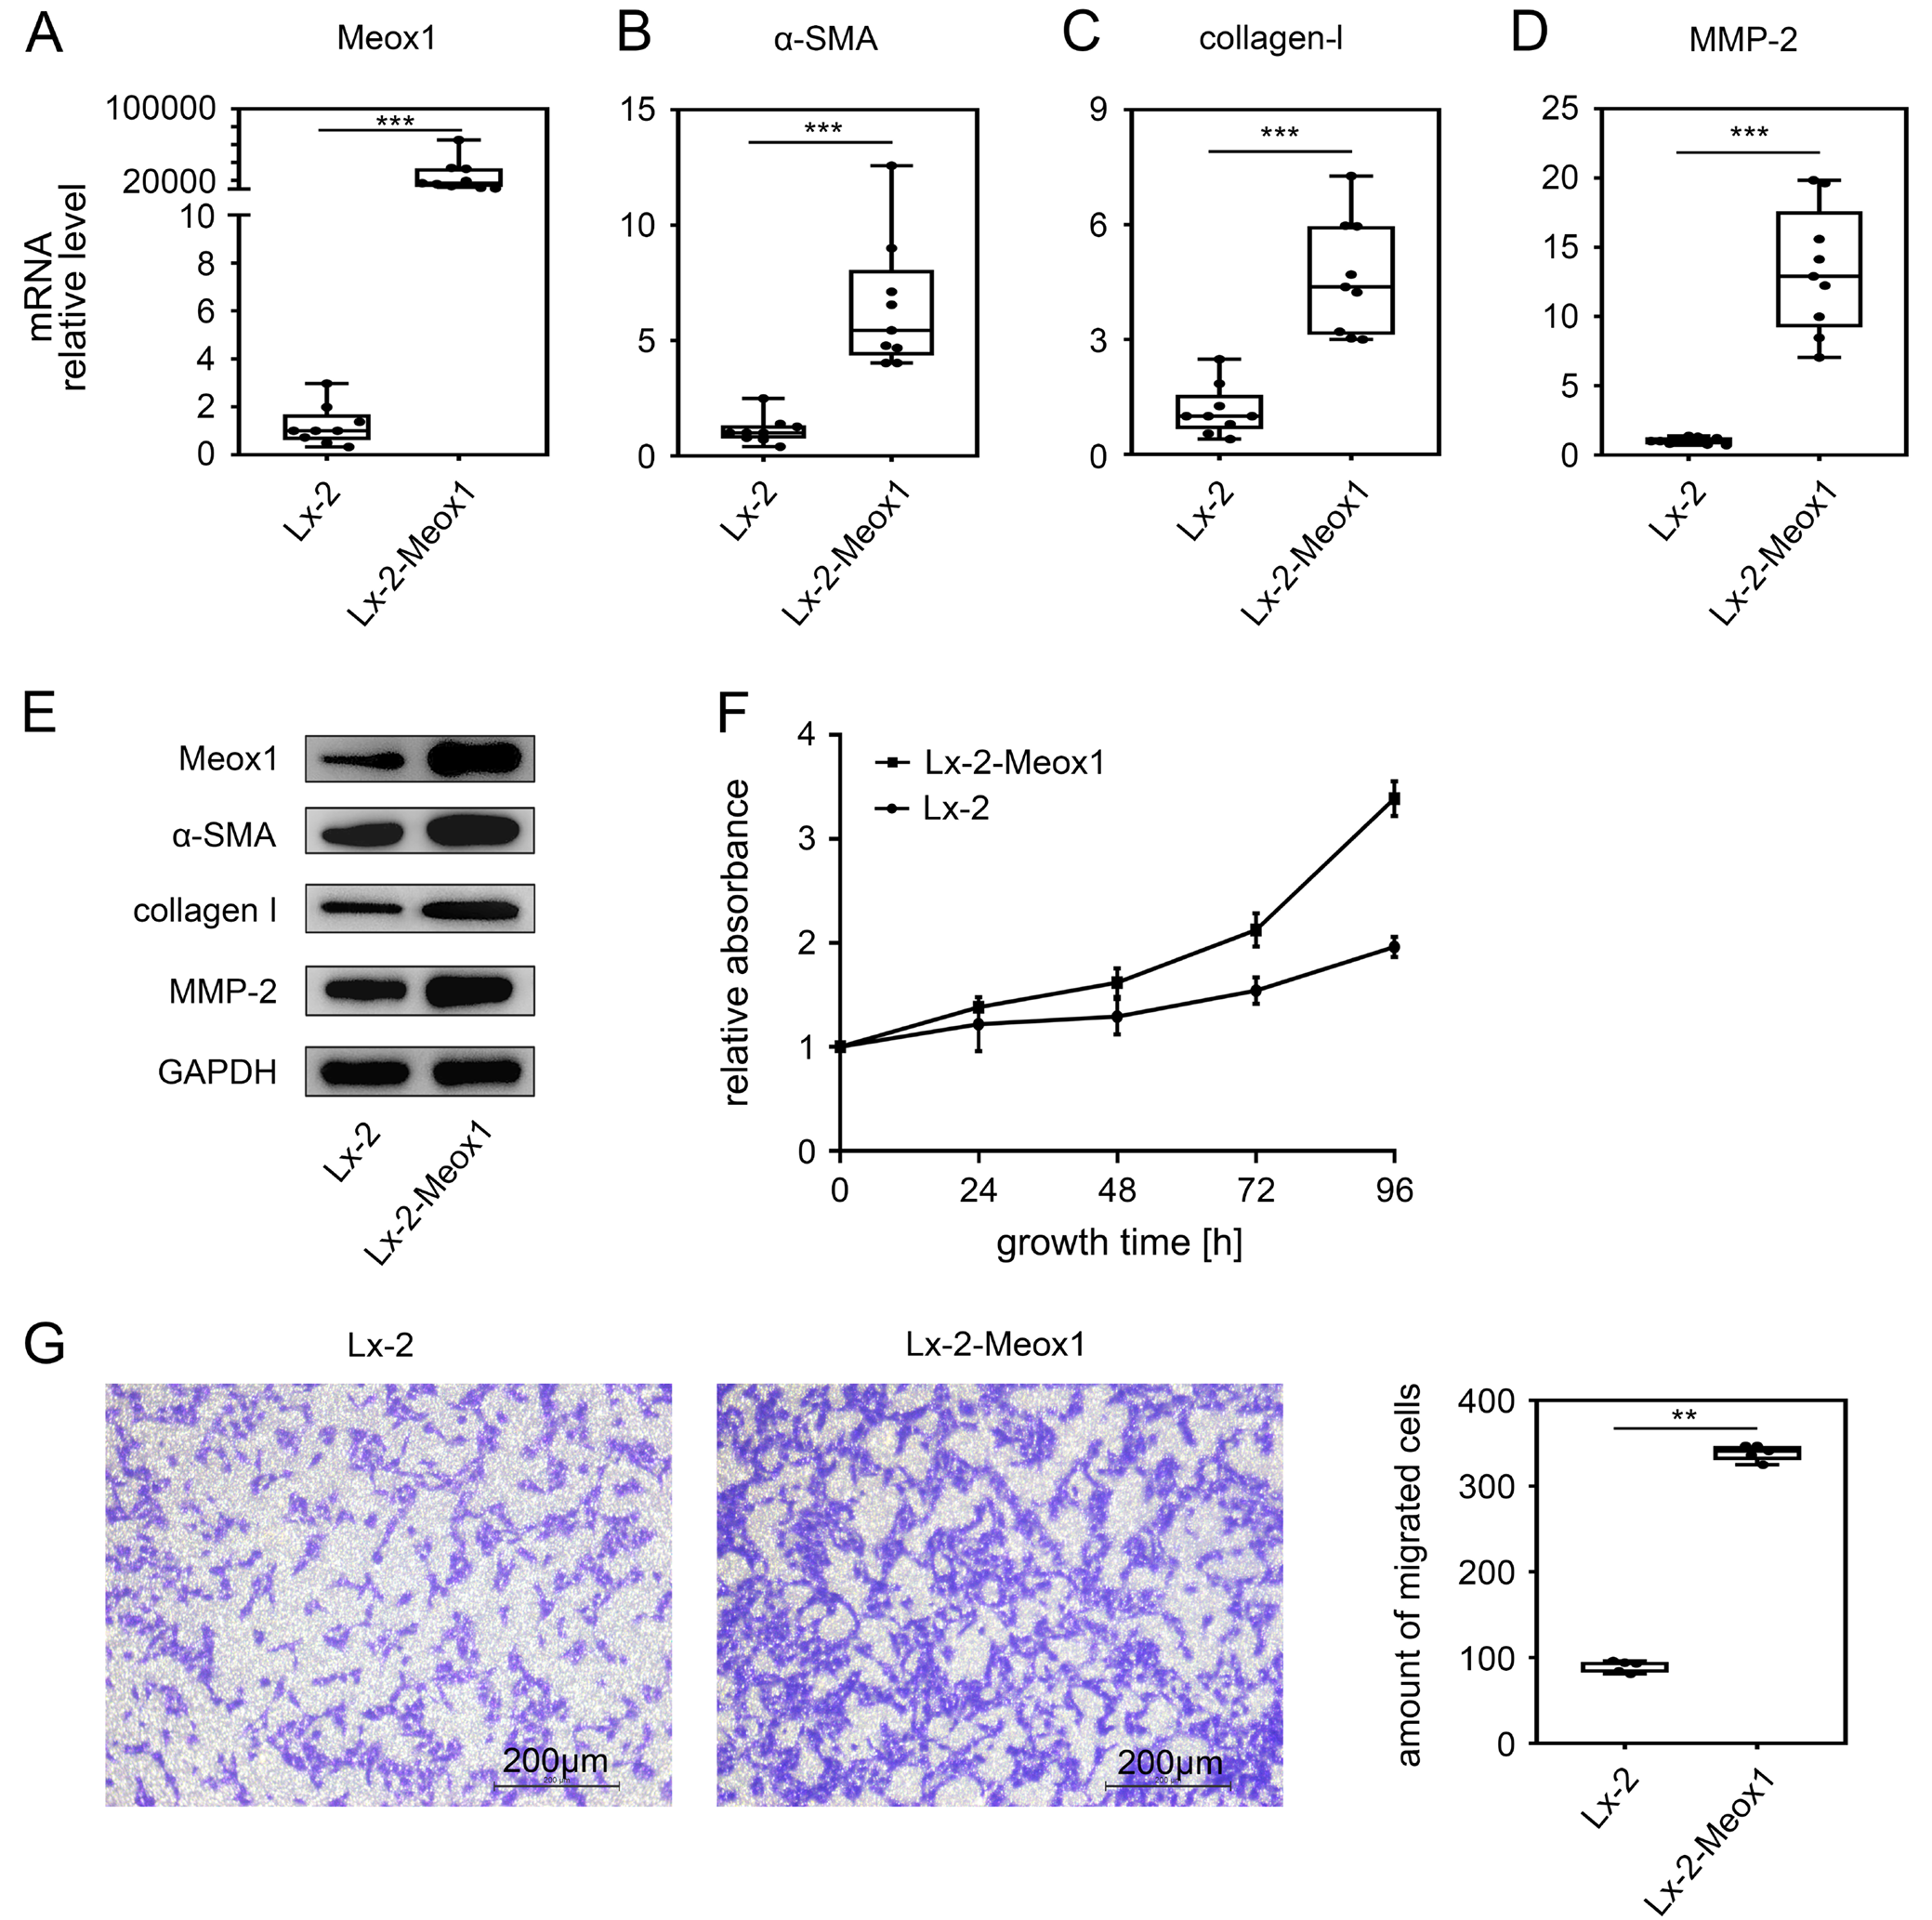
Given that Meox1 was upregulated during HSC activation, suggesting its involvement in transdifferentiation, we examined the effect of Meox1 alone on HSC activation. We stably transfected the Meox1 gene into LX-2 cells and analyzed the expression levels of HSC activation markers. The results showed that Meox1 mRNA (Figure 3A) and protein (Figure 3E) levels were significantly increased compared to the control, confirming the successful establishment of LX-2-Meox1 cell lines with stable Meox1 expression. In these cell lines, the mRNA levels of α-SMA (Figure 3B), collagen-I (Figure 3C) and MMP-2 (Figure 3D) were significantly upregulated. Western blot analysis also indicated that Meox1 overexpression significantly increased the protein levels of α-SMA, collagen-I and MMP-2 (Figure 3E), suggesting that Meox1 promotes the expression of these HSC activation markers at the transcriptional level.
Cell proliferation and migration are key functional characteristics of HSC activation.9 Therefore, we further evaluated the effect of Meox1 on HSC proliferation using the CCK-8 assay (Figure 3F). The data indicated that the growth rate of LX-2-Meox1 cells was faster than that of the control group at 48, 72 and 96 h, demonstrating that Meox1 accelerates cell proliferation. Additionally, we assessed the role of Meox1 in HSC migration using a Transwell assay. The results showed that the number of migrating cells increased compared to the control group when Meox1 was upregulated (Figure 3G). Overall, these findings suggest that Meox1 promotes HSC phenotypic transformation as well as subsequent proliferation and migration.
The Smad3 phosphorylation level increased in LX-2 Meox1 cells
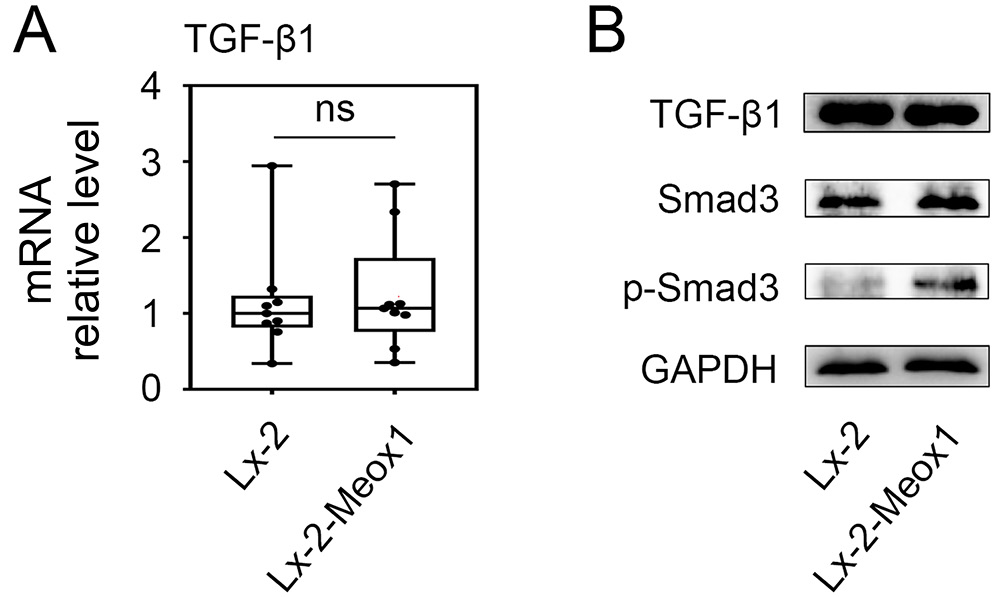
We first investigated whether there was a regulatory loop between Meox1 and TGF-β1 during HSC activation. As shown in Figure 4A, the mRNA level of TGF-β1 did not significantly change after the stable transfection of the Meox1 gene into LX-2 cells. Additionally, Meox1 overexpression did not upregulate the protein level of TGF-β1 in LX-2 cells (Figure 4B). Previous studies have highlighted the critical role of the canonical receptor-activated Smad pathway in mediating TGF-β1 signaling.9, 43 We therefore examined whether Meox1 was involved in the Smad-dependent TGF-β1 pathway. Smad3 is essential for mediating TGF-β1 signaling in HSC activation and the expression of profibrogenic genes, including collagen-I and α-SMA.9, 44 Consequently, we focused on the impact of Meox1 on Smad3. Western blot analysis revealed that while the total protein level of Smad3 remained unchanged in LX-2 cells following Meox1 overexpression, the phosphorylation of Smad3 was elevated (Figure 4B). These findings suggest that Meox1 operates downstream of TGF-β1 without forming a feedback loop and potentially participates in the TGF-β1/Smad3 pathway.
Meox1 induced LX-2 cells population redistribution
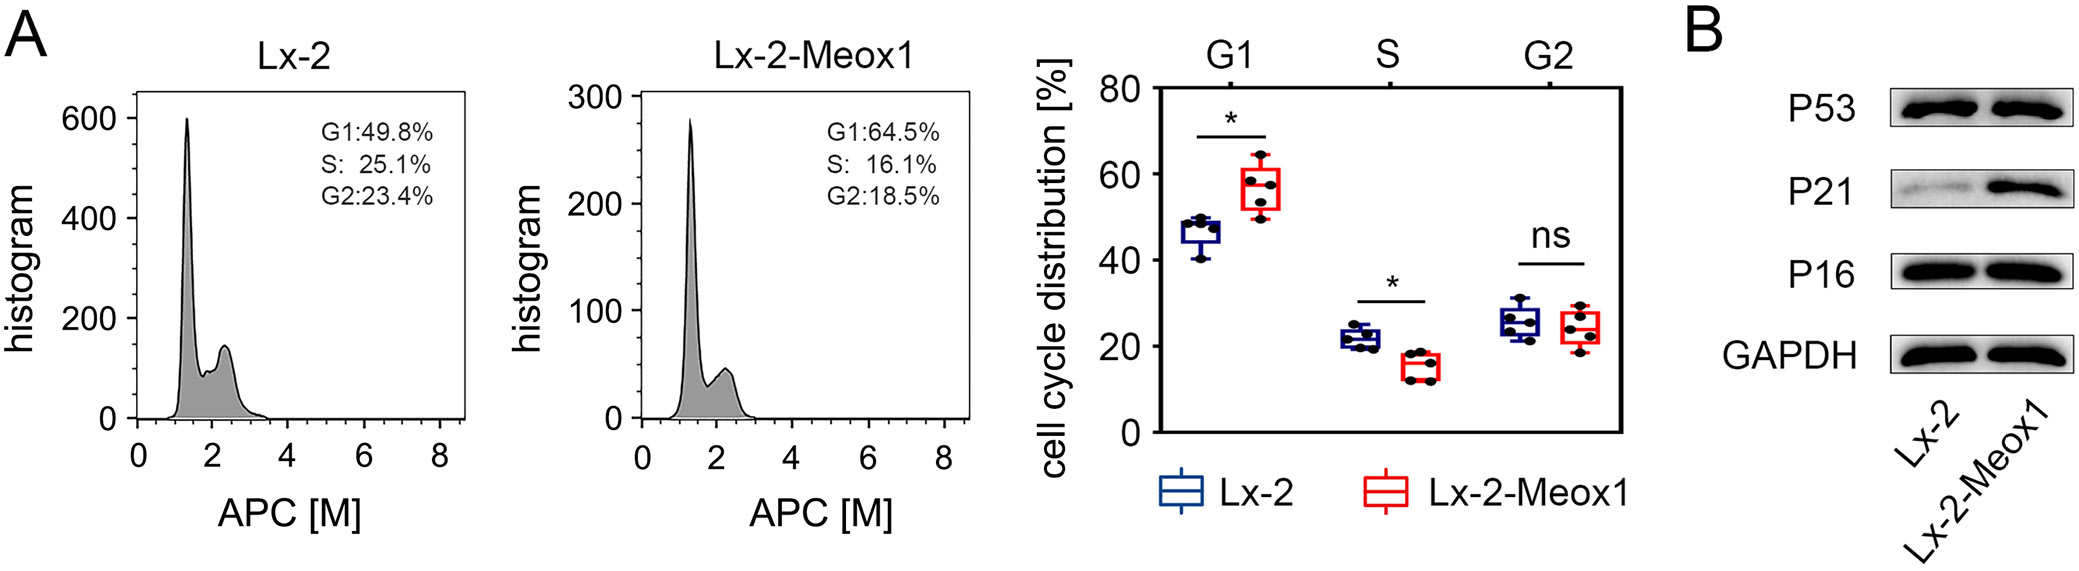
To determine if Meox1 affects cell cycle progression, we used flow cytometry to analyze cell population distribution. The results showed a significant increase in the proportion of cells in the G1 phase and no significant difference in the G2 phase in LX-2-Meox1 cells compared to the LX-2 control group (Figure 5A). This indicates that Meox1 can induce a redistribution of the cell population, extending the G1 phase.
Meox1 activated p21CIP1/WAF1 expression in HSCs
Meox1 acts as a transcriptional inducer of p16INK4a and p21CIP1/WAF1 in vascular endothelial cells (VECs).29 Therefore, we also examined its impact on stimulating the expression of p16INK4a and p21CIP1/WAF1 in HSCs. Western blot analysis revealed a significant increase in p21CIP1/WAF1 protein expression in LX-2-Meox1 cells compared to the control, whereas no notable change was observed in p16INK4a protein levels (Figure 5B). Despite p53 being a well-established transcriptional activator of the p21CIP1/WAF1 gene,45 its protein expression did not differ between LX-2-Meox1 cells and control cells (Figure 5B). These findings suggest that the upregulation of p21CIP1/WAF1 during Meox1-induced HSC activation is independent of p53.
Discussion
Mounting evidence supports that HSC activation and their transformation into myofibroblasts are critical stages in hepatic fibrosis. Inhibiting HSC activation represents a promising treatment approach to alleviate fibrosis progression.8, 9 Nevertheless, the safety and efficacy of this therapeutic strategy remain uncertain. Therefore, further research is essential to identify new therapeutic targets.
Several gene expression profiles undergo changes during fibrosis and play crucial roles in the transdifferentiation of myofibroblasts and fibrogenesis.4, 8, 46 Meox1 has recently emerged as a significant regulator of fibroblast activation across various types of organ fibrosis, including skin,27 vessel,30 heart,31, 32 and lung fibrosis.33 Importantly, Meox1 is specifically expressed in activated fibroblasts, orchestrating a comprehensive fibrotic gene expression program and is essential for TGF-β-induced fibroblast activation.32 Therefore, we investigated the impact of Meox1 on human HSC activation.
TGF-β1, a key inflammatory mediator, is recognized as the principal profibrogenic cytokine that triggers HSC activation and ECM production.9, 44 The α-SMA, a hallmark of HSC activation, serves as an indicator of activation severity.8, 9 Additionally, collagen-I and MMP-2 are integral components of the ECM and are widely used to assess fibrosis severity.8, 9 Our study revealed that Meox1 expression increased concurrently with α-SMA and the accumulation of collagen-I and MMP-2 in TGF-β1-treated LX-2 cells. Interestingly, inhibiting Meox1 expression blocked TGF-β1-induced synthesis of α-SMA, collagen-I and MMP-2, thereby reducing ECM accumulation. These findings suggest that Meox1 may contribute to TGF-β1-induced HSC activation and subsequent ECM deposition.
Hepatic stellate cell activation is a multifaceted process involving changes in phenotype and function crucial for ECM production, proliferation and migration.8 Our study demonstrated that overexpression of Meox1 significantly elevated α-SMA levels in LX-2 cells. Similarly, expression levels of collagen-I and MMP-2 were robustly enhanced, indicating that Meox1 can drive the transformation of quiescent HSCs into a myofibroblastic phenotype. Previous studies have indicated that approx. 80% of fibrillary collagen-I is synthesized by activated HSCs, with MMP-2 playing a regulatory role in this process.8 Matrix metalloproteinase-2, a profibrotic mediator secreted by activated HSCs, contributes to ECM degradation and enhances HSC activation and migration.12 Conversely, inhibition of Meox1 reduced basal levels of both collagen-I and MMP-2 expression. These findings suggest that Meox1 functions as an inducer of collagen-I and MMP-2, thereby regulating ECM production in HSCs.
Furthermore, our observations indicated that Meox1 significantly promoted the proliferation and migration of LX-2 cells. These data underscore the crucial role of Meox1 in HSC activation, aligning with previous research demonstrating Meox1’s ability to modulate phenotypes and functions of human dermal fibroblasts27 and smooth muscle cells (SMCs).24, 30
The TGF-β1/Smad signaling pathway is crucial in liver fibrosis by activating HSCs.9, 40 Transforming growth factor-β1 induces Meox1 expression, and blocking Meox1 inhibits TGF-β1-induced ECM synthesis. Interestingly, TGF-β1 expression did not significantly vary with Meox1 overexpression in LX-2 cells, suggesting that Meox1 likely acts downstream of TGF-β1 without forming a feedback loop with it. Upon active TGF-β binding to the TGF-β type II receptor, transforming growth factor-β type I receptor (TβRI) is phosphorylated, activating its catalytic activity and initiating signaling through phosphorylation of Smad family members.9, 40 Studies indicate Smad3 as a critical mediator of HSC profibrogenic responses,9, 44 crucial for liver fibrosis progression through ECM expression.40, 47 Smad3 activity, modulated by expression, phosphorylation and nuclear translocation, induces transcription of target genes.24 Our study observed increased Smad3 phosphorylation but no significant change in total Smad3 levels upon forced Meox1 expression in LX-2 cells, suggesting Meox1 may regulate Smad3 phosphorylation. However, Meox1’s localization in the nucleus makes direct promotion of TGF-β-induced Smad3 phosphorylation in the cytoplasm unlikely. Research on SMCs suggests Meox1 maintains nuclear Smad3 phosphorylation by inhibiting protein phosphatase, Mg2+/Mn2+ dependent 1A (PPM1A), a Smad3 phosphatase blocking TGF-β signaling.24 Thus, we propose TGF-β1-induced Meox1 preserves Smad3 phosphorylation to promote HSC activation, yet the detailed mechanisms of Meox1 in HSC activation require further exploration.
Furthermore, our findings indicate that increased Meox1 expression lengthens the G1 phase. Previous studies have shown that p21CIP1/WAF1 and p16INK4a are downstream transcriptional targets of Meox1 and can be directly activated by Meox1 in VECs.29 These genes act as cyclin-dependent kinase inhibitors essential for G1 phase arrest.48 In LX-2 cells, Meox1 overexpression significantly induced p21CIP1/WAF1 expression, whereas p16INK4a levels remained unchanged compared to the negative control. We speculate that this discrepancy may result from different intracellular responses in different cell types.
Increased p21CIP1/WAF1 expression was observed at both protein and mRNA levels, while p53 expression, a known transcriptional activator of p21CIP1/WAF1,48 was unaffected by Meox1 expression in LX-2 cells. This suggests that Meox1-induced p21CIP1/WAF1 expression at the transcriptional level is independent of p53. This independence may explain Meox1’s role in lengthening the G1 phase. Studies have shown that p21CIP1/WAF1 plays a crucial role in hepatocyte development, differentiation and cell cycle regulation, with Smad family members mediating the activation of the p21CIP1/WAF1 promoter. Truncated Smad3 blocks this transactivation.49
Previous research has confirmed that Meox1 can regulate muscle tissue growth and differentiation by controlling the cell cycle.21 Extensive research has demonstrated the close connection between cell fate decisions and cell cycle machinery,50, 51, 52 revealing how cells use distinct cell cycle states to regulate biochemical and physical changes, such as metabolism, gene expression profiles and differentiation. Extending the G1 phase allows cells to respond more efficiently to signals, activate developmental gene transcription and initiate differentiation programs while maintaining the differentiation state.53, 54, 55
A study demonstrated that Mteox1 is necessary for TGF-β1-induced SMC differentiation from mesenchymal progenitors24 and acts as a central transcriptional switch governing TGF-β1-induced fibroblast activation in myocardial fibrosis.32 Our results suggest that Meox1 mediates TGF-β1-stimulated transdifferentiation of quiescent HSCs into a myofibroblastic phenotype that accumulates fibrillary collagens. Interestingly, previous research suggested that p21CIP1/WAF1 enhances the sensitivity of cell response to TGF-β.56 Therefore, we speculate that Meox1-induced G1 phase extension may create a temporal window that enhances HSC response to various profibrogenic cytokines, allowing for more efficient activation and maintenance of the transdifferentiation state, thereby promoting fibrosis. These findings indicate a more complex relationship between Meox1 and HSC activation that warrants further investigation.
Limitations
Our study has several limitations. Primarily, the use of the LX-2 cell line may not fully represent primary hepatic stellate cells or the in vivo environment, potentially leading to over- or underestimation of Meox1 effects. The reliance on a single cell line and in vitro conditions further limits the generalizability and physiological relevance of the findings. Transient knockdown and overexpression techniques introduce variability and may not capture long-term regulatory mechanisms. The absence of in vivo validation means systemic factors are not considered, affecting translational potential. Additionally, RT-qPCR and western blot analyses could introduce technical biases, impacting result precision. Future studies should incorporate primary HSCs, validate findings in animal models, use stable genetic manipulation techniques, and replicate results across multiple cell lines to mitigate these biases and enhance study precision.
Conclusions
Our research identifies Meox1 as a key factor in TGF-β1-induced HSC activation, significantly influencing HSC phenotypic modulation. While the precise mechanisms remain unclear, changes in Smad3 phosphorylation suggest that Meox1 may regulate HSC activation through the TGF-β/Smad signaling pathway. Given its role in promoting HSC activation, Meox1 warrants further investigation and may represent a promising antifibrotic drug target for treating hepatic fibrosis.
Supplementary data
The supplementary materials are available at https://doi.org/10.5281/zenodo.14232390. The package includes the following files:
Supplementary Fig. 1A. Kruskal–Wallis H test was utilized for examining the data from western blotting assay of Meox1.
Supplementary Fig. 1B. Kruskal–Wallis H test was utilized for examining the data from western blotting assay of α-SMA.
Supplementary Fig. 1C. Kruskal–Wallis H test was utilized for examining the data from western blotting assay of collagen-I.
Supplementary Fig. 1D. Kruskal–Wallis H test was utilized for examining the data from western blotting assay of MMP-2.
Supplementary Fig. 2A. Kruskal–Wallis H test was utilized for examining the data from western blotting assay of Meox1.
Supplementary Fig. 2B. Kruskal–Wallis H test was utilized for examining the data from western blotting assay of α-SMA.
Supplementary Fig. 2C. Kruskal–Wallis H test was utilized for examining the data from western blotting assay of collagen-I.
Supplementary Fig. 2D. Kruskal–Wallis H test was utilized for examining the data from western blotting assay of MMP-2.
Supplementary Fig. 3A. The nonparametric Mann–Whitney U test was utilized for examining the data from qPCR assay of Meox1.
Supplementary Fig. 3B. The nonparametric Mann–Whitney U test was utilized for examining the data from qPCR assay of α-SMA.
Supplementary Fig. 3C. The nonparametric Mann–Whitney U test was utilized for examining the data from qPCR assay of collagen I.
Supplementary Fig. 3D. The nonparametric Mann–Whitney U test was utilized for examining the data from RT-qPCR assay of MMP-2.
Supplementary Fig. 3E. The ARTool package in R was utilized for examining the data from CCK-8 cell proliferation assay.
Supplementary Fig. 3F. The nonparametric Mann–Whitney U test was utilized for examining the data from cell migration assay.
Supplementary Fig. 4. The nonparametric Mann–Whitney U test was utilized for examining the data from RT-qPCR assay of TGF.
Supplementary Fig. 5A. The nonparametric Mann–Whitney U test was utilized for examining the data from cell cycle assay in G1.
Supplementary Fig. 5B. The nonparametric Mann–Whitney U test was utilized for examining the data from cell cycle assay in S.
Supplementary Fig. 5C. The nonparametric Mann–Whitney U test was utilized for examining the data from cell cycle assay in G2.
Data availability
The datasets generated and/or analyzed during the current study are available from the corresponding author on reasonable request.
Consent for publication
Not applicable.
Use of AI and AI-assisted technologies
Not applicable.