Abstract
Background. Salvianolic acid F (SAF), an important water-soluble monomeric component, is derived from the herbal medicine Salvia miltiorrhiza (SM) Bunge. Although SAF has been suggested to suppress various cancers, its role in ovarian cancer (OC) and the underlying mechanisms remain largely unclear.
Objectives. This study aimed to investigate the effects of SAF on OC cell growth, invasion, migration, and apoptosis, as well as to elucidate the underlying mechanisms, including those involving the EP300/PI3K/AKT signaling pathway.
Materials and methods. In vitro cell culture experiments were conducted to assess the effects of SAF on the proliferation, migration, invasion, and apoptosis of OVCAR-3 (Ovarian Cancer Cell Line 3) and SK-OV-3 (Sloan-Kettering Ovarian Cancer 3) cells. Network pharmacology was further employed to explore SAF’s impact on OC and to elucidate the potential underlying mechanisms. The EP300-mediated PI3K/AKT signaling pathway was selected for validation to confirm SAF’s effects on inducing apoptosis and inhibiting cell proliferation in these OC cell lines.
Results. Salvianolic acid F suppressed the growth, invasion and migration of SK-OV-3 and OVCAR-3 cells, and induced apoptosis. A network pharmacology analysis of SAF’s effects on OC identified core targets, TP53, EP300, STAT3, MMP9, NFKB1, HIF1A, and PTGS2, through protein–protein interaction (PPI) network analysis using the STRING database. Salvianolic acid F inhibited EP300 expression in SK-OV-3 cells, reduced the p-PI3K/PI3K ratio, and increased both the Bax/Bcl-2 ratio and the cleaved caspase-3/caspase-3 ratio in OVCAR-3 and SK-OV-3 cells. However, the addition of A485, an EP300 inhibitor, did not further enhance the effects of SAF.
Conclusions. Salvianolic acid F inhibited OC cell growth, migration and invasion while promoting apoptosis. The EP300/PI3K/AKT pathway is a key mechanism through which SAF regulates OC progression. Additionally, SAF may represent a promising candidate drug for treating OC.
Key words: apoptosis, migration, ovarian cancer, proliferation, salvianolic acid F
Background
Ovarian cancer (OC) is a leading cause of mortality among gynecological malignancies.1 It ranks 3rd in incidence among cancers of the female reproductive system, following cervical and uterine cancers.2 Due to its subtle early symptoms and atypical late symptoms, OC exhibits the highest mortality and recurrence rates among gynecological cancers.3
Combined surgery and chemotherapy remain the standard approach for treating OC. However, severe complications, high recurrence rates and resistance to platinum-based drugs (e.g., cisplatin and carboplatin) are frequently observed during treatment.4 Additionally, tumor metastasis further complicates OC management.5 Thus, there remains an unmet need to optimize OC treatment.
As demonstrated in numerous studies, traditional Chinese medicine (TCM) brings about antitumor effects in the treatment of OC by regulating cancer cell growth and apoptosis, inhibiting angiogenesis and reducing resistance to platinum-based chemotherapeutics.6 Salvia miltiorrhiza (SM), a TCM herb, has been extensively used to treat various conditions, including cardiovascular diseases and cancer.7, 8, 9 According to some pharmacological studies, SM achieves its activity via 2 compounds, namely, hydrophilic phenolic acids and lipophilic diterpenoids.10 Typically, phenolic acid possesses various bioactivities, such as anti-coagulation, anti-oxidation and anticancer.11
Salvianolic acids are a group of polyphenolic compounds predominantly found in the roots of SM, also known as danshensu (DSU).12 Among them, salvianolic acid B (SAB) and salvianolic acid F (SAF) are 2 distinct compounds with different chemical structures and potential bioactivities. Salvianolic acid B contains multiple phenolic rings and carboxylic acid groups, giving it a more complex structure compared to SAF, which also contains phenolic rings but is structurally simpler. Their concentration in SM can vary significantly based on the geographical location, cultivation methods and extraction techniques.13 Typically, the concentration ranges from a few micrograms to several milligrams per gram of dried root material. The extent of absolute oral bioavailability of SAB in dogs was calculated to be only 1.07 ±0.43%.14 Due to its simple structure, SAF might have higher bioavailability than SAB; however, further experimentation is required to verify this. The mechanism of action of SAF has not yet been fully elucidated. Salvianolic acid F exhibits strong antioxidant capacity and mitigates oxidative injury by scavenging hydroxyl radicals.15 It has also been shown to suppress the proliferation of lung cancer cells.16
Objectives
The antitumor effects of SAF and its underlying mechanisms in OC remain unclear. This study aimed to evaluate the sensitivity of OC cells to SAF in vitro, assess its effects on cell growth, invasion and migration, and investigate the underlying molecular mechanisms.
Materials and methods
Chemicals
Salvianolic acid F was purchased from Shanghai Yuanye Bio-Technology Co., Ltd. (purity, ≥98%; Shanghai, China). Cisplatin and A485 were provided by Sigma-Aldrich (St. Louis, USA). Cell Counting Kit-8 (CCK-8) was provided by Dojindo Molecular Technologies (Kumamoto, Japan). The Click-iT® EdU Alexa Fluor® 594 Imaging Kit was purchased from Thermo Fisher Scientific (Waltham, USA). Antibodies against P300, caspase-3, cleaved caspase-3, Bcl-2, Bax, PI3K, phospho-PI3K, AKT, phospho-AKT, and GAPDH were supplied by Cell Signaling Technology (CST; Danvers, USA). Goat anti-rabbit and anti-mouse IgG (H+L) secondary antibodies were provided by Abcam (Cambridge, UK). All remaining chemicals were of reagent-grade purity.
Cells and cell treatment
Ovarian cancer cell lines (OVCAR-3 (Ovarian Cancer Cell Line 3) and SK-OV-3 (Sloan-Kettering Ovarian Cancer 3)) were obtained from Shanghai Institutes of Biological Sciences, Chinese Academy of Sciences (China). Of them, SK-OV-3 cells were cultivated within McCoy’s 5A that contained 10% fetal bovine serum (FBS; Gibco, Waltham, USA) and 1% penicillin-streptomycin (Invitrogen, Waltham, USA), whereas OVCAR-3 cells were cultivated within Roswell Park Memorial Institute Medium (RPMI)-1640 medium that contained 10% FBS (Gibco) and 1% penicillin–streptomycin (Invitrogen). The above cell lines were subject to incubation under 37°C and 5% CO2 conditions.
Cell viability assay
Cell viability was measured using the CCK-8 assay. In brief, cells (1 × 10⁴/well) were inoculated in 96-well microtiter plates and incubated overnight. Thereafter, different dose (0, 5, 10, 20, 40, 60, 80, and 100 μM) of SAF was added to treat cells for 24, 48 and 72 h. Then, every well was introduced with CCK-8 (10 μL) for extract 4-h incubation in dark under 37°C. Absorbance value measured at 450 nm was used to analyze cell viability.
Cell proliferation assay
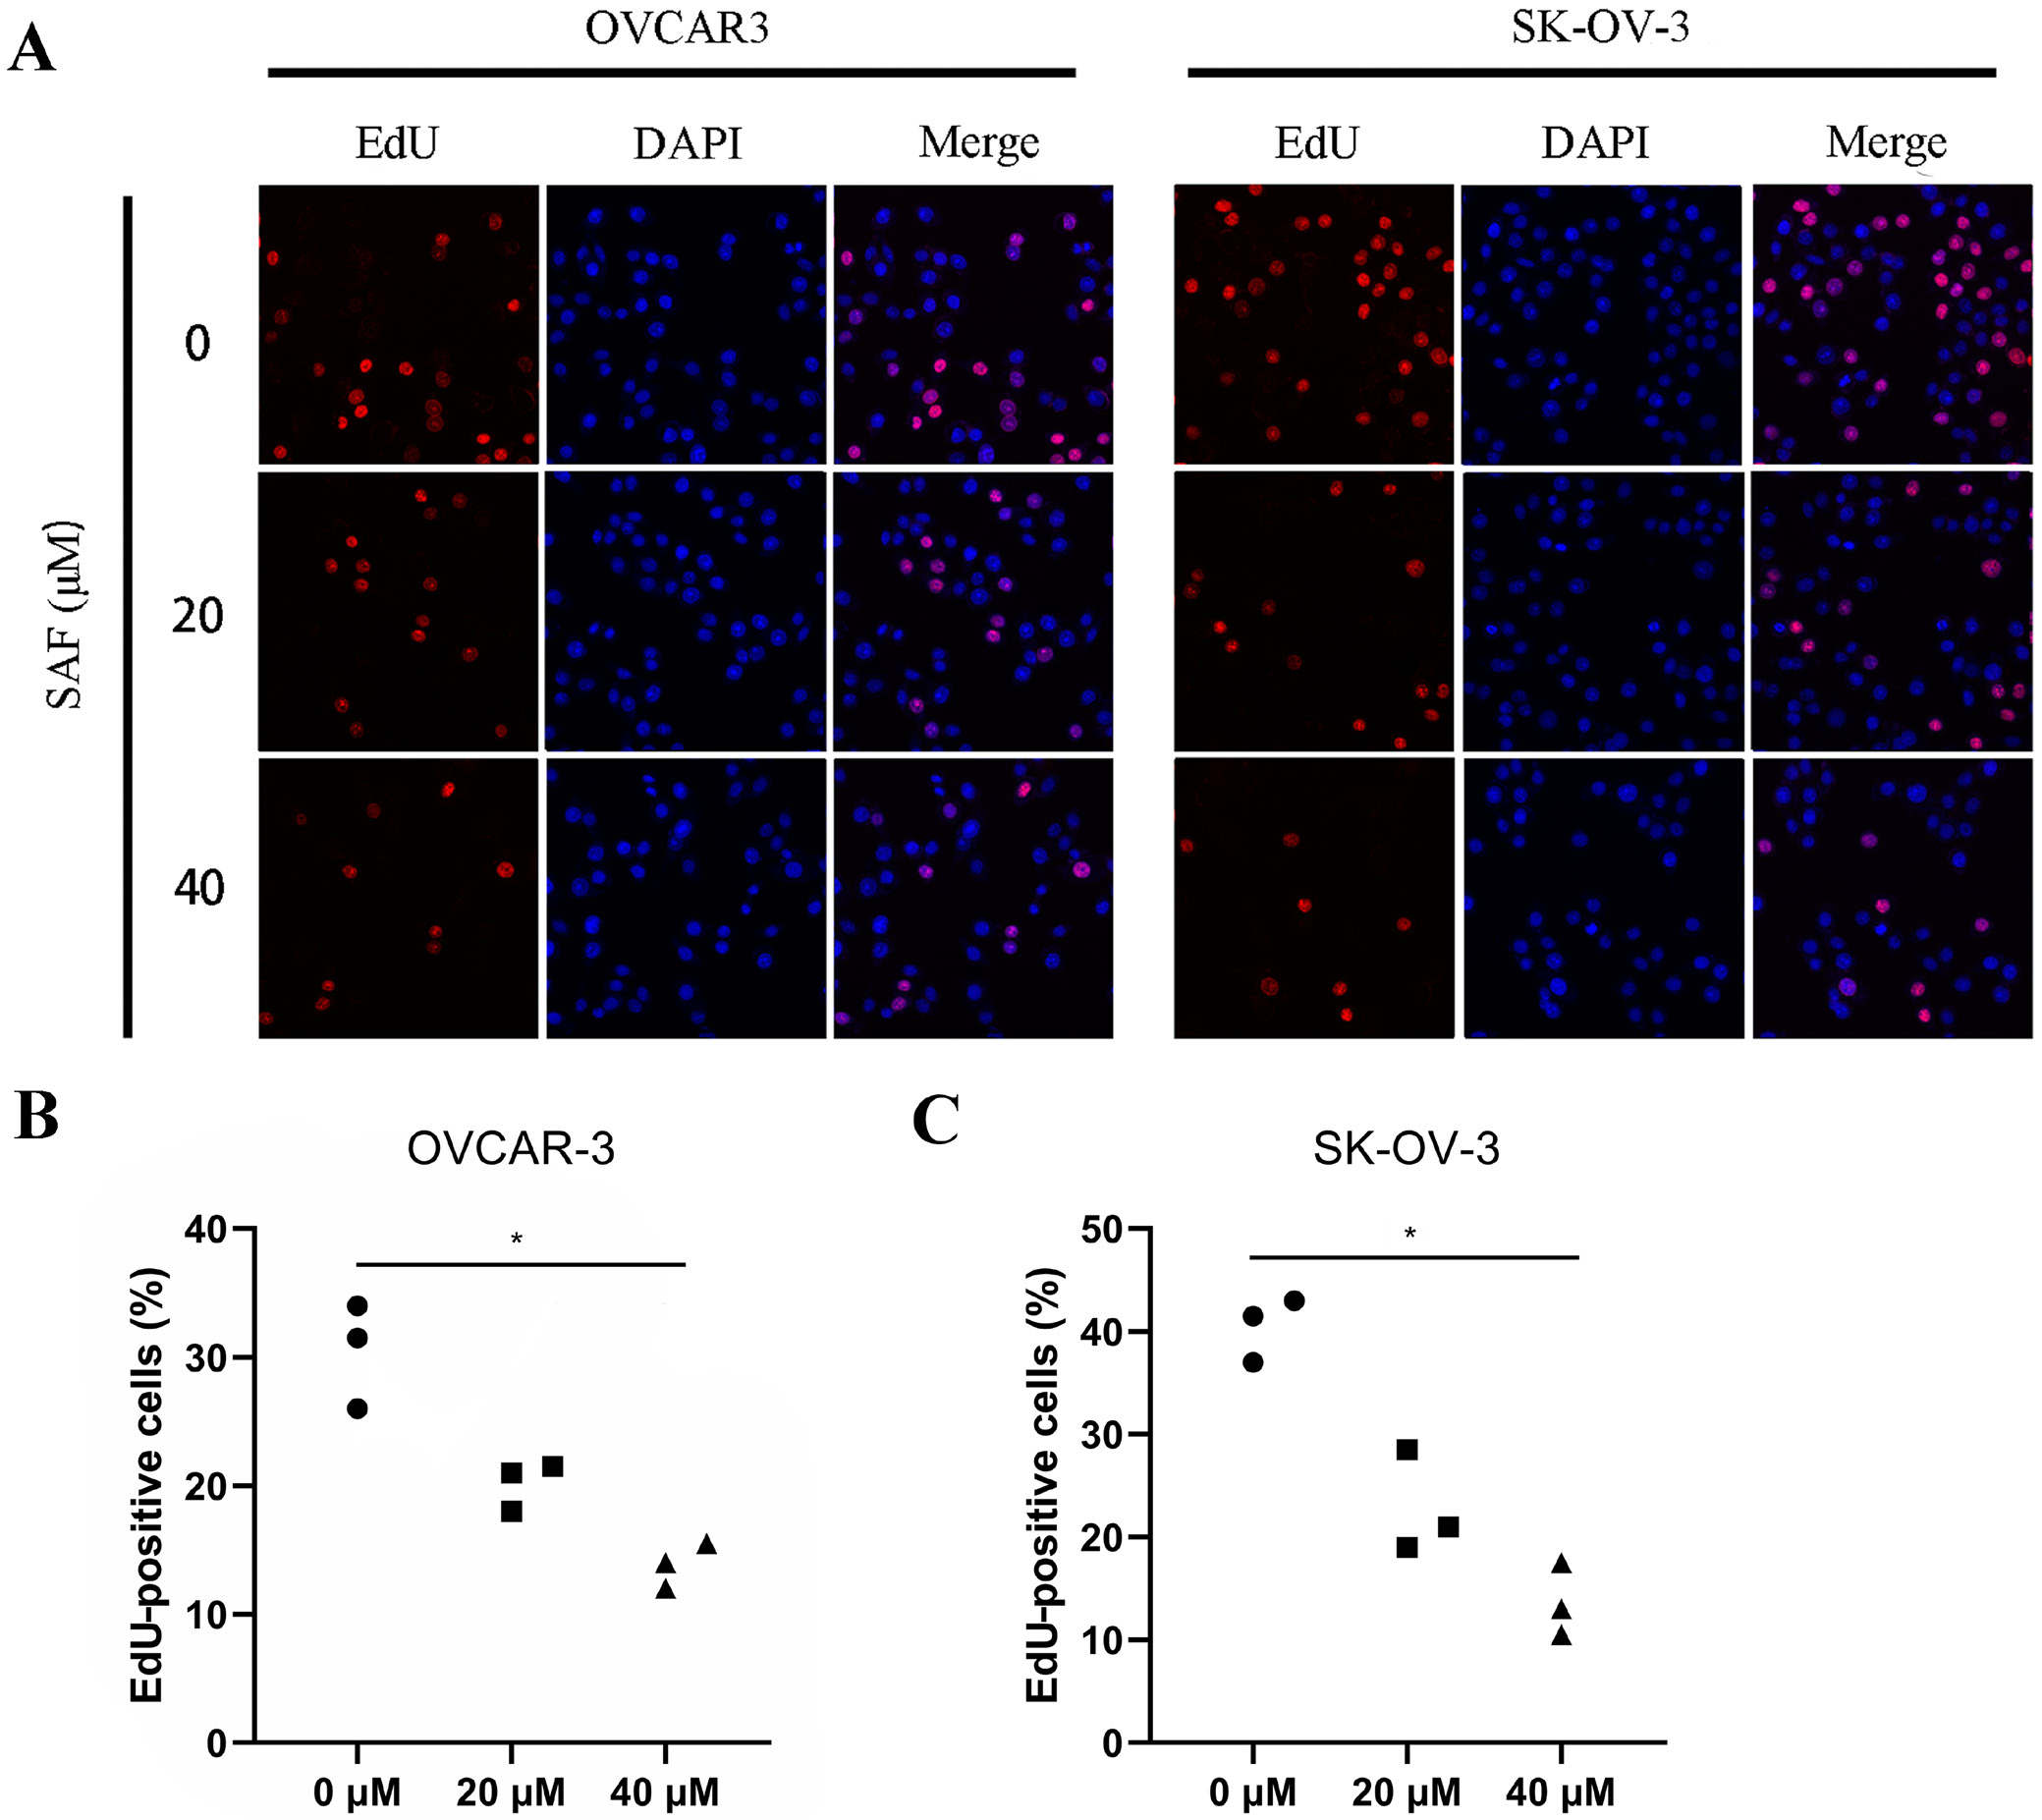
OVCAR-3 and SK-OV-3 cells (5 × 10³/well) were inoculated into 96-well plates for a 24-h period, followed by another 48-h SAF treatment (0, 20 and 40 µM). In line with specific instructions, we utilized Click-iT® 5-ethynyl-2’-deoxyuridine (EdU) imaging kit for the detection of cell proliferation. Proliferation was detected through EdU (red) staining, whereas DAPI (4′,6-diamidino-2-phenylindole)staining (blue) was performed for nuclear counter-staining. ImageJ v. 1.54f (National Institutes of Health (NIH), Bethesda, USA) was employed for calculating the EdU-positive cell percentage.
Cell apoptosis assay
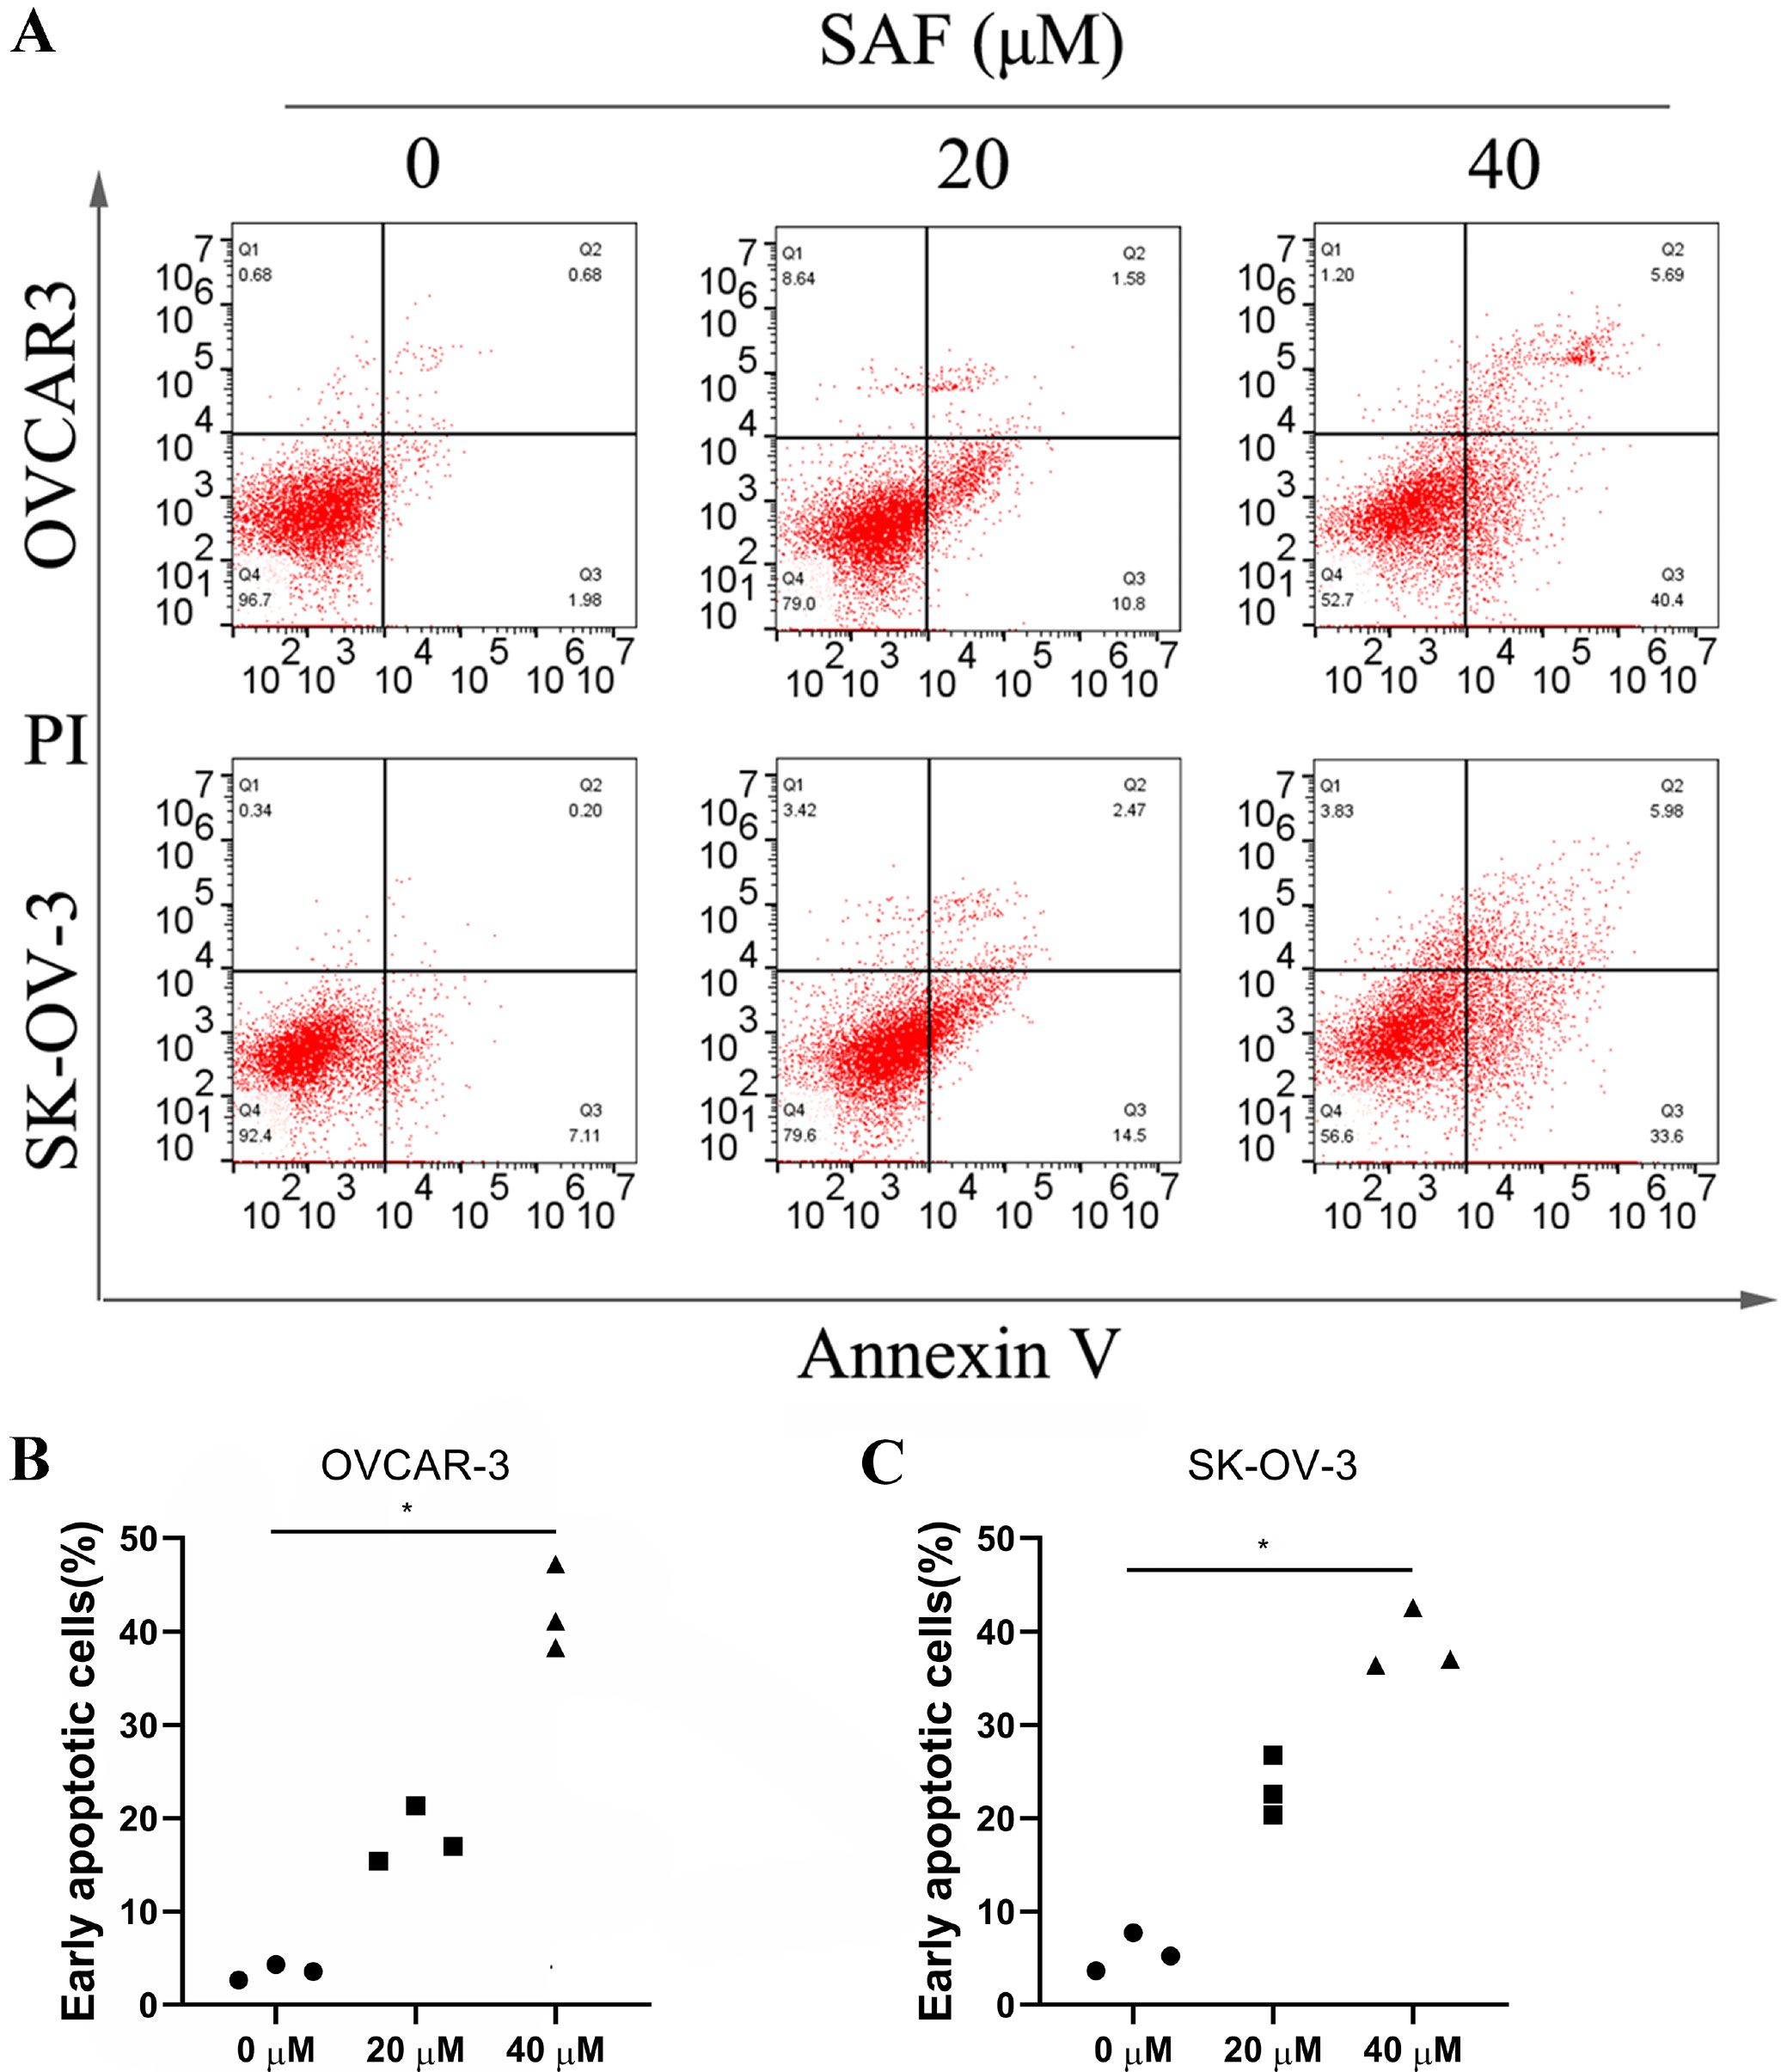
In line with specific protocols, we adopted Annexin V-FITC/PI kit (Beyotime Biotechnology, Shanghai, China) for detecting cell apoptosis and used the flow cytometer (BD LSRFortessa™; BD Biosciences, Franklin Lakes, USA) for measuring the apoptosis rate. To be specific, 2 OC cell lines were inoculated into the 6-well plates at 1 × 10⁶/well density for a 24-h period prior to 48-h SAF treatment (0, 20 and 40 µM). After cell suspension using 1X binding buffer within the 5-mL culture tube at the 1 × 10⁶ cells/mL density, cells were subjected to Annexin V-FITC staining and PI counter-staining for a 15-min period under ambient temperature. The flow cytometer (BD FACSCalibur™; BD Biosciences) was used for determining apoptotic cell. Data were analyzed using FlowJo software (TreeStar Inc., Ashland, USA).
Transwell assay
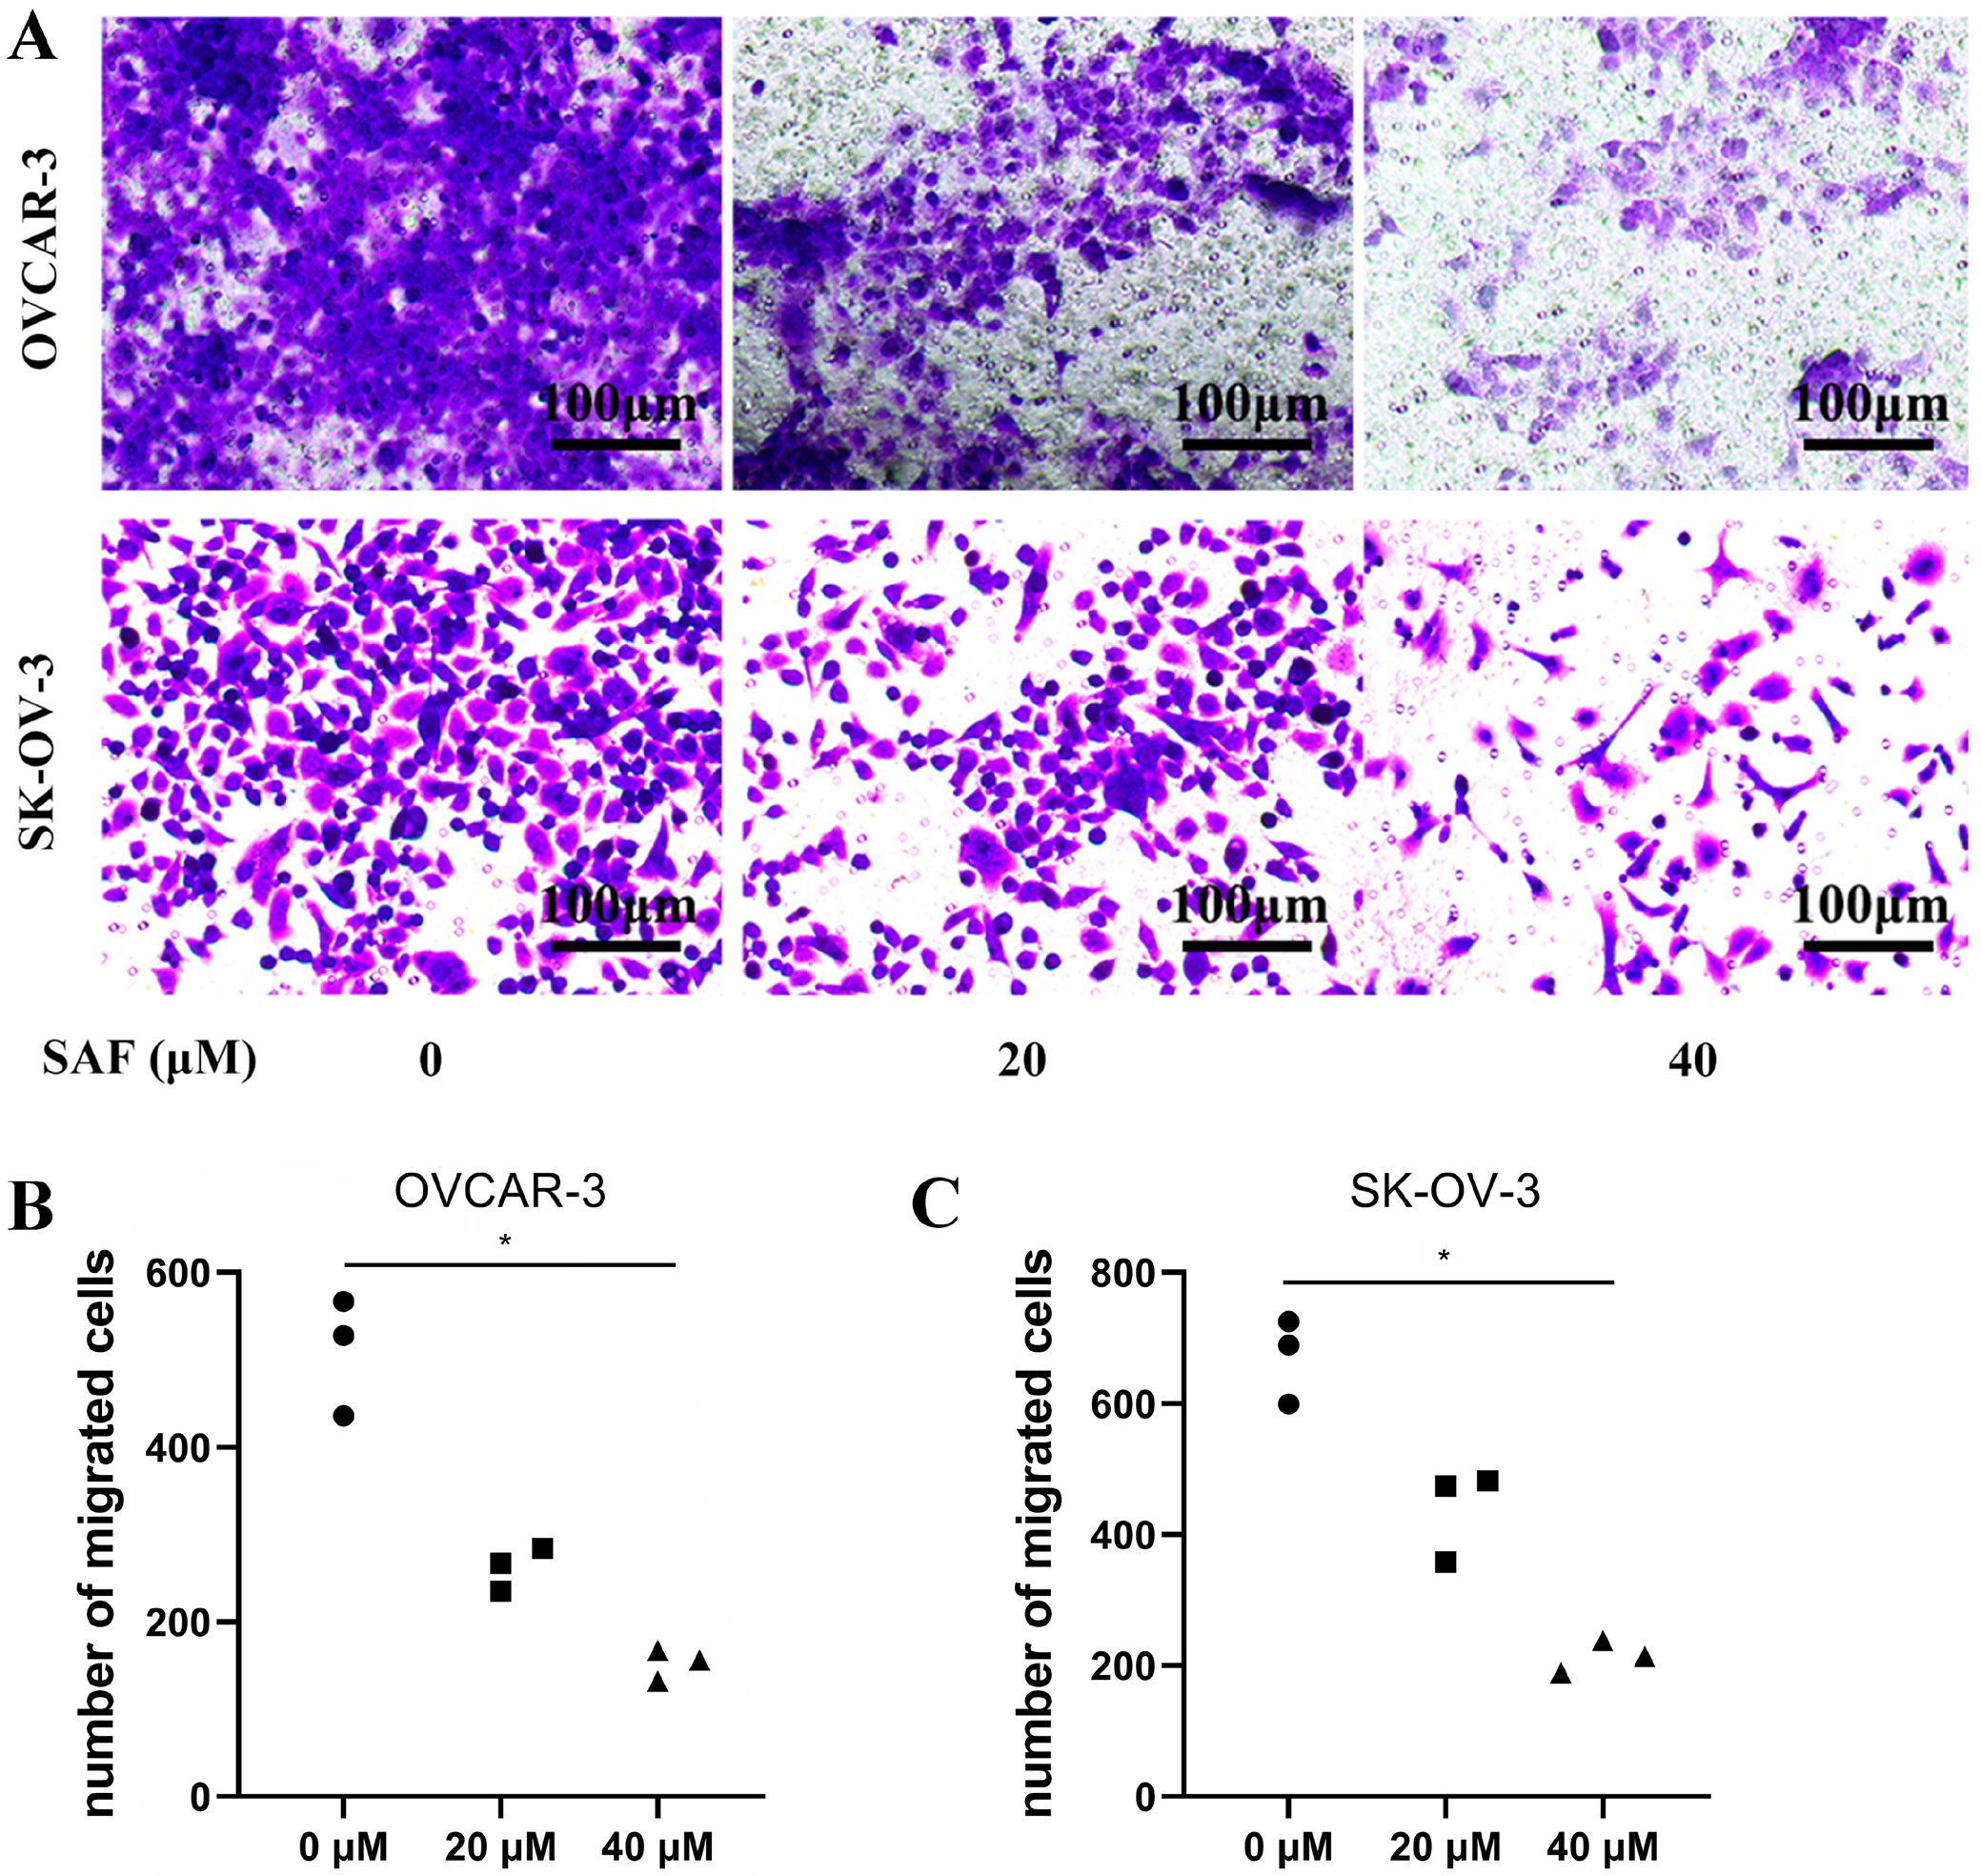
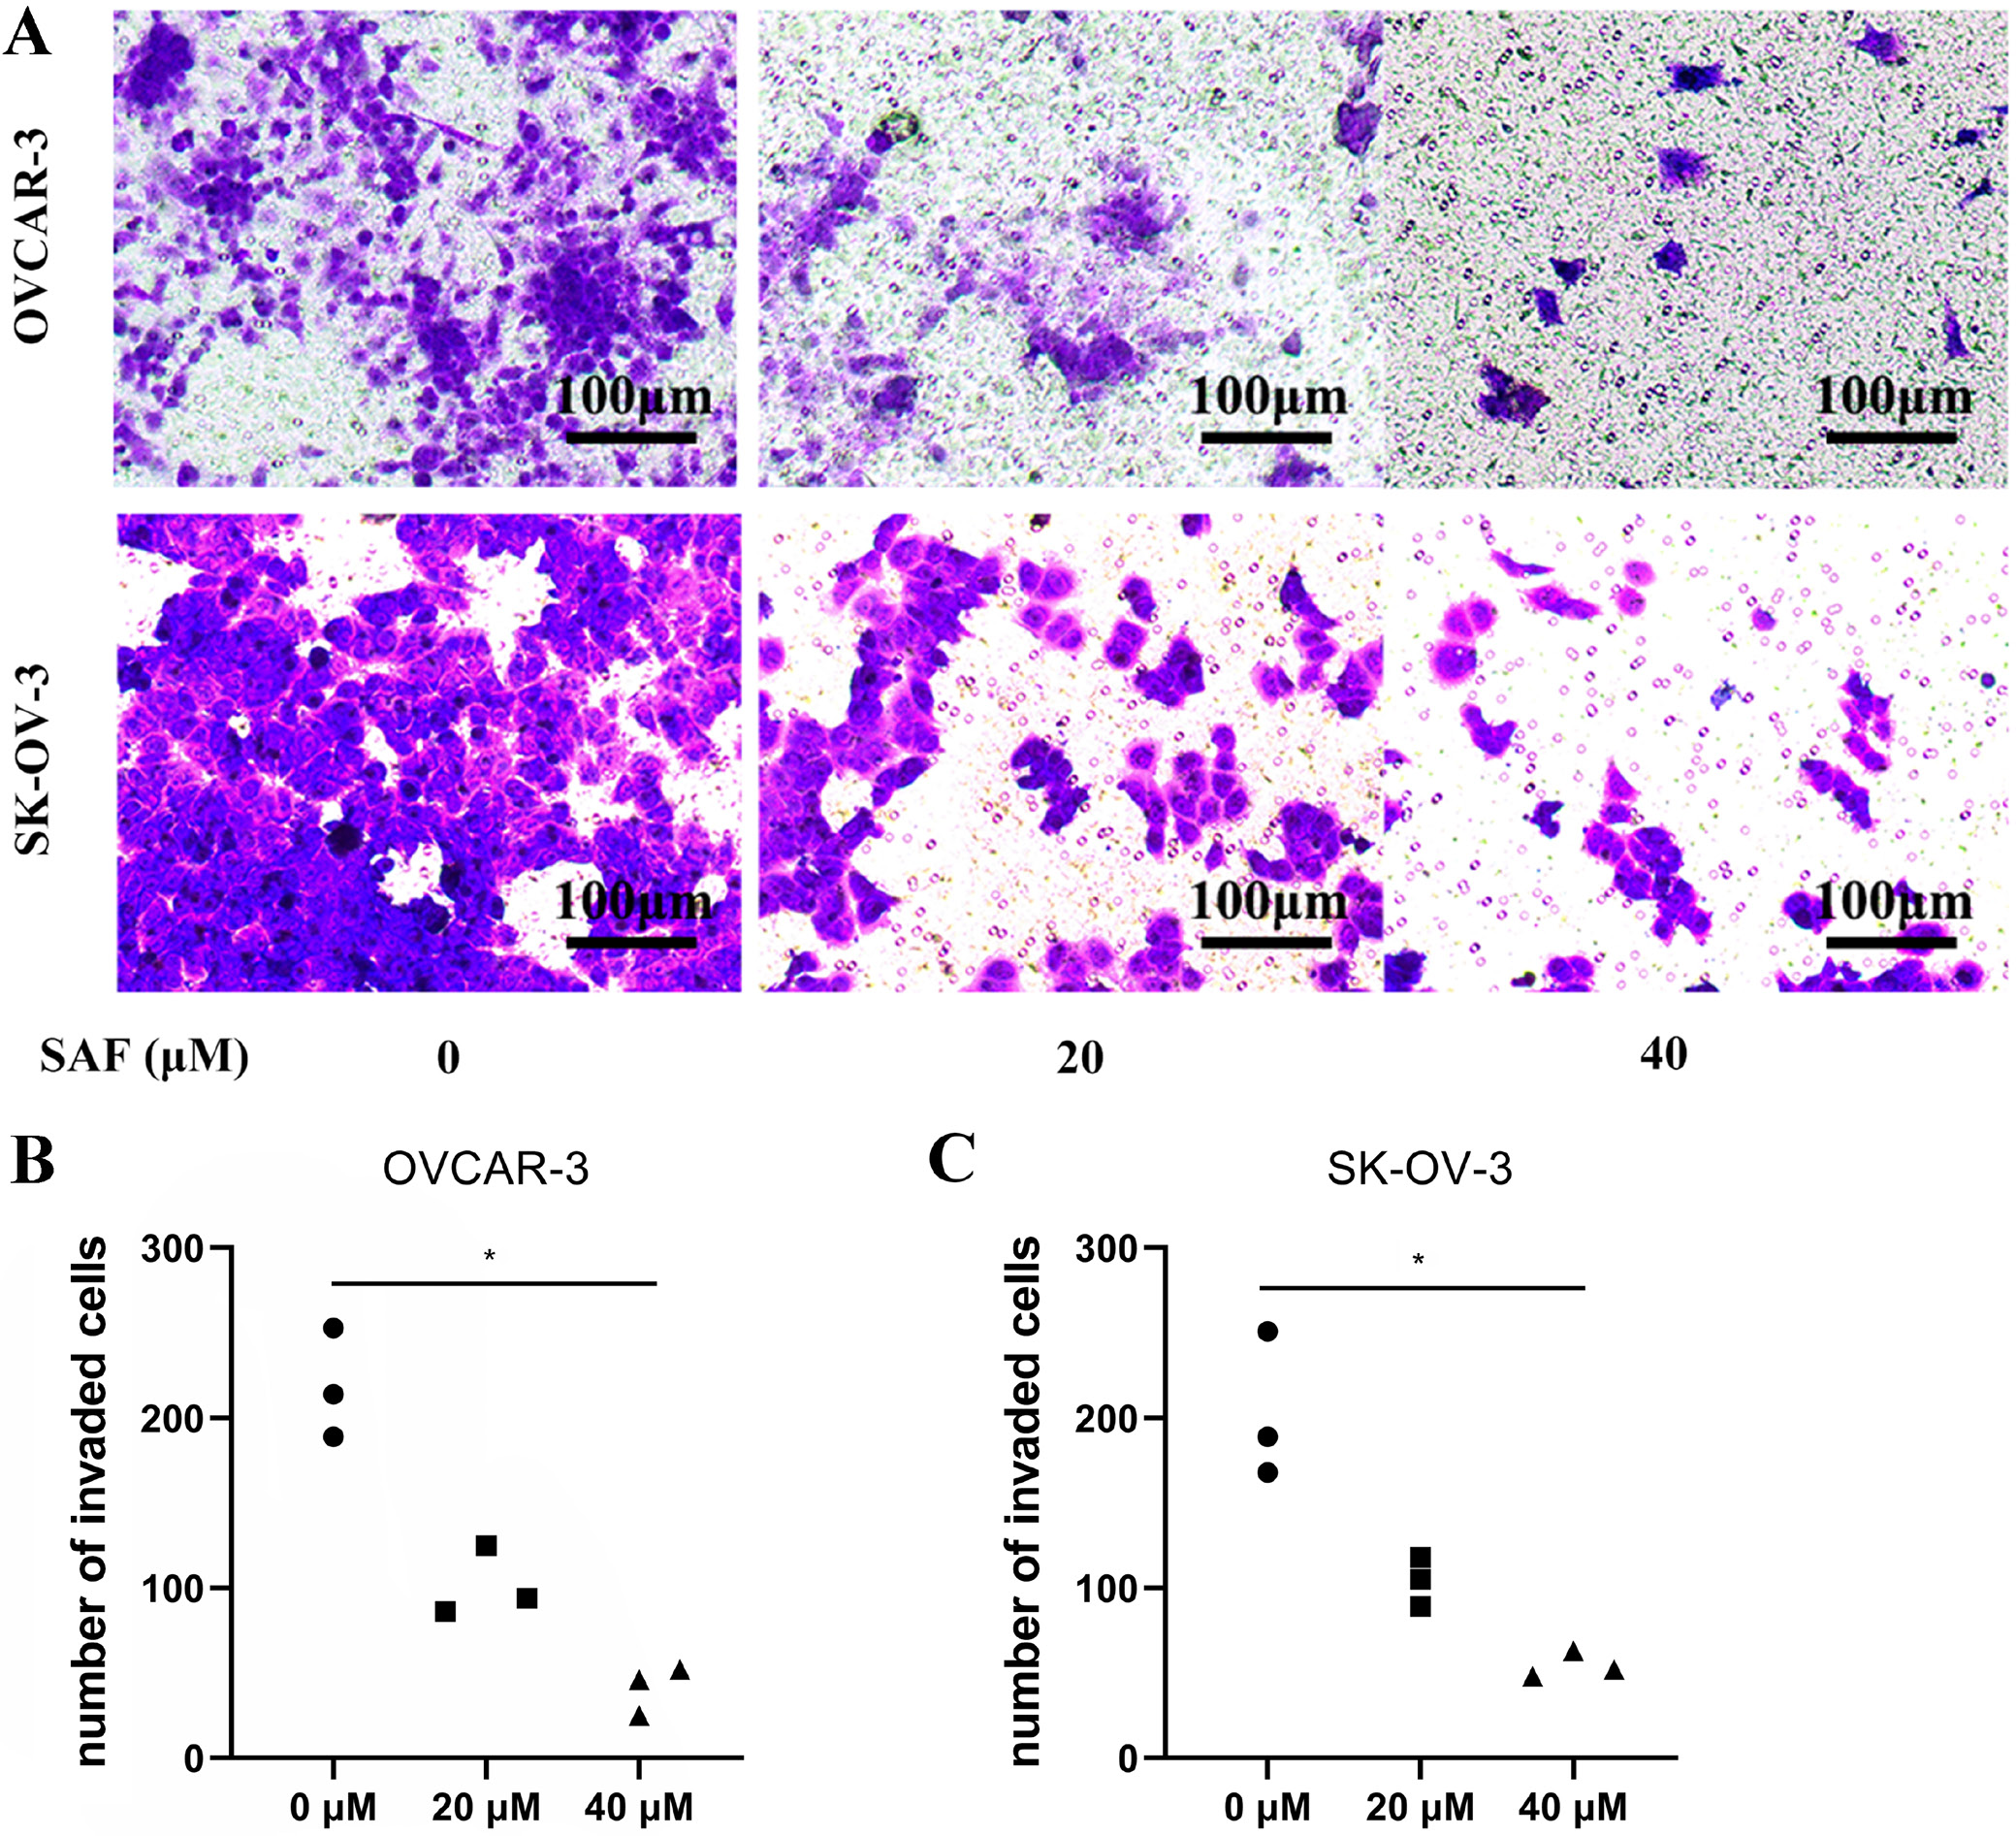
Cell migration and invasion were evaluated using transwell assays. Briefly, the 2 OC cell lines were subjected to resuspension within the serum-free medium. Transwell chambers (8-μm pore size) with/without Matrigel® coating were then seeded with 500 µL cell suspension containing 5 × 10⁵ cells/mL. Additionally, 1 mL medium that contained 10% FBS was added into bottom chambers, while SAF (0, 20 and 40 µM) was introduced to the top chamber. At 48-h post-culture, cotton swabs were utilized to discard cells on membrane surface, whereas 4% paraformaldehyde was added to fix cells penetrating lower membrane surface, and then 0.1% cresyl violet was applied in cell staining. Phase-contrast microscopy (Nikon Eclipse Ti2; Nikon Corp., Tokyo, Japan) was employed to obtain images. Cells that invaded bottom membrane were counted.
Salvianolic acid F and OC-target screening
The chemical structure and Simplified Molecular Input Line Entry System (SMILES) format of SAF were downloaded from the PubChem database (https://pubchem.ncbi.nlm.nih.gov/). The targets of SAF were screened by searching its SMILES format in the SwissTargetPrediction database (www.swisstargetprediction.ch/), PharmacoPhoric Bit (PPB) database (gdb.unibe.ch/) and SEA database (sea.bkslab.org/). The disease targets of OC were screened from the Genecards database (https://www.genecards.org) by searching “ovarian cancer”.
Build protein–protein interaction networks
To clarify the relationship between OC-related targets and SAF-related targets, the 2 target sets were intersected. To further explore interactions between target genes, the statistically identified disease-drug target genes were uploaded to STRING (http://string-db.org) to construct a protein–protein interaction (PPI) network. The species was set to human (Homo sapiens), and default parameters were used. The “string_interactions_short.TSV” file was then downloaded and uploaded into Cytoscape 3.6.1 (Cytoscape Consortium, San Diego, USA) for topological analysis using the NetworkAnalyzer tool. For visualization, degree score was used as the reference standard, where protein size and color were proportional to their degree scores. Proteins were arranged from the inside out based on their degree scores. Core proteins were filtered using a degree score threshold >15.
Western blotting analysis
In line with specific instructions, western blotting analysis was carried out. To be specific, both OC cells were processed with 48-h SAF treatment (0, 20 and 40 µM), and harvested for lysis with RIPA lysis buffer. The protein contents were measured by bicinchoninic acid (BCA) protein detection kit. A total of 30 μg protein aliquots from total cell lysates were exposed to sodium dodecyl sulfate-polyacrylamide gel electrophoresis (SDS-PAGE) for separation prior to wet transfer on the polyvinylidene difluoride (PVDF) membrane. Thereafter, the membrane was blocked using 5% defatted milk within tris-buffered saline (TBS; consisting of 0.1% Tween 20, pH 7.6) for a 1-h period under ambient temperature, incubated using primary antibodies (EP300, caspase-3, cleaved caspase-3, Bcl-2, Bax, PI3K, phospho-PI3K, AKT, phospho-AKT, p-AKT, and GAPDH form CST) overnight and later incubated using corresponding secondary antibodies (goat anti-rabbit and anti-mouse IgG (H+L) secondary antibodies from Abcam) for a 1-h period under ambient temperature. Protein bands were exposed using the ECL imaging system (Clinx, Shanghai, China), while Image Lab v. 3.0 (BioRad Laboratories, Hercules, USA) was adopted for intensity examination.
Statistical analyses
We performed an experiment on at least 3 independent samples. We used GraphPad v. 6 (GraphPad Software, La Jolla, USA) for statistical analysis. The value was expressed in the form of all data points. We used a nonparametric test due to small sample sizes. The comparison among groups was performed using the nonparametric Kruskal–Wallis test, followed by Dunn’s test to compare variables among the groups. A p < 0.05 was considered to be statistically significant.
Results
Salvianolic acid F suppressed cell proliferation
To evaluate the effect of SAF on suppressing proliferation, we treated OVCAR-3 and SK-OV-3 OC cells with SAF. Following exposure, CCK-8 assays were conducted at various concentrations and time points, revealing that SAF inhibited OC cell proliferation in a dose- and time-dependent manner. In addition, SAF inhibited OVCAR-3 and SK-OV-3 cell viability, with superior inhibitory effects observed at 72 h in a dose-dependent manner (Figure 1). Cisplatin was selected as the positive control due to its established approval as a systemic therapy for OC.17 After 48 h of SAF treatment, the 50% inhibitory concentrations (IC50) for OVCAR-3 and SK-OV-3 cells were determined to be 28.89 µM (27.20–30.65 μM) and 29.94 µM (27.79–32.22 μM), respectively. Furthermore, the EdU assay demonstrated a significant reduction in EdU-positive OVCAR-3 and SK-OV-3 cells following 48-h SAF exposure at 20 and 40 µM (Figure 2). These findings indicate that SAF effectively reduces OC cell viability.
Salvianolic acid F inhibited cell migration and invasion
To evaluate the effect of SAF on OC cell mobility, we treated OVCAR-3 and SK-OV-3 cells with 40 µM SAF while performing the Transwell assay. The results demonstrated that SAF at 20 and 40 µM effectively inhibited OC cell migration in vitro (Figure 3) Additionally, in vitro invasion assays revealed that SAF at 40 µM significantly suppressed the invasive capacity of OVCAR-3 and SK-OV-3 cells (Figure 4) Collectively, these findings indicate that SAF markedly impairs the migration and invasion of OC cells.
Salvianolic acid F promoted cell apoptosis
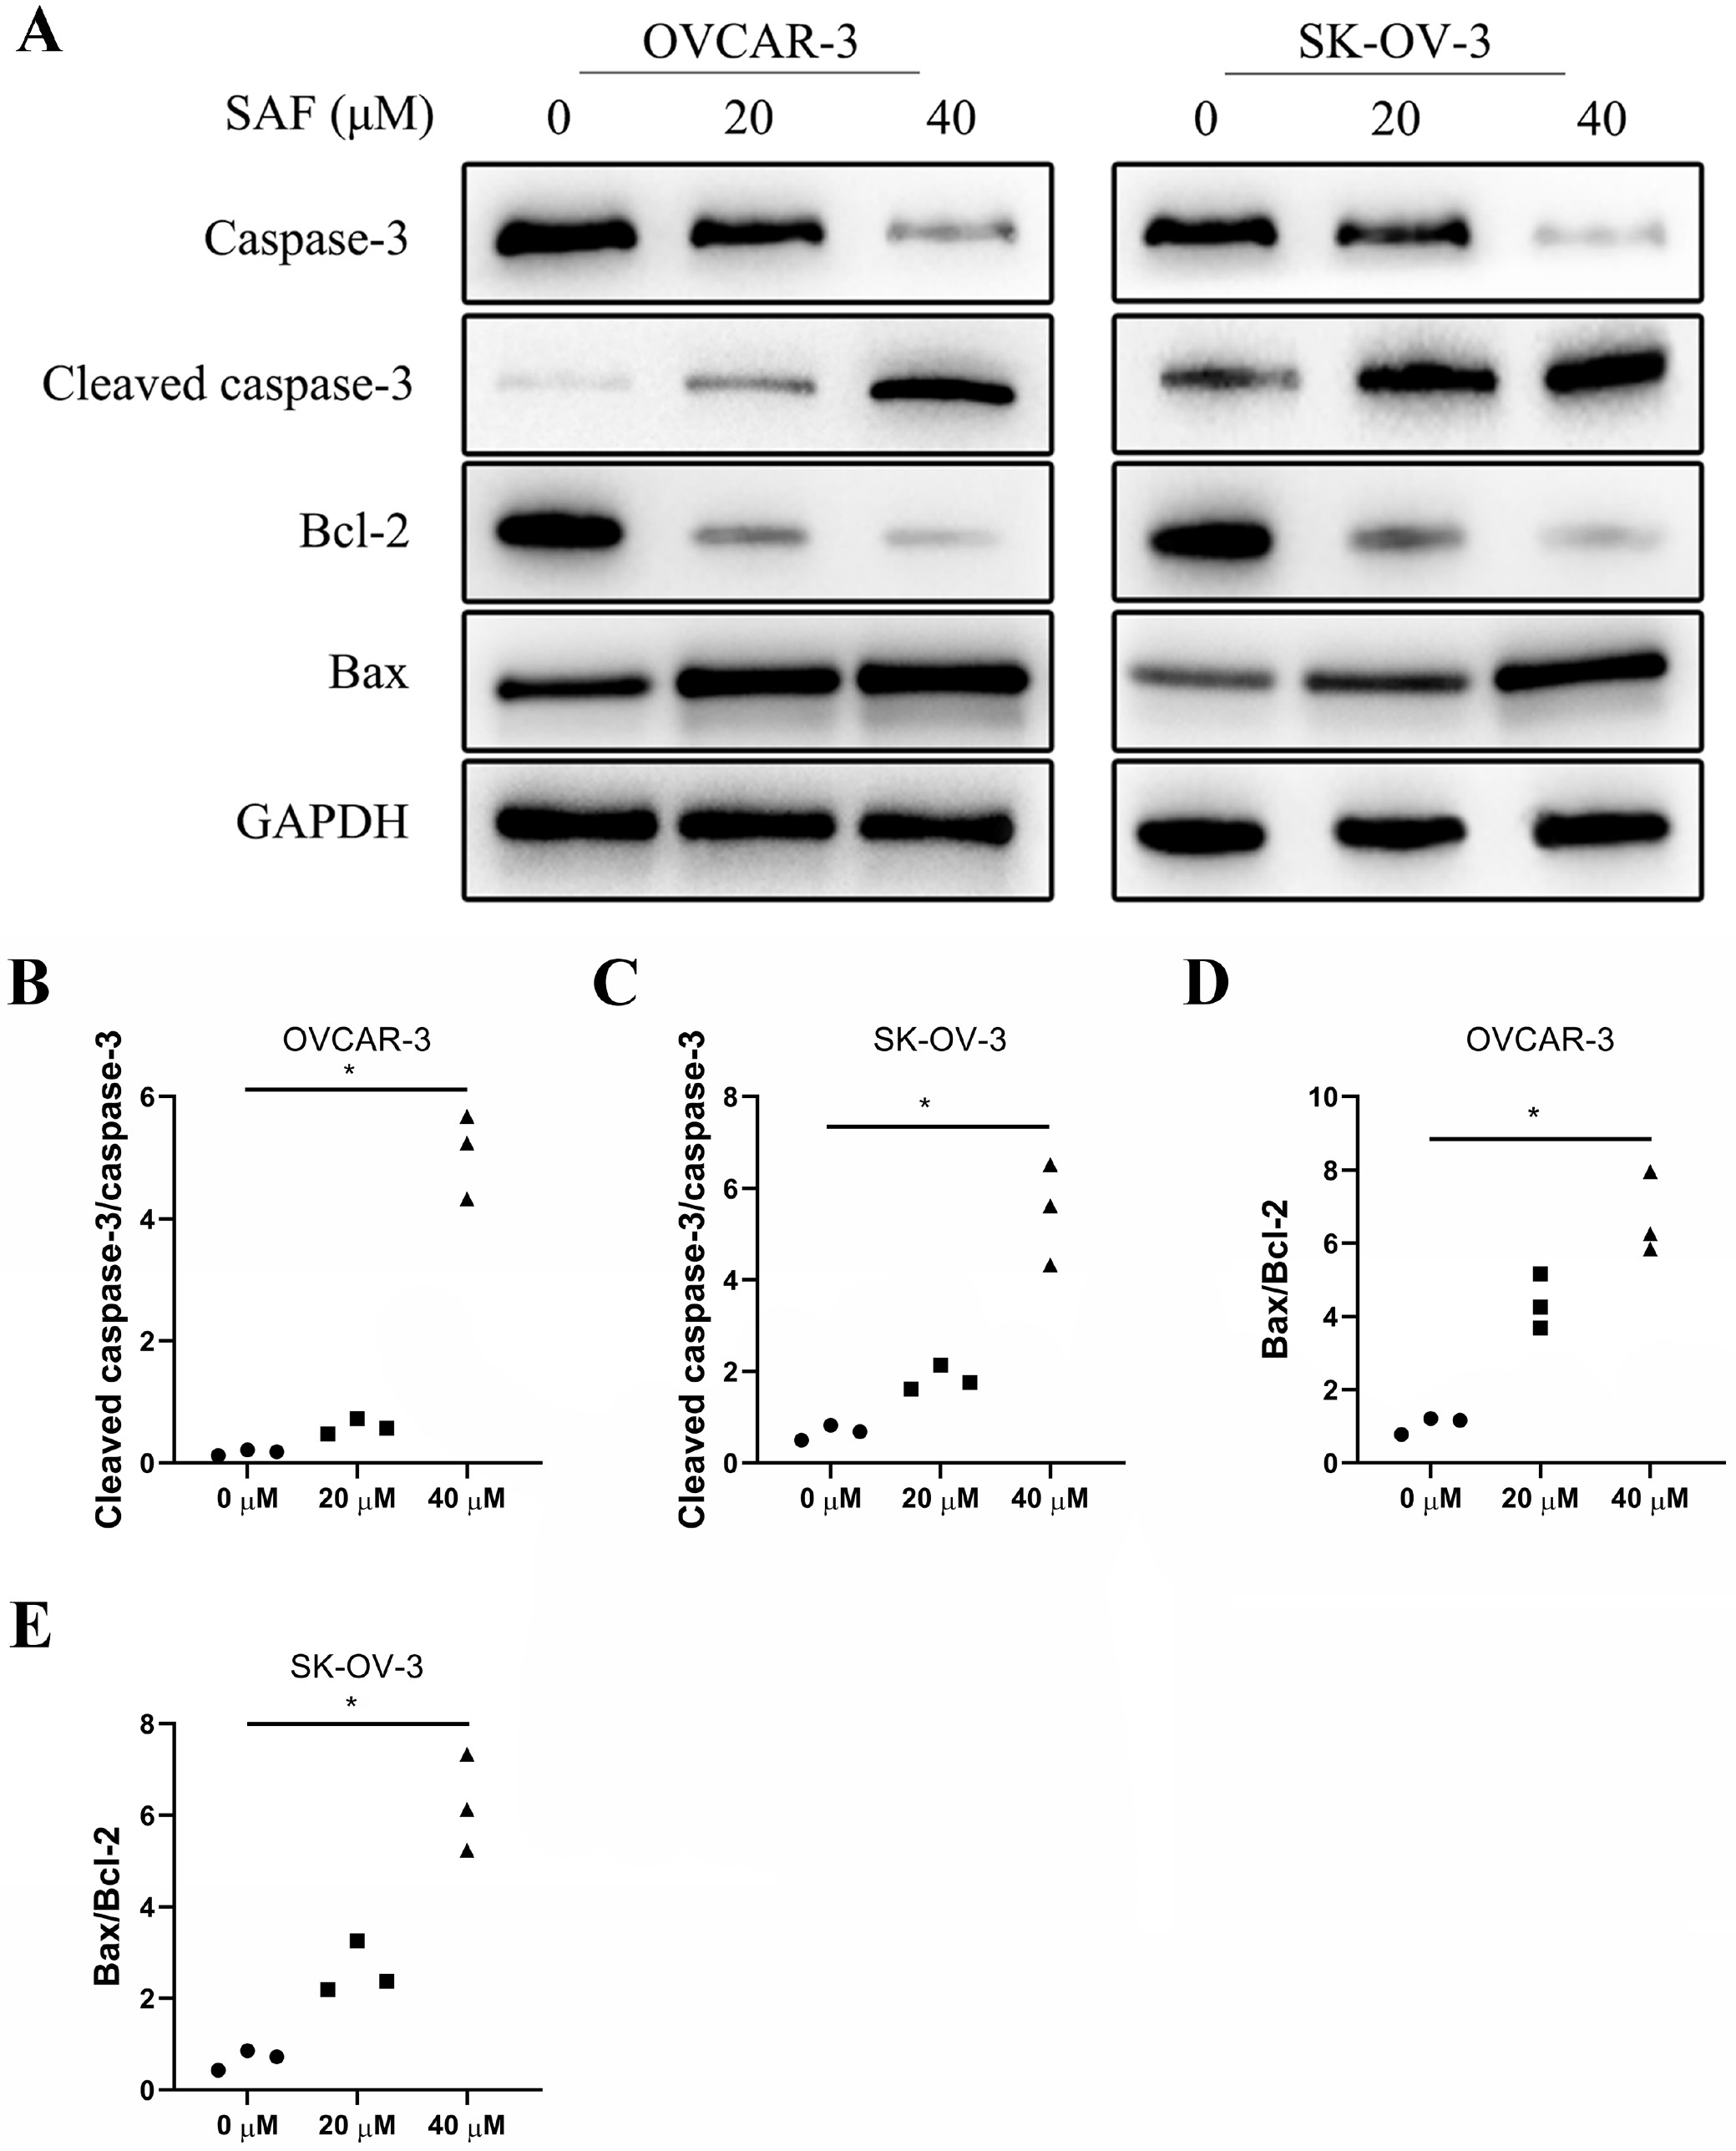
Flow cytometry was performed to examine the role of SAF in apoptosis using Annexin V-FITC/PI double staining in OVCAR-3 and SK-OV-3 cells. After 48 h of SAF treatment (40 µM), treated cells exhibited a significantly elevated apoptosis rate in a dose-dependent manner compared to untreated cells (Figure 5) To investigate the mechanism by which SAF induces apoptosis, we performed western blot analysis to assess caspase-3 expression. The results showed that SAF significantly increased caspase-3 cleavage in a dose-dependent manner compared to control cells (Figure 6A–C). Moreover, SAF treatment led to a dose-dependent decrease in Bcl-2 expression and an increase in Bax expression relative to control cells (Figure 6A,D,E) These findings suggest that SAF promotes apoptosis by enhancing caspase-3 cleavage.
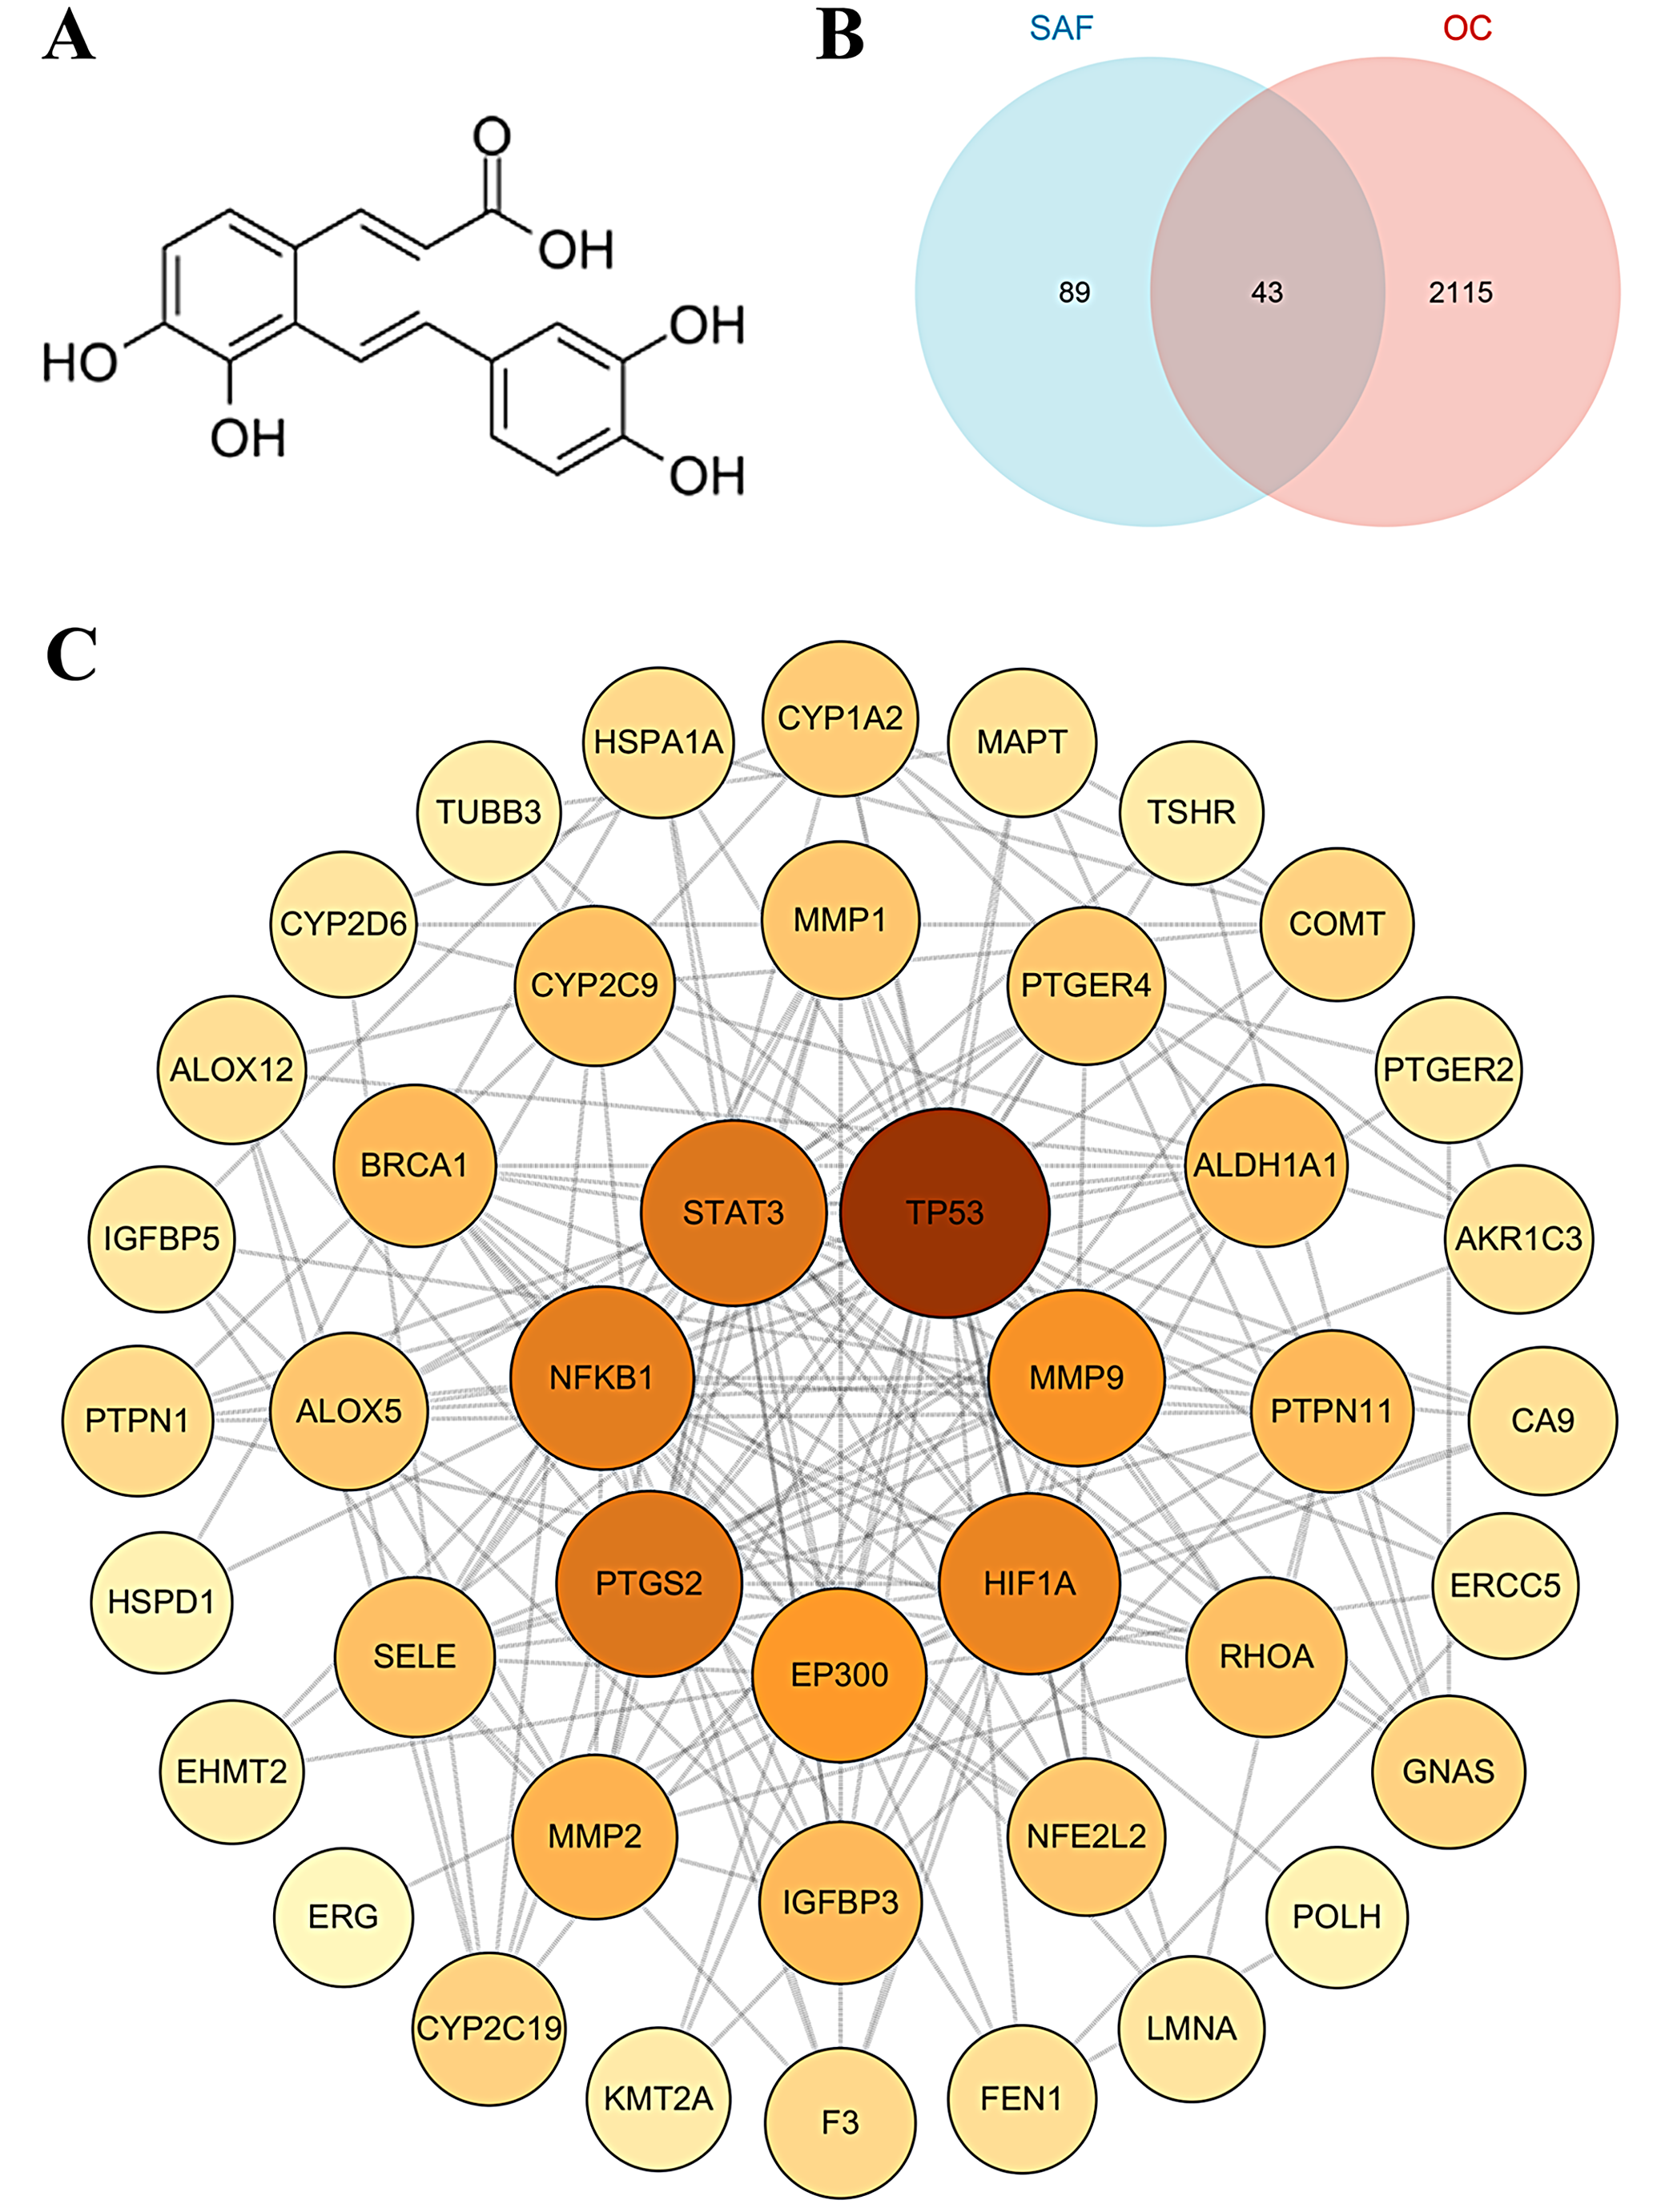
The target prediction of SAF in OC
The chemical structure of SAF is shown in Figure 7A. A total of 132 target proteins were predicted for SAF, while 2,158 disease-associated targets were identified for OC. Interaction analyses between these datasets identified 43 common targets, which were considered potential anti-OC targets of SAF (Figure 7B). Further network analysis using Cytoscape 3.6.1 identified key core targets, including TP53, EP300, STAT3, MMP9, NFKB1, HIF1A, and PTGS2 (Figure 7C).
Salvianolic acid F suppressed EP300/PI3K/AKT pathway
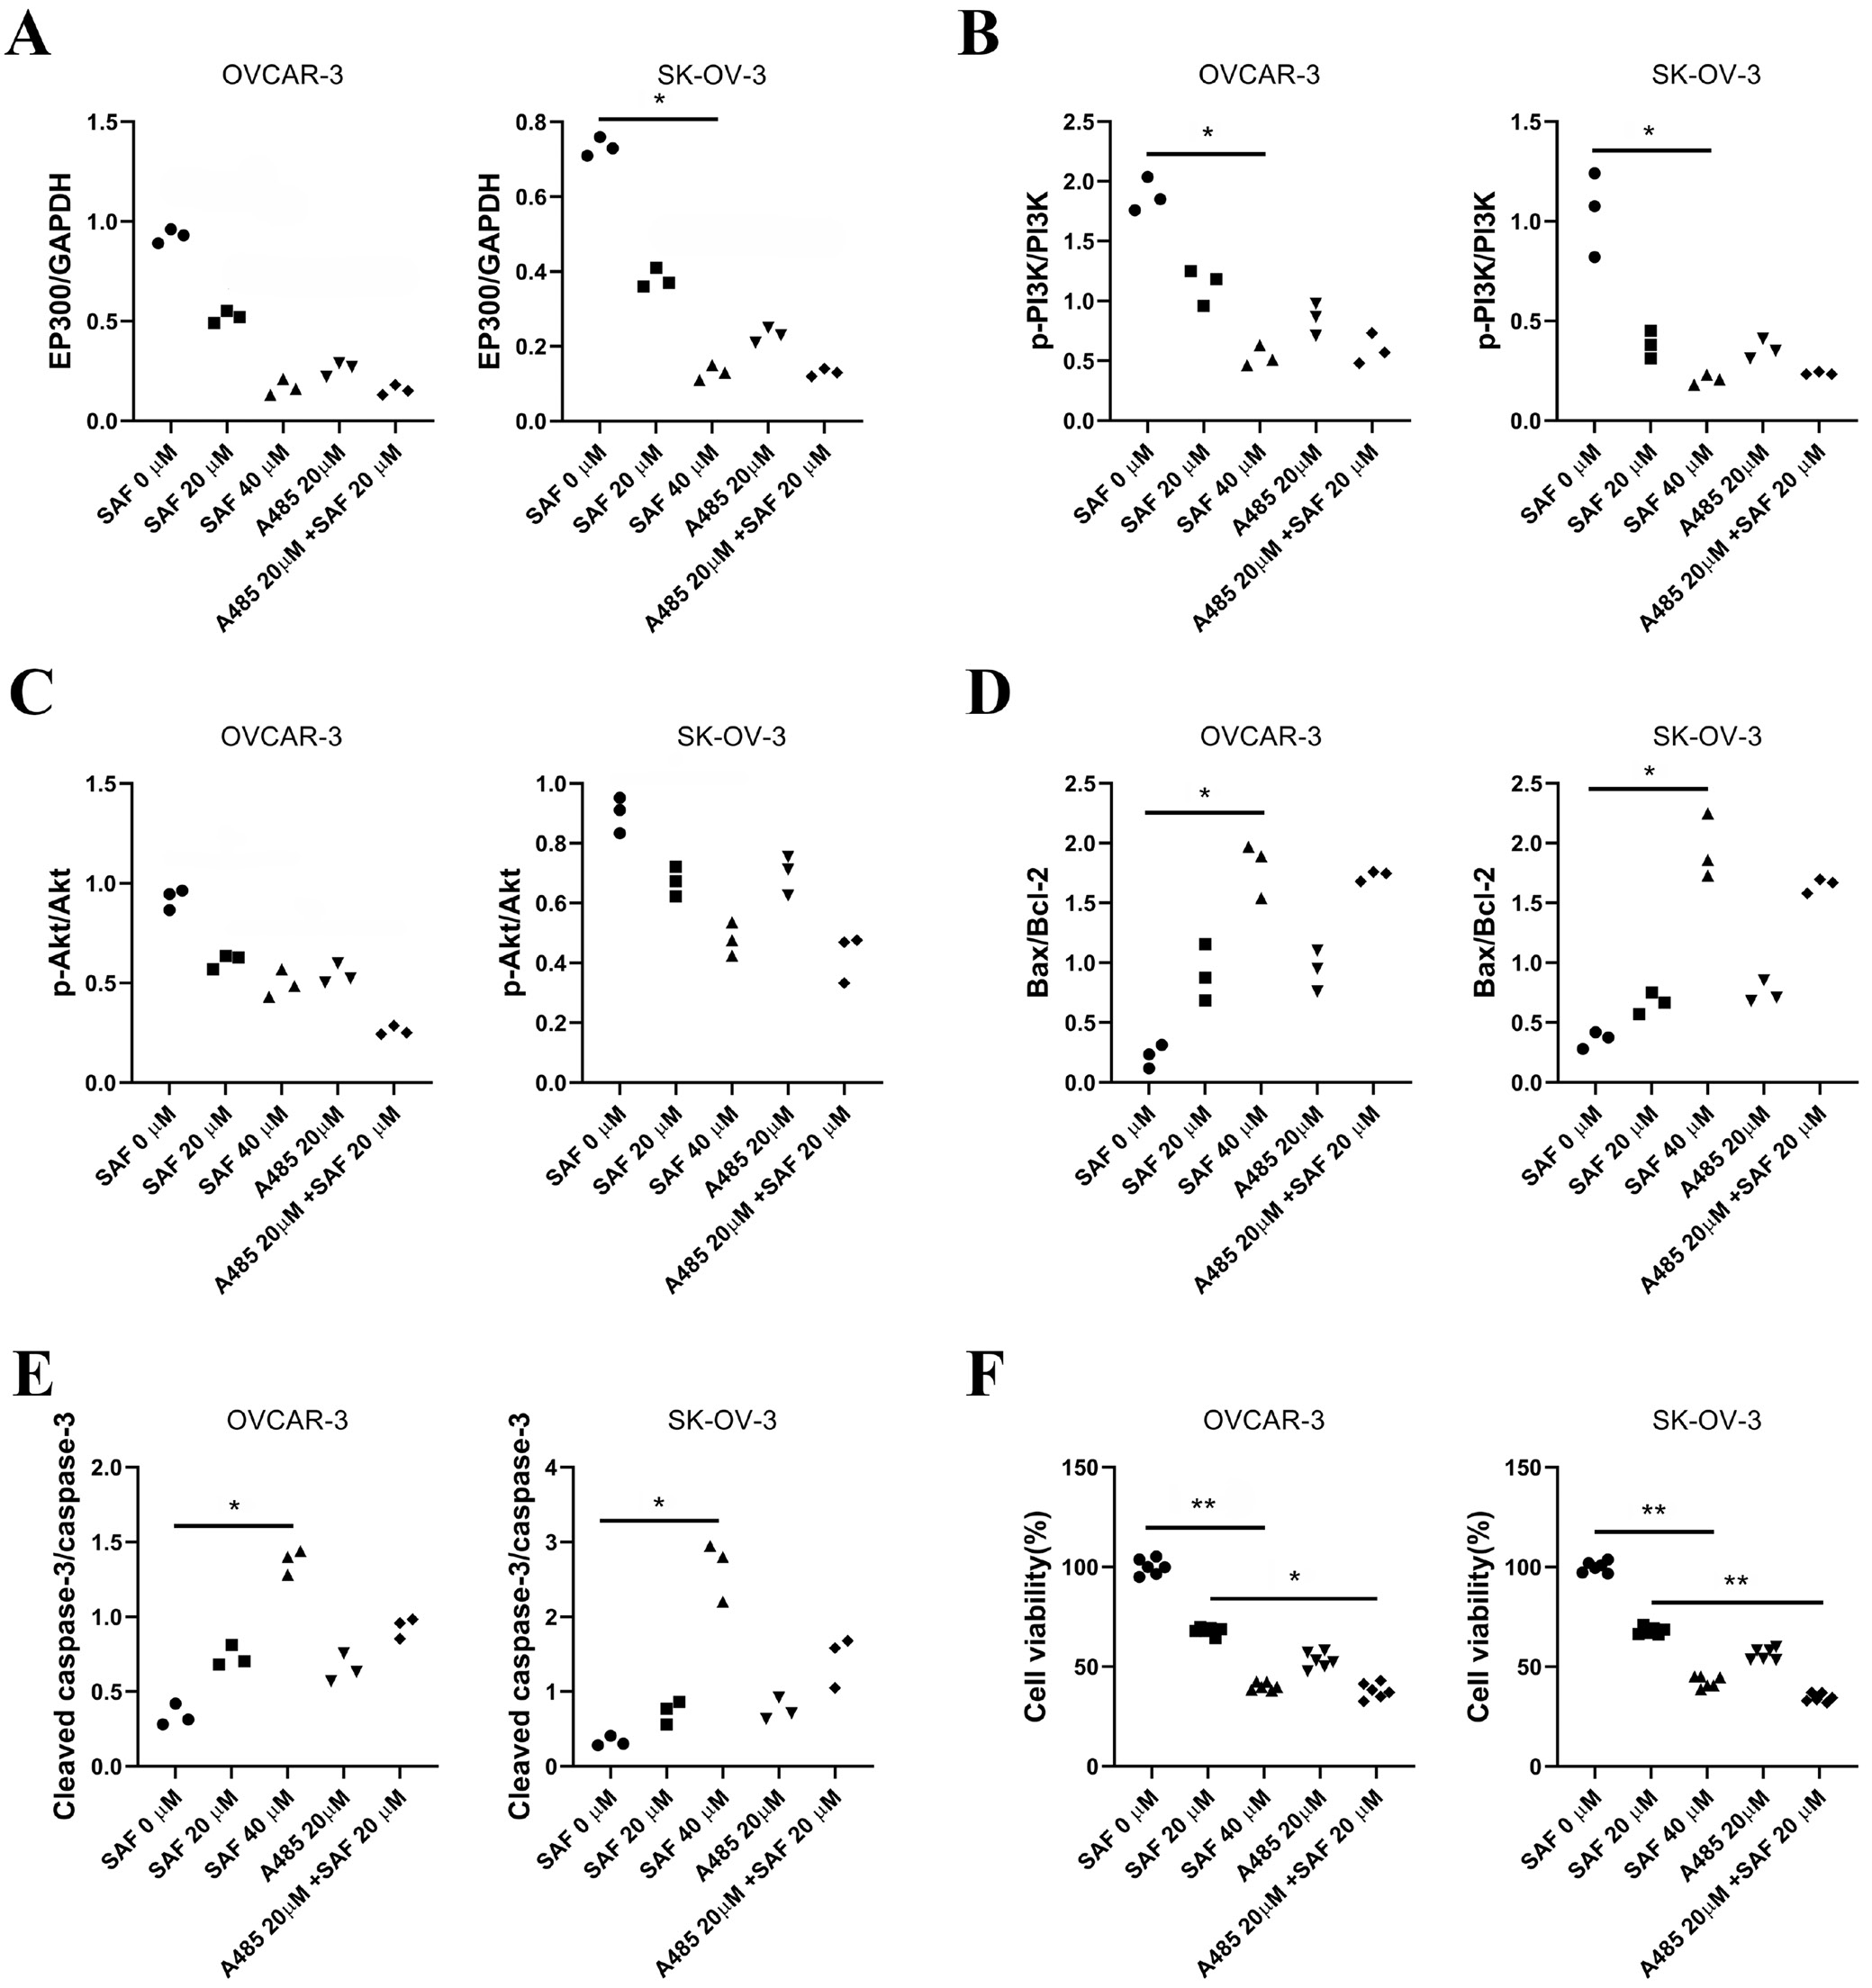
EP300 has been reported to regulate tumor cell growth, differentiation and migration through the PI3K/AKT signaling pathway. To explore the mechanism by which SAF suppresses cell progression, we performed western blot analysis to assess the EP300/PI3K/AKT pathway. The results showed that EP300, p-PI3K/PI3K, Bax/Bcl-2, and cleaved caspase-3/caspase-3 ratios were significantly reduced in 40 μM SAF-treated cells compared to untreated controls (Figure 8A,B, Figure 9) Furthermore, the addition of A485 significantly enhanced the inhibitory effect of SAF on cell viability (Figure 9F). These findings suggest that SAF suppresses the EP300/PI3K/AKT signaling pathway, and the combination of A485 and SAF may further enhance SAF-induced cytotoxicity.
Discussion
Platinum-based chemotherapy remains the primary treatment for advanced or relapsed OC. However, clinical studies over the past 3 decades suggest that it has not significantly improved overall survival rates. In clinical practice, many patients develop relapse disease following first-line chemotherapy, suffer from severe chemotherapy-related side effects and exhibit poor prognostic outcome.18, 19 An essential aspect of chemotherapy is that the incorporation of targeted therapy drugs can enhance its efficacy or mitigate side effects.
Salvia miltiorrhiza has been used in TCM for thousands of years. Among its extensively studied phenolic acids are DSU, salvianolic acid A (SAA), SAB, and salvianolic acid C (SAC).20 Salvianolic acid A extracted from SM was found in experiments in vitro to suppress A549 cell viability.21 Salvianolic acid B could activate renal autophagy through microRNA-145-5p/PI3K/AKT pathway to attenuate membranous nephropathy.22 Notably, SAB demonstrated a significant inhibitory effect on the growth of OC SKOV3 cells while promoting their apoptosis. This effect may be mediated through downregulation of livin expression, upregulation of caspase-3 expression and cell cycle arrest.23
In addition, the chemical shifts observed in ¹H-NMR and ¹³C-NMR for salvianolic acid Y (SAY) are similar to those of SAB. Moreover, the cell protection rate of SAY was 54.2% in rat pheochromocytoma line PC12, significantly higher than the 35.2% of SAB.24 Hence, there is a need and necessity to further study the role of SAY in OC. Salvianolic acid C was discovered to enhance bone marrow mesenchymal stem cells (BMMSCs) osteogenic differentiation among osteoporotic rats through activation of AMPK/SIRT1 pathway.25 Salvianolic acid F was also the major effective component with promising antitumor activity.16 However, its function in OC is still unclear.
Cell apoptosis is a fundamental process of cell death and is closely linked to tumorigenesis.26 The Bcl-2 family of proteins plays a pivotal role in regulating apoptosis, with Bax and Bcl-2 being key mediators of this process.27 Specifically, Bax can activate or inhibit Bcl-xL and Bad, while Bcl-2 functions to suppress Bax, thereby preventing apoptosis. The Bax/Bcl-2 ratio, rather than the individual protein levels, is a critical factor in determining apoptosis susceptibility.28 The caspase family plays a critical role in regulating the above process.29 According to our results, Bax and cleaved-caspase-3 expression were elevated, whereas Bcl-2 expression was decreased after SAF treatment, while the Bax/Bcl-2 ratio was evidently increased in vitro. Therefore, the SAF-mediated cell death was partly controlled by Bax/Bcl-2 and caspase-dependent apoptosis.
To investigate the potential mechanism of SAF in anti-OC, we conducted a network pharmacological analysis and screened 7 central proteins (TP53, EP300, STAT3, MMP9, NFKB1, HIF1A, and PTGS2), which might be involved in the process of SAF inhibiting OC. These proteins have been validated to participate in the regulation of OC cells proliferation, migration and apoptosis.30, 31, 32, 33, 34, 35 E1A-binding protein p300 (EP300) can regulate cell survival, proliferation and apoptosis through multiple pathways, including the PI3K/AKT signaling pathway.36, 37 E1A-binding protein p300 is a transcription coactivator that regulates gene expression through acetylation of histones and non-histone targets. It plays a crucial role in cell cycle regulation, DNA repair and apoptosis.37 Studies have shown that EP300-mediated acetylation inhibits the activity of FOXO transcription factors, thereby regulating gene expression and influencing cell survival and apoptosis through the PI3K/AKT signaling pathway.38, 39
In this study, SAF significantly suppressed EP300 expression and the PI3K/AKT pathway, with its inhibitory effect further enhanced by the addition of A485, an EP300 inhibitor. Additionally, SAF markedly upregulated Bax and cleaved caspase-3 expression in OVCAR-3 and SK-OV-3 cells, a process further facilitated by EP300 inhibition. Moreover, the combination of SAF and EP300 inhibitors significantly enhanced the suppression of cell viability. These findings suggest that the EP300/PI3K/AKT signaling pathway plays a pivotal role in the anti-OC effects of SAF.
Limitations
Although this study revealed that SAF inhibits ovarian cancer cell growth, migration and invasion, and promotes cell apoptosis by suppressing the EP300-mediated PI3K/AKT pathway, there are still some limitations. First, the study is primarily based on in vitro cell experiments, lacking support from in vivo experimental data. Therefore, the anti-tumor effects of SAF in a living organism and its potential toxicity require further validation. Second, while the core targets identified through network pharmacology analysis (such as TP53, EP300, STAT3, etc.) provide direction for mechanistic research, not all targets have been experimentally validated, leaving potential mechanisms undiscovered. Additionally, this study only selected 2 cell lines, SK-OV-3 and OVCAR-3, for experiments, which does not account for the heterogeneity of ovarian cancer. Future research should expand to include more cell lines and clinical samples to validate the generalizability of the results. Finally, the specific dosage, administration methods and clinical application potential of SAF need further exploration. These limitations provide directions for future research to more comprehensively evaluate the application value of SAF in ovarian cancer treatment.
Conclusions
Our research initially suggests that SAF plays a potential role in regulating tumor cell proliferation, migration, invasion, and apoptosis, particularly through its possible association with the EP300/PI3K/AKT pathway. These findings provide important insights for further in-depth studies.
Supplementary data
The supplementary materials are available at https://doi.org/10.5281/zenodo.13956748. The package includes the following files:
Supplementary Table 1. The analysis results of data from Figure 1 through nonlinear regression by dose-response-Inhibition (log(inhibitor) vs normalized response–variable slope).
Supplementary Table 2. The analysis results of data from Figure 2 through nonparametric ANOVA (Kruskal–Wallis test) followed by Dunn’s post hoc test with Bonferroni correction.
Supplementary Table 3. The analysis results of data from Figure 3 through nonparametric ANOVA (Kruskal–Wallis test) followed by Dunn’s post hoc test with Bonferroni correction.
Supplementary Table 4. The analysis results of data from Figure 4 through nonparametric ANOVA (Kruskal–Wallis test) followed by Dunn’s post hoc test with Bonferroni correction.
Supplementary Table 5. The analysis results of data from Figure 5 through nonparametric ANOVA (Kruskal–Wallis test) followed by Dunn’s post hoc test with Bonferroni correction.
Supplementary Table 6. The analysis results of data from Figure 6 through nonparametric ANOVA (Kruskal–Wallis test) followed by Dunn’s post hoc test with Bonferroni correction.
Supplementary Table 7. The analysis results of data from Figure 9 through nonparametric ANOVA (Kruskal–Wallis test) followed by Dunn’s post hoc test with Bonferroni correction.
Consent for publication
Not applicable.
Use of AI and AI-assisted technologies
Not applicable.