Abstract
Background. The neuroendocrine system’s role in maintaining bodily homeostasis implicates it in insomnia, suggesting both causal relationships and therapeutic targets. Yet, studies examining the link between metabolic syndrome (MetS) components such as hypertension, elevated blood glucose levels and abnormal cholesterol and insomnia have been inconsistent. Some research suggests a correlation, proposing that metabolic dysfunctions might contribute to sleep disturbances. However, other studies found little to no significant connection, indicating the complexity of this relationship and the potential influence of genetic, lifestyle and environmental factors. These contradictory findings underscore the challenges in fully understanding the intricate interplay between metabolic health and sleep quality.
Objectives. To explore the relationship between MetS and insomnia.
Materials and methods. This study used bidirectional two-sample Mendelian randomization (MR) analysis to determine the causal relationship between the characteristics of MetS components and insomnia. Based on Genome-Wide Association Studies (GWAS) public databases, we explored the causal relationship between waist circumference (WC), hypertension, triglycerides (TG), high-density lipoprotein cholesterol (HDL-C), fasting blood glucose (FBG), and the risk of insomnia. Sensitivity analysis was conducted to evaluate the stability, heterogeneity and potential presence of horizontal pleiotropy in the results.
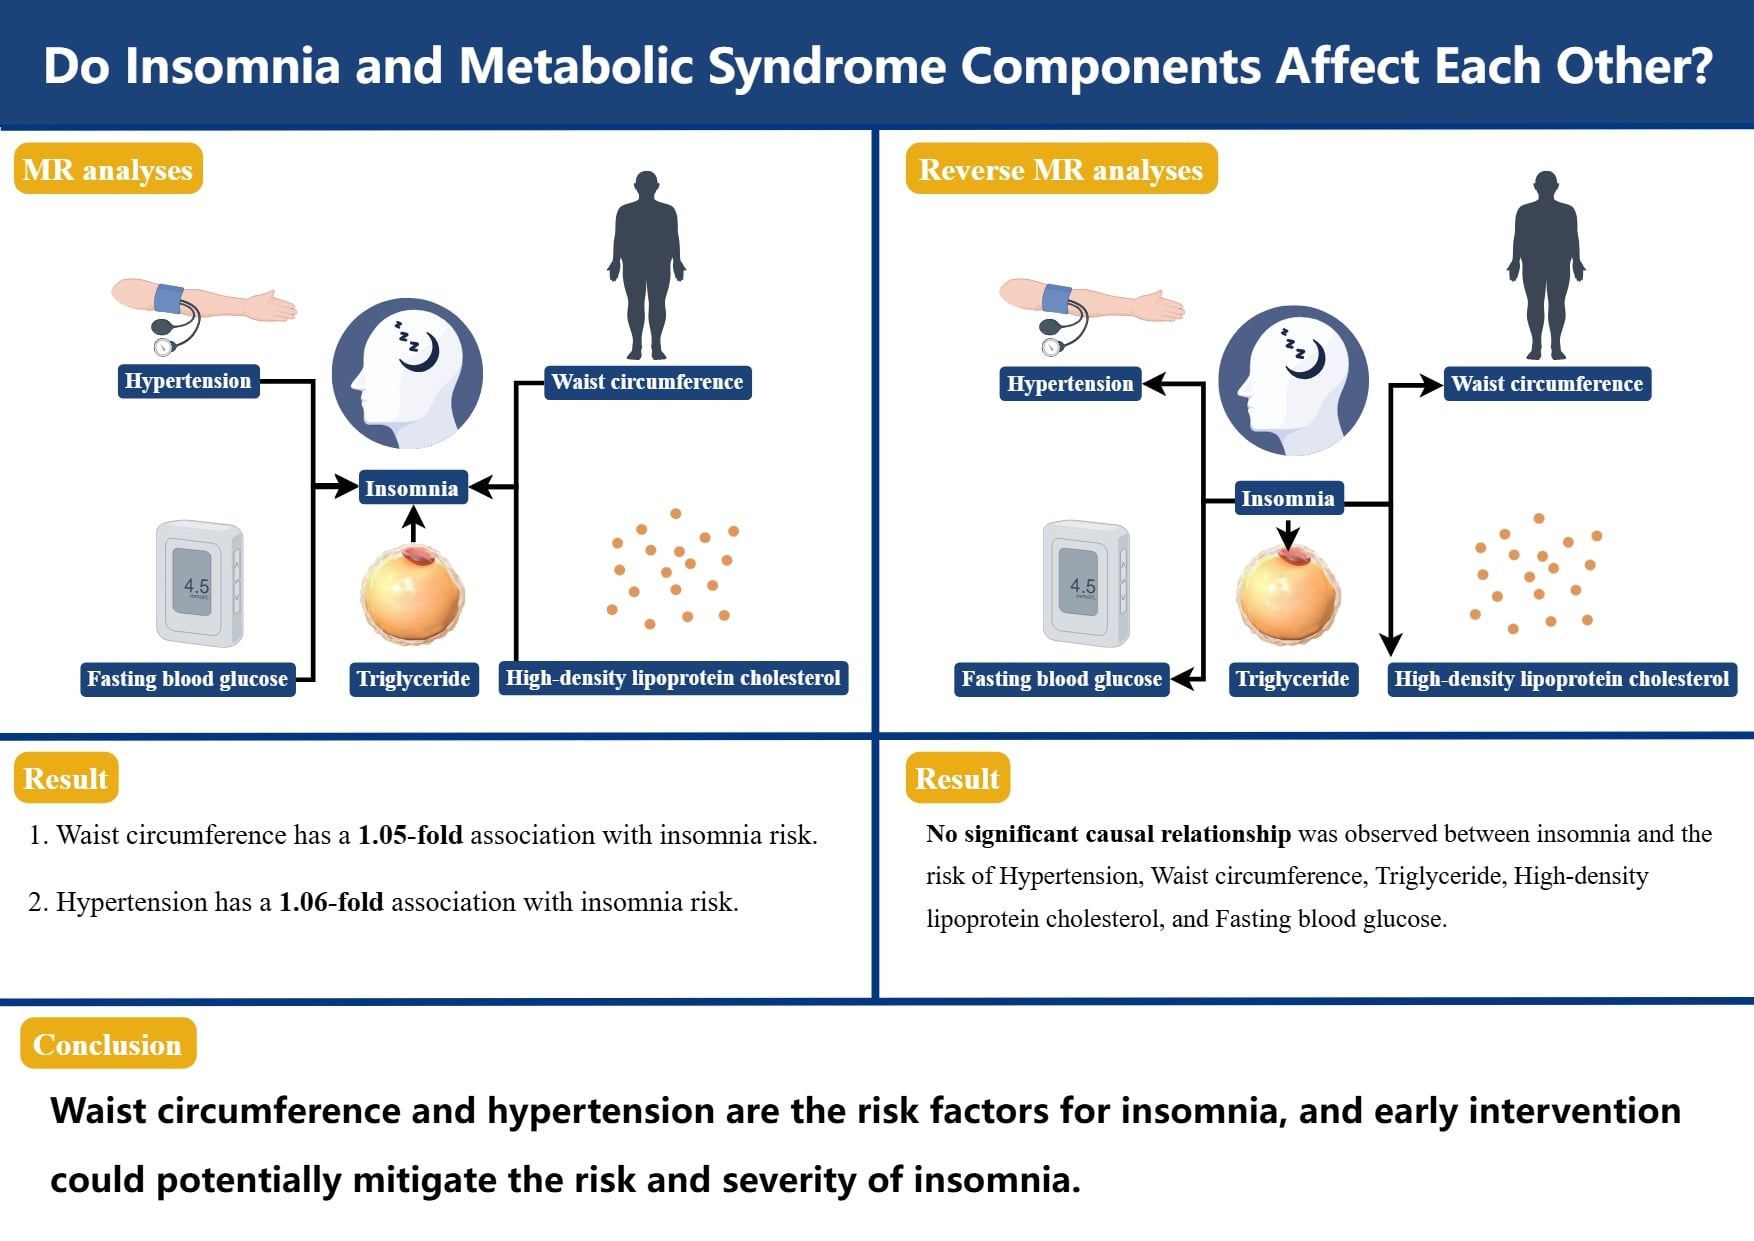
Results. Waist circumference and hypertension were associated with an increased risk of insomnia (WC, odds ratio (OR) = 1.05, 95% confidence interval (95% CI): 1.03–1.06, p = 9.15e–07; hypertension, OR = 1.06, 95% CI: 1.02–1.10, p = 0.005). In the reverse MR analysis, there was no significant causal relationship between insomnia and WC, TG, HDL-C, and FBG.
Conclusions. Our study has demonstrated the close connection between MetS components and insomnia by genetic means, thereby guiding the future research direction of insomnia prevention and treatment.
Key words: metabolic syndrome, insomnia, sensitivity, causal inference, MR analysis
Background
Insomnia is pervasive sleep disorder characterized by poor sleep quality, difficulty initiating or maintaining sleep, and impaired daytime functioning. It is a significant public health issue, affecting over 27% of the global population,1 with prevalence rates as high as 50% in developed countries.2 Chronic insomnia is more than just a sleep problem; it is closely linked to an increased risk of serious mental health conditions, including depression, anxiety and suicidal ideation.3 The impact of insomnia extends beyond mental health; as it also exacerbates various chronic physical conditions, leading to a diminished quality of life and increased healthcare costs. As such, effective management of insomnia is crucial, yet the current reliance on pharmacological treatments presents challenges, including dependency, withdrawal symptoms and adverse effects.4 These limitations underscore the urgent need for identifying and addressing modifiable risk factors to develop more sustainable and effective interventions.
Metabolic syndrome (MetS) is a complex cluster of interrelated metabolic abnormalities, including central obesity, dyslipidemia, hypertension, and impaired glucose metabolism.5 It is a significant contributor to the global burden of cardiovascular disease (CVD), diabetes and mortality.6 Increasing evidence suggests that MetS is not only a marker of metabolic dysfunction but may also play a crucial role in the pathophysiology of sleep disorders, particularly insomnia. The bidirectional relationship between sleep and metabolic health is well documented; poor sleep can lead to metabolic disturbances, while metabolic dysregulation can impair sleep quality.7 Central obesity, for example, is associated with increased pro-inflammatory cytokines, which may disrupt sleep architecture. Similarly, hypertension and dyslipidemia can influence autonomic nervous system function, further contributing to sleep disturbances. However, while the association between MetS and insomnia is recognized, the causal pathways remain inadequately understood, with most studies being limited by observational designs that cannot fully account for confounding factors or reverse causality.
Recent advancements in genetic epidemiology, particularly Mendelian randomization (MR), offer a powerful tool to address these limitations. Mendelian randomization uses genetic variants as instrumental variables to infer causal relationships between exposures (e.g., MetS components) and outcomes (e.g., insomnia), leveraging the random allocation of alleles at conception to mimic the conditions of a randomized controlled trial (RCT). This approach minimizes biases from confounding and reverse causality, providing stronger evidence for causal inference in the relationship between MetS and insomnia. Despite its potential, the use of MR to investigate the causal effects of the MetS on sleep disorders is still in its infancy, with existing studies often limited by small sample sizes and inadequate consideration of potential pleiotropy.
This study aimed to fill these gaps by employing a comprehensive bidirectional two-sample MR approach to investigate the causal relationships between key MetS components (central obesity, hypertension, dyslipidemia, and glucose metabolism) and the risk of insomnia. Furthermore, we explored the potential reverse causality to understand whether insomnia might contribute to the development of MetS. By addressing these complex interactions, this study sought to provide robust evidence that can inform more targeted prevention and treatment strategies for insomnia, ultimately contributing to improved public health outcomes.
Objectives
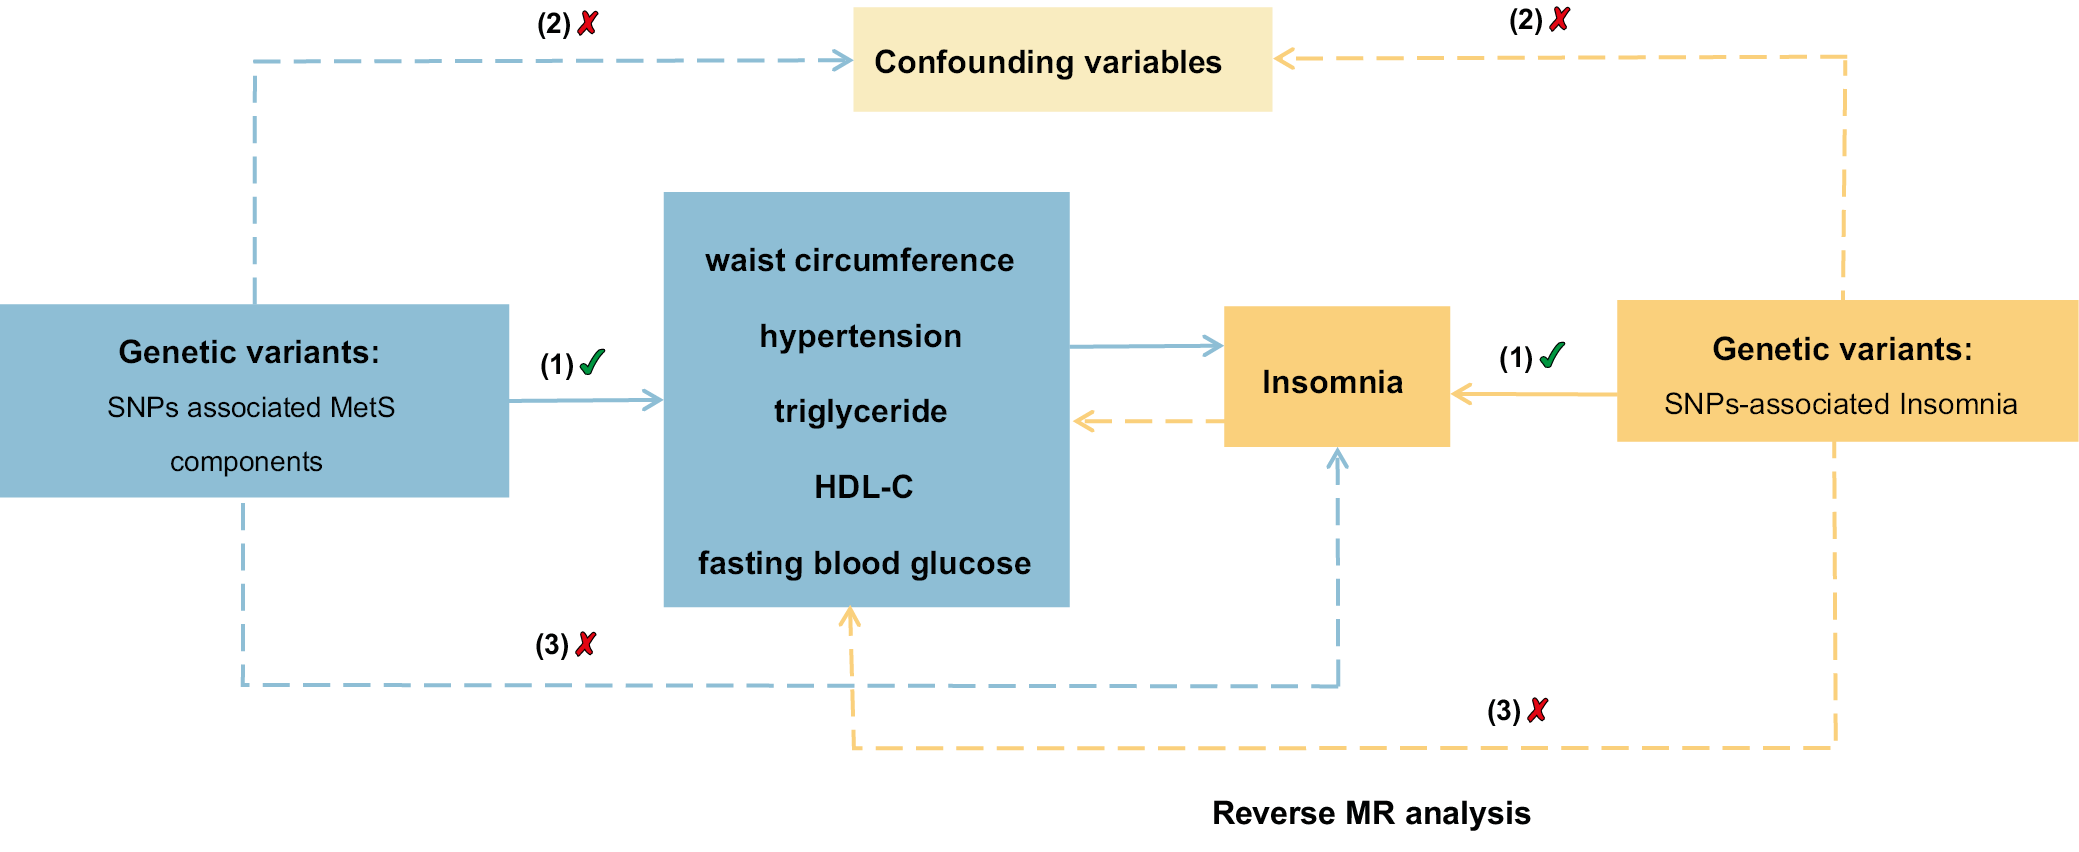
We conducted a comprehensive analysis using a bidirectional two-sample MR approach to gain a thorough understanding of the relationship between insomnia and components of metabolic syndrome. Employing this method, we not only examined the influence of MetS components on insomnia but also explored whether insomnia could potentially influence the development of MetS components. This bidirectional analysis is crucial for verifying the presence of a causal relationship between the exposure (MetS components) and the outcome (insomnia), thus providing a robust framework to explore these complex interactions.
Materials and methods
Study and data sources
The statistics for the components of MetS were obtained from Genome-Wide Association Studies (GWAS) public databases, and data on the waist circumference (WC), hypertension, triglycerides (WC), high-density lipoprotein cholesterol (HDL-C), and fasting blood glucose (FBG) were collected. The meta-analysis conducted by the UK Biobank yielded results for high blood pressure and WC.8 The WC dataset comprised 462,166 samples and 9,851,867 single-nucleotide polymorphisms (SNPs), whereas the hypertension dataset contained 461,880 samples and 9,851,867 SNPs. Triglycerides and HDL-C were obtained from a study conducted by Richardson et al.,9 with 441,016 samples and 12,321,875 SNPs in the TG dataset, and 403,932 samples and 12,321,875 SNPs in the HDL-C dataset. Data on FBG were obtained from the meta-analyses performed by the consortium for glucose and insulin-related characteristics, which encompassed a total of 281,416 samples.10 The GWAS summary statistics for insomnia were obtained from the GWAS public databases,11 which included 462,341 European individuals with 9,851,867 SNPs. Insomnia was diagnosed using the criteria from the International Classification of Diseases, 11th edition (ICD-11). The qualified SNPs are summarized in Table 1.
Statistical methods main analysis
Supplementary techniques such as MR-Egger, MR-PRESSO (Mendelian Randomization Pleiotropy RESidual Sum and Outlier), weighted median (WM), simple mode, and weighted mode were used to evaluate possible diversity and pleiotropy, thereby ensuring the reliability of the primary analysis. MR-Egger provides a dependable estimation of the causal impact by incorporating the intercept term, while also indicating the existence of directional pleiotropy. A significant intercept term indicates the presence of horizontal pleiotropy.12, 13 The MR-PRESSO tool was used to detect and eliminate any influential outliers, thereby enhancing the heterogeneity and horizontal pleiotropy of the analysis.14 The combination of multiple estimates using WM enables the determination of a single overall effect, which remains reliable even if half of the SNPs are considered invalid.15 To explore the potential variation among the chosen independent variables (IVs), the Cochran’s Q test was conducted. In cases where heterogeneity was found in the study, the MR analysis was performed with inverse-variance weighted (IVW) method.
Sensitivity analyses
The leave-one-out analysis was performed to demonstrate the resilience of the findings through sensitivity analyses and examining each SNP,16 which enabled the identification and exclusion of variables that could potentially influence the results. The MR study overview diagram is presented in Figure 1.
Software
All statistical analyses were conducted using the “TwoSampleMR”, “vroom”, “tidyr”, and “forest plot” packages within R v. 4.2.3 (R Foundation for Statistical Computing in Vienna, Austria).
Results
Investigating the impact of components of MetS on insomnia
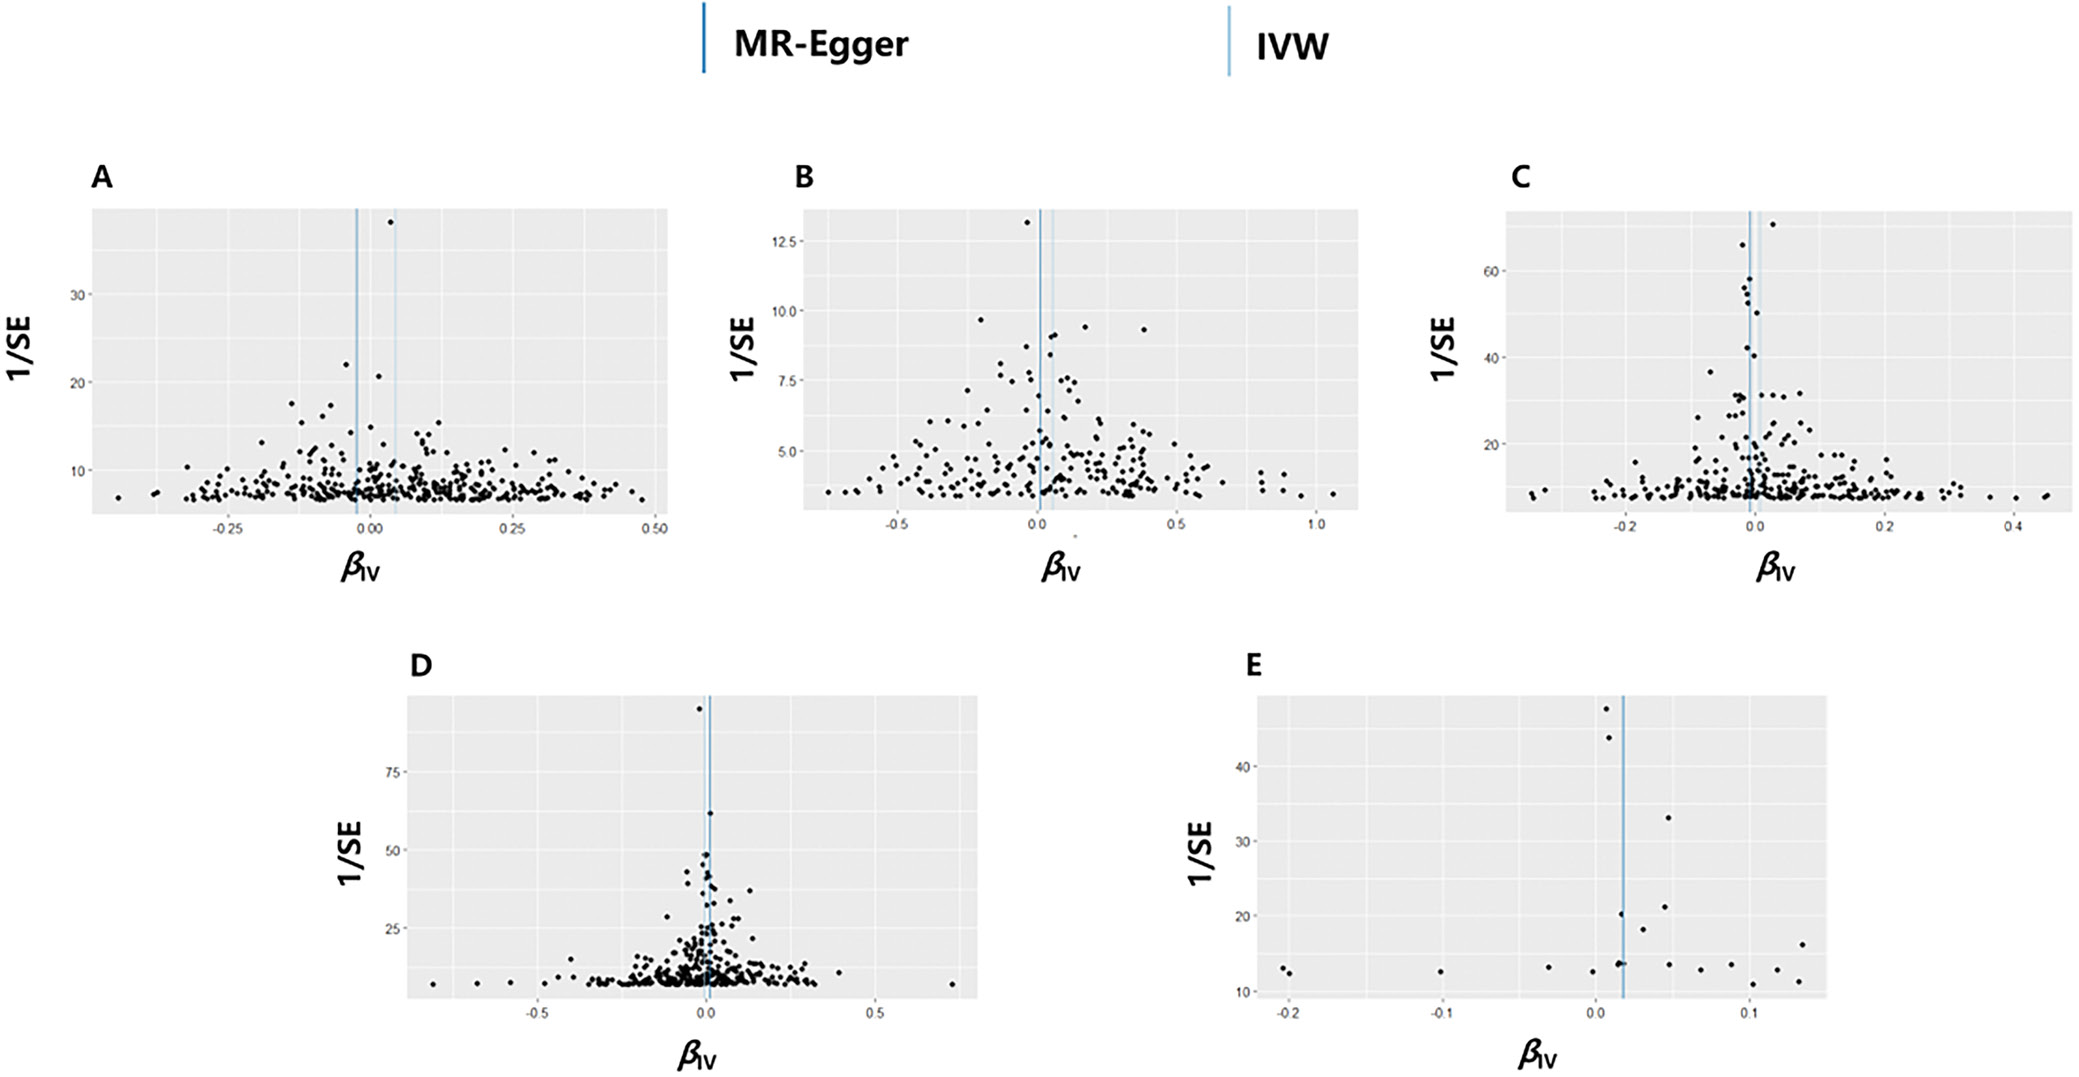
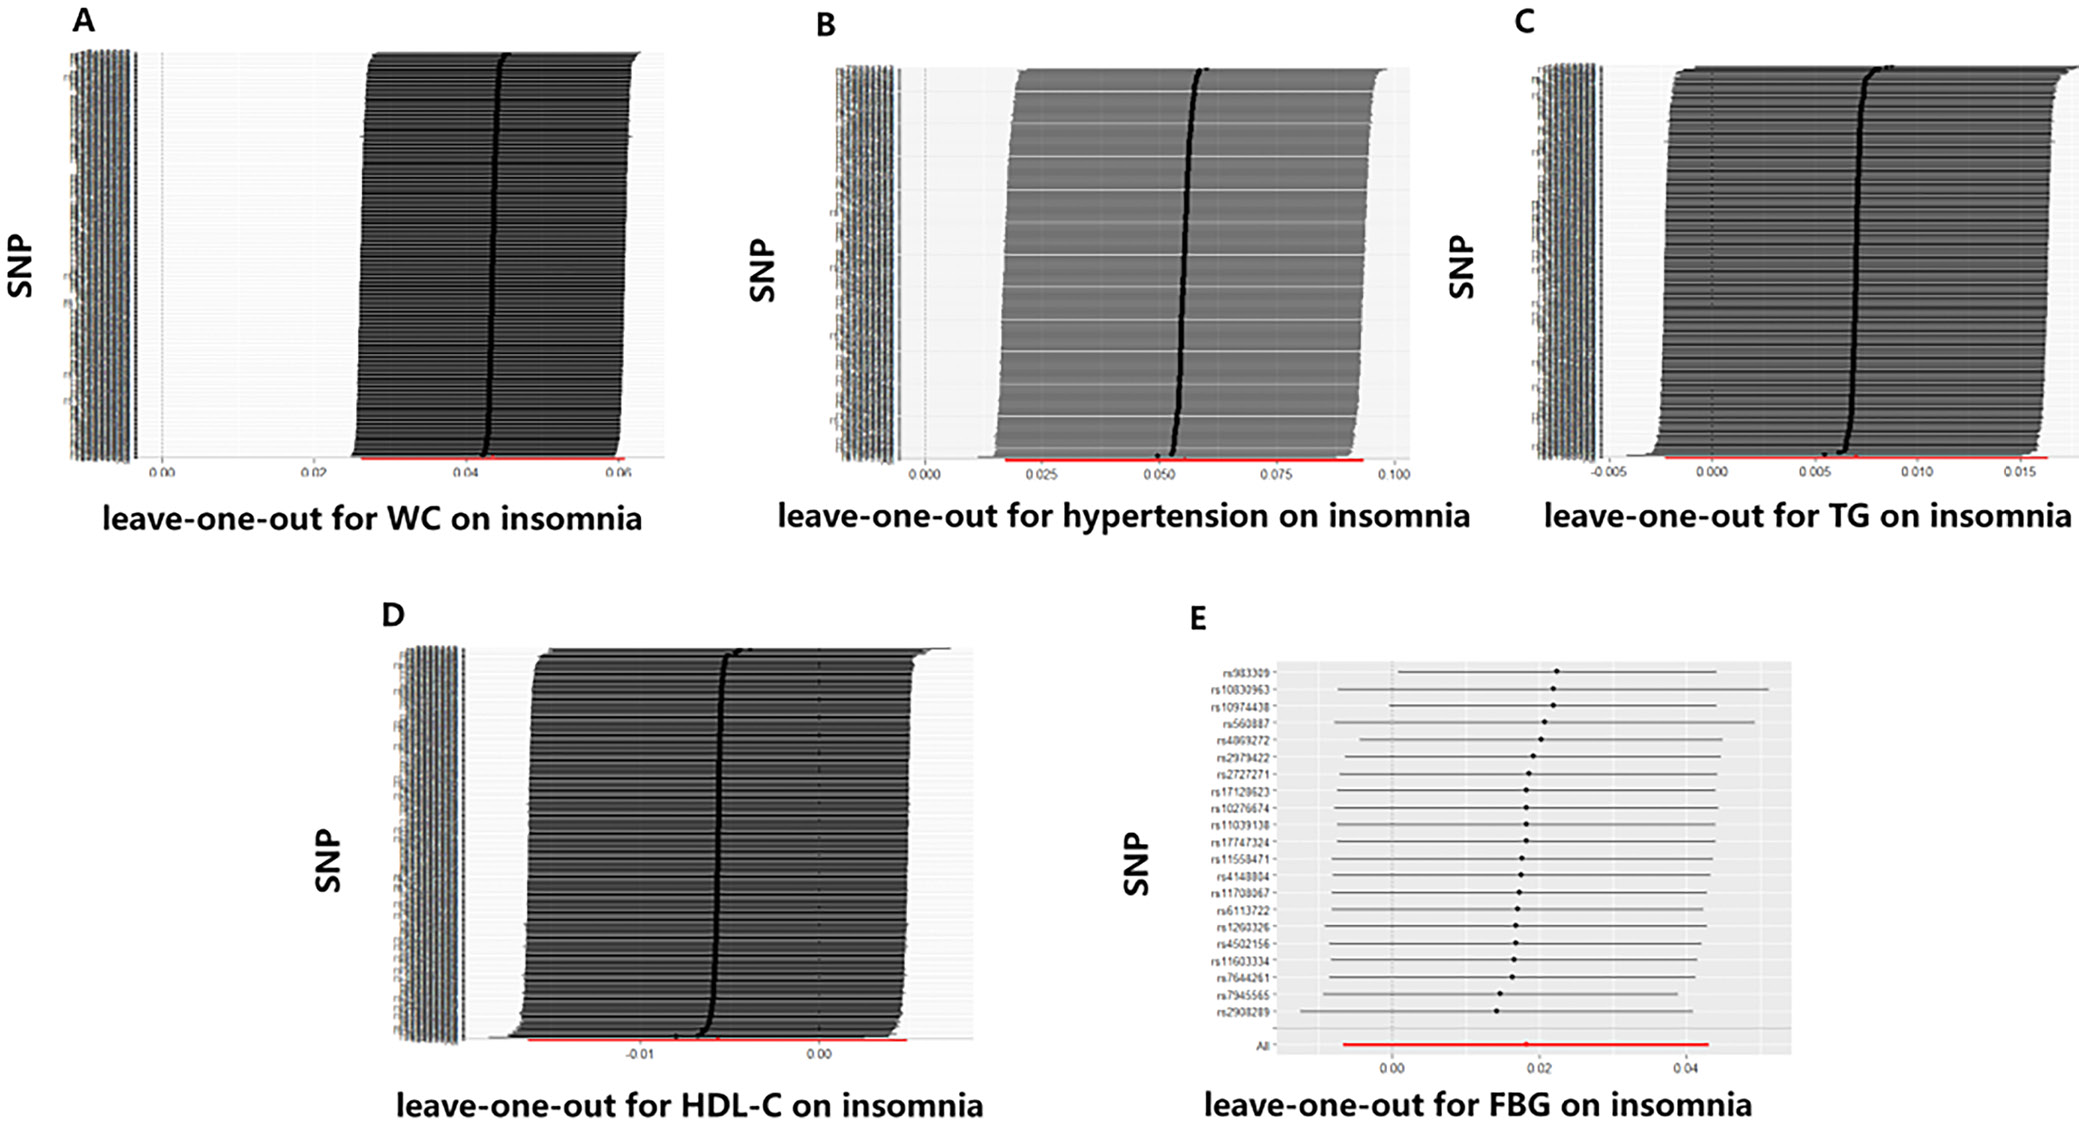
Table 2 displays the findings of MR analyses, indicating that genetically predicted WC has a 1.05-fold association with insomnia risk. Furthermore, hypertension also contributes to an increased risk of insomnia (odds ratio (OR) = 1.06, 95% confidence interval (95% CI): 1.02–1.10, p = 0.005, Table 2). The scatter plot illustrates that as the influence of SNPs on insomnia grows, the impact of SNPs on WC and hypertension becomes stronger, suggesting that WC and hypertension contribute to an increased risk of insomnia (Figure 2). However, no association was found between the genetically instrumented TG, HDL-C, FBG, and the risk of insomnia (pall > 0.05, Table 1, Figure 2). In addition, the MR results exhibited a symmetry, suggesting the absence of heterogeneity (Figure 3). Neither the MR-Egger nor the MR-PRESSO analyses identified any notable outliers. Furthermore, the exclusion of individual SNPs during the leave-one-out analysis did not significantly impact the results (Figure 4).
Investigating the impact of insomnia on components of MetS
The reverse MR analyses indicated insomnia leads to a rise in hypertension levels (OR = 1.10, 95% CI: 1.01–1.19, p =0.031; Supplementary Table 1 and Supplementary Fig. 1). However, the sensitivity analysis did not support a causal association. There was no significant causal relationship observed between insomnia and WC, TG, HDL-C, and FBG (pall > 0.05; Supplementary Table 1). No heterogeneity was detected in the Cochran’s Q test (Supplementary Fig. 2), and no remarkable anomalies were found in the MR-Egger and MR-PRESSO analysis (pall > 0.05). The leave-one-out analysis exhibited no substantial influence when each SNP was individually removed (Supplementary Fig. 3).
Discussion
Our bidirectional MR study presents innovative genetic evidence suggesting that WC and hypertension are causally associated with an increased risk of insomnia. Nevertheless, the reverse MR analysis did not find any causal relationship between insomnia and the components of MetS, suggesting that the observed associations in epidemiological studies may not be bidirectional.
Insomnia and MetS are both significant public health concerns with substantial global burdens. The linkage between these 2 conditions has been highlighted in various epidemiological studies, where patients with insomnia frequently present with metabolic disorders.17, 18 For instance, central obesity, a key component of MetS, is commonly observed among individuals with insomnia. A large-scale study from the EpiHealth cohort in Sweden, involving 18,823 participants, reported that individuals with larger WC had a 2.44 times higher risk of developing insomnia, emphasizing the potential role of obesity in sleep disturbances.19 The underlying biological mechanisms may involve leptin resistance, which is prevalent in centrally obese individuals and disrupts energy balance regulation via the hypothalamus.20 This disruption can activate the hypothalamic–pituitary–adrenal (HPA) axis, leading to elevated levels of corticotropin-releasing hormone (CRH) and chronic stress responses that interfere with sleep.21, 22, 23
Hypertension, another critical component of MetS, also shows a strong association with insomnia.24, 25, 26, 27 Chronic activation of the sympathetic nervous system and the HPA axis in hypertensive individuals may lead to elevated cortisol levels, which are known to disrupt circadian rhythms and impair sleep quality.28, 29 Our findings corroborate previous studies, such as the meta-analysis that found hypertensive patients are at a 1.41 times higher risk of insomnia.30 This is consistent with the pathophysiological understanding that hypertension-induced cortisol elevation can delay sleep onset and reduce deep sleep stages, thereby contributing to insomnia.31, 32
Despite these associations, the relationship between other components of the MetS, such as dyslipidemia and insulin resistance, and insomnia is less clear. Our MR study did not find any causal link between FBG, TG, HDL-C, and insomnia. This contrasts with some observational studies, such as a Hong Kong-based study that suggested a higher FBG level in insomniacs.33 However, the inconsistency may be due to methodological limitations of observational studies, such as confounding and reverse causality, which MR is specifically designed to address. It is also possible that the metabolic pathways linking these factors to insomnia are more complex and involve intermediate variables not captured in our analysis.
Inflammation may play a crucial role in the connection between MetS and insomnia, as both conditions are associated with elevated levels of pro-inflammatory cytokines like C-reactive protein (CRP), tumor necrosis factor alpha (TNF-α) and interleukin 6 (IL-6).34, 35, 36 These cytokines can influence both metabolic processes and sleep regulation. For example, IL-6 has been implicated in both pancreatic islet resistance and sleep disruption.37, 38, 39 The inflammatory hypothesis is further supported by the observation that antihypertensive drugs like eprosartan, which reduce inflammation, can also improve sleep quality in hypertensive patients, suggesting that controlling inflammation could be a potential therapeutic target for insomnia, particularly in patients with MetS.40
Limitations
Several limitations of the current study should be acknowledged. First, despite conducting multiple sensitivity analyses, the presence of horizontal pleiotropy cannot be entirely ruled out, which may have influenced the observed associations. Second, the genetic databases utilized, while comprehensive, lacked the granularity needed for detailed stratified analyses. This limitation restricts our ability to examine how the impact of MetS on insomnia may vary across different demographic groups, such as by age or gender. This could result in an incomplete understanding of how different subgroups might be differentially affected by the relationships between MetS components and insomnia. Additionally, our study focused exclusively on populations of European descent, which raises concerns about the generalizability of the findings to other ethnic groups. Future research should focus on obtaining more detailed genetic and phenotypic data to enable comprehensive subgroup analyses. This will help to unravel the complex and potentially differential causal relationships between MetS and insomnia across diverse populations. Understanding these nuances could lead to more personalized approaches in both prevention and treatment, ultimately improving patient outcomes.
Conclusions
Our bidirectional MR study highlights the complex pattern of interactions between metabolic components and insomnia. The MR analysis supports that WC and hypertension are the risk factors for insomnia, and early intervention could potentially mitigate the risk and severity of insomnia.
Supplementary data
The Supplementary materials are available at https://doi.org/10.5281/zenodo.14844660. The package includes the following files:
Supplementary Table 1. The causal effect of insomnia on MetS components in the reverse MR analysis.
Supplementary Fig. 1. The scatter plots of the association between genetically predicted in the reverse MR analysis. A. Insomnia on WC B. Hypertension; C. TG; D. HDL-C; E. FBG in the MR analysis.
Supplementary Fig. 2. The funnel plots of the association between insomnia and MetS components genetically in the reverse MR analysis. A. WC; B. Hypertension; C. TG; D. HDL-C; E. FBG.
Supplementary Fig. 3. The leave-one-out analysis of the association between insomnia and MetS components genetically in the reverse MR analysis. A. WC; B. Hypertension; C. TG; D. HDL-C; E. FBG.
Data availability
The datasets generated and/or analyzed during the current study are available from the corresponding author on reasonable request.
Consent for publication
Not applicable.
Use of AI and AI-assisted technologies
Not applicable.


