Abstract
Background. Hepatocellular carcinoma (HCC) is the most common type of primary liver cancer, which is characterized by a lack of sensitive and specific biomarkers.
Objectives. This study investigates the association between ELAV-like RNA binding protein 1 (ELAVL1) and HCC patient outcomes.
Materials and methods. This retrospective study encompassed 108 HCC patients who reported to Wuhan Fourth Hospital and Tongji Hospital, China, from January 2016 to August 2020. Clinical data collected included age, sex, body mass index (BMI), comorbidities, tumor-node-metastasis (TNM) stage, Barcelona Clinic Liver Cancer (BCLC) stage, and lymphatic metastasis. All patients received routine follow-up for survival and recurrence status ranged from 36 to 60 months. The serum levels of ELAVL1 were tested using enzyme-linked immuno-sorbent assay (ELISA). Levels of total bilirubin, alanine aminotransferase (ALT), aspartate transaminase (AST), HCC-related biomarkers of alpha fetoprotein (AFP), α-L-fucosidase (AFU), and carcinoembryonic antigen (CEA) were recorded.
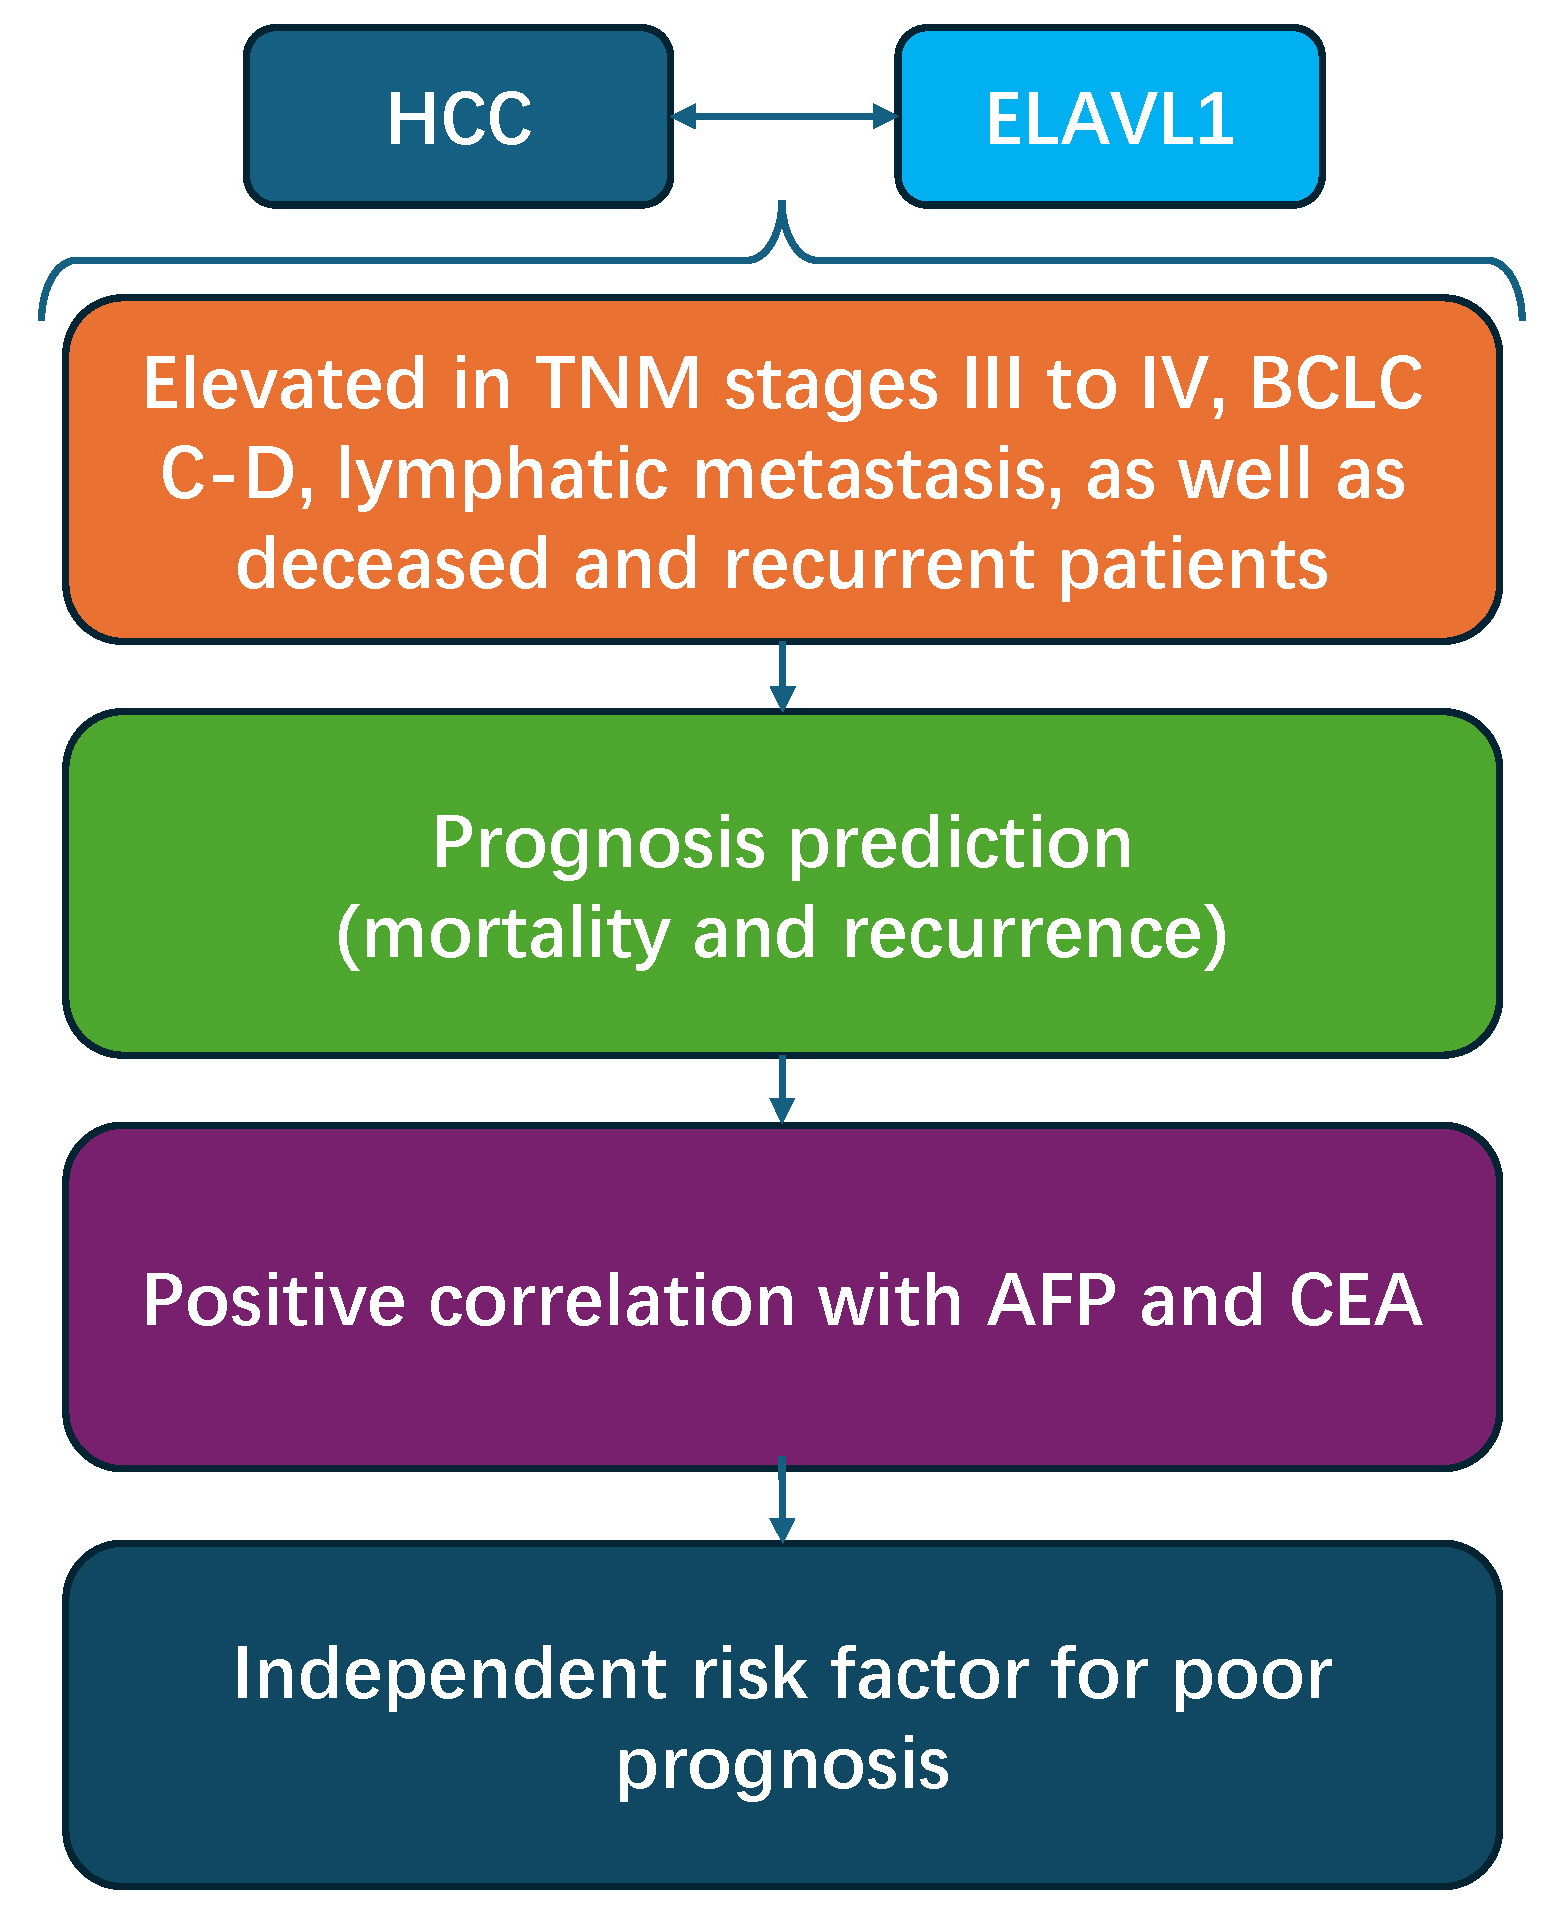
Results. Our findings revealed a significantly higher expression of ELAVL1 in patients presenting with TNM stages III–IV, BCLC stages C–D, lymphatic metastasis, as well as deceased and recurrent patients. Receiver operating characteristic (ROC) curves showed that the areas under the curve (AUCs) for ELAVL1 in predicting mortality, recurrence and poor prognosis (defined as mortality or recurrence) in HCC patients were 0.818, 0.732 and 0.827, respectively. Patients with higher expression of ELAVL1 showed significantly higher frequencies of TNM III–IV stages, BCLC D stage, lymphatic metastasis, higher mortality, and recurrence ratio, as well as higher AFP and CEA levels. ELAVL1 was positively correlated with levels of AFP and CEA. Higher BCLC stage, lymphatic metastasis, age, AFP, and ELAVL1 were independent risk factors for poor prognosis of HCC patients.
Conclusions. Higher serum levels of ELAVL1 are associated with worse clinical outcomes and poorer prognosis in -HCC patients.
Key words: prognosis, hepatocellular carcinoma, retrospective study, clinical outcomes, ELAVL1
Background
Annually, primary liver cancer accounts for over 900,000 new cases (4.7%) and more than 800,000 deaths globally.1 The worldwide incidence rate of primary liver cancer stands at approx. 9.3 per 100,000 individuals, with an estimated mortality rate of 8.5 per 100,000. Notably, China has the highest burden of primary liver cancer, with over 380,000 new cases each year, representing nearly 60% of liver cancer patients across Asia.2, 3, 4 In China, liver cancer is the 4th most common cancer and the 2nd leading cause of cancer-related deaths, with over 300,000 fatalities annually.5, 6 Recent research indicates that among all cancers, patients diagnosed with primary liver cancer and pancreatic cancer exhibit the poorest prognosis in China.2
Hepatocellular carcinoma (HCC), the most prevalent subtype of primary liver cancer, accounts for a significant majority, ranging from 75% to 85%, of all liver cancer cases.7, 8 Despite advances in treatment modalities, including targeted therapy and immunotherapy,9 these approaches often fail to yield satisfactory outcomes for patients with advanced HCC, who continue to face a grim prognosis.10, 11 Recently, the combination of tyrosine kinase inhibitors (TKIs) and immune checkpoint inhibitors (ICIs) has shown higher efficacy and improved outcomes for HCC patients.12 However, these combination treatments still necessitate further research and optimization to enhance their overall effectiveness and tolerability. In the realm of solid cancer diagnostics, histological analysis is regarded as the gold standard, with early detection primarily relying on imaging techniques and the analysis of serum/tissue biomarkers.13 Compared with imaging methods, the detection of biomarkers can provide a more rapid, convenient and affordable method.14 However, traditional biomarkers for HCC, such as alpha-fetoprotein (AFP), α-L-fucosidase (AFU) and carcinoembryonic antigen (CEA), lack sufficient sensitivity and specificity for effective HCC diagnosis.15
ELAV-like RNA binding protein 1 (ELAVL1), an RNA-binding protein, has been implicated in the progression of various cancer types, including prostate cancer,16 gastric cancer17 and breast cancer.18 Nonetheless, the bulk of research to date has been confined to in vitro studies or animal models, with few investigations explicitly addressing the correlation between ELAVL1 and the clinical outcomes, prognosis or diagnostic relevance in HCC patients. Addressing the role of ELAVL1 in the clinical setting emerges as a critical and urgent need.
Objectives
In this study, we aimed to conduct a retrospective investigation to demonstrate the association of ELAVL1 with clinical outcomes and prognosis of HCC patients. This study might provide clinical evidence for novel biomarkers in diagnosis of HCC.
Materials and methods
Patients and study design
This retrospective study encompassed 108 HCC patients who presented to Wuhan Fourth Hospital and Tongji Hospital, China, from January 2016 to August 2020. This study analyzed recorded characteristics of patients and measured the expression of ELAVL1 using previously stored blood samples. The inclusion criteria were as follows: 1) confirmation of primary HCC diagnosis through both imaging techniques and histological analysis; 2) absence of prior treatment for HCC; 4) availability of complete clinical data. Exclusion criteria included incomplete clinical records, metastasis liver cancer or any treatment prior to diagnosis. The study received approval from the Ethical Committee of Wuhan Fourth Hospital and Tongji Hospital, China (approval No. KY2023-102-02).
Data collection of the patients
Clinical data collected included age, sex, body mass index (BMI), hepatitis B virus (HBV) status, hepatitis C virus (HCV) infection alcoholic liver disease, non-alcoholic fatty liver disease (NAFLD)/non-alcoholic steatohepatitis (NASH) and other comorbidities, as well as tumor-node-metastasis (TNM) stage, Barcelona Clinic Liver Cancer (BCLC) stage and lymphatic metastasis. All patients received the standard of care, which included routine follow-ups. The duration of survival and recurrence ranged from 36 to 60 months for all cancer patients treated at our hospital. Patients with less than 6 months of follow-up data were excluded unless deceased earlier. Follow-up concluded upon loss to follow-up or death. Overall survival and disease-free survival were calculated from diagnosis to the last follow-up or death.
Measurement of serum ELAVL1 and other serum indices
Briefly, 5 mL of fasting peripheral blood was collected from all patients at the time of diagnosis. These samples were originally collected for another planned study, which was ultimately not conducted. However, the informed consent obtained from the participants explicitly allowed for the potential use of their blood samples in future research endeavors. The samples were then stored at –80°C until analyzed for this research. The serum levels of ELAVL1 were tested using enzyme-linked immuno-sorbent assay (ELISA) using a human ELAVL1 kit (No. MBS7616762; MyBioSource, San Diego, USA) according to the manufacturer’s instruction. Levels of total bilirubin, alanine aminotransferase (ALT), aspartate transaminase (AST), HCC-related biomarkers of AFP, AFU, and carcinoembryonic antigen (CEA) were tested with cobas® c602/c601 automatic biochemical analyzer (Roche Inc., Indianapolis, USA).
Statistical analyses
The Kolmogorov–Smirnov method was used to assess the distribution of the data (Supplementary Table 1). Non-normally distributed data were expressed as median (range, interquartile range (IQR)), and normally distributed data as mean ± standard deviation (±SD). The Mann–Whitney U test or unpaired Student’s t-test was used for non-normally and normally distributed data, respectively. For the unpaired Student’s t-test, Levene’s test and Welch’s correction were applied to account for heterogeneity of variances. Rates were compared using the χ2 test of independence without rounding. Regression curve estimation and Spearman’s analysis was used for analyzing the correlation. Spearman’s correlation is appropriate for assessing monotonic relationships, whether they are linear or nonlinear. Additionally, regression curve estimation was employed to model the nonlinear relationships between predictors and the binary outcome, providing a more comprehensive understanding of the data. The receiver operating characteristic (ROC) curve evaluated prognostic value and the cutoff value was selected according to the Youden’s index. Multivariable logistic regression identified mortality and recurrence risk factors using the enter method for predictor selection. The Box–Tidwell test and the variance inflation factor (VIF) values were used for measuring the linear relationship and multicollinearity. The Hosmer–Lemeshow goodness-of-fit test was used to assess the fit of the models, and casewise list (studentized residual) was used to identify outliers. Q–Q plots were used to assess the normality of residuals. A p-value <0.05 was considered statistically significant. Analyses were conducted using IBM SPSS v. 22.0 (IBM Corp., Armonk, USA) and GraphPad Prism v. 10.0 (GraphPad Software, Inc., San Diego, USA).
Results
ELAVL1 expression in serum samples of different HCC patients
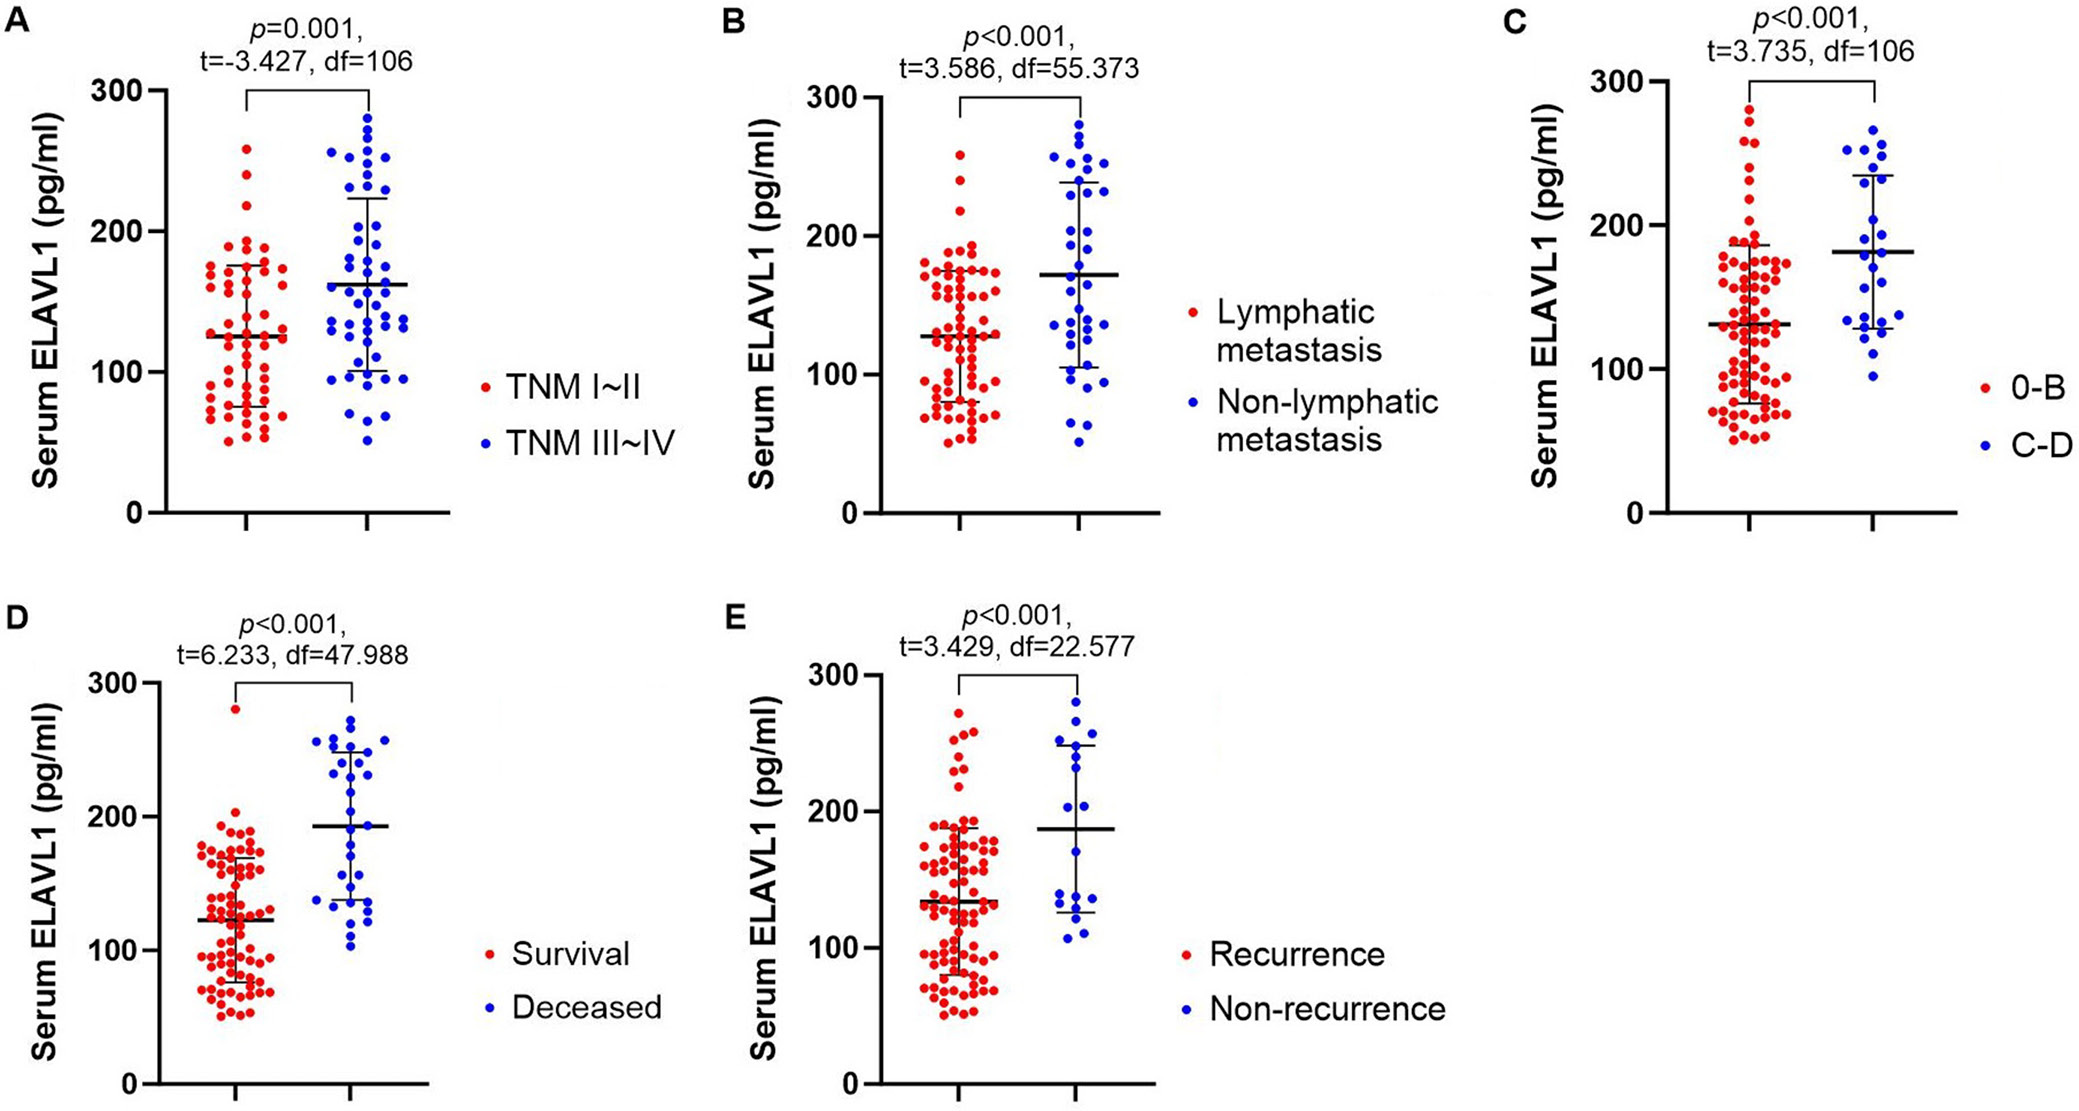
The basic characteristics of all patients were shown in Table 1. Among all patients, 51 (47.22%) patients had TNM stage III–IV, 25 (23.15%) patients had BCLC stage C–D and 37 (34.26%) patients had lymphatic metastasis. A total of 31 (28.7%) patients died during the follow-up. The median follow-up duration was 45 (5–60, 15) months.
First, we detected and compared the serum levels of ELAVL1 in HCC patients (Figure 1A–E). Our findings revealed a significantly higher expression of ELAVL1 in patients with TNM stages III–IV (162.19 ±61.20 pg/mL) and those with lymphatic metastasis (171.85 ±66.74 pg/mL), as well as those with BCLC stages C–D (181.31 ±53.26), in comparison to patients with TNM stages I–II (125.43 ±50.17 pg/mL) and without lymphatic metastasis (127.65 ±47.32 pg/mL), as well as those with BCLC stages 0–B (131.19 ±55.02), respectively. Besides, deceased (192.80 ±55.27 pg/mL) and recurrent patients (187.11 ±61.21 pg/mL) also showed remarkably higher ELAVL1 levels than survival patients (122.66 ±46.49 pg/mL) and non-recurrent (133.93 ±53.89 pg/mL) patients, respectively. All these results implied potential relationship between ELAVL1 level and disease severity, as well as prognosis of HCC patients.
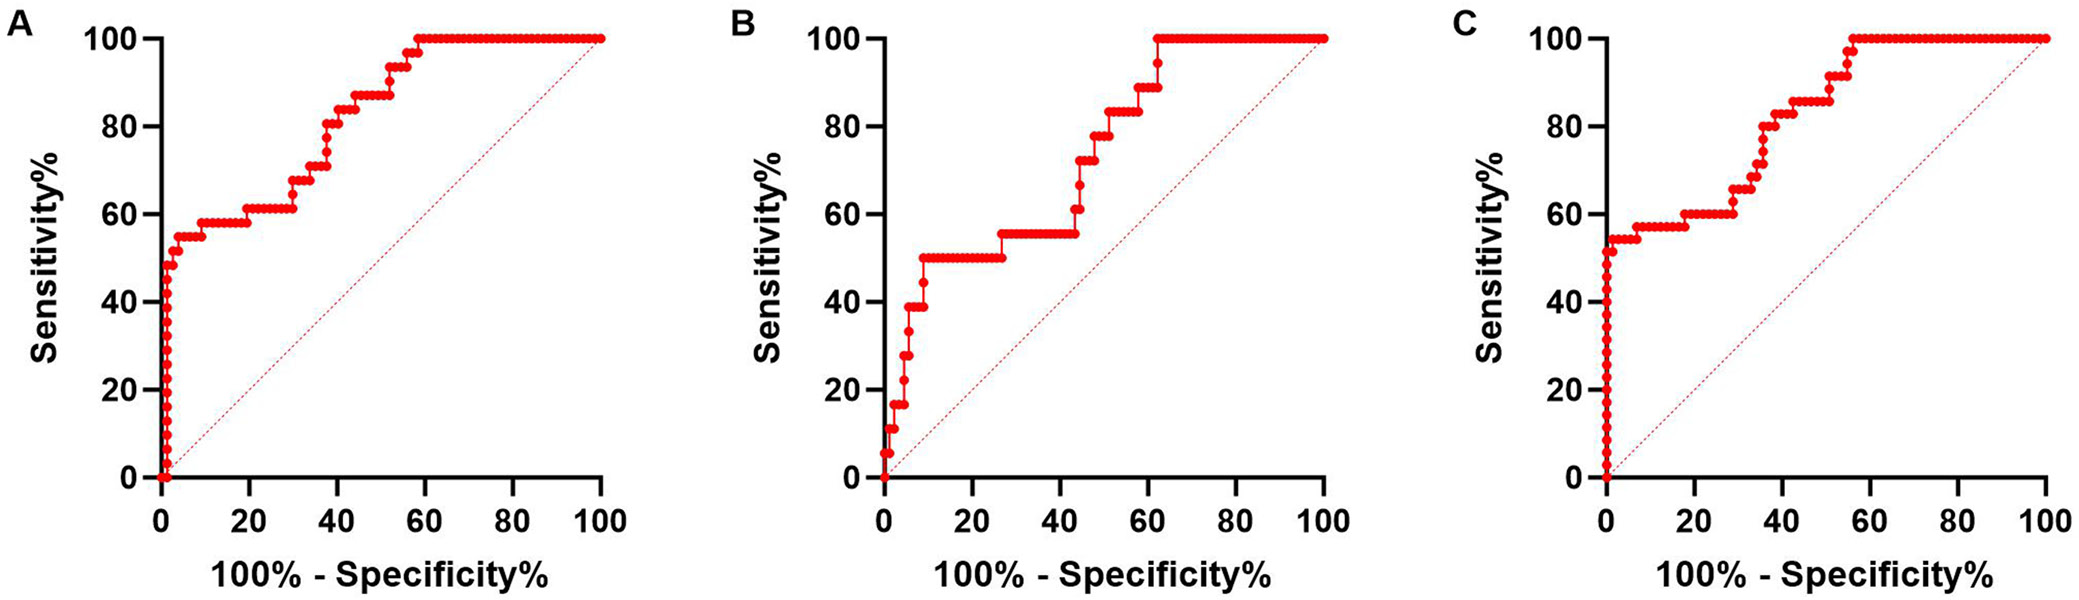
Predictive value of ELAVL1 for poor prognosis of mortality and recurrence of HCC patients
Then, ROC curves were used to analyze the value of ELAVL1 for predicting mortality and recurrence of HCC patients. As shown in Figure 2, the area under the curve (AUC) of ELAVL1 for predicting patients’ mortality was 0.818, with sensitivity 80.65%, specificity 62.34% and cutoff value of >135.0 pg/mL. For predicting recurrence, the AUC of ELAVL1 was 0.732, with sensitivity 72.22%, specificity 55.56% and cutoff value >135.9 pg/mL. Next, we regarded both mortality and recurrence as poor prognosis of the patients, and ELAVL1 also demonstrated the predictive value of poor prognosis with AUC 0.827, sensitivity 80.00%, specificity 64.38%, and cutoff value >135.0 pg/mL. When choosing cut off value, we considered higher sensitivity first and used the Youden’s index. All these results indicated the potential value for ELAVL1 to predict prognosis of HCC patients.
The relationship between ELAVL1 and clinical outcomes of HCC patients
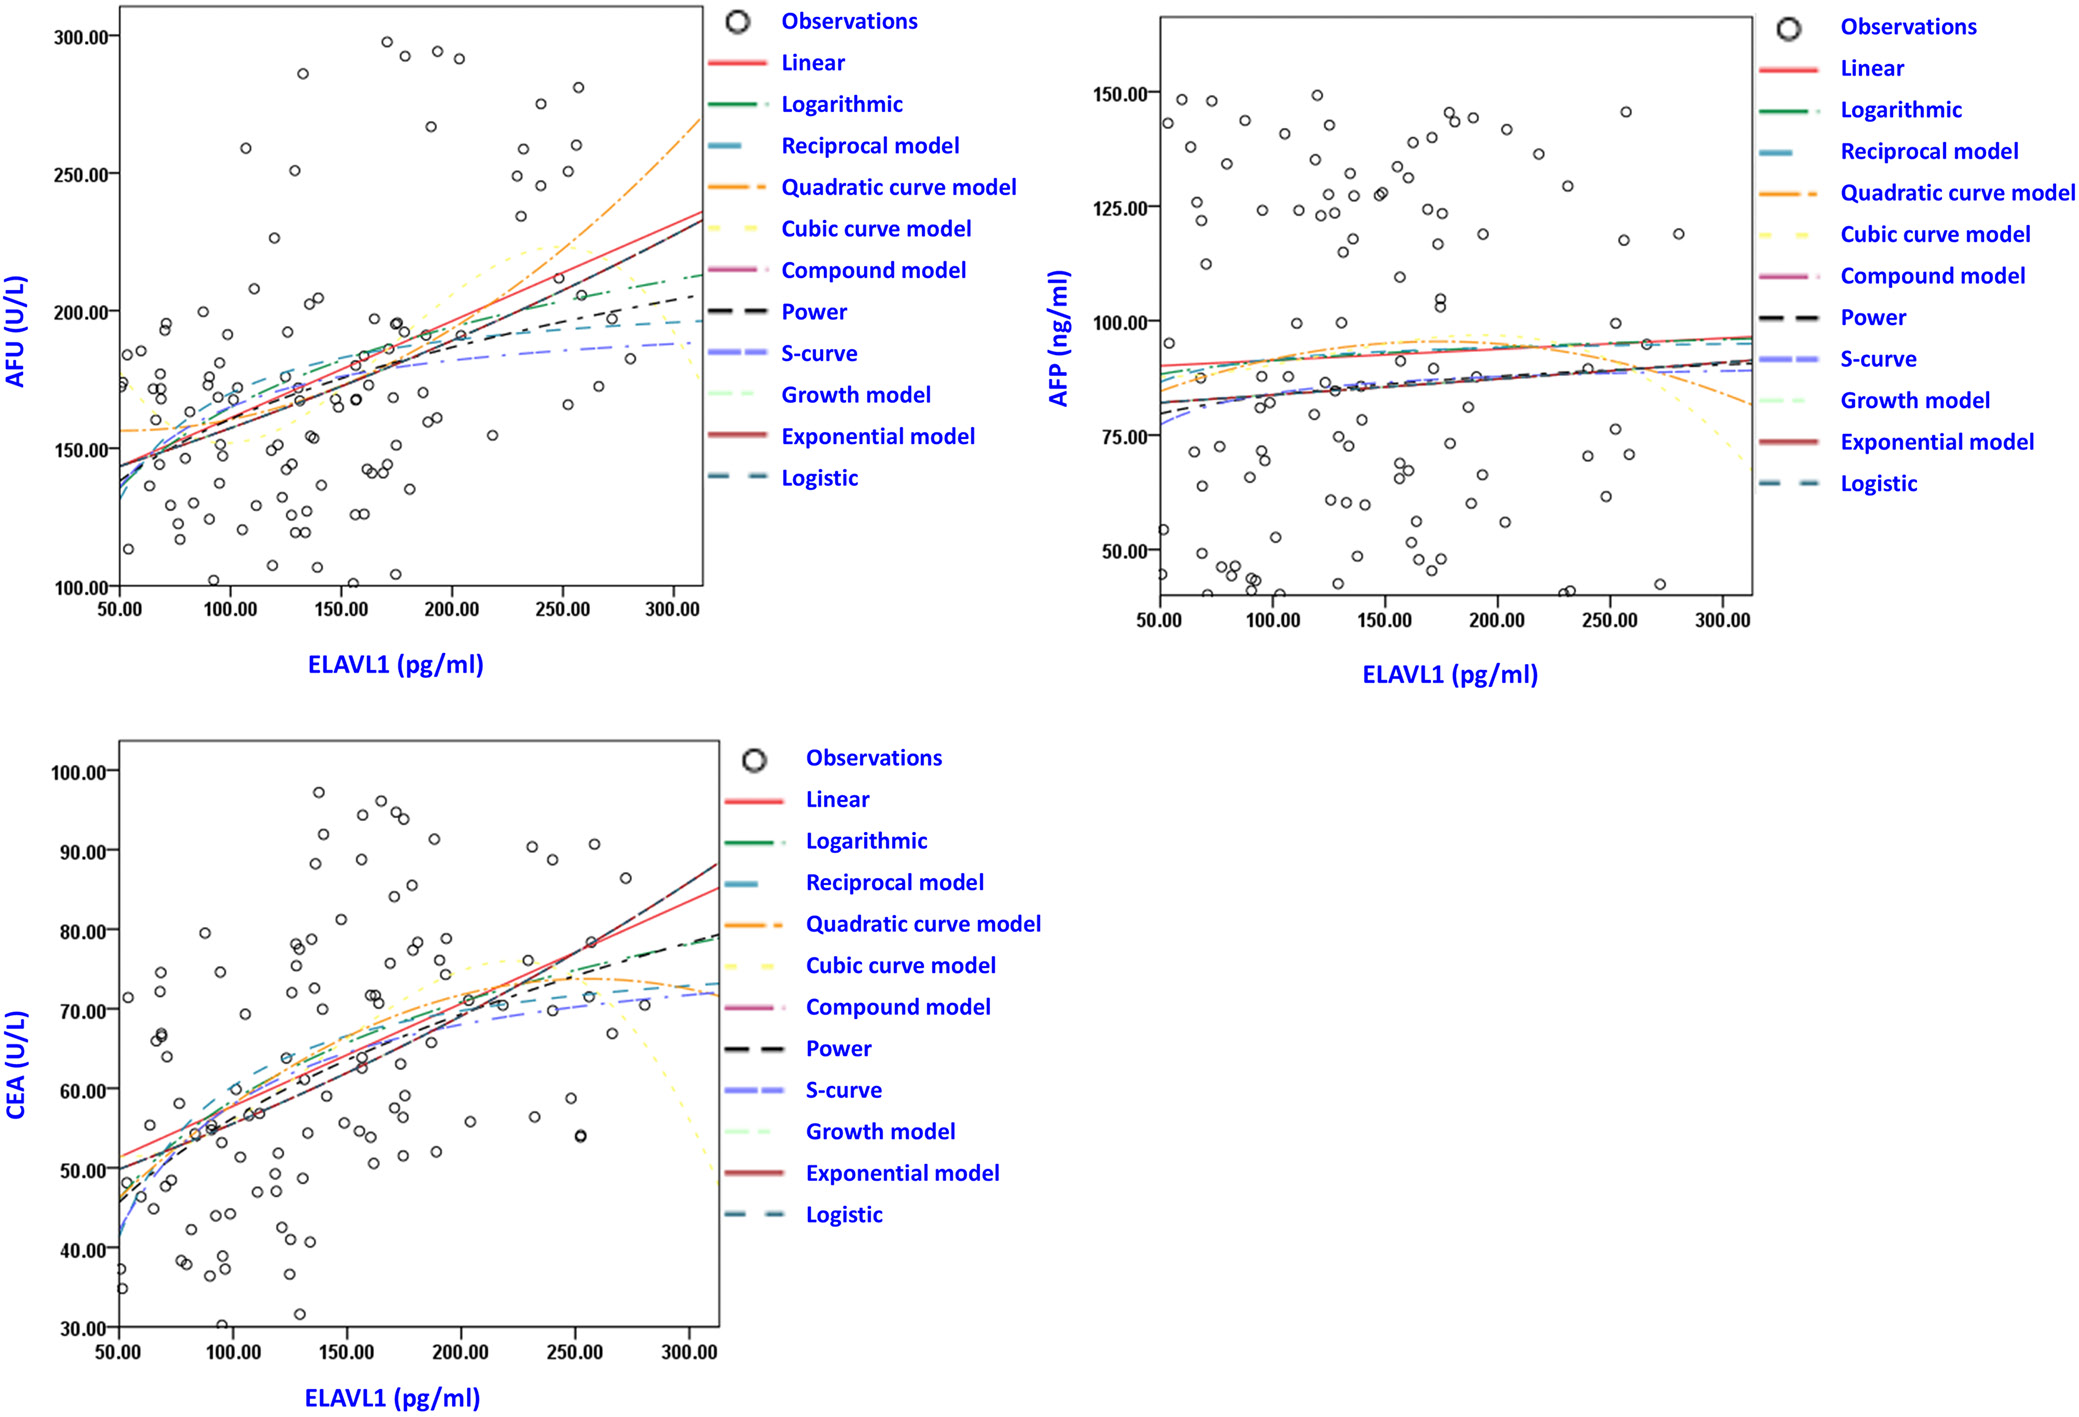
To further investigate the role of ELAVL1 in HCC patients, we divided the patients into high and low ELAVL1 groups according to the above cutoff value for predicting poor prognosis of HCC (>135.0 pg/mL). As shown in Table 2, patients with higher expression of ELAVL1 showed significantly higher frequencies of TNM III–IV stages, BCLC stage D and lymphatic metastasis, as well as higher mortality and recurrence ratios. Meanwhile, the levels of AFP and CEA were markedly higher in patients with higher ELAVL1 compared with the low expression group. The results of Levene’s tests for assumption of homogeneity of variances are shown in Supplementary Table 2. Further correlation analysis of Spearman’s analysis (Table 3) and regression curve estimation (Figure 3) showed that ELAVL1 was positively correlated with the levels of AFP and CEA. Regression curve estimation allows for fitting various types of curves (such as linear, logarithmic, reciprocal, quadratic, cubic, compound, power, S-curve, growth, exponential, and logistic models) to the data, providing a comprehensive analysis of the relationship between variables by evaluating different models to identify the best-fitting curve.19 In Figure 3, positive correlations were observed in all analyses of the linear, logarithmic, reciprocal model, quadratic curve model, cubic curve model, compound model, power, S-curve, growth model, exponential model, and logistic models for both AFP and CEA with ELAVL1 (all p-values <0.001). These results further indicated that the high levels of ELAVL1 were associated with poorer clinical outcomes and prognosis of HCC patients.
Risk factors for poor prognosis of mortality and recurrence of HCC patients
Multivariable logistic regression was then used to analyze the independent risk factors for poor prognosis (mortality and recurrence) in HCC patients using the enter method for predictor selection. We used 2 separate models in the regression analysis. Model 1 included all counting data of sex, comorbidities, TNM stage, BCLC stage, and lymphatic metastasis, with Nagelkerke R2 = 0.609. Model 2 included all continuous data of age, BMI, ALT, AST, AFP, AFU, CEA, and ELAVL1, with Nagelkerke R2 = 0.750. The results of the Box–Tidwell test and the VIF values (Supplementary Tables 3–5) showed that the data met the criteria for a linear relationship and had no multicollinearity. Residual analysis identified 6 outliers for Model 1 and 4 outliers for Model 2, with the Hosmer–Lemeshow test yielding p-values of 0.908 and 0.344, respectively (Supplementary Tables 6–11). The outliers were not excluded as they did not affect the goodness-of-fit of the models. Additionally, The Q–Q plot showed that the residuals were approximately normally distributed (Supplementary Fig. 1,2). As shown in Table 4, BCLC stage, lymphatic metastasis, age, AFP, and ELAVL1 were independent risk factors for poor prognosis in HCC patients.
Discussion
Early diagnosis is the key point for treatment efficacy of HCC patients, while current HCC biomarkers such as AFU and AFP have insufficient sensitivity and specificity for diagnosis of HCC. In the present study, we demonstrated that ELAVL1 was elevated in serum samples of HCC patients, associated with patients’ TNM stage and lymphatic metastasis, and could be used as a potential biomarker for the poor prognosis.
ELAVL1 has been documented to play a facilitative role in the development of various cancers. In prostate cancer, ELAVL1 enhances cellular proliferation through the regulation of m6A modification, representing an epigenetic mechanism for RNA.16 Additionally, ELAVL1 contributes to the progression of gastric cancer by promoting cytoplasmic translocation and inhibiting ferroptosis, a form of programmed cell death driven by iron accumulation.17 In breast cancer, elevated ELAVL1 expression is associated with increased cell proliferation and metastasis, alongside chemoresistance, by modulating the Rab10/TLR4 signaling pathway.18 Furthermore, ELAVL1 has been shown to accelerate tumorigenesis in colorectal,20 lung21 and pancreatic cancers.22 However, despite the abundance of cellular and animal studies, there is a scarcity of research on the clinical relevance of ELAVL1 in cancer patients, including those with HCC.
Recent studies have also highlighted the role of ELAVL1 in promoting cancer in HCC. It has been observed that ELAVL1 is more commonly expressed in HCC tissues compared to normal tissues and is linked to postoperative recurrence in patients with HBV-related HCC.23 However, it remains unclear whether ELAVL1 is associated with other clinical outcomes and the prognosis of patients, such as overall mortality in all HCC patients. Furthermore, an in vitro study has demonstrated that the long non-coding RNA (lncRNA) CCTA2 enhances HCC progression by interacting with ELAVL1, which in turn facilitates cancer cell migration and invasion.24 Beyond these findings, there has been limited research on the role of ELAVL1 in HCC. In our study, we observed that higher ELAVL1 predicted higher frequency of TNM III–IV and BCLC stage C–D. Importantly, liver function is a critical factor in determining the prognosis and treatment options for HCC patients, as it significantly influences the functional liver reserve and the ability to tolerate treatments.25 The BCLC staging system includes assessments of liver function, reflecting its impact on prognosis and treatment decisions. We also found that the serum level of ELAVL1 is associated with poorer prognosis, providing further evidence for the involvement of ELAVL1 in HCC.
Limitations
This study also has several limitations. First, it is a retrospective study, not a prospective one. Second, our focus was only on the value of ELAVL1 at the time of diagnosis. The long-term and dynamic impacts of ELAVL1 levels on the prognosis of HCC patients remain uncertain.
Conclusions
In this retrospective analysis, we showed that higher serum levels of ELAVL1 were associated with worse clinical outcomes and poorer prognosis in patients with HCC. These findings could serve as a novel biomarker and a research target for investigating HCC.
Supplementary data
The Supplementary materials are available at https://doi.org/10.5281/zenodo.13868336. The package includes the following files:
Supplementary Table 1. Kolmogorov–Smirnov test results for data distribution in continuous variables.
Supplementary Table 2. Results of the unpaired Student’s t-test with Levene’s test in Table 2.
Supplementary Table 3. Results of the Box–Tidwell test for Model 2 in Table 4.
Supplementary Table 4. VIF values of variables in Model 1 in Table 4.
Supplementary Table 5. VIF values of variables in Model 2 in Table 4.
Supplementary Table 6. Hosmer–Lemeshow test for Model 1 in Table 4.
Supplementary Table 7. Contingency table for the Hosmer–Lemeshow test for Model 1 in Table 4.
Supplementary Table 8. Casewise List for Model 1 in Table 4.
Supplementary Table 9. Hosmer–Lemeshow test for Model 2 in Table 4.
Supplementary Table 10. Contingency table for the Hosmer–Lemeshow test for Model 2 in Table 4.
Supplementary Table 11. Casewise List for Model 2 in Table 4.
Supplementary Fig. 1. Q–Q plot showed that the residuals are approximately normally distributed in Model 1 in Table 4.
Supplementary Fig. 2. Q–Q plot showed that the residuals are approximately normally distributed in Model 2 in Table 4.
Data availability
The datasets generated and/or analyzed during the current study are available from the corresponding author on reasonable request.
Consent for publication
Not applicable.
Use of AI and AI-assisted technologies
Not applicable.
ORCID iDs
Guibao Ji https://orcid.org/0009-0001-9737-9015
Qiuxia Guo https://orcid.org/0009-0009-7993-2049
Lang Ning Chen https://orcid.org/0009-0001-7547-8354
Jing Yu Chen https://orcid.org/0009-0001-8089-8513
Zhuo Lin Li https://orcid.org/0009-0000-0145-0212