Abstract
Background. The pathogenesis of Legg–Calve–Perthes disease (LCPD), a juvenile form of avascular necrosis of the femoral head (ANFH), is not fully understood.
Objectives. The purpose of this work was to study the regulatory effect of R-spondin 1 (Rspo1) on osteoblastic apoptosis and evaluate the pre-clinical efficacy of recombinant human protein Rspo1 (rhRspo1) in treatment of LCPD.
Materials and methods. This is an experimental study. In vivo rabbit ANFH model was established. Human osteoblast cell line hFOB1.19 (hFOB) was used to overexpress and silence Rspo1 in vitro. Additionally, hFOB cells were induced with glucocorticoid (GC) and methylprednisolone (MP), and treated with rhRspo1. The expressions of Rspo1, β-catenin, Dkk-1, Bcl-2, and caspase-3, and the apoptosis rate of hFOB cells were examined.
Results. The expressions of Rspo1 and β-catenin were lower in ANFH rabbits. The expression of Rspo1 was decreased in GC-induced hFOB cells. Compared to the control group, after 1 μM MP induction for 72 h, the expressions of β-catenin and Bcl-2 were higher, while Dkk-1, caspase-3 and cleaved caspase-3 expressions were lower in Rspo1 overexpression and rhRspo1-treated groups. The apoptosis rate of GC-induced hFOB cells was decreased in Rspo1 overexpression and rhRspo1-treated groups compared to the control group.
Conclusions. R-spondin 1 inhibited GC-induced osteoblast apoptosis via Wnt/β-catenin pathway, which might be associated with the development of ANFH. Moreover, rhRspo1 had a potential pre-clinical therapeutic effect on LCPD.
Key words: apoptosis, Wnt/β-catenin pathway, osteoblast, R-spondin 1, Perthes disease
Background
Legg–Calve–Perthes disease (LCPD) is a juvenile form of avascular necrosis of the femoral head (ANFH) that usually occurs between 2 and 14 years of age, and is associated with a permanent deformity of the femoral head and early osteoarthritis.1, 2 The etiology of LCPD is not well understood, and it may be related to multiple factors. Its main pathogenesis is thought to be blood supply disturbance of the femoral head, leading to ischemic necrosis of the epiphysis and adjacent tissues.3, 4 Many studies have confirmed that glucocorticoid (GC) can induce vascular endothelial cell injury, thrombosis, increased intraosseous pressure, and osteocyte apoptosis. This in turn results in avascular necrosis and blood flow disturbance in the femoral head,5 which is similar to the pathological process of LCPD, suggesting that GC may be one of the causes of this disease.
The Wnt/β-catenin pathway, established in many human tissues, is a canonical signal transduction pathway, which controls many cellular activities during embryonic development and adult homeostasis, such as stem cell renewal, and cell proliferation and differentiation.6, 7 Furthermore, the activation of this signaling pathway can stimulate cell proliferation, induce cell differentiation and inhibit apoptosis of osteoblasts.8, 9 In addition, Wnt/β-catenin pathway is essential in normal bone homeostasis, and has an important role in mediating the signaling coupled with osteoblastic bone formation and resorption. Moreover, Wnt/β-catenin signaling maintains the dynamic balance of bone metabolism, and its dysregulation may lead to various osteoarticular diseases.6
R-spondin (Rspo) is a secretory protein composed of 4 family members (Rspo1–4), which can bind to the leucine-rich repeat-containing G protein-coupled receptors (LGR4-6), regulating cell differentiation, stem cell maintenance and angiogenesis. The R-spondin is expressed in both embryonic and adult tissues, and its proper expression is essential for the normal development of organisms and maintaining body homeostasis.10, 11, 12 As an agonist of the Wnt/β-catenin pathway, Rspo1 plays a role in regulating the human skeletal system.13, 14, 15 The R-spondin and Wnt3a cooperate to induce osteoblastic differentiation and osteoprotegerin expression, thereby promoting bone remodeling.16 Therapeutic application of recombinant human protein Rspo1 (rhRspo1) has already shown beneficial effects in animal models of intestinal inflammatory diseases and mucositis.17 The administration of rhRspo1 can alleviate radiation-induced bone loss through maintaining bone homeostasis via the Rspo1–LGR4 axis.18
Currently, there are no relevant reports on the involvement of Rspo1 in the pathogenesis of LCPD.
Objectives
The etiology of LCPD is not clear. It is speculated that Rspo1 and Wnt/β-catenin are involved in the pathogenesis of LCPD. The purpose of this study was to verify whether Rspo1 is involved in the development of GC-induced ANFH in immature rabbits via Wnt/β-catenin pathway in vivo and in vitro.
Materials and methods
Animals
Sixty healthy 8-week-old New Zealand white rabbits weighing 1300–1800 g were obtained from the Animal Research Center of Zunyi Medical College, Zunyi, China. All animal studies (including the rabbit euthanasia procedure) were performed in compliance with the regulations and guidelines of Zunyi Medical College institutional animal care and conducted according to the Association for Assessment and Accreditation of Laboratory Animal Care (AAALAC) and Institutional Animal Care and Use Committee (IACUC) guidelines (approval No. KLL-2020-008 of the ethics committee of Affiliated Hospital of Zunyi Medical College).
The immature rabbits were randomly divided into 2 groups: GC group (n = 48) and control group (n = 12). Rabbits in the GC group were given methylprednisolone (MP) (7.5 mg/kg−1) in buttocks twice a week for 8 weeks, and those in the control group were injected with saline. Afterwards, all rabbits were euthanized by air embolism, and their bilateral femoral heads were quickly removed and evaluated with gross morphology and X-ray photography. The specimens were maintained at a constant distance from the X-ray source to minimize any effects of magnification.
One part of the femoral head was fixed in 4% formaldehyde solution for 36 h, followed by soaking in ethylenediaminetetraacetic acid (EDTA) to remove calcium; the other parts were put into a Eppendorf (EP) tube, snap-frozen in liquid nitrogen and stored at −80°C.
The ANFH was assessed by 3 doctors (specialists in imaging) using evaluation criteria as previous study.19 The experimental scheme was approved by the Animal Use and Care Committee of Zunyi Medical College.
Cell culture
Human osteoblast cell line hFOB1.19 (hFOB), provided by the Cell Bank of Chinese Academy of Sciences (Shanghai, China), was cultured in Dulbecco’s modified Eagle’s medium (DMEM0 (Gibco, Waltham, USA) supplemented with 10% fetal bovine serum (FBS) and G418 (Yuanye Corp., Shanghai, China) at 37°C with 5% CO2. The morphology of hFOB cells was observed under an inverted phase contrast microscope (model CKX53; Olympus Corp., Tokyo, Japan), and cells after passage 3 were used for subsequent analysis.
The hFOB cells were inoculated on a 6-well plate, and different concentrations of MP (Pfizer, New York, USA) were added to the culture medium (0 μM, 0.01 μM, 0.1 μM, and 1 μM) for 24 h, 48 h and 72 h. In addition, cells grown in a 6-well plate were treated with 500 ng/mL of rhRspo1 (Biolegend, San Diego, USA) for 72 h.20, 21 The cells were divided into rhRspo1, MP, rhRspo1+MP, and control groups.
Lentivirus transfection
R-spondin 1 overexpression mRNA (Rspo1), non-coding Rspo1 mRNA negative control (Rspo1-NC) and Rspo1 silencing mRNA (shRNA) were encoded by lentivirus vectors (Hanheng Biotechnology Co., Ltd., Shanghai, China). The experiments were classified into the Rspo1+1 μM MP, Rspo1-NC+1 μM MP, Rspo1 silencing mRNA with short hairpin RNA (shRspo1), and control (1 μM MP) groups. Briefly, approx. 2 × 10⁴ cells were inoculated in a 24-well plate, and transfection was performed using the lentivirus vector at a multiplicity of infection (MOI) of 30, when cells were grown to a confluence of 30%. The infection efficiency was assessed using the frequency of green fluorescent protein (GFP)-positive cells and the expression level of Rspo1 after 72 h. Stably transfected cells were screened with 3 µg/mL puromycin (Gibco).
Flow cytometry
The apoptosis rate of hFOB cells was detected with flow cytometry according to the manufacturer’s instructions (Beyotime Biotechnology, Shanghai, China). Cells were collected by centrifugation at 2000 rpm for 5 min after digestion with trypsin, and washed with phosphate-buffered saline (PBS). Then, 5 μL of Annexin V-APC and 5 μL of 7-aminoactinomycin D (7-AAD) dye solution were added into the cell suspension at room temperature for 10 min in the dark. Apoptotic detection of the cells double stained with acridine orange and ethidium bromide (AO-EB) was also performed using a FACScalibur flow cytometer (BD Biosciences, Franklin Lakes, USA).
TUNEL assay
The apoptosis rate of hFOB cells was detected using the In Situ Cell Death Detection Kit (Roche, Basel, Switzerland). The treated cells were fixed using 4% paraformaldehyde for 1 h, followed by incubation with 3% H2O2 and 0.1% Triton X-100 for 20 min. Phosphate-buffered saline cleaning was required between all the above steps. After that, the terminal deoxynucleotidyl transferase dUTP nick end labeling (TUNEL) staining was carried out according to the manufacturer’s protocol. After completion of staining, 3 independent researchers counted the TUNEL-positive cells under a fluorescence microscope (model E8400; Nikon Corp., Tokyo, Japan).
Quantitative real-time polymerase
chain reaction
Total RNA was extracted from the cells with RNAiso Plus (Takara, Shiga, Japan), and converted to cDNA using the high capacity cDNA RT Kit (MBI Fermentas Inc., Burlington, Canada), following the manufacturer’s instructions. Relative mRNA expression levels were estimated based on the 2−ΔΔCT method, with GAPDH as the reference housekeeping gene for normalization. The quantitative real-time polymerase chain reaction (q-PCR) primers used are listed in Table 1.
Western blot
Immunoblotting was performed according to the manufacturer’s instructions (Proteintech, Rosemont, USA). The hFOB cells were washed and lysed with radioimmunoprecipitation assay (RIPA) lysis buffer (Beyotime Biotechnology) supplemented with 1 mM protease inhibitor, and incubated on ice for 30 min. The supernatant was collected after the lysate was centrifuged at 12000 × g for 5 min at 4°C. Proteins were separated using sodium dodecyl sulfate-polyacrylamide gel electrophoresis (SDS-PAGE) and then transferred to a polyvinylidene difluoride (PVDF)membrane (Millipore, Burlington, USA). The membrane was blocked with 5% bovine serum albumin (BSA) in tris-buffered saline with Tween (TBST) and then incubated with a primary antibody (anti-Rspo1, 1:1000; anti-β-catenin, 1:5000; anti-Dkk-1, 1:1000; anti-caspase-3, 1:2000; anti-cleaved caspase-3, 1:1000; and anti-bcl-2, 1:1000; all from Proteintech) at 4°C overnight. Subsequently, the TBST PVDF membrane was washed and incubated with the corresponding secondary antibody for 1 h at room temperature. Finally, the proteins were detected using an enhanced chemiluminescent (ECL) reaction, and the band’s intensity was analyzed using ImageJ software (National Institutes of Health, Bethesda, USA).
Statistical analyses
All experiments were repeated 3 times. All data were tested for normal distribution using the Shapiro–Wilk method, and normally distributed data were expressed as mean ± standard deviation (M ±SD), while non-normally distributed data were expressed as median and percentiles (25th percentile (P25) and 75th percentile (P75)). The homogeneity of variance was analyzed using Levene’s test. The t-test and analysis of variance (ANOVA) were used to compare 2 groups and multiple groups, and non-parametric test was used to compare the data of non-normal distribution using Kruskal–Wallis test. A p-value <0.05 was considered statistically significant. All calculations were conducted using IBM SPSS v. 25.0 software (IBM Corp., Armonk, USA).
Results
Animal model
Twelve immature rabbits from the GC group died during the experiment because of diarrhea, while there were no deaths in the control group. Ten rabbits were confirmed as ANFH according to the diagnostic criteria of osteonecrosis of the femoral head (all unilateral).19 The gross morphology showed that the femoral head of ANFH became smaller, pale and collapsed, with a non-spherical appearance, and the femoral neck became shorter. The X-ray images revealed a decreased density of femoral head epiphysis, with irregular shape, reduced size, partial necrosis, and collapse (Supplementary Fig. 1).
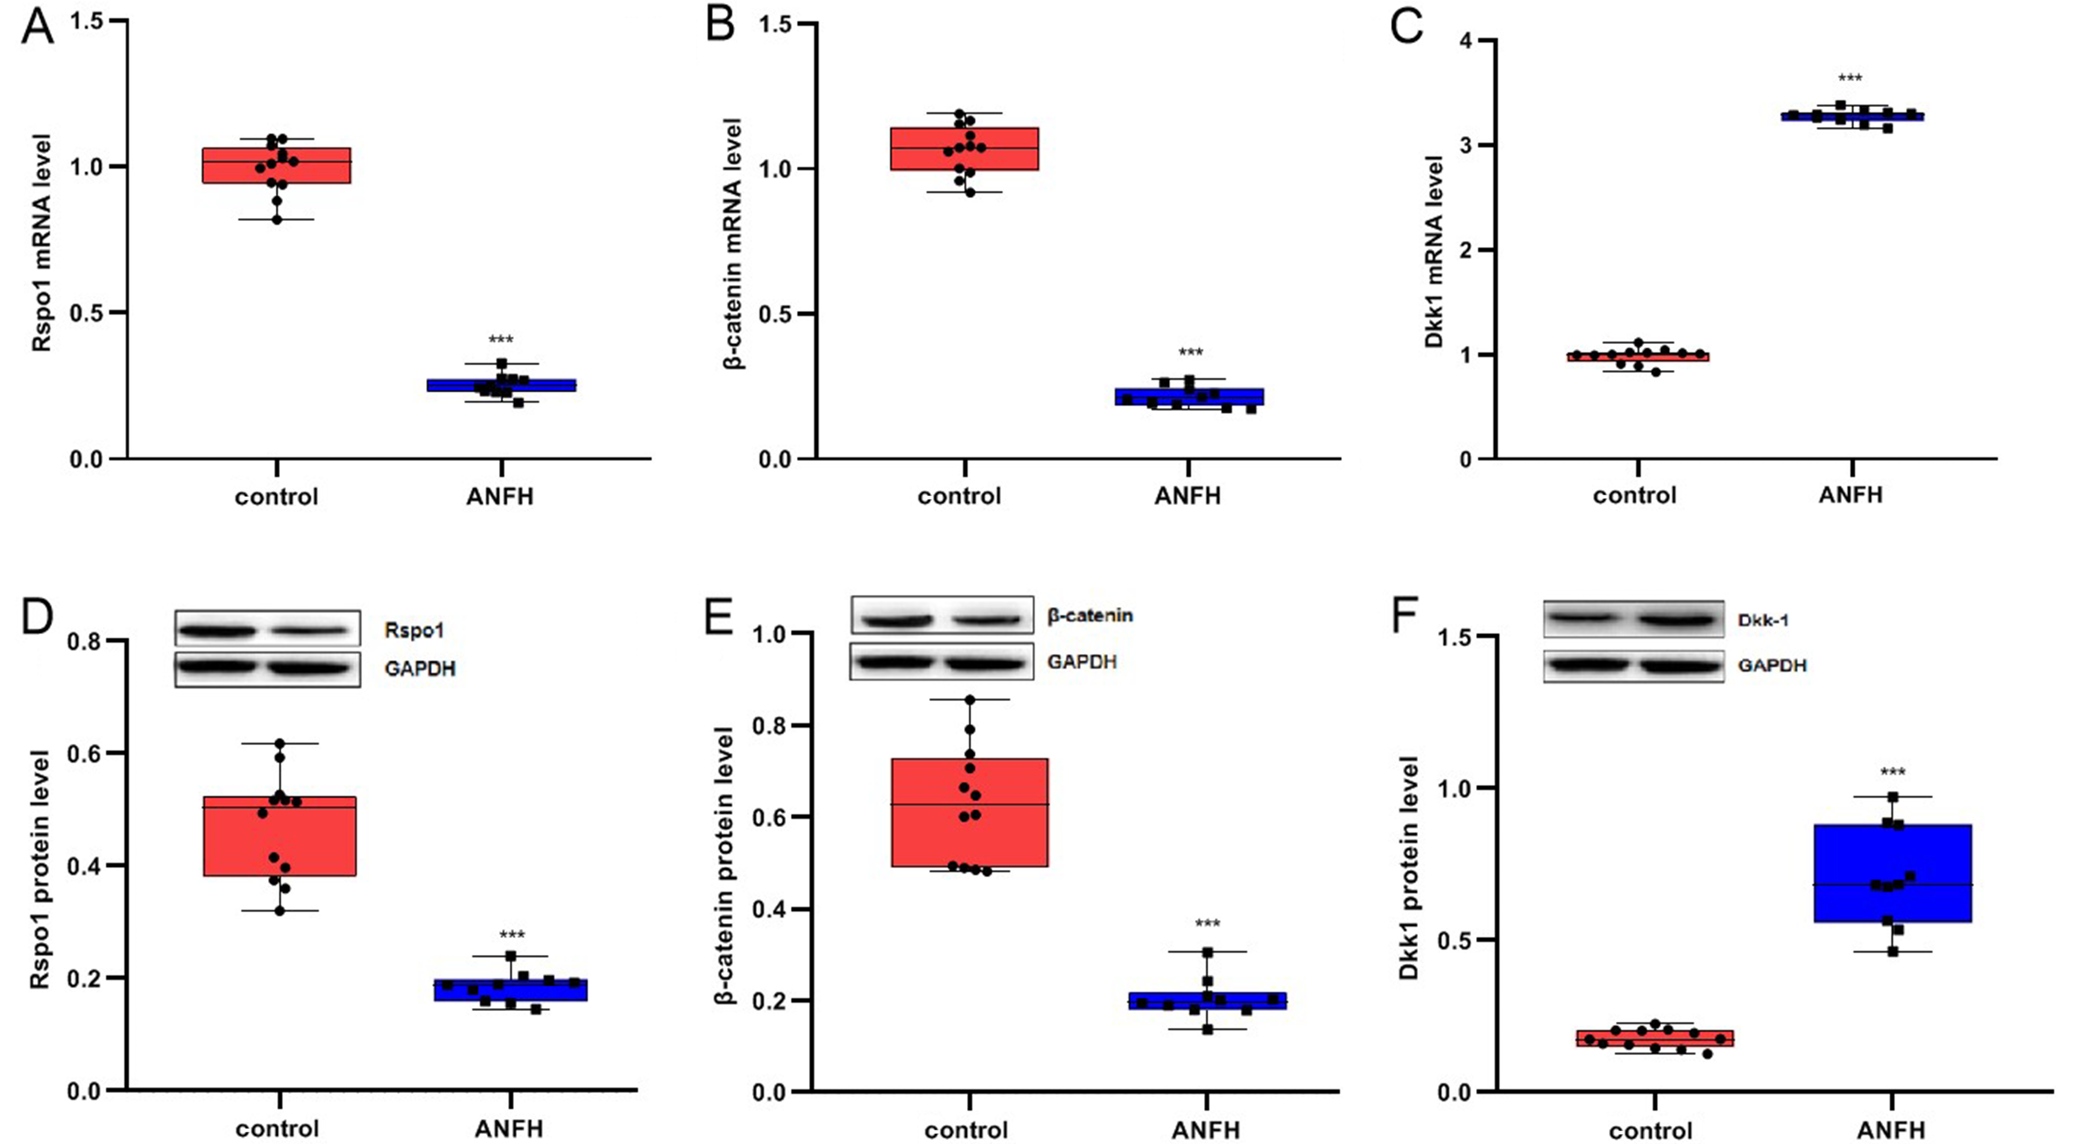
Downregulation of Rspo1 and β-catenin, and upregulation of Dkk-1 in the bony epiphysis of ANFH in vivo
Compared to the control group, the expressions of Rspo1 and β-catenin in the bony epiphysis of the femoral head were significantly lower, while Dkk-1 level was significantly higher in ANFH rabbits (all p < 0.05, Figure 1, Table 2). These findings suggested that Rspo1 was negatively regulated by GC, which could reduce the activation of the Wnt/β-catenin pathway and promote the occurrence of ANFH in immature rabbits.
Downregulation of Rspo1
and increased apoptosis rate
of GC-induced hFOB cells in vitro
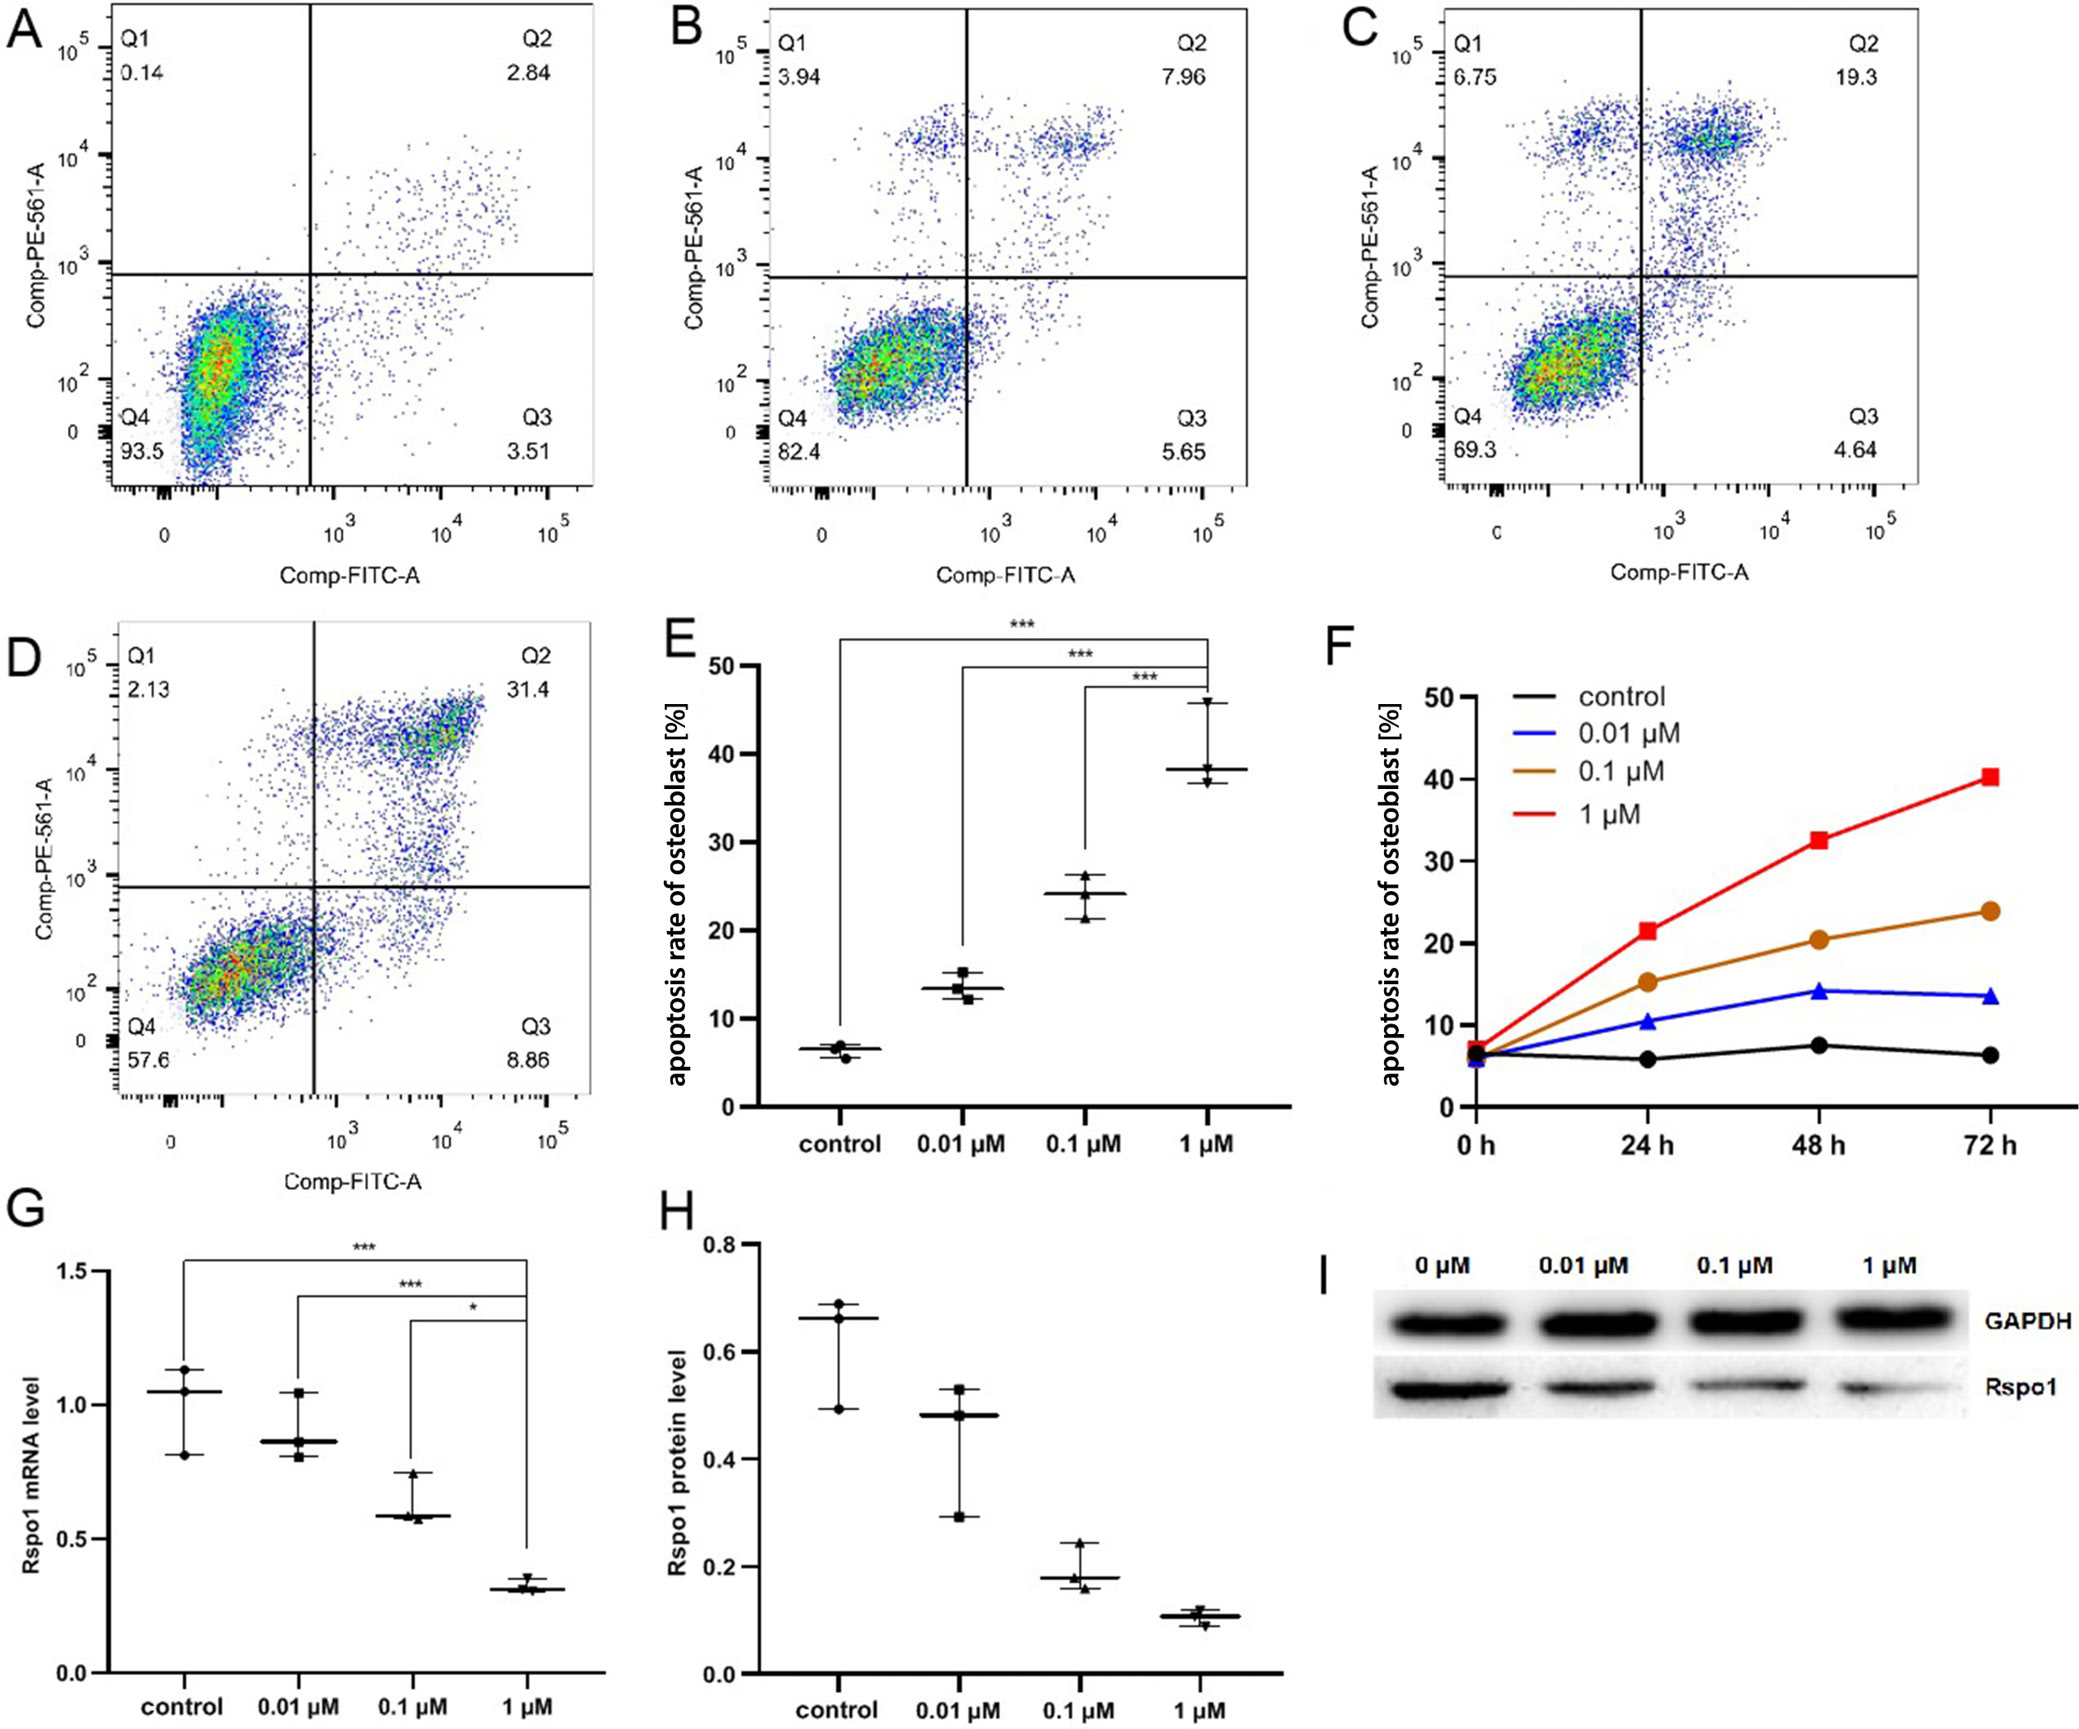
The apoptosis rate of GC-induced hFOB cells treated with different concentrations of MP (0 μM, 0.01 μM, 0.1 μM, 1 μM) was gradually increased in a time- and dose-dependent manner, as measured with flow cytometry analysis at 24 h, 48 h and 72 h. It was the highest in the 1 μM MP group at 72 h. The expression of Rspo1 was the lowest in the 1 μM MP group at 72 h, which also showed a dose-dependent tendency (Figure 2, Table 3). Our findings suggested that GC promoted the apoptosis of osteoblasts and downregulated the expression of Rspo1.
R-spondin 1 inhibited apoptosis
of GC-induced hFOB cells through the Wnt/β-catenin pathway
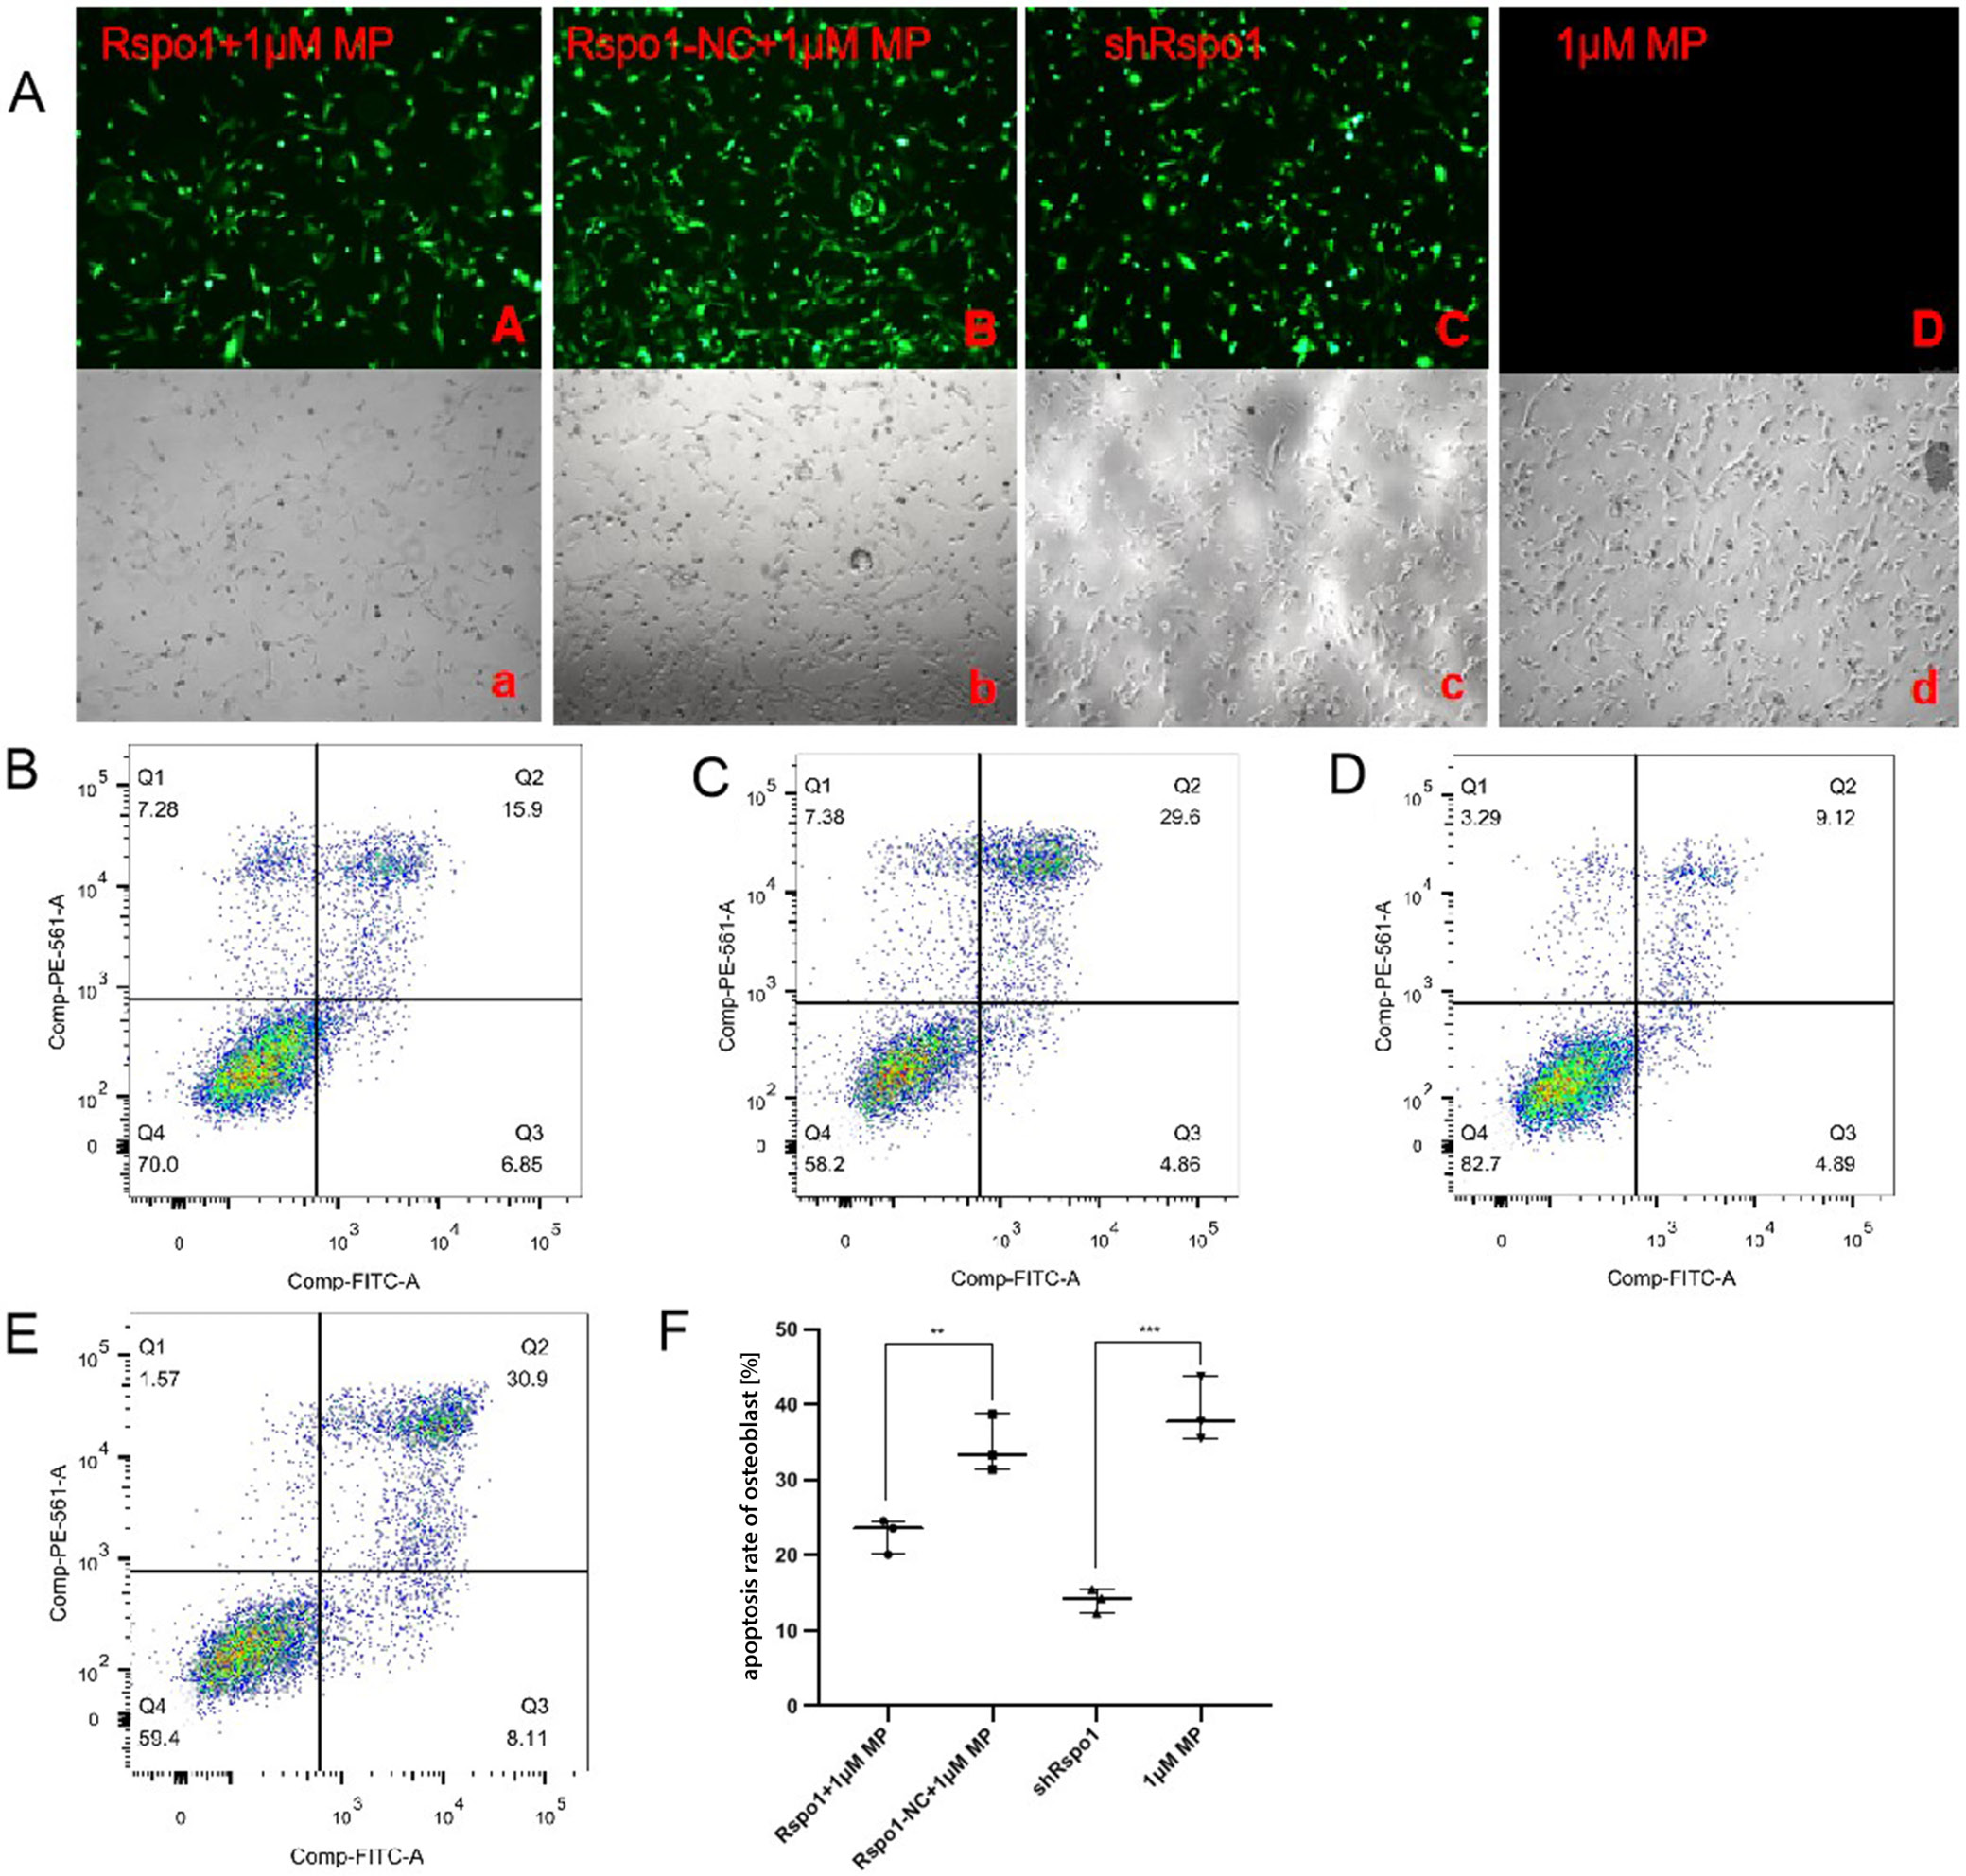
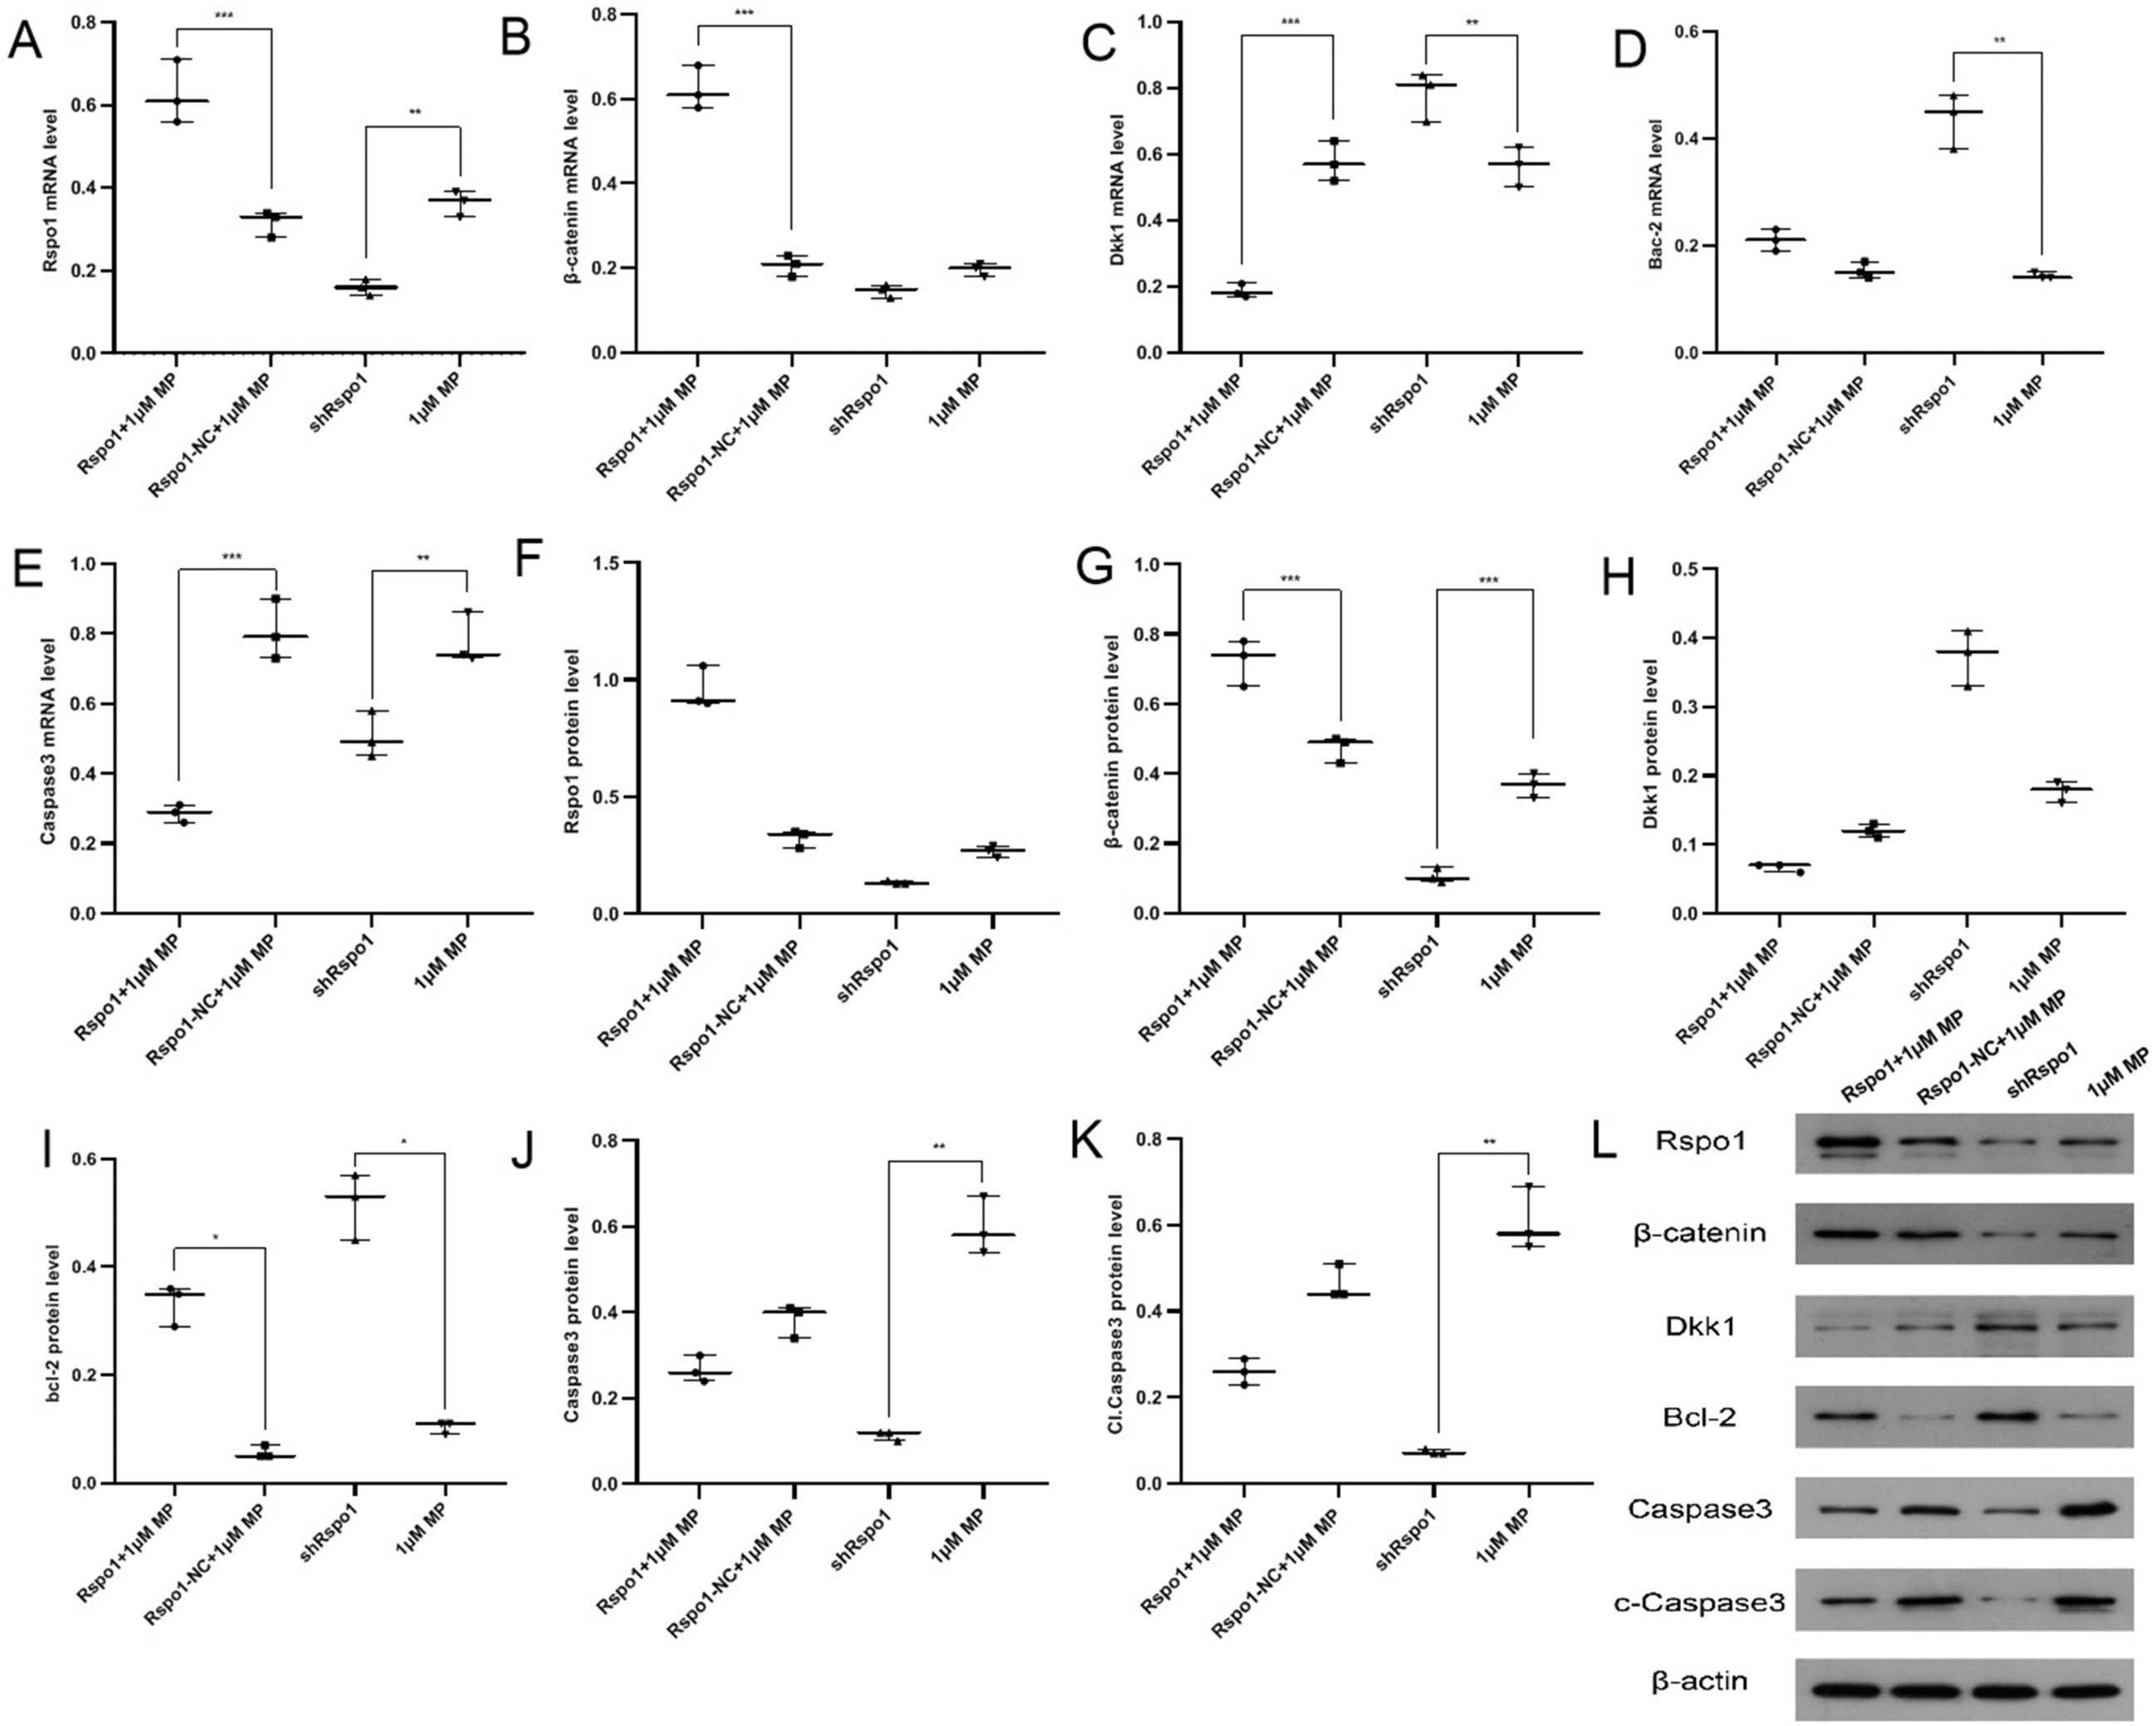
The hFOB cells transfected with lentiviral vectors were observed under a fluorescence microscope after 72 h, and the successful transfection ratio was defined as 80%. The cell apoptosis rate was significantly higher in the 1 μM MP group compared with the shRspo1 group, while it was slightly lower in the Rspo1+1 μM MP group compared with the Rspo1-NC+1 μM MP group, without descending to the normal level (Figure 3, Table 4). The expression levels of Rspo1, β-catenin and Bcl-2 were significantly higher, while Dkk-1, caspase-3 and cleaved caspase-3 levels were significantly lower in the Rspo1+1 μM MP group compared with the Rspo1-NC+1 μM MP group (Figure 4, Table 4). These findings suggested that Rspo1 mRNA could reduce the apoptosis rate of osteoblasts and GC-induced hFOB cells via the Wnt/β-catenin pathway.
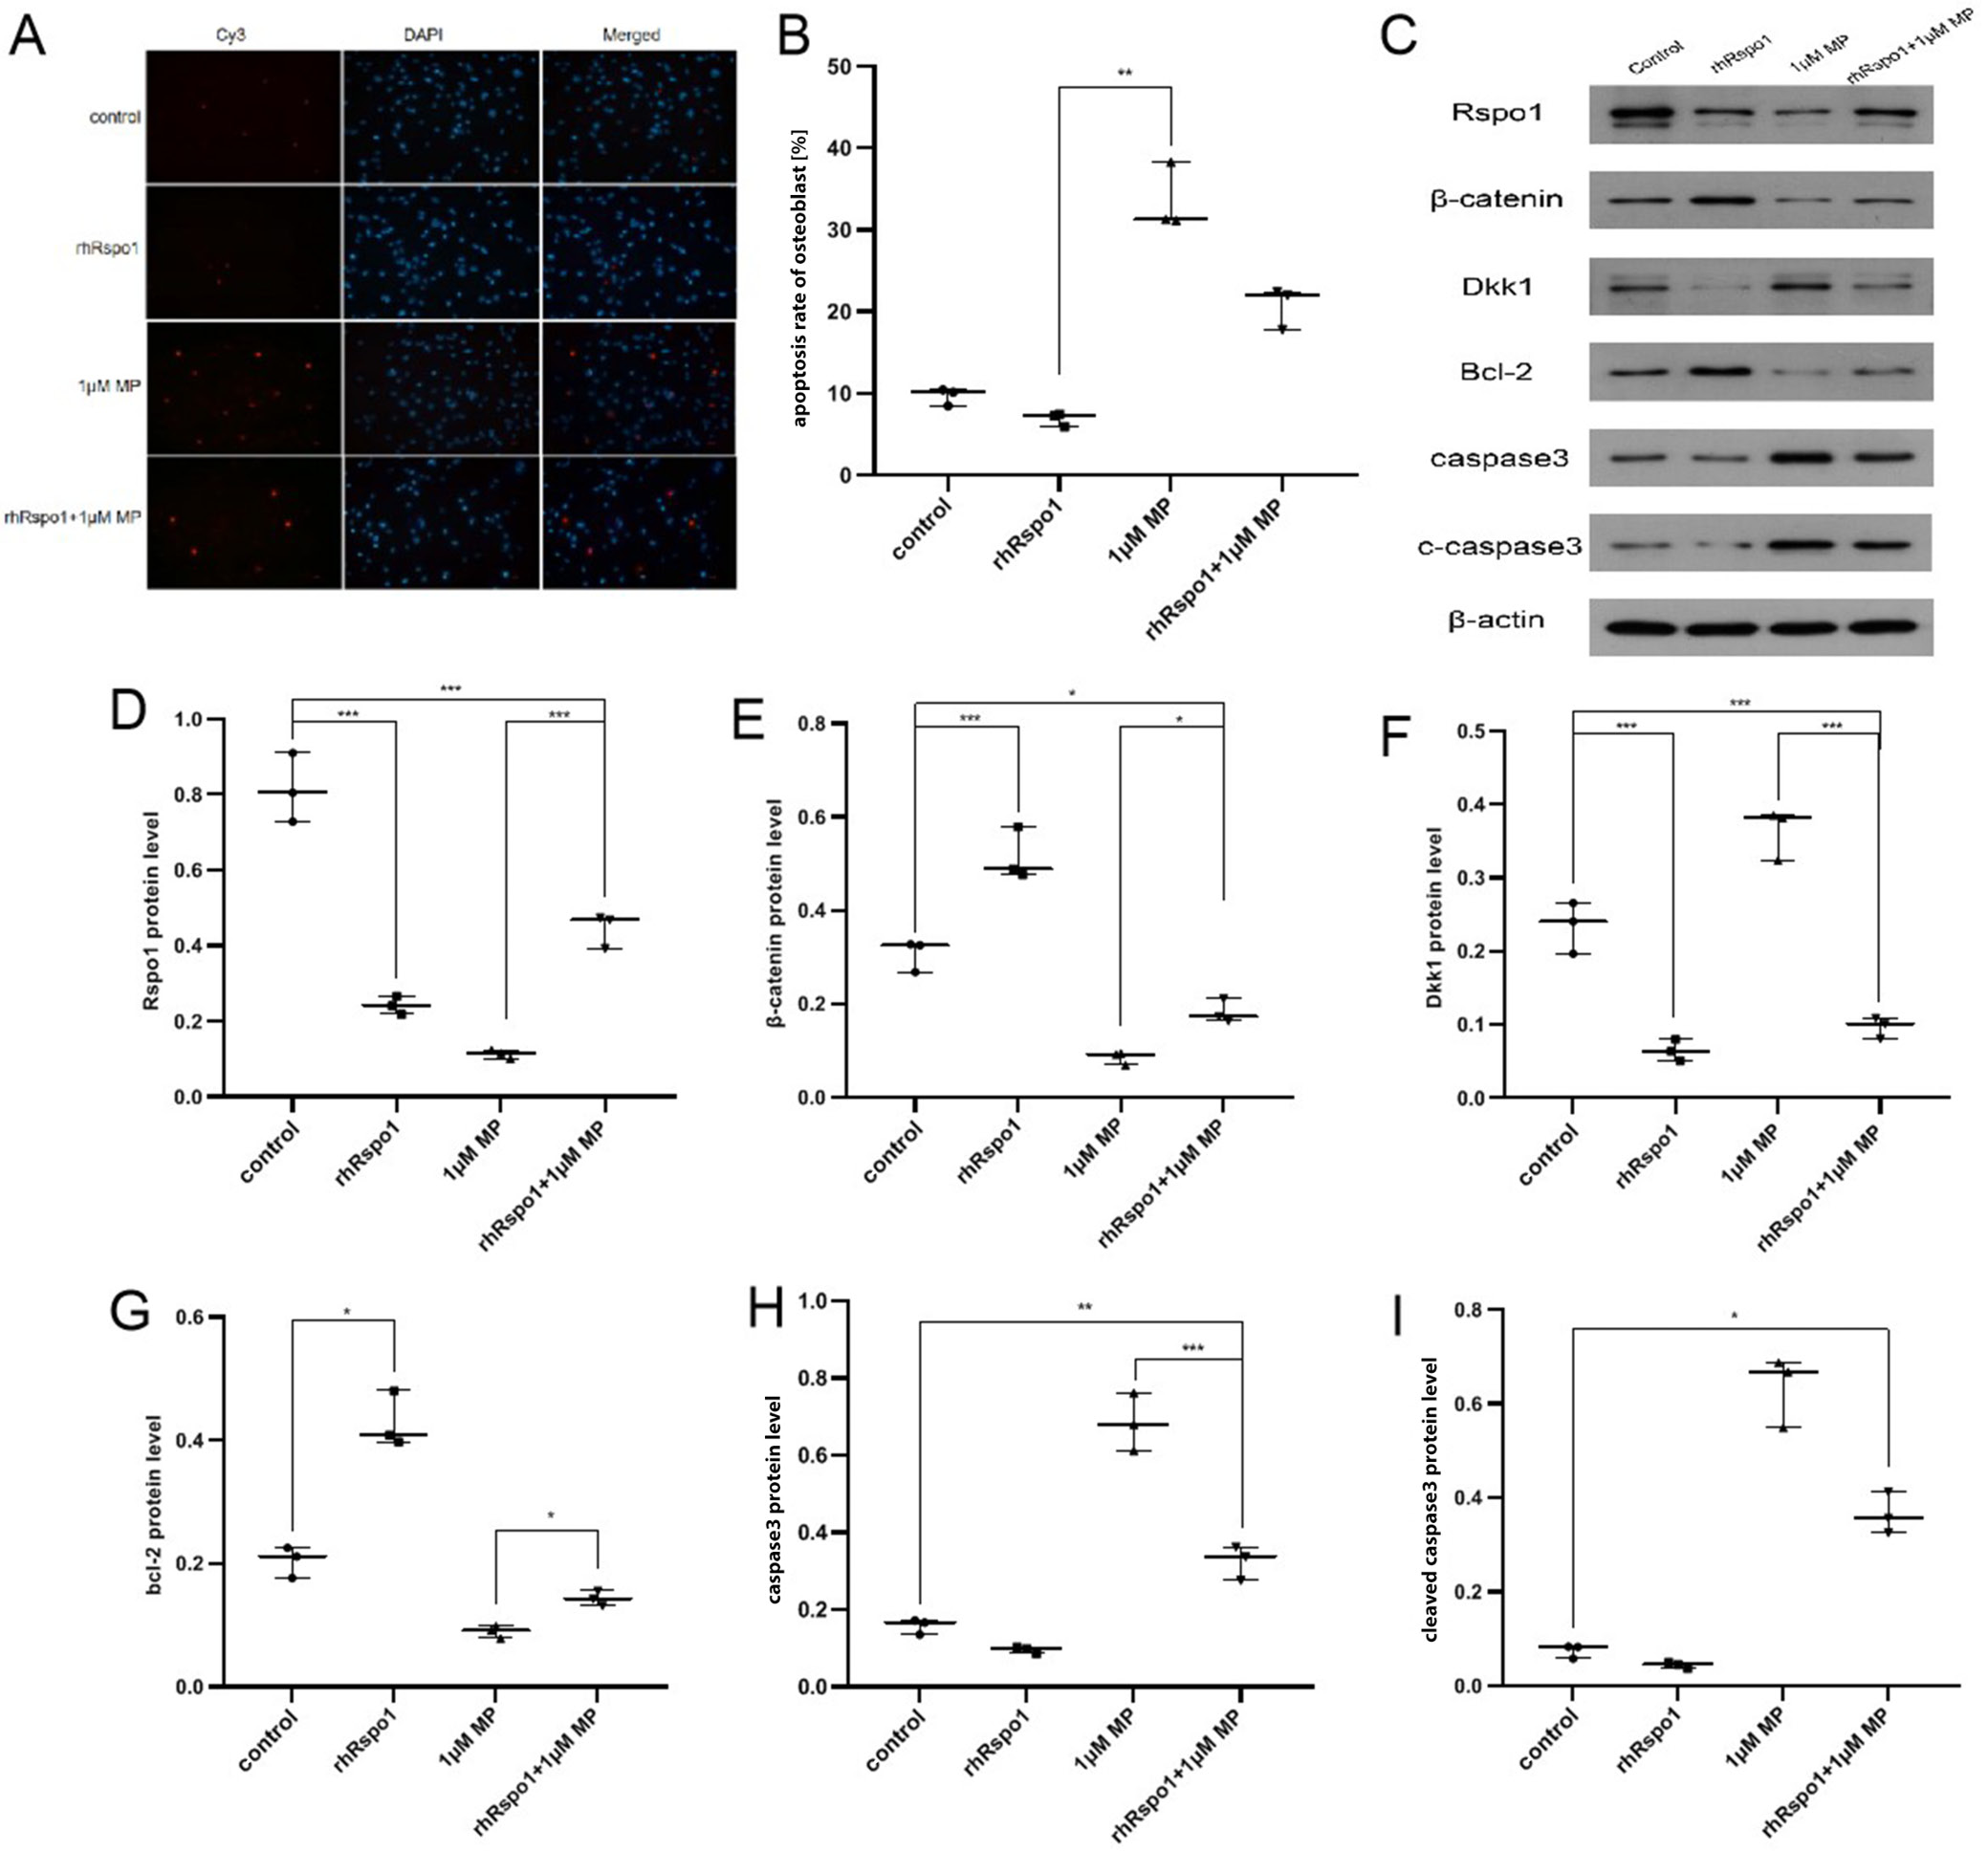
rhRspo1 could partially antagonize
GC-induced hFOB apoptosis
via the Wnt/β-catenin pathway
The apoptosis rate of hFOB cells was significantly lower in the rhRspo1 group than in the control group, and it was reduced in the rhRspo1+1 μM MP group compared with the 1 μM MP group, but it did not descend to the level of the control group. The expressions of β-catenin and Bcl-2 were significantly higher, while the expressions of Dkk-1, caspase-3 and cleaved caspase-3 were significantly lower when comparing the rhRspo1 group to the control group, and the rhRspo1+1 μM MP group to the 1μM MP group, and they were not restored to the level of the control group. These findings indicated that rhRspo1 could reduce the apoptosis rate of hFOB cells and partially antagonize the GC-induced hFOB apoptosis via the Wnt/β-catenin pathway. The expression of Rspo1 was significantly lower in the rhRspo1 group than in the control group, probably indicating the feedback inhibition of exogenous rhRspo1 (Figure 5, Table 5).
Discussion
Our results indicated that GC might be one of the causes of LCPD based on the successfully established GC-induced rabbit model of ANFH, which presented pathological process similar to LCPD. R-spondin 1 was negatively regulated by GC, which reduced the activation of the Wnt/β-catenin pathway and promoted the occurrence of ANFH. This study provided a pre-clinical experimental basis for rhRspo1 in the treatment of LCPD.
In the present study, the animal model of ANFH was successfully established in immature rabbits, revealing pathological changes similar to LCPD, such as deformation and collapse of the femoral head, thickened cartilage and increased bony epiphyseal density.22, 23 The expressions of Rspo1 and β-catenin were significantly decreased, while the expression of Dkk-1 was significantly increased in the bony epiphysis of the femoral head in ANFH, suggesting that the Wnt/β-catenin pathway might be involved in the pathological process of GC-induced ANFH in immature rabbits. The expression of Rspo1 in GC-induced osteoblasts was downregulated in a time- and dose-dependent manner. The binding of Rspo1 to transmembrane receptor Frizzled (FZD) was reduced, preventing the accumulation and nuclear transfer of β-catenin, downregulating the transcription of downstream target genes, promoting osteoblast apoptosis,24, 25 and inducing the occurrence of ANFH. Although GC and shRspo1 both can downregulate the expression of the key proteins of Wnt/β-catenin pathway in osteoblasts and increase the apoptosis rate of osteoblasts, the apoptosis-promoting effect and the expression of pro-apoptotic factors including caspase-3, cleaved caspase-3 and anti-apoptotic factor BCL-2 were obvious in the 1 μM MP group. We further showed that shRspo1 had a greater antagonistic effect on the Wnt/β-catenin pathway. Overexpression of Rspo1 mRNA only activated the Wnt/β-catenin pathway inhibited by GC and reduced osteoblast apoptosis. This suggested that GC could also promote osteoblast apoptosis through other signaling pathways or mechanisms, and Rspo1 could only partially reverse the apoptosis-promoting effect induced by GC through the Wnt/β-catenin pathway. Although we found that Rspo1 could reduce GC-induced osteoblast apoptosis via the Wnt/β-catenin pathway, the exact underlying molecular mechanism needs to be studied further.26, 27
We found that rhRspo1 reduced the apoptosis rate of osteoblasts by upregulating the expression of anti-apoptotic factor Bcl-2, and downregulating the expression of pro-apoptotic factors caspase-3 and cleaved caspase-3 through the Wnt/β-catenin pathway. In addition, rhRspo1 partially antagonized the apoptosis of GC-induced osteoblasts. Whether other members of the Rspo family and other signaling molecules or pathways, as well as vascular endothelial cell apoptosis and microvascular injury, are involved in the pathological process of ANFH needs to be elucidated.28, 29 In addition, the expression of Rspo1 in osteoblasts treated with rhRspo1 was significantly decreased, which might be due to the feedback inhibition of exogenous rhRspo1.
Limitations
There are several limitations to this study. First, although GC is one of the causes of LCPD, the animal model of ANFH in immature rabbits was successfully induced using GC, but there is a certain difference between this model and LCPD caused by the disturbance of blood circulation of the epiphysis of the femoral head. Second, the histopathological specimens of the epiphysis of the femoral head cannot be obtained neither when the LCPD is treated operatively nor when the conservative treatment is employed, so the expression of Rspo1 in the femoral head can only be simulated in animal experiments. Third, even though the distribution of the data cannot be convincingly determined for very small samples, the authors assume that the observations come from the normal distribution, and agree that if this assumption is not true, the reported p-values and confidence intervals are unreliable and must be interpreted with caution.
Conclusions
In summary, Rspo1 reduced apoptosis of GC-induced osteoblasts via the Wnt/β-catenin pathway in ANFH animals. Moreover, rhRspo1 could partially antagonize the apoptosis of GC-induced osteoblasts, thus providing evidence for the pre-clinical use of rhRspo1 to treat LCPD. More in vivo studies are needed to verify the therapeutic effect of rhRspo1 on ANFH.
Supplementary materials
The supplementary materials are available at https://doi.org/10.5281/zenodo.7485276. The package contains the following files:
Supplementary Fig. 1. Representative photos of the femoral heads in immature rabbits.
Supplementary Table 1. The original data of the manuscript.
Supplementary Table 2. The results of the ANOVA test.