Abstract
Background. The abnormal expression of glutathione S-transferase P1 (GSTP1) is associated with the progression of several tumor types. However, its role and molecular mechanism in the progression of colorectal cancer (CRC) are largely unknown.
Objectives. To examine the effect of GSTP1 in CRC and determine its possible mechanisms.
Materials and methods. In the present study, immunohistochemistry (IHC) and the quantitative reverse transcription polymerase chain reaction (qRT-PCR) analysis were used to detect the expression of GSTP1 and signal transducer and activator of transcription 3 (STAT3) in CRC tissues. Western blotting was applied to detect the expression of GSTP1 and proteins of the Janus kinase (JAK)-STAT3 pathway in different CRC cell lines. The interaction and co-localization of GSTP1 and STAT3 were detected using co-immunoprecipitation (co-IP) and immunofluorescence (IF) in the SW620 cell line.
Results. A positive correlation was identified between the expression of GSTP1 and STAT3 in human CRC tissues. The overexpression of GSTP1 promoted the proliferation, invasion and metastasis of CRC cells by upregulating STAT3. The GSTP1 and STAT3 can directly bind to and regulate each other. The interaction between them is regulated by the upstream gene called F-box only protein 8 (FBX8).
Conclusions. The present study demonstrated that GSTP1 could enhance the expression of STAT3 to promote the proliferation, invasion and metastasis of CRC cells, which provides a potential therapeutic target for the clinical treatment of CRC.
Key words: metastasis, proliferation, colorectal cancer, glutathione S-transferase P1, signal transducer and activator of transcription 3
Background
Following lung and breast cancer, colorectal cancer (CRC) is the 3rd most common cancer worldwide.1 In many cases, primary CRC can be treated with surgery, chemotherapy and radiotherapy. However, it is limited in the restriction of the development of metastatic disease.2 Therefore, there is an urgent need to further clarify the molecular mechanism of CRC tumorigenesis and pathogenesis.
Glutathione S-transferases (GSTs) (the Enzyme Commission (EC) number: EC 2.5.1.18) are phase II metabolic enzymes,3 which play essential roles in xenobiotic biotransformation,4 drug metabolism,5 protection against oxidative stress, and regulating cell proliferation and signaling pathways.6, 7 As an isoform of GST, glutathione S-transferase P1 (GSTP1) is a significant regulator of cell signaling in response to stress, hypoxia, growth factors, and other stimuli.8 The GSTP1 is overexpressed in various human cancers, including gastric cancer, pancreatic cancer and bladder cancer.9, 10 The GSTP1 is also involved in the proliferation and invasion of tumor cells; the overexpression of GSTP1 promotes the proliferation and inhibits the apoptosis in head and neck squamous cell carcinoma (HNSCC),11 whereas it inhibits the proliferation of T24 cells in bladder cancer.12 A recent study suggested that GSTP1 might be applied as an essential biomarker of liquid biopsy.13
The signal transducer and activator of transcription (STAT) family proteins are phosphorylated via Janus kinases (JAKs) in response to the binding of growth factors or cytokines to their corresponding receptors.14, 15, 16 These factors are known to stimulate the activation of intracellular STAT proteins, which are phosphorylated and dimerized, and subsequently translocated to the nucleus for the transactivation of several genes involved in numerous cellular processes.17 The persistent activation of STAT3 has been observed in multiple human malignancies, including various CRC stages.18, 19, 20 Furthermore, a high expression of STAT3 alters the cell cycle21, 22 and inhibits the apoptosis by upregulating anti-apoptotic signaling23, 24 in inflammation-associated CRC and other human cancers.25 Besides, GSTP1 negatively regulates STAT3 activation in epidermal growth factor (EGF) signaling, and is also a regulator of the cell cycle via EGF signaling in human hepatocellular carcinoma (HCC).8 However, the regulatory mechanisms between GSTP1 and STAT3 in the progression of CRC remain unknown.
Our previous studies identified that the loss of F-box only protein 8 (FBX8) was associated with patients’ poor survival in HCC, gastric cancer and CRC.26, 27, 28 The FBX8 is a metastatic suppressor downstream of miR-223 and targets the degradation of mammalian target of rapamycin (mTOR) in CRC.27 We also found that FBX8 inhibited the proliferation, invasion and metastasis of CRC by promoting the degradation of GSTP1. Simultaneously, we confirmed that GSTP1 could be used as an effective marker to predict the prognosis of CRC.29
Objectives
Our present study revealed that the overexpression of GSTP1 could promote the proliferation, invasion and metastasis of CRC cells by upregulating STAT3, and that FBX8 could regulate this function.
Materials and methods
Samples collection and ethical approval
A total of 20 paraffin-embedded CRC primary tumor samples were obtained from the Department of Pathology of Nanfang Hospital, Southern Medical University, Guangzhou, China. Each sample was diagnosed with primary CRC: tubular adenocarcinoma (in 14 samples); papillary adenocarcinoma (1); mucinous adenocarcinoma (3); and signet-ring cell carcinoma (2). Fresh CRC tissues were collected immediately after resection from 8 patients who underwent CRC resection without prior radiotherapy and chemotherapy at the Department of General Surgery of Nanfang Hospital in 2019. All aspects of the study complied with the principles of the Declaration of Helsinki and the study was approved by the Nanfang Hospital Research Ethics Committee. No informed consent was required, as the data were analyzed anonymously. Paraffin-embedded mice CRC tumor samples used in the study were prepared in our previous experiments.29 The research related to the use of animals complied with all relevant national regulations and institutional policies for the care and use of laboratory animals.
Immunohistochemistry
The CRC human and animal tissue samples, which were formalin-fixed and paraffin-embedded, were dewaxed and rehydrated, and 3% hydrogen peroxide (H2O2; ZSGB-Bio, Beijing, China) was used to eliminate endogenous peroxidase. The antigens on the tissue slides were retrieved with 0.01 M sodium citrate buffer (pH 6.0) by microwave oven boiling for 5 min. After blocking the nonspecific antigens of the tissues with 5% goat serum (ZSGB-Bio) for 1 h at room temperature, the anti-GSTP1 (1:200; Abcam, Cambridge, UK) or anti-STAT3 (1:100; Abcam) antibody was diluted in an appropriate proportion and incubated overnight at 4°C. The tissue slides were incubated with the horseradish egg protein rabbit secondary antibody (ZSGB-Bio) or the murine secondary antibody (ZSGB-Bio) for 90 min at room temperature. Streptavidin was labeled with appropriate horseradish peroxidase (HRP; ZSGB-Bio), and incubated for 30 min at room temperature. The 3,3′-diaminobenzidine (DAB; ZSGB-Bio) color developer was needed for microscopic observations.
Staining was scored in a double-blind manner by 2 researchers with a score of 0 (representative negative), 1 (weak), 2 (medium), and 3 (strong). Depending on the percentage of the stained area relative to the total cancerous tissue area or blood vessel area, the staining range was divided as follows: 0 points (0%); 1 point (1–25%); 2 points (26–50%); 3 points (51–75%); and 4 points (76–100%). The sum of the dyeing strength and range was taken as the final dyeing value (0–7): (−) total score <3 points; (+) total score 3 points; (++) total score 4 points; and (+++) total score ≥5 points, in which (−) or (+) form the low-expression groups, whereas (++) and (+++) are the high-expression groups.
Co-immunoprecipitation
In brief, the extracts of SW620 cells were blocked with immunoglobulin G (IgG) or protein A/G agarose (BioWorld, Visalia, USA) for 2 h at 4°C to remove nonspecific protein binding, and then incubated with anti-FBX8 (Abcam, Cambridge, UK) or anti-GSTP1 overnight at 4°C. Protein A/G Agarose was separated by centrifugation (2500 rpm) at 4°C. After blocking with 5% skim milk for 1 h at room temperature, polyvinylidene difluoride (PVDF) membranes (Roche Applied Science, Penzberg, Germany) were incubated with anti-GSTP1 (1:200) and anti-STAT3 (1:100) overnight at 4°C. The protein bands were visualized by using an enhanced chemiluminescence (ECL) HRP kit (fluorescence detection (FD) bio-Femto (Yeasen, Shanghai, China).
Immunofluorescence
A total of 0.5 × 10⁴ cells were seeded on confocal NEST® glass-bottom Petri dishes (NEST, Wuxi, China) for a 24-hour incubation. Then, the cells were fixed with 4% paraformaldehyde, permeabilized with 0.02% Triton-X-100/1 × phosphate-buffered saline (PBS) and blocked in a blocking fluid (1 × PBS + 10% fetal bovine serum (FBS) and 1% bovine serum albumin (BSA)) (Thermo Fisher Scientific, Waltham, USA). The Petri dishes were incubated with anti-GSTP1 (1:200) and anti-STAT3 (1:100) overnight at 4°C. The secondary antibodies conjugated to Alexa Fluor® 488 or 594 (Invitrogen, Waltham, USA) were added to the incubated cells for 2 h at room temperature. The 4′,6-diamidino-2-phenylindole (DAPI) was used to stain the cell nucleus. Confocal images were taken with the use of an inverted fluorescence microscope (Olympus Corp., Tokyo, Japan) and outputted by means of the PV10-ASW viewer software v. 1.7 (Olympus Corp.).
Glutathione S-transferase pull-down assay
We used GST-mediated pull-down assays (Thermo Fisher Scientific, Rockford, USA) to detect the interaction between the truncated GSTP1 and STAT3 in HCT116 and SW620 cell lines. Firstly, recombinant GST-STAT3-CCD (coiled-coil domain) (218-400), GST-STAT3-DBD (DNA-binding domain) (401-564), GST-STAT3-linker (565-663), and GST-STAT3-SH2 (Src homology 2 domain) (664-768) proteins were expressed and purified. Secondly, the purified GST-STAT3-CCD (218-400), GST-STAT3-DBD (401-564), GST-STAT3-linker (565-663), and GST-STAT3-SH2 (664-768) fragments were bound to glutathione resin as a GST-fusion protein and incubated with anti-GSTP1 for 2 h at 4°C. Thirdly, the complex was washed with the assay buffer and eluted with 5 mM reduced glutathione, and then the bound protein complexes were disrupted. Finally, the proteins were separated by means of sodium dodecyl sulfate–polyacrylamide gel electrophoresis (SDS–PAGE) and detected with a western blotting assay.
Plasmid and siRNA transfection
The cells were transfected with plasmids or siRNA for STAT3 or GSTP1, respectively, with Lipofectamine® 3000, as per the manufacturer’s instructions (Thermo Fisher Scientific, Waltham, USA).
Cell proliferation assay (CCK-8)
The medium in a 96-well plate was replaced with 100 μL of the complete medium and Cell Counting Kit-8 (CCK-8) reagent mixture (9:1), and the plate was incubated in 5% CO2 for 2–4 h at 37°C. The optical density (OD) value at 450 nm for each well was detected with an enzyme labeling instrument (BioTek, Winooski, USA), and the OD value was adjusted to zero based on the blank control group. The cell proliferation curve was plotted with the mean value of 5 multiple holes in each group.
Cell invasion assays in vitro
Cells invasion assays in vitro were performed to assess the cell invasion ability. In brief, 200 μL of a serum-free medium containing 5 × 10⁴ cells was added to the upper chamber with the Corning® BioCoat™ Matrigel (Corning Life Sciences, New York, USA) and allowed to invade toward the lower chamber with 10% FBS. After incubation for an appropriate period of time at 37°C, the cells were fixed with methanol for 30 min and stained with crystal violet solution for 20 min. The migrated cells were photographed and counted in 6 random regions with an inverted microscope (Olympus Corp.).
Western blotting
During immunoblotting, the proteins were extracted with a lysis buffer, and then quantified by means of a bicinchoninic acid (BCA) protein assay kit (Beyotime, Shanghai, China). Equivalent amounts of cell lysates were separated using SDS–PAGE and transferred to PVDF membranes. The membranes were immunoblotted overnight at 4°C with anti-β-actin antibodies (1:1000; Proteintech, Chicago, USA), GSTP1 (1:200; Abcam, London, England), STAT3 (1:200; Abcam), GST (1:1000; Abcam), followed by appropriate second antibodies. The bands were visualized using the Pierce™ ECL western blotting substrate (Thermo Fisher Scientific). The immunoblotting image density was determined with gel densitometry (Bio-Rad Laboratories, Hercules, USA).
Quantitative reverse transcription polymerase chain reaction (qRT-PCR) analysis
The RNA of the cultured cells and the CRC tissues were extracted using the TRIzol® reagent (Invitrogen). The RNA expression level of GSTP1 was detected with the use of ABI PRISM 7500 Fast Real-Time PCR System (Thermo Fisher Scientific). The relative mRNA levels were calculated using the comparative Ct method (ΔΔCt). The primer sequences for qRT-PCR were as follows:
– GSTP1: Fwd: CGG GGT ACC ATG CCG CCC TAC ACC GT; Rev: CCG CTC GAG TCA CTG TTT CCC GTT GCC ATT;
– STAT3: Fwd: CAG CAG CTT GAC ACA CGG TA; Rev: AAA CAC CAA AGT GGC ATG TGA.
Cell culture and treatment
All cell lines were obtained from American Type Culture Collection (ATCC; Manassas, USA). The human CRC cell lines (SW480, SW620, HCT116, and LOVO) were cultured in the Roswell Park Memorial Institute medium (RPMI) 1640 (high glucose) (Gibco Laboratories, Gaithersburg, USA) supplemented with 10% FBS (Gibco Laboratories). The medium was supplemented with 100 μg/mL streptomycin and 100 U/mL penicillin (Gibco™, Thermo Fisher Scientific, Waltham, USA), and the abovementioned cells were incubated at 37°C in a humidified chamber containing 5% CO2. The stable knocking down GSTP1 cancer cells (SW620/shGSTP1 and HCT116/shGSTP1 cell lines) were from the previous study.
Statistical analysis
All statistical analyses were performed by means of GraphPad Prism v. 6.02 (GraphPad Software, San Diego, USA). The results are presented as mean (M) and standard deviation (SD) or median (Me) and 95% confidence interval (95% CI). Pearson’s correlation coefficient was used to analyze the correlation between GSTP1 and STAT3. The one-way analysis of variance (ANOVA) was used to compare differences in the invasion ability of the 3 groups in invasion assays, and the two-way ANOVA to analyze differences in the proliferation ability of CRC cells at different time points between different groups. Before ANOVA, Levene’s test for the equality of variances was used. A two-tailed p < 0.05 was considered statistically significant in all tests.
Results
The expression levels of GSTP1
and STAT3 in human CRC tissues are positively correlated
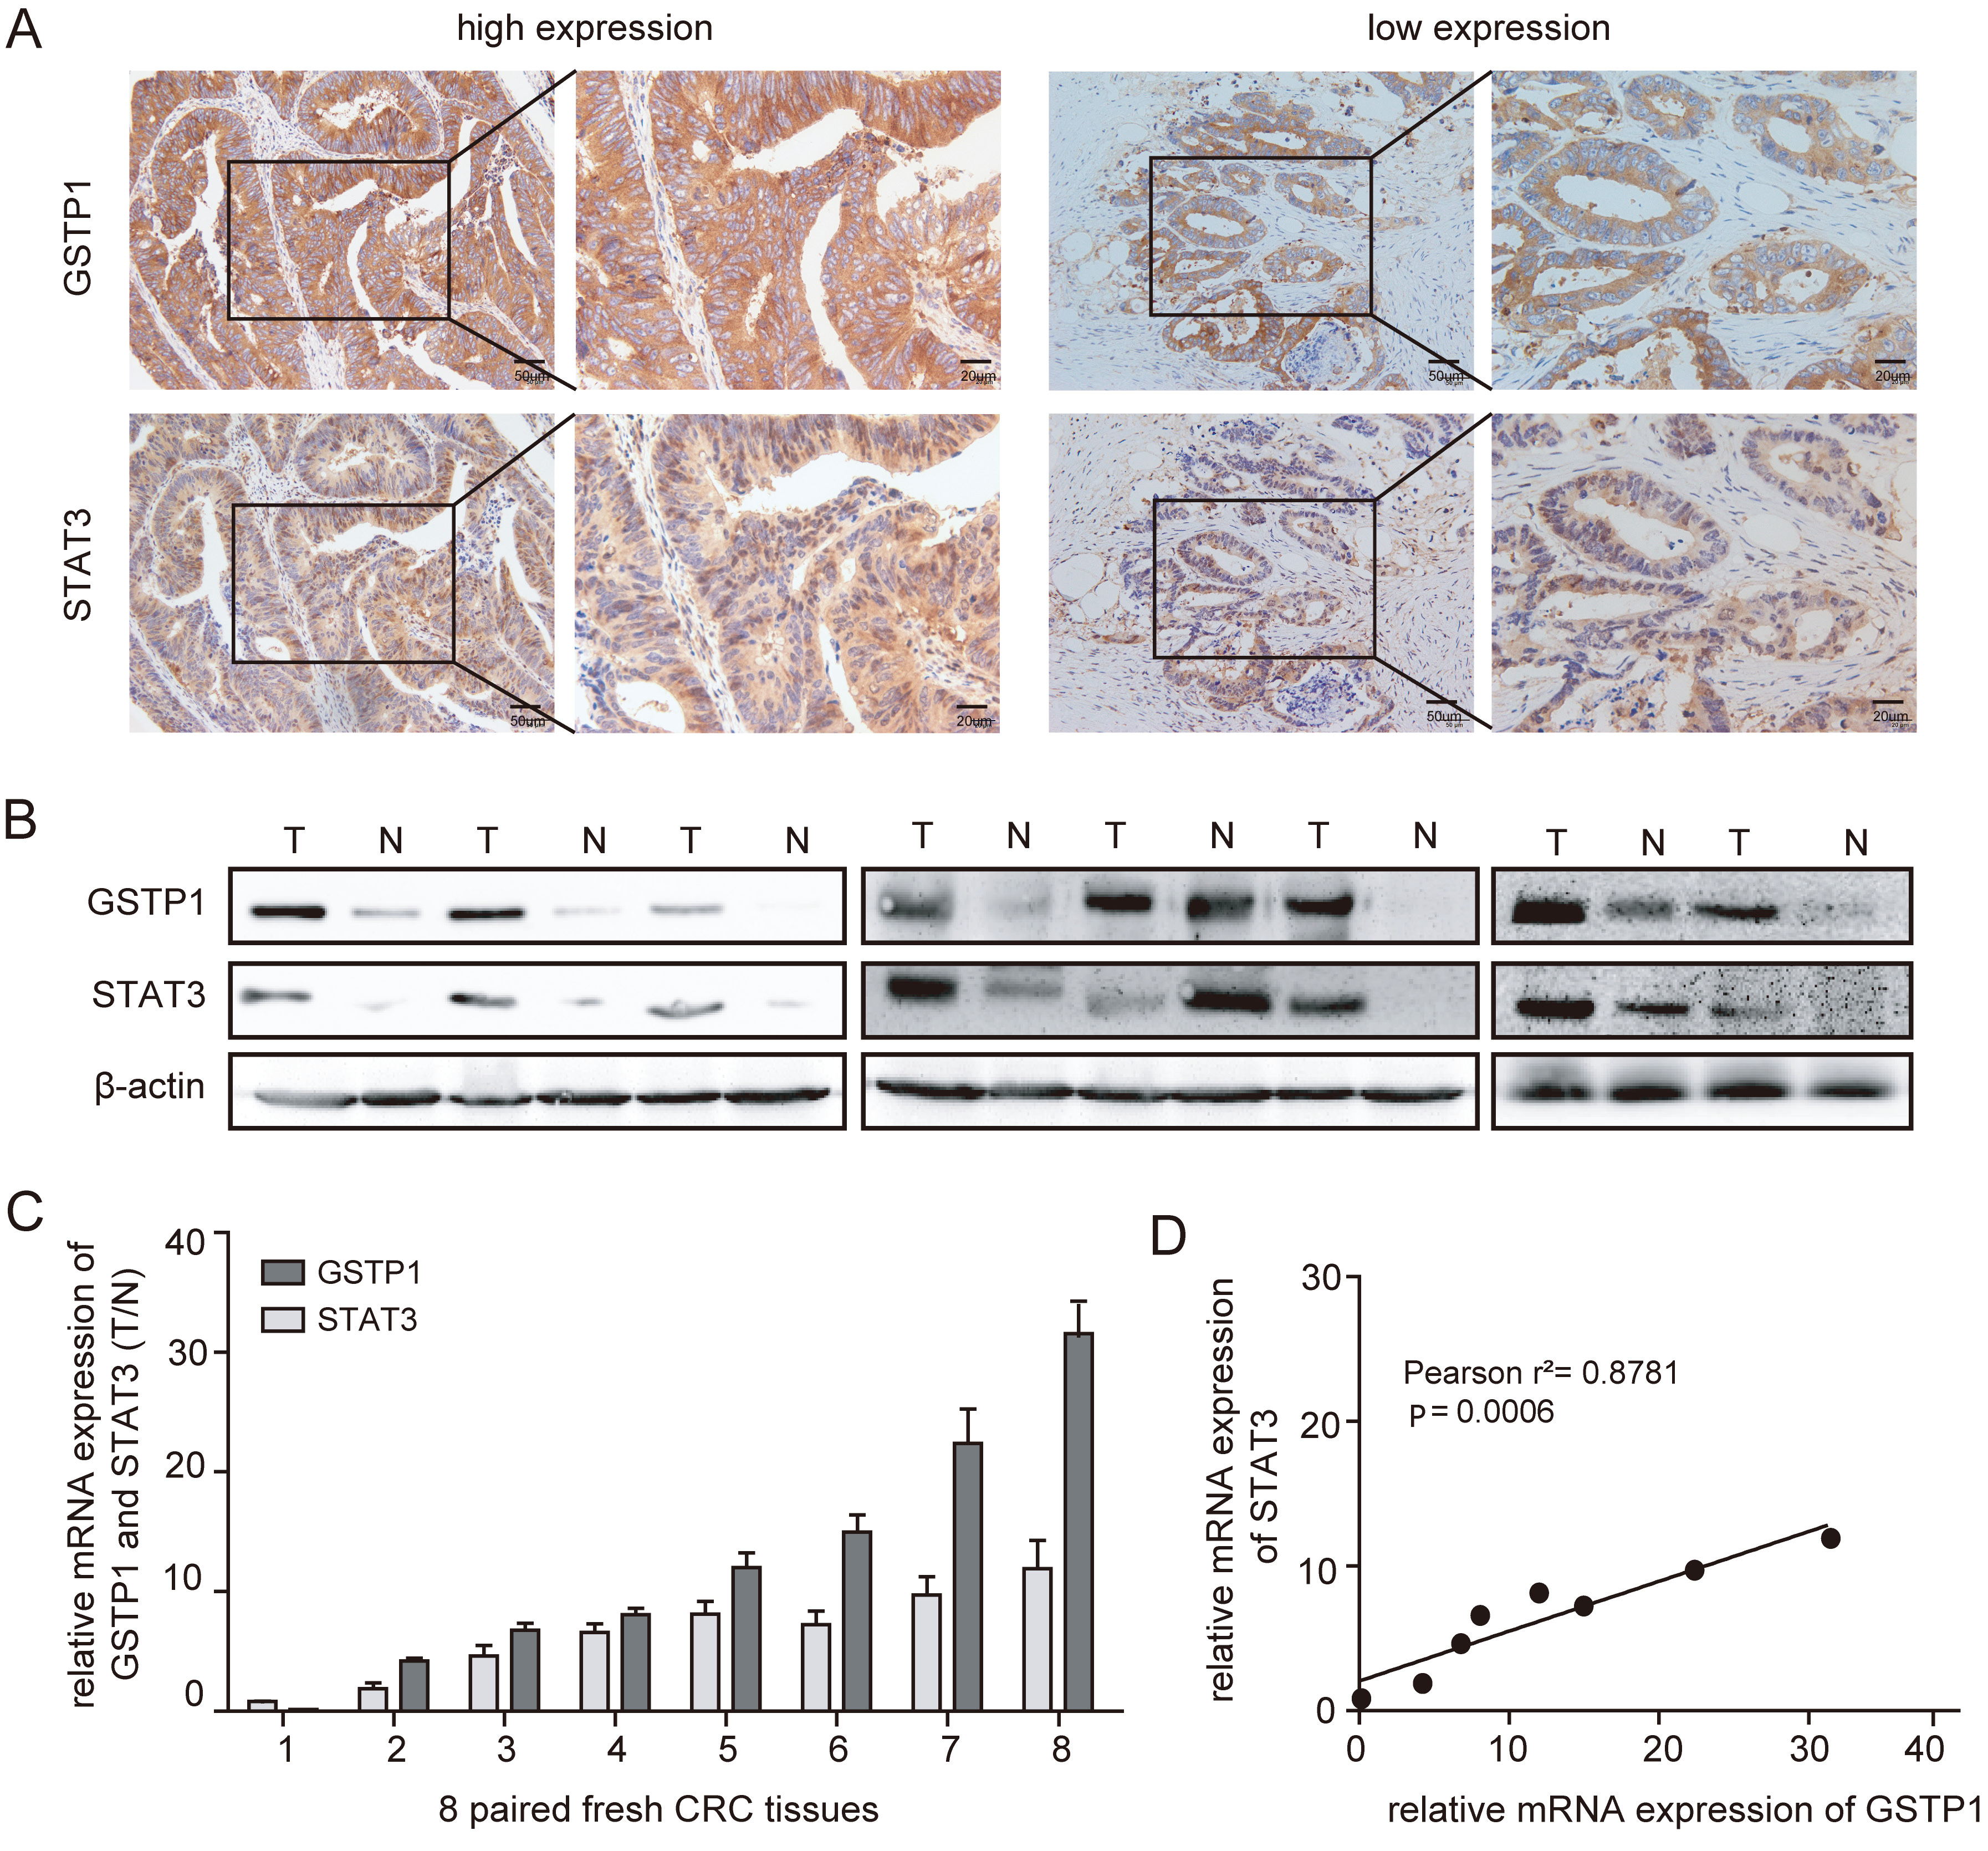
The STAT3, widely recognized as a cancer gene, is typically associated with a poor prognosis for various human malignancies, as it promotes cancer progression or metastasis.30, 31, 32, 33 The direct interaction between GSTP1 and STAT3 can promote HCC progression,8 and our previous study found that GSTP1 could be ubiquitinated by FBX8, thus inhibiting its function in promoting CRC proliferation, invasion and metastasis.29 Therefore, immunohistochemistry (IHC) was used to detect the expression of GSTP1 and STAT3 in 20 human CRC tissue samples. The results demonstrated that the expression levels of GSTP1 and STAT3 in human CRC tissues were positively correlated (Figure 1A). Western blotting and qRT-PCR were used to detect the expression levels of GSTP1 and STAT3 in 8 paired fresh CRC tissue samples (Figure 1B,C), and the results of these 2 experiments showed that the expression patterns of GSTP1 and STAT3 were highly correlated. After statistical analysis, it turned out that the expression of GSTP1 was positively correlated with the expression of STAT3 in the paired fresh CRC tissue samples, as shown in Figure 1D (Pearson’s correlation analysis, two-tailed test, r2 = 0.8781, p = 0.0006).
The overexpression of GSTP1 promotes the proliferation, invasion and metastasis of CRC cells depending on STAT3
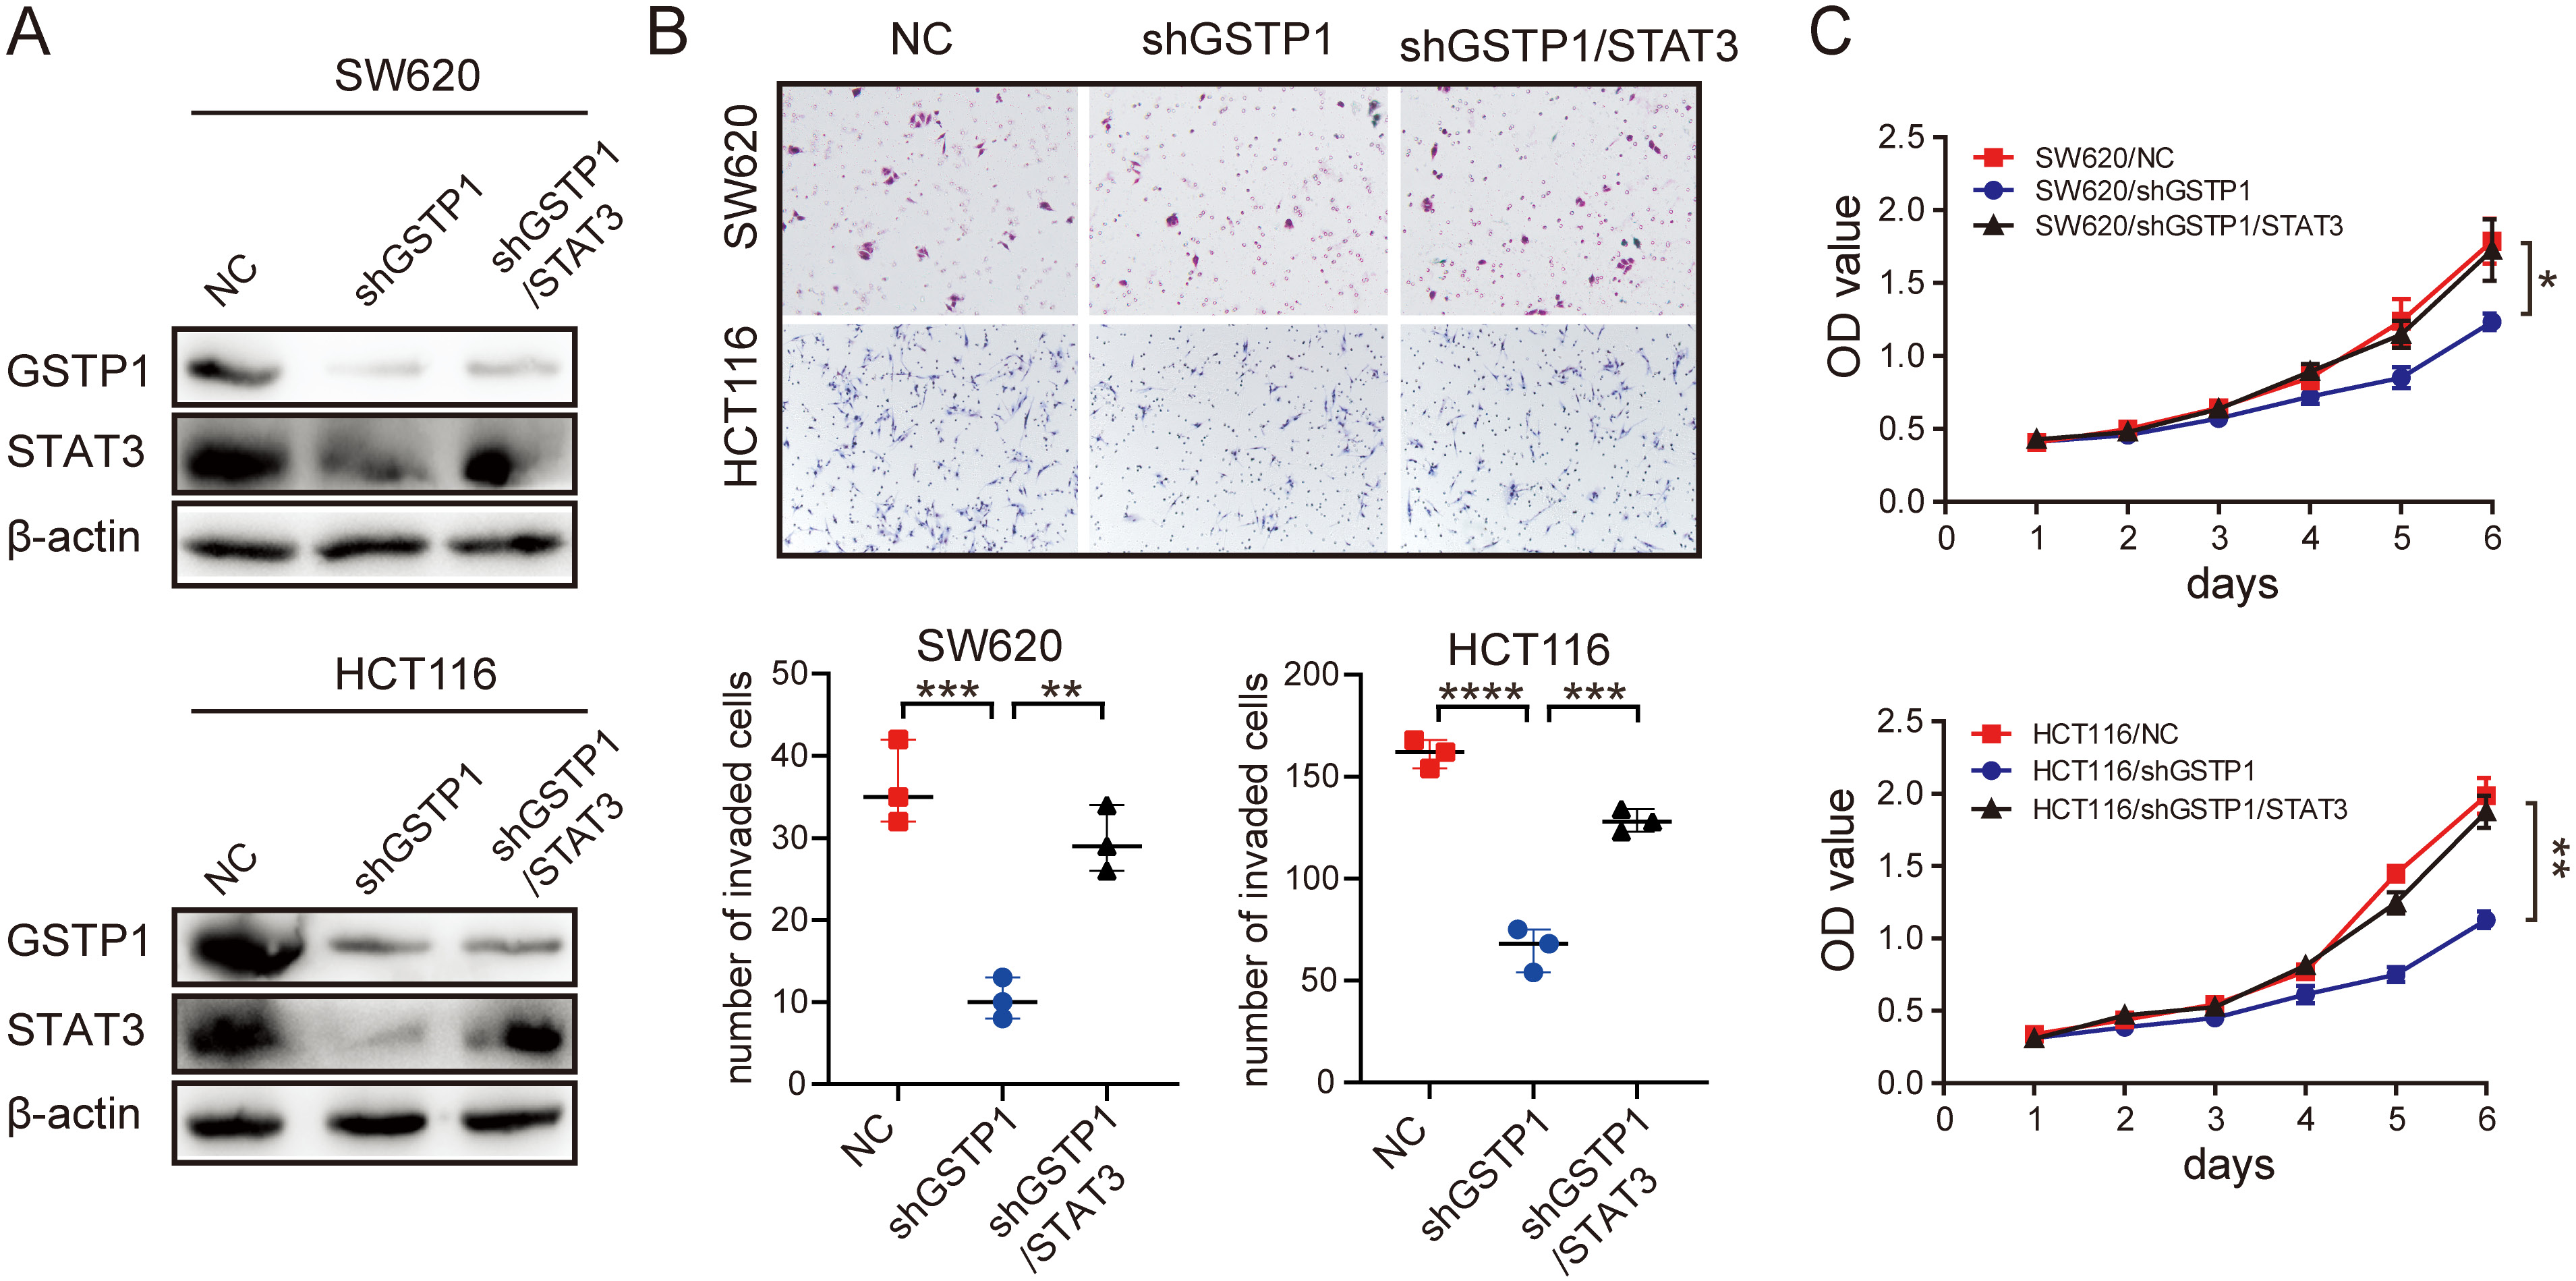
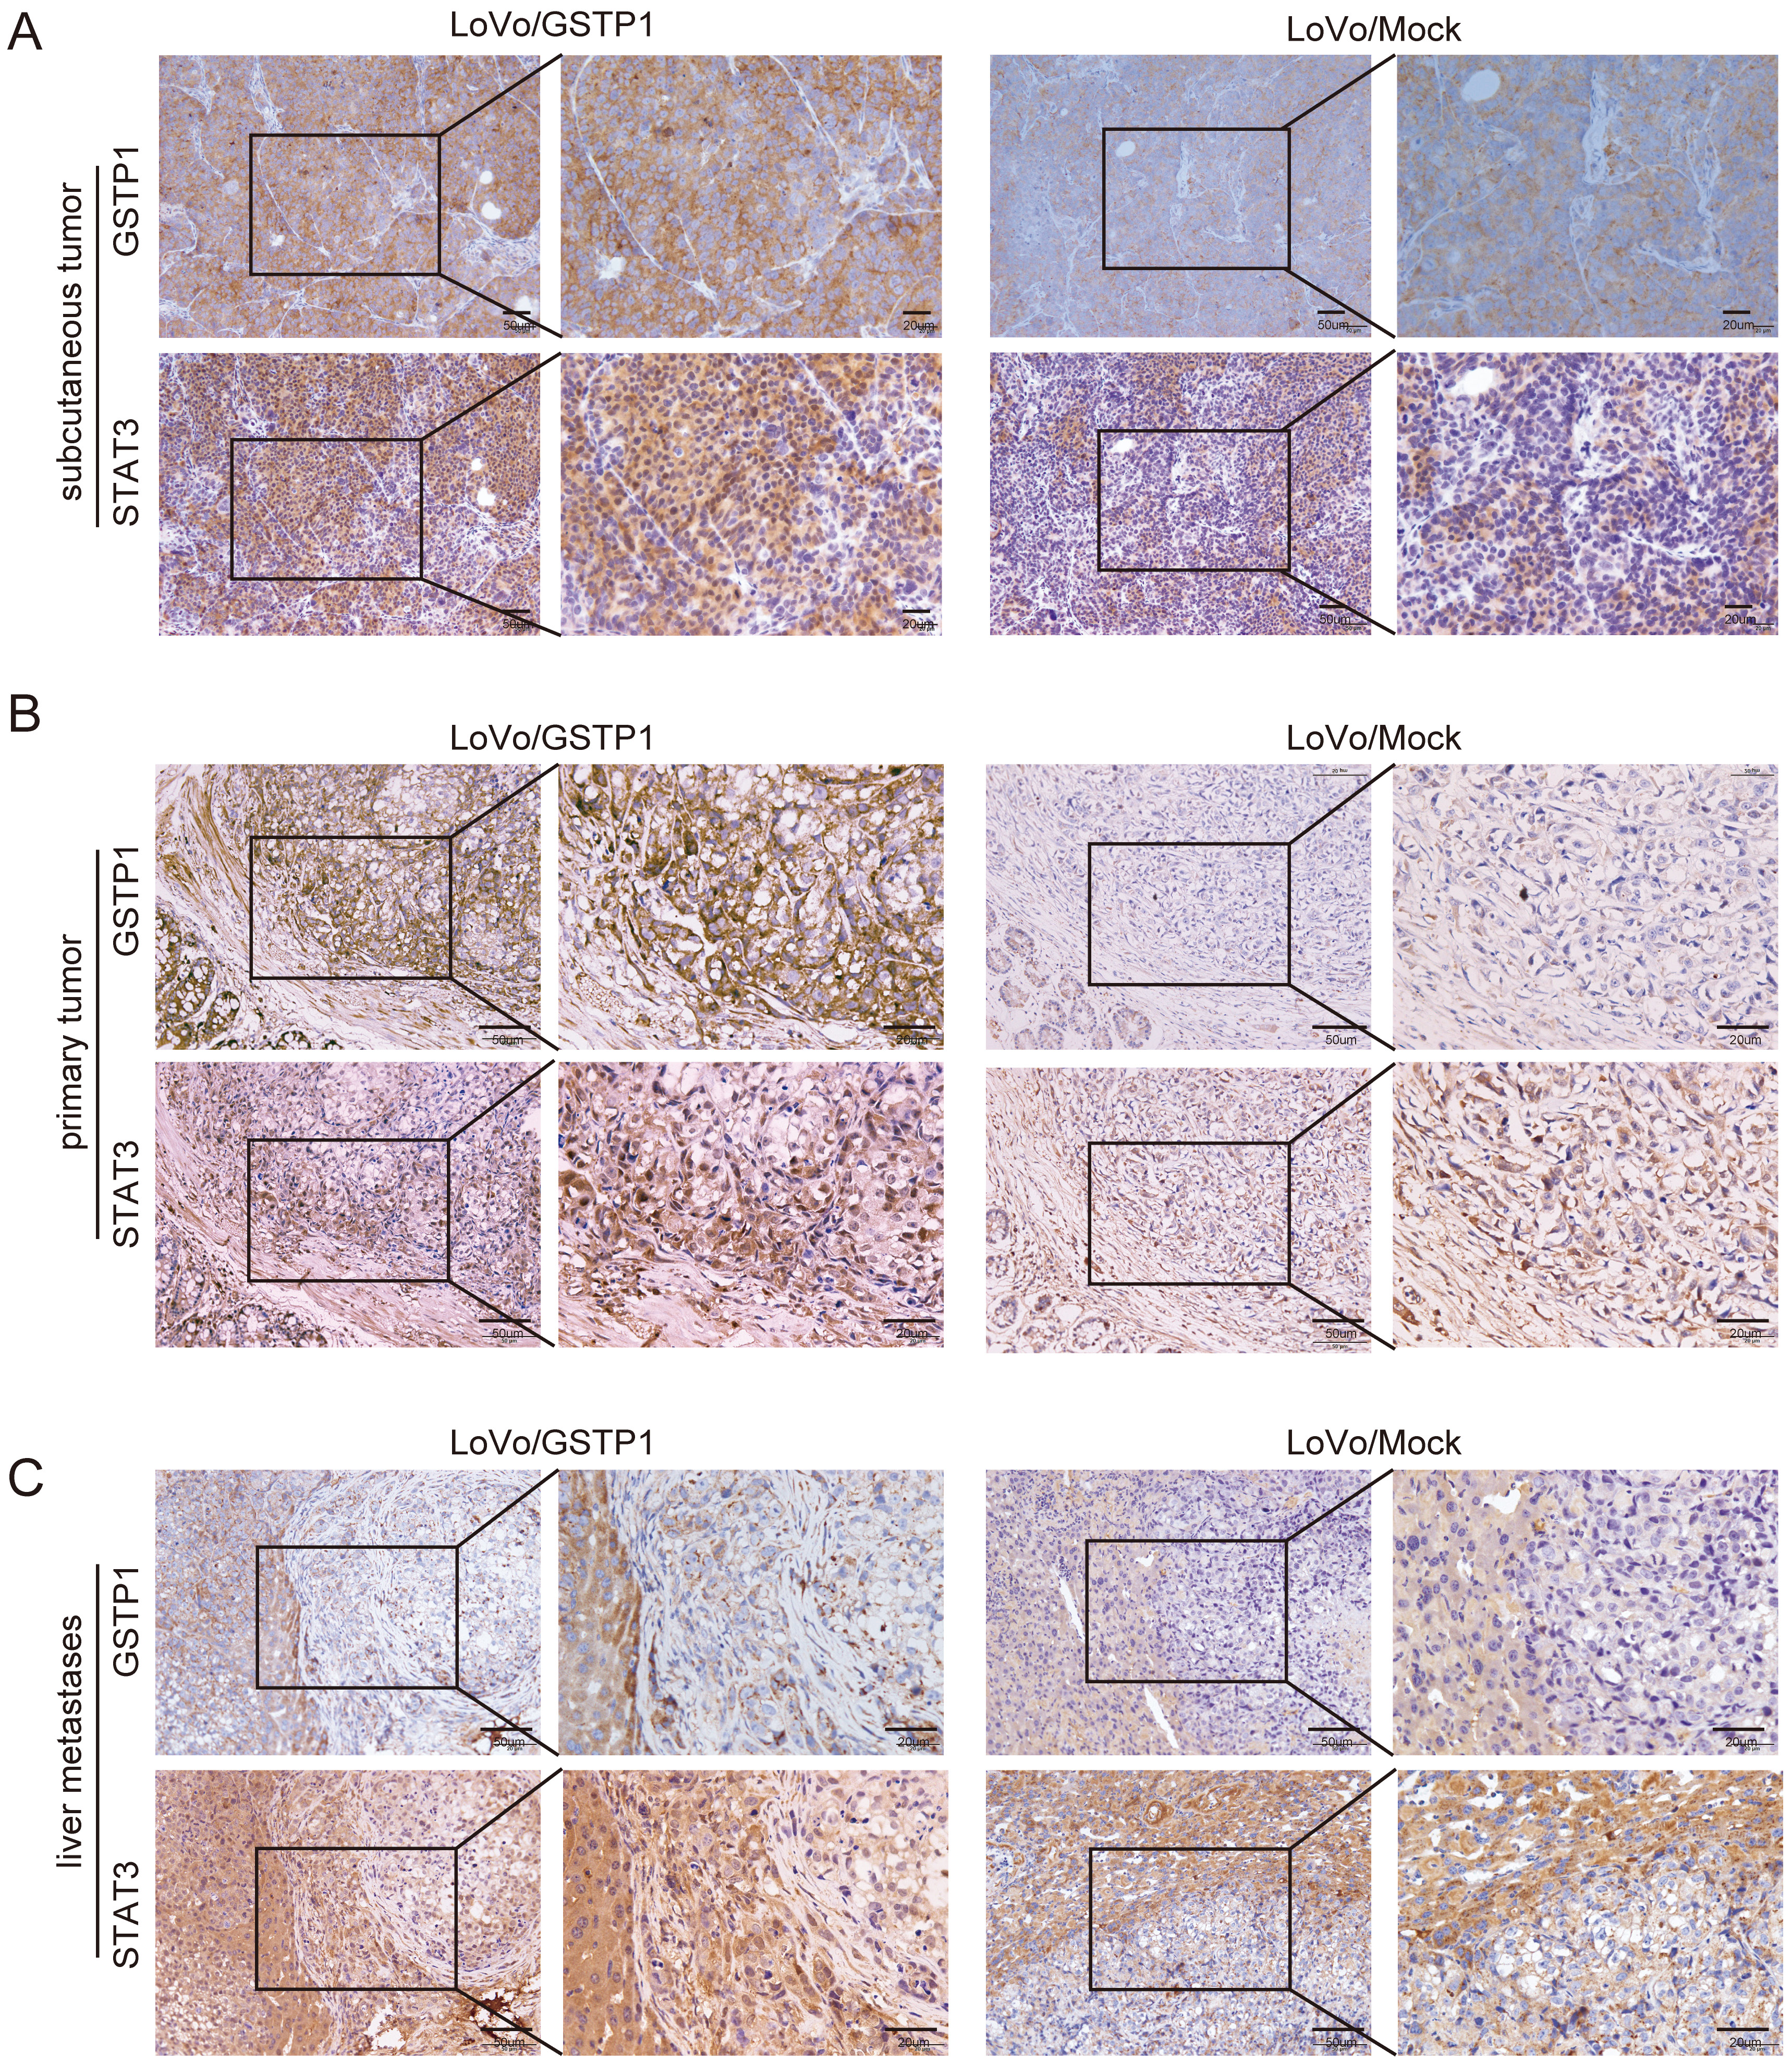
The expression of GSTP1 was positively correlated with the expression of STAT3. Taking into account previous studies, it was predicted by authors that GSTP1 might play a role in CRC progression by regulating STAT3. Therefore, the SW620 and HCT116 cell lines which stably knockdown GSTP1 were constructed (Figure 2A). Next, STAT3 was overexpressed in the above 2 cell lines; the results showed that the overexpression of STAT3 was successful (Figure 2A). Therefore, the SW620/shGSTP1/STAT3 and HCT116/shGSTP1/STAT3 cell lines were used to perform relevant recovery experiments. The results showed that the overexpression of STAT3 could significantly promote the invasion (Figure 2B) and proliferation (Figure 2C) of cells in the GSTP1-knockdown group in vitro. Besides, the expression levels of STAT3 and GSTP1 were detected in subcutaneous tumors (Figure 3A), in situ implants (Figure 3B) and liver metastases (Figure 3C) of CRC in the nude mouse tissues obtained from a previous study. The results demonstrated that in these 3 tumor tissues, the expression of STAT3 was significantly upregulated in the GSTP1 overexpressed group, which indicated that the expression levels of GSTP1 and STAT3 in the mouse tissue samples were consistent.
GSTP1 and STAT3 can directly bind to and regulate each other
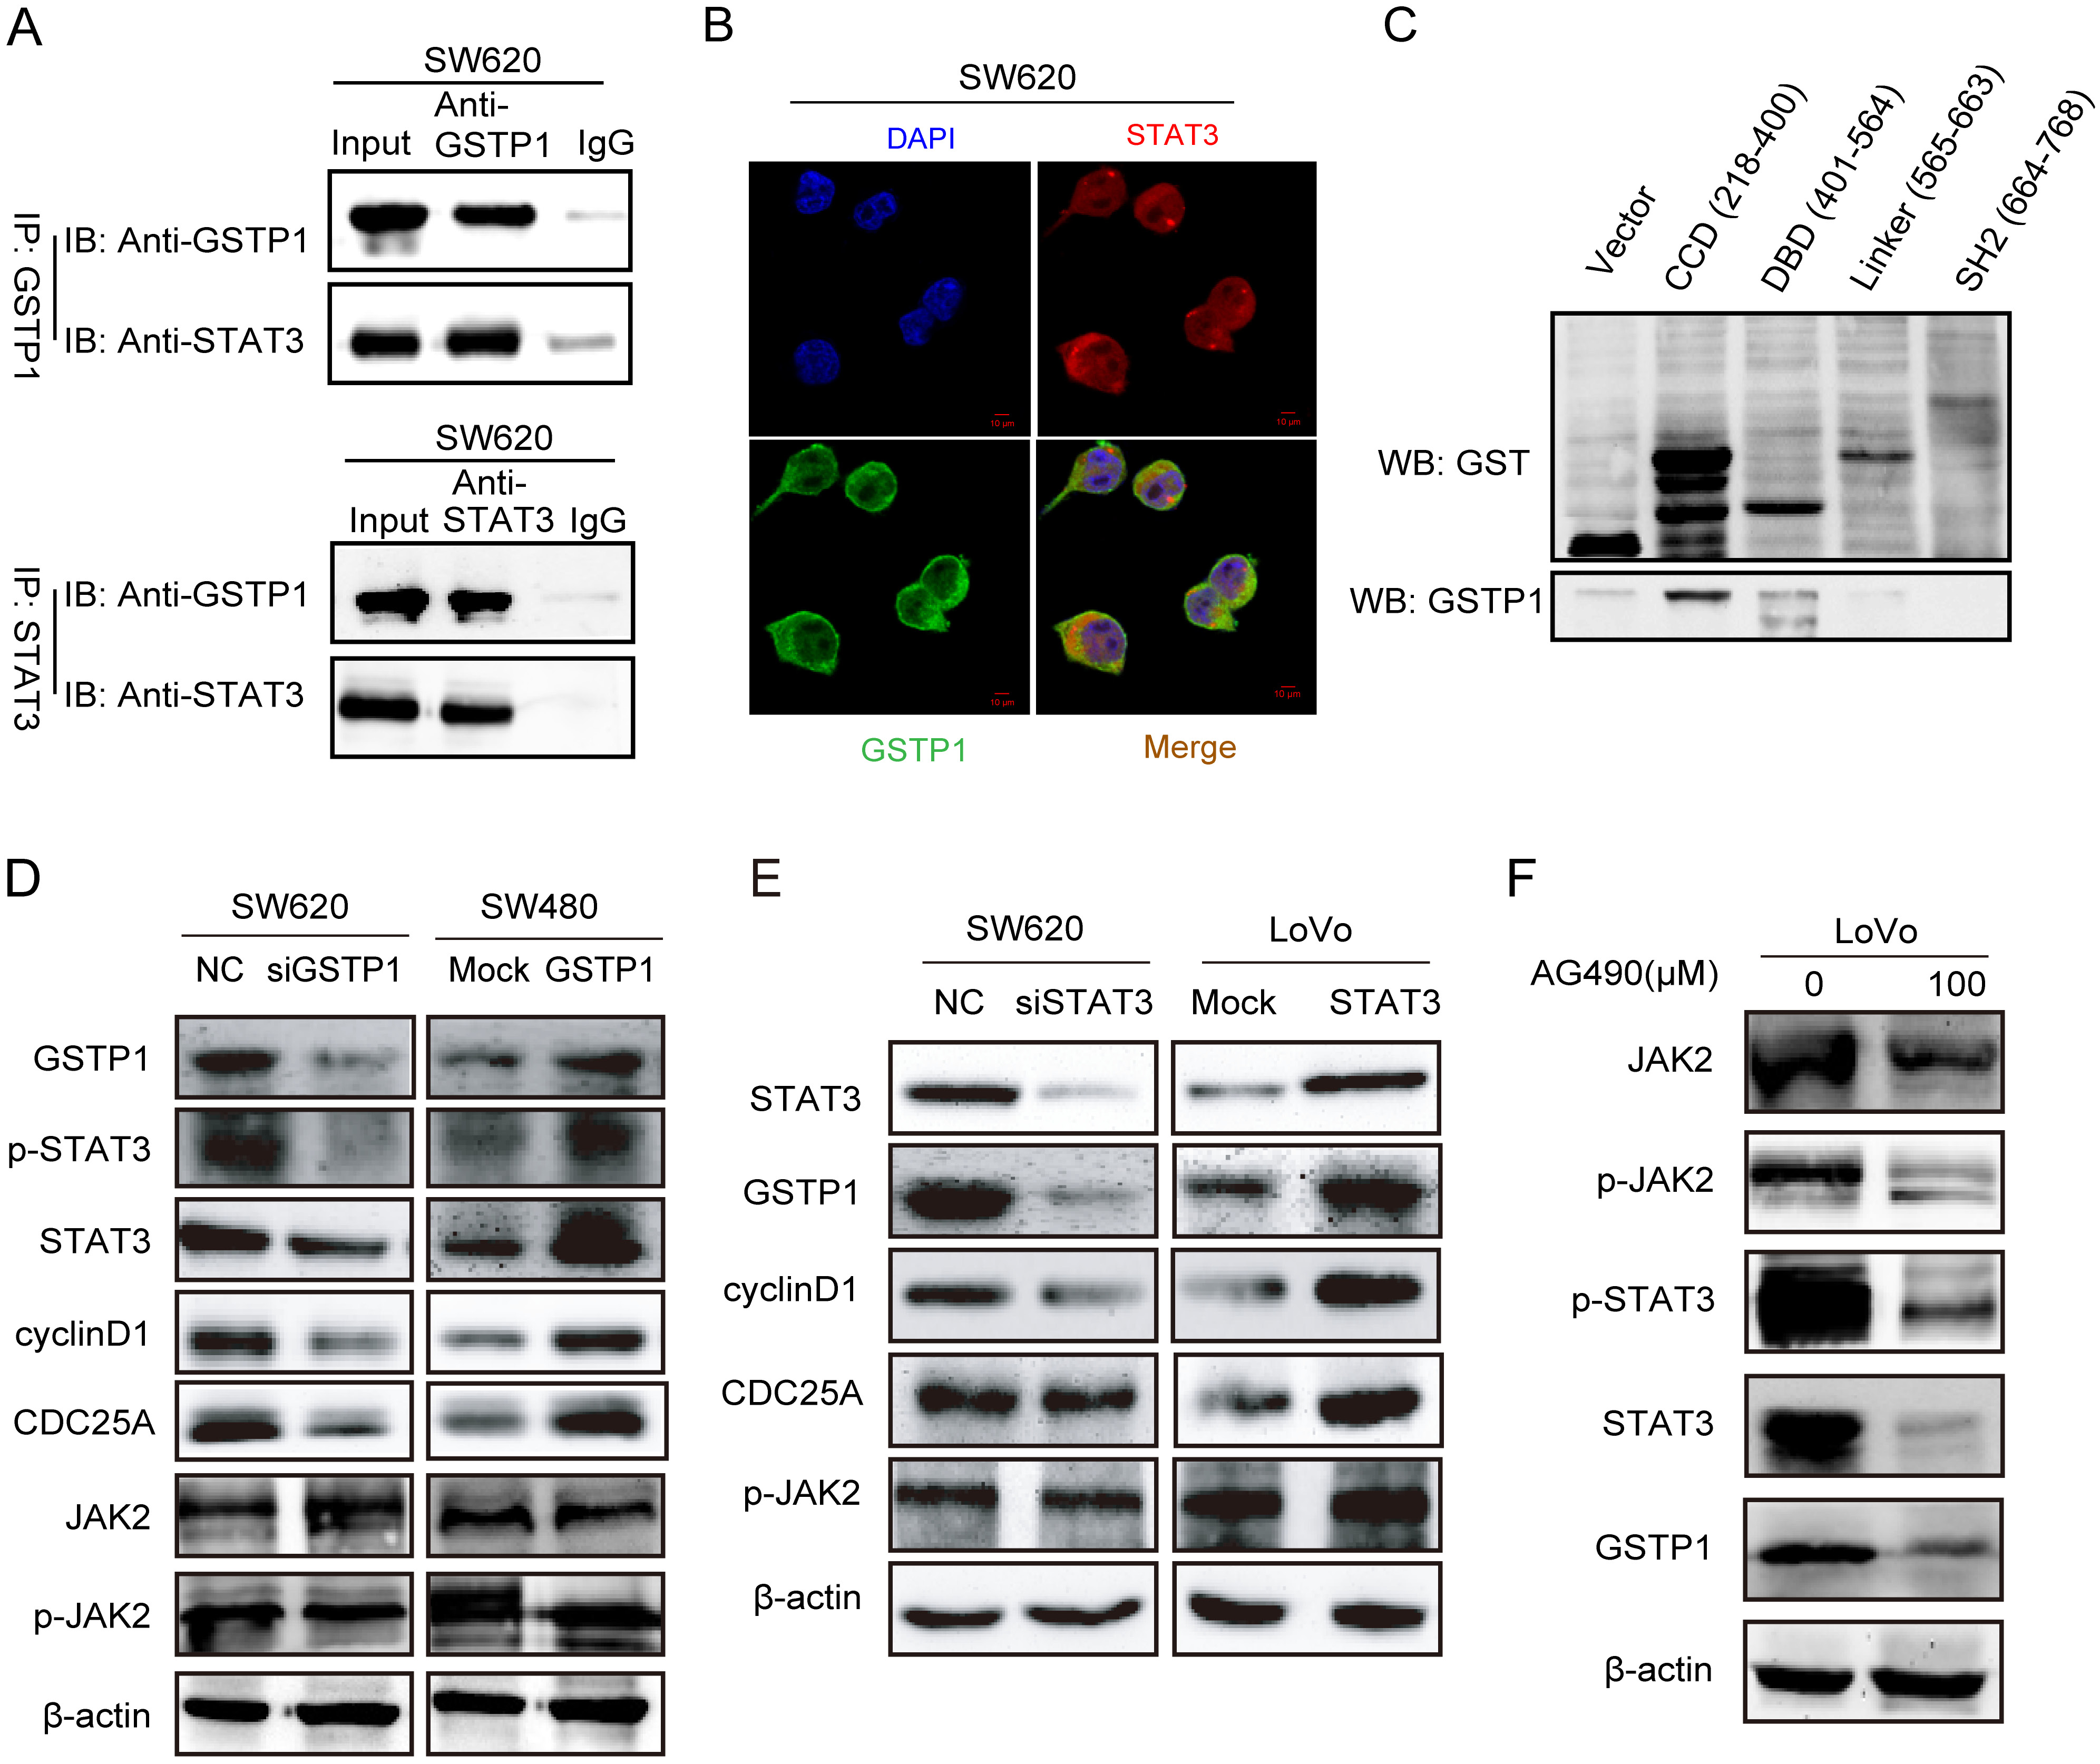
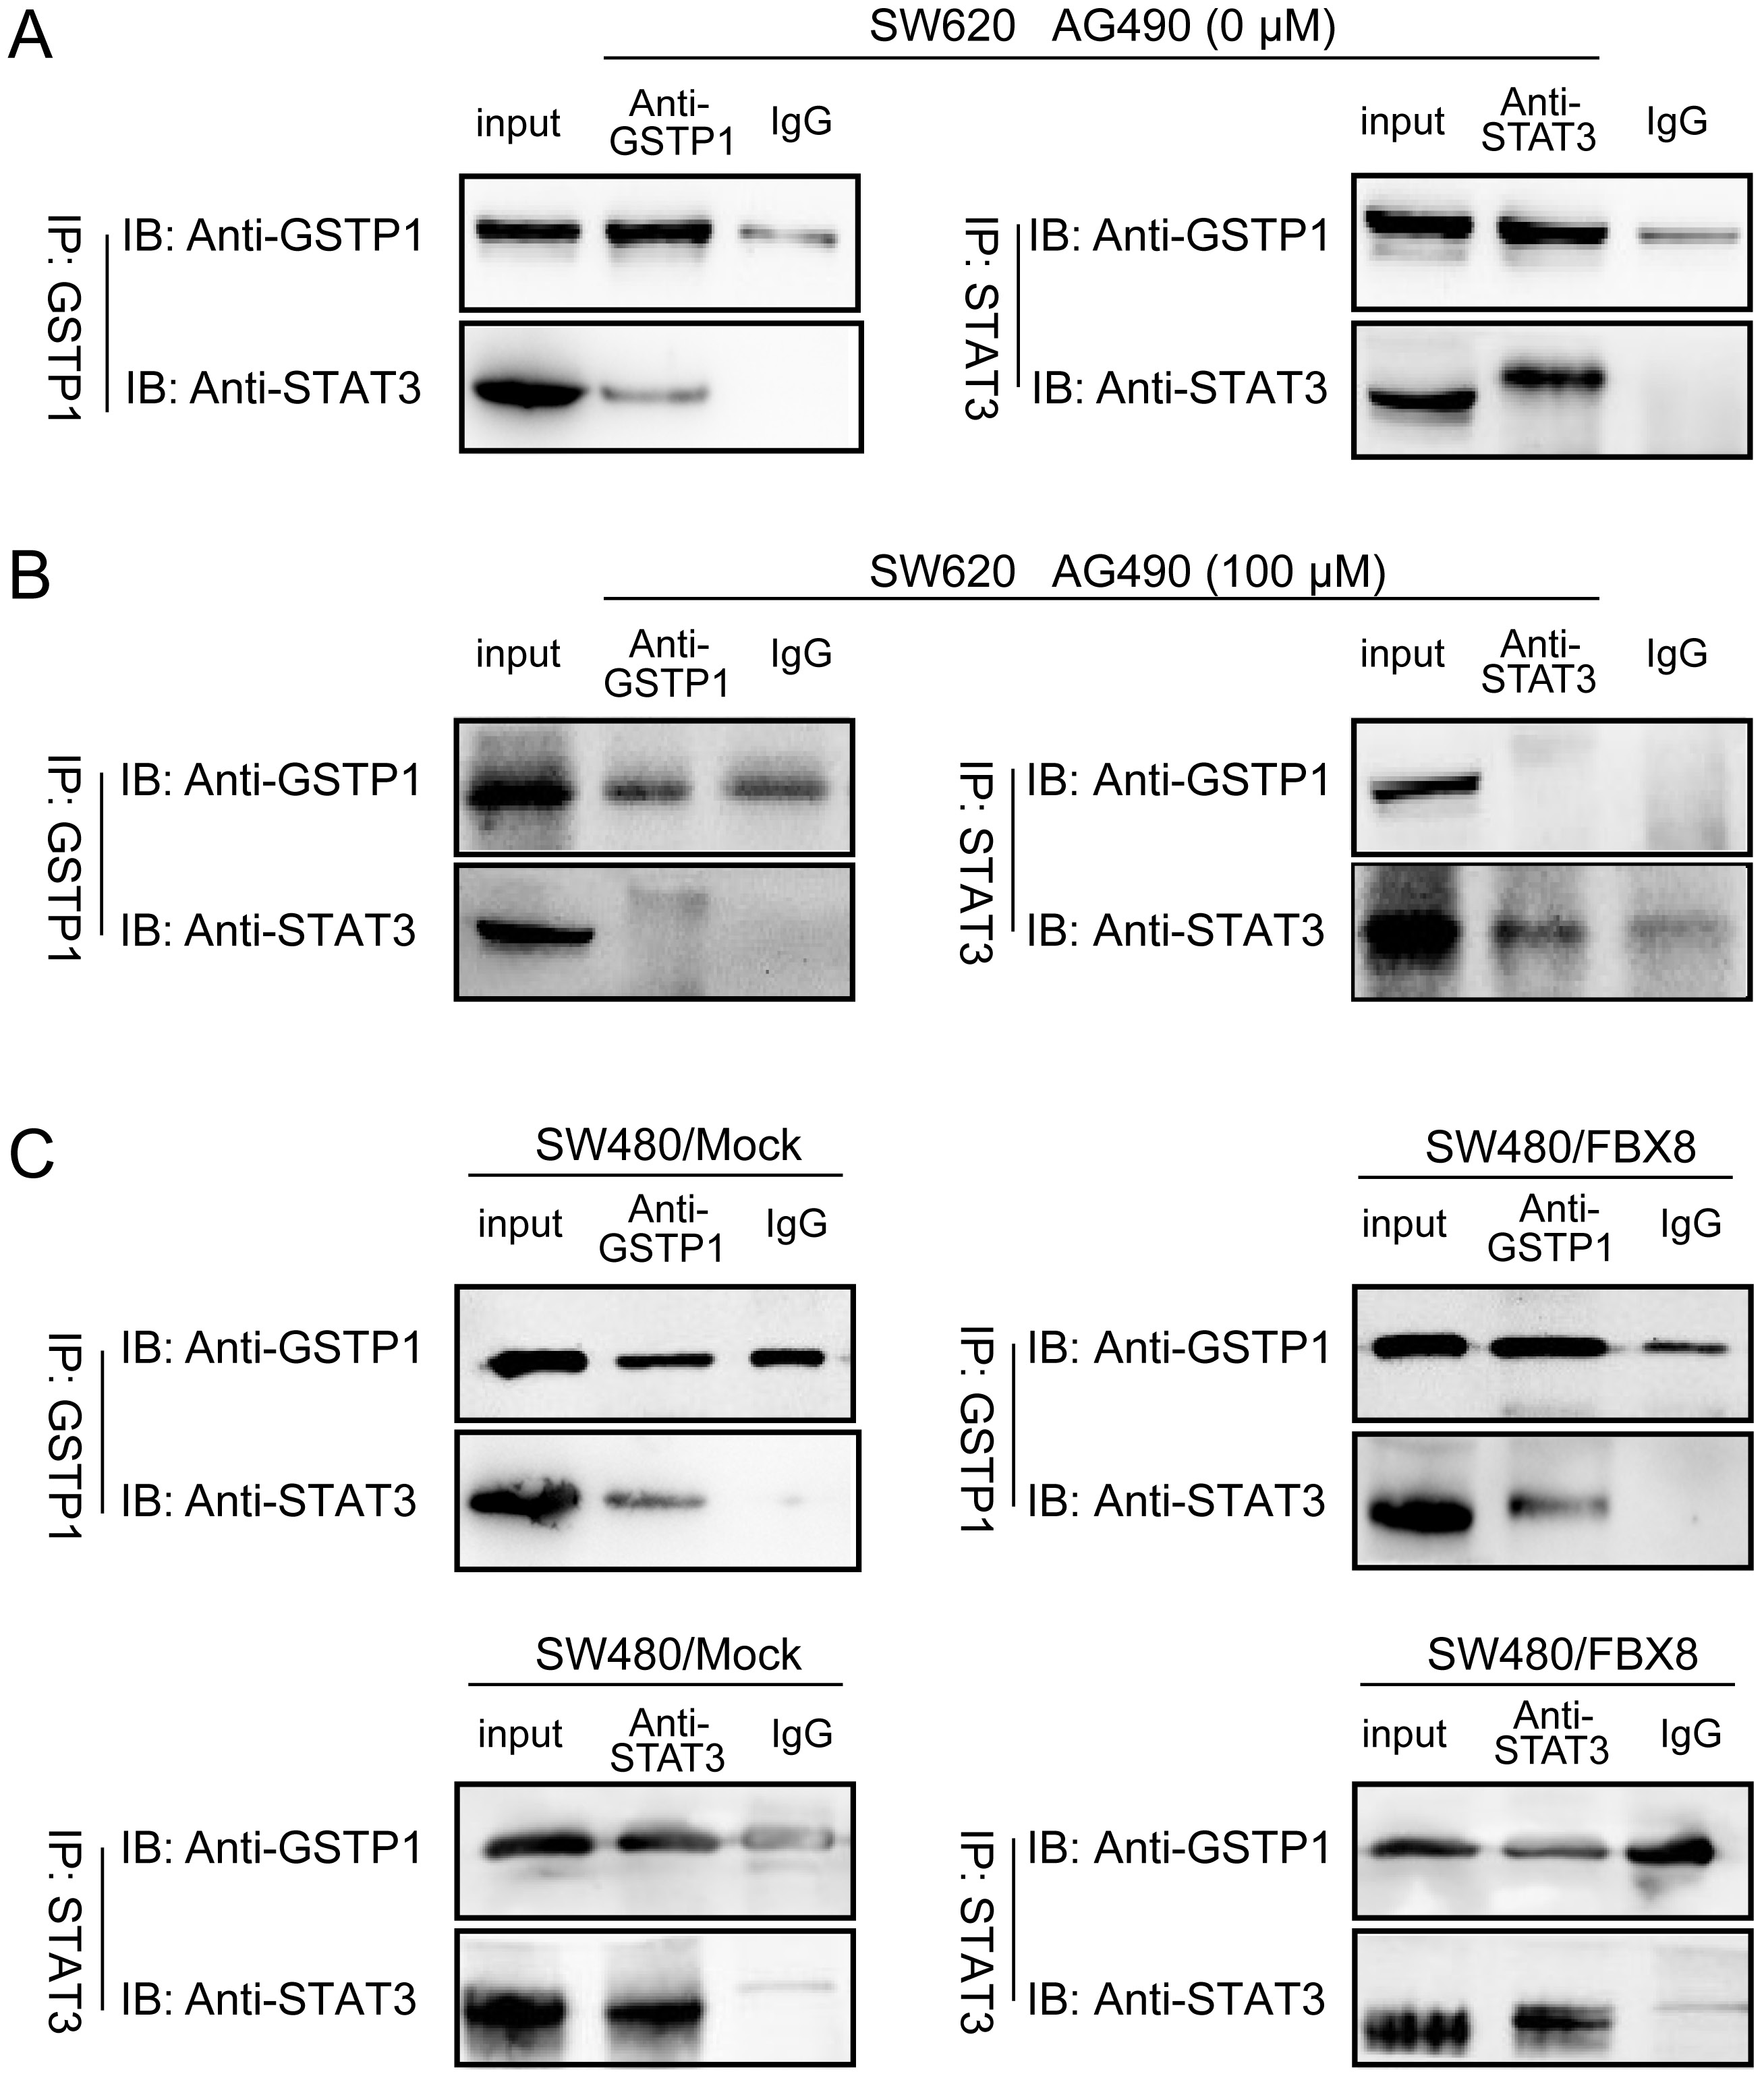
It was further hypothesized that GSTP1 could interact with STAT3 in CRC cells. Therefore, the co-immunoprecipitation (co-IP) and immunofluorescence (IF) analyses were performed to identify the interaction between the 2 proteins. As expected, the existence of GSTP1 in the immunoprecipitates obtained with an antibody against STAT3 was successfully detected (Figure 4A). The IF results demonstrated that GSTP1 and STAT3 exhibited co-localization in the cytoplasm of the SW620 cells (Figure 4B). The present study cloned 4 truncated constructs of STAT3: CCD (218-400); DBD (401-564); linker (565-663); and SH2 (664-768) (Figure 4C), and then identified an interaction between the CCD domain of STAT3 and GSTP1 by means of a GST pull-down assay (Figure 4C). It turned out that the CCD domain of STAT3 was essential for the interaction with GSTP1.
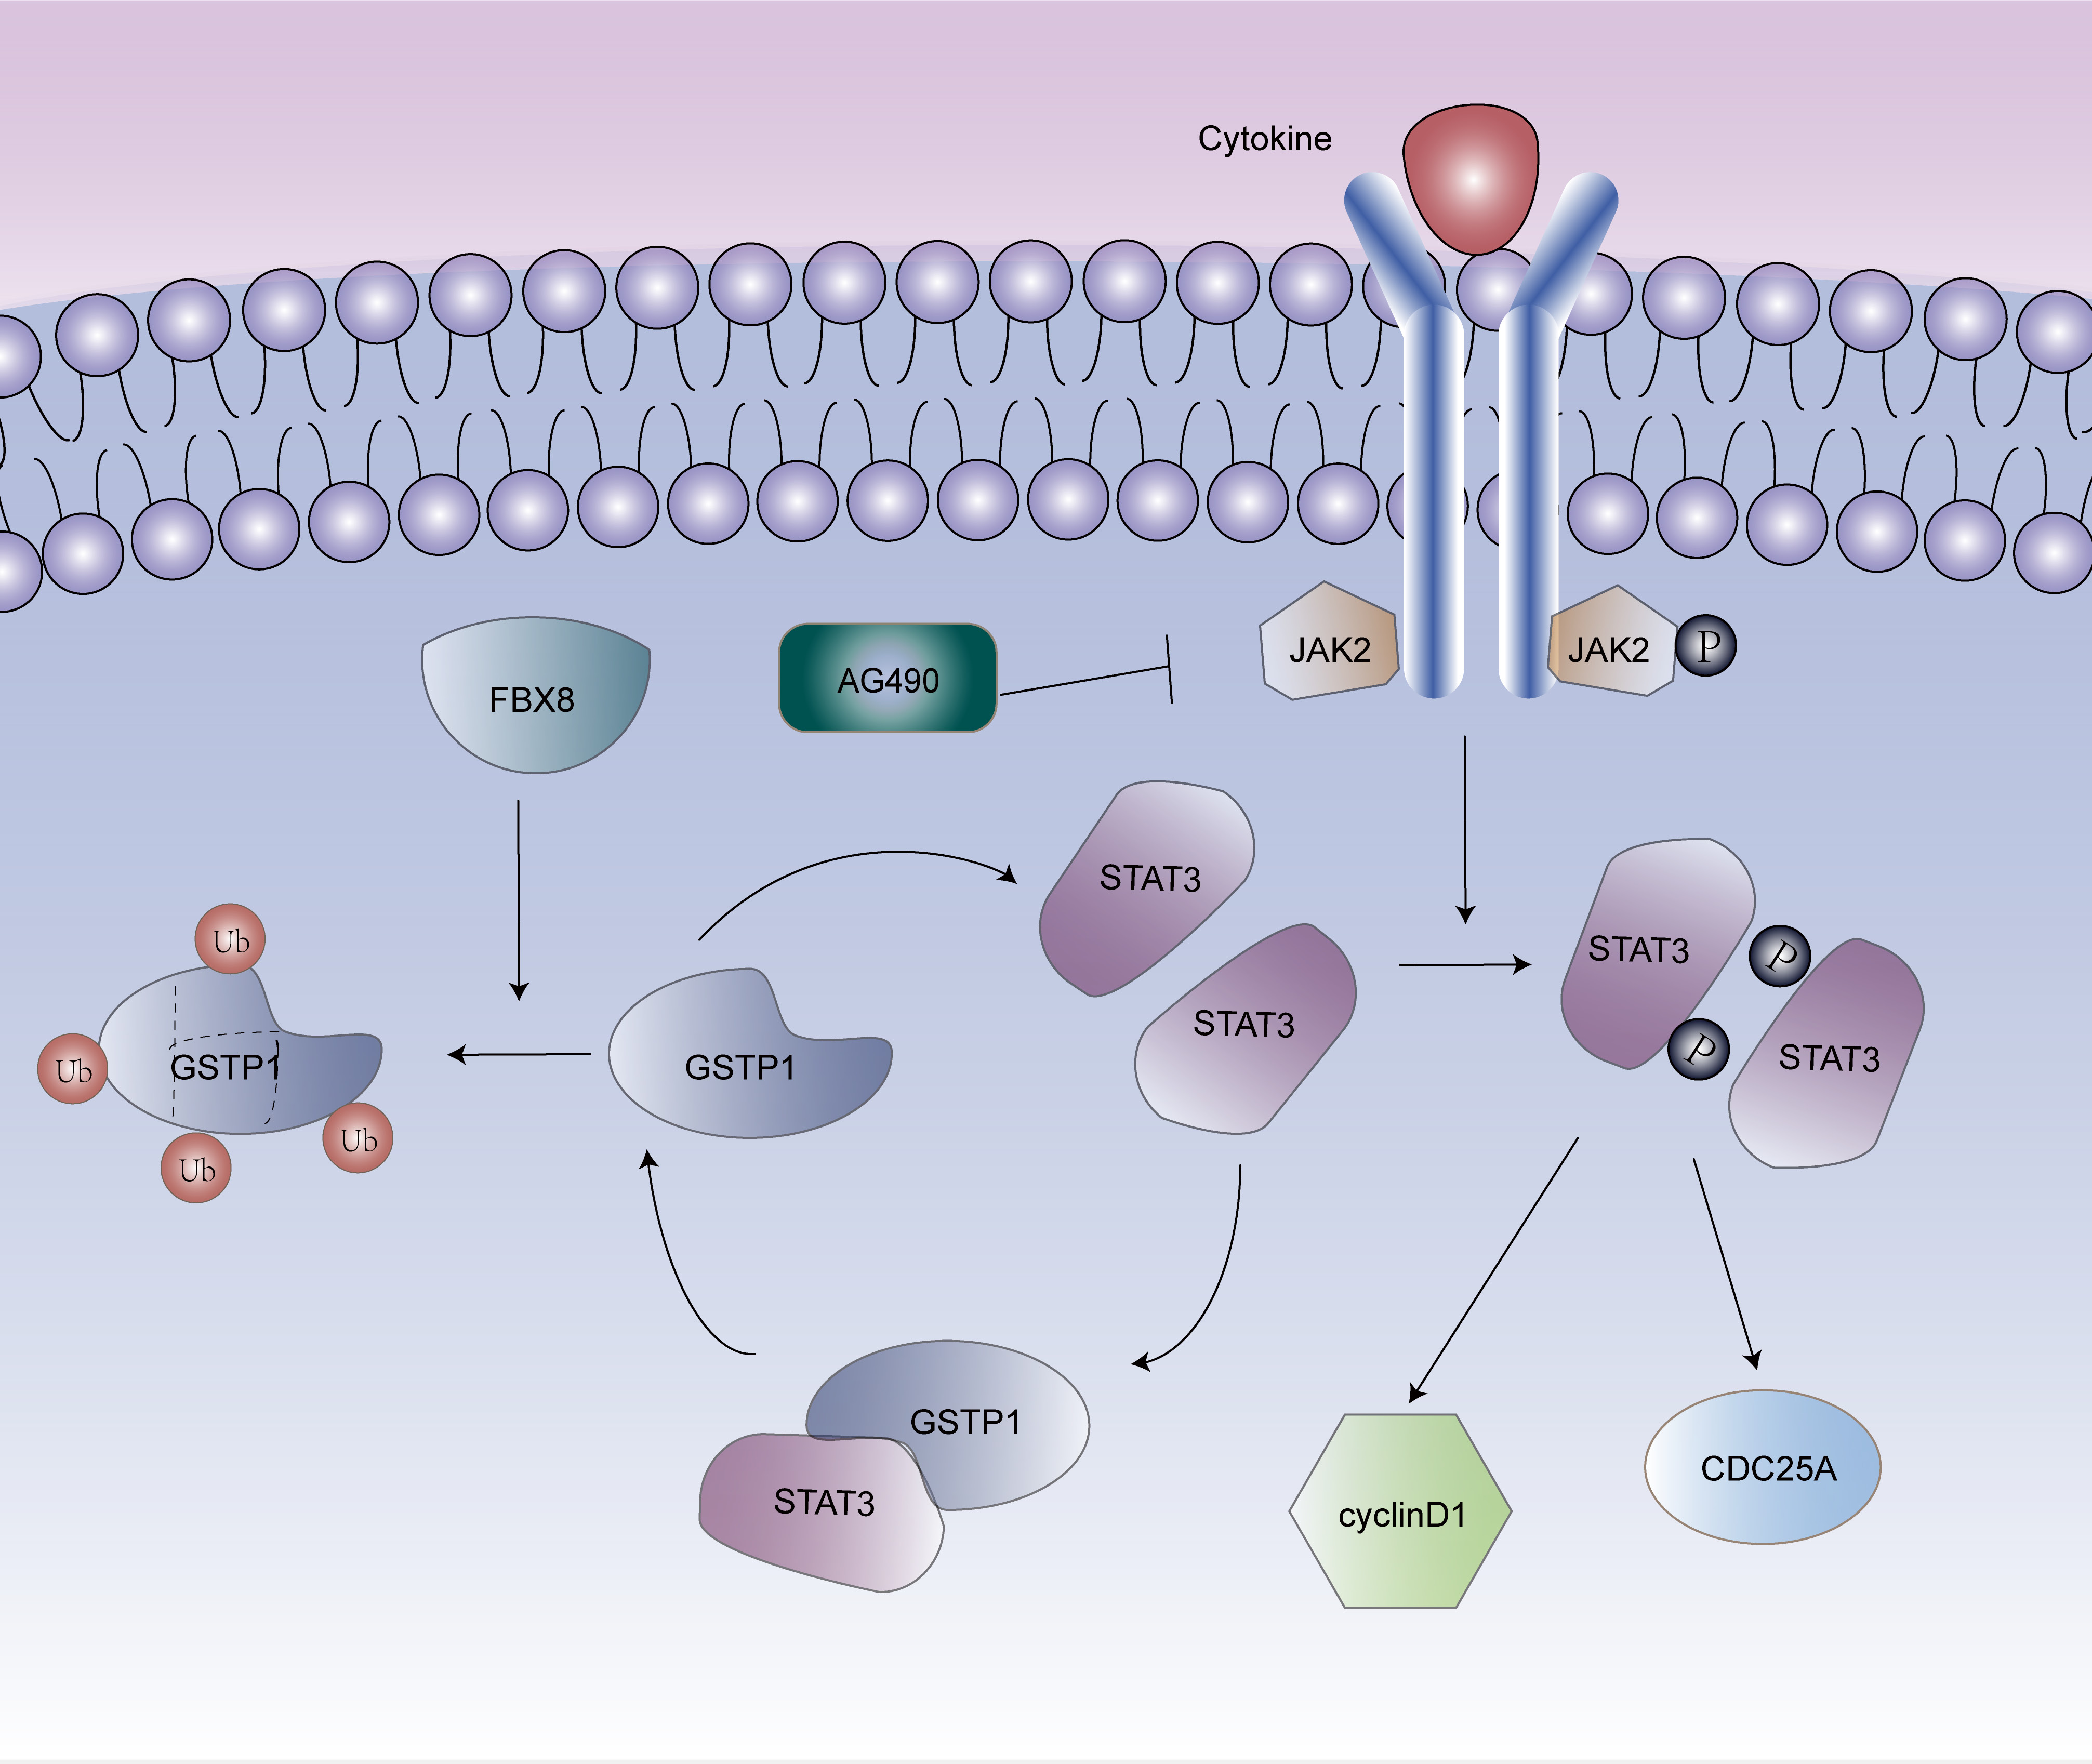
Thus, it was examined whether GSTP1 could activate the STAT3 signaling pathway in CRC cells, and then it was identified that the exogenous expression of GSTP1 further increased the protein expression of phosphorylated (p)-STAT3, STAT3 and downstream STAT3 targets (cyclin D1 and CDC25A) in the SW480 cells (Figure 4D). However, there was no appreciable effect on the upstream components of the STAT3 signaling pathway, such as JAK2 and p-JAK2 (Figure 4D). By contrast, the depletion of GSTP1 in the SW620 cells decreased the levels of p-STAT3, STAT3, cyclin D1, and CDC25A (Figure 4D). Notably, this regulation was not one-way; the ectopic expression of STAT3 could also upregulate the protein level of GSTP1 and induce higher levels of downstream STAT3 targets (cyclin D1 and CDC25A). Simultaneously, silencing STAT3 could decrease the expression levels of GSTP1, cyclin D1 and CDC25A, but not the expression of p-JAK2 (Figure 4E). Also, when AG490 (100 μM) was used to block the JAK2-STAT3 pathway, a significant decrease was observed in the expression of JAK2, p-JAK2, STAT3, p-STAT3, and GSTP1 24 h after treating the LoVo cells (Figure 4F).
The interaction between GSTP1
and STAT3 is regulated by FBX8
As a downstream target of FBX8, GSTP1 can interact with STAT3. Therefore, it was predicted that FBX8 could regulate the interaction between GSTP1 and STAT3. The co-IP analysis demonstrated that there was an interaction between GSTP1 and STAT3 in the SW620 cell line, with a high endogenous expression of FBX8 (Figure 5A). However, after adding AG490, a specific inhibitor of JAK2, the signal transduction of the JAK2 pathway was inhibited, resulting in a significant decrease in the expression of STAT3 in the SW620 cell line. In comparison with the group without AG490, the STAT3 that GSTP1 could bind to was also significantly reduced (Figure 5B). Simultaneously, in the SW480 cell line with the overexpression of FBX8, the expression of STAT3 detected with a co-IP assay was significantly reduced as compared to the control group (Figure 5C). These results indicated that FBX8 was a suppressive factor for the combination of GSTP1 and STAT3.
Figure 6 is the schematic diagram of the role of GSTP1, STAT3 and FBX8 in CRC.
Discussion
Previously, we identified GSTP1 as a downstream target of FBX8 using the co-IP and mass spectrometry analyses, and confirmed that GSTP1 could promote the proliferation, invasion and metastasis of CRC.29 Besides, it has been found that GSTP1 could regulate STAT3 to affect the development of HCC.8 Therefore, we hypothesized that GSTP1 might be involved in the progression of CRC by regulating STAT3.
The present study detected GSTP1 and STAT3 in human CRC tissue samples and found that the expression of GSTP1 was positively correlated with the expression of STAT3. This result revealed that GSTP1 might be able to regulate the expression of STAT3, and thus plays a role in the progression of CRC. Recent evidence suggests that GSTP1 is involved in tumor cell proliferation and invasion; the overexpression of GSTP1 increases cell proliferation in HNSCC.11 By comparison, GSTP1 can arrest tumor cells in the G0/G1 phase and upregulate the expression of p21 in bladder cancer.12 The present study investigated the effect of GSTP1 on the proliferation and invasion of CRC cells in vitro by recovery experiments. The results demonstrated that the overexpression of STAT3 could significantly promote the proliferation and invasion of CRC cells after GSTP1 downregulation. This indicated that GSTP1 enabled the proliferation and invasion of CRC cells depending on STAT3. Besides, the IHC results of subcutaneous tumors, in situ implanted tumors and liver metastases of CRC in mice also confirmed the conclusion mentioned above.
In terms of mechanism, this study demonstrated that GSTP1 and STAT3 could form a complex, and GSTP1 upregulation leads to the activation of the STAT3 pathway. Meanwhile, STAT3 can positively regulate the protein expression of GSTP1. The STAT3 is phosphorylated via JAK, then dimerized and subsequently translocated to the nucleus for the transactivation of several genes involved in numerous cellular processes.14, 15, 16, 17 Besides, the overexpression of STAT3 can affect the cell cycle21, 22 or inhibit the apoptosis by enhancing anti-apoptotic signaling23, 24 in CRC.
Therefore, identifying the association between GSTP1 and the STAT3 pathway is a meaningful way to illustrate the molecular mechanisms of GSTP1 in CRC. This study confirmed the interaction between GSTP1 and STAT3 and proved that GSTP1 positively regulates the STAT3 signaling pathway, leading to changes in target genes, such as p-STAT3 and STAT3, cyclin D1, and CDC25A. The STAT3 siRNA significantly abolished increases in STAT3, cyclin D1 and CDC25A and decreased the protein expression of GSTP1, but there was no change in p-JAK2. Exogenous STAT3 exhibited adverse results. Besides, western blotting revealed a concentration-dependent decrease in the level of JAK2, p-JAK2, STAT3, p-STAT3, and GSTP1 after 24 h of treating LoVo cells with the specific inhibitor of JAK2 (AG490). These results demonstrated that GSTP1 interacted with STAT3 without the involvement of JAK2. With regard to the previous research showing that FBX8 can degrade the expression of GSTP1,29 it was speculated that FBX8 could affect the association of GSTP1 and STAT3. Subsequent experiments confirmed that FBX8 was a restraining factor for the combination of GSTP1 and STAT3.
Limitations
In this study, the analysis of the relationship between GSTP1 and STAT3 was performed using limited cohorts. Therefore, the relationship needs to be further verified in clinical samples. Besides, we showed a region that is responsible for the interaction. However, we haven’t studied this region much for further phenotypic and genetic changes.
Conclusions
In summary, GSTP1, as a downstream effector of FBX8, was identified as an essential promoter and a useful prognostic marker for CRC. The GSTP1 could interact with STAT3 and upregulate the expression of STAT3 as well as of its related downstream molecules34 to promote the proliferation, invasion and metastasis of CRC. Therefore, the present study provided a potential new molecular target for the treatment of CRC metastasis.