Abstract
Background. Lithium is widely used in the treatment of bipolar disorders and may lead to nephrogenic diabetes insipidus (NDI), following long-term treatment. Metformin is considered the preferred initial therapy for patients with type 2 diabetes mellitus (T2D).
Objectives. To investigate the protective effect of metformin on the kidney damage caused by lithium administration.
Materials and methods. Using an animal model of chronic lithium-induced NDI, rats were divided into 4 groups: sham, metformin, lithium, and lithium + metformin. The effects of these treatments were examined using serum electrolytes, blood and tissue total antioxidant status, total oxidant status, the oxidative stress index, urine and blood osmolality, and tissue aquaporin-2 (AQP2) levels. Additionally, histopathological changes, including congestion, hydropic swelling, tubular necrosis, tubular atrophy, and Bowman’s capsule dilatation, were evaluated. The total histopathological score was obtained by summing the scores for each pathological finding.
Results. In the lithium group, biochemical variables indicating NDI, including sodium, chloride and blood osmolality, increased, and urine osmolality decreased, compared to the sham group. With metformin treatment, the blood osmolality decreased from 328.17 mOsm/kg to 306.33 mOsm/kg, and urine osmolality increased from 349.67 mOsm/kg to 754.50 mOsm/kg (p = 0.004 and p = 0.001, respectively). Tissue AQP2 levels decreased with lithium administration but stabilized with metformin treatment. Additionally, in comparison to the lithium group, the total histopathological score in the metformin group declined from 8.0 to 2.0 (p = 0.002).
Conclusions. Metformin may help protect the kidneys from lithium-induced NDI through the AQP2 regulating effect and a reduction in oxidative stress.
Key words: metformin, bipolar disorder, aquaporin-2, lithium, nephrogenic diabetes insipidus
Background
Lithium has been widely used for the treatment of bipolar disorders and depression.1, 2 However, lithium administration has well-documented side effects on several biological systems.2 One of the main targets of lithium are the kidneys, and a long-term lithium treatment may induce progressive nephrotoxicity. A significant part of the lithium-induced deterioration of renal function occurs in the form of nephrogenic diabetes insipidus (NDI), characterized by polyuria and polydipsia.1, 3 Nephrogenic diabetes insipidus develops as a result of impaired urine concentration due to the changes in the absorption of water and sodium at the level of collecting tubules. Previous studies have shown that the urinary concentration defect, associated with lithium toxicity, is mainly connected to a decrease in the amount of aquaporin-2 (AQP2) protein in the collecting duct principal cells.4 Another mechanism responsible for lithium-induced nephrotoxicity is a change in the epithelial sodium channels (ENaCs), collecting channels, which are essential sites for sodium reabsorption.1 It has been shown that when inhibition of the functioning of ENaCs in the collecting ducts is prevented, the expected polyuria due to lithium is also inhibited, and introduction of lithium into the cell through ENaCs is a central step in the development of NDI.5 Furthermore, oxidative stress has been proposed as an alternative mechanism for lithium toxicity in renal tissue through impairment of the mitochondrial respiratory system, that leads to an increased generation of free radicals through lipid peroxidation of the cell membrane.2
Metformin, an activator of 5′-AMP-activated protein kinase (AMPK), is one of the most popular oral glucose-lowering medications, and is preferred by most guideline committees as an optimal initial medical therapy for patients with type 2 diabetes mellitus (T2D).6 The useful mechanisms of metformin on cell metabolism that are known to have a protective effect on the kidney include the activation of an upstream kinase (i.e., liver kinase B1), increased cellular AMP levels and consequent AMPK activation.7 Recent studies have shown that metformin increases osmotic water permeability by increasing AQP2 accumulation in the renal apical plasma membrane.8 Similarly, metformin was found to prevent high-sodium-induced upregulation of ENaC expression.9 Metformin has also been shown to reduce cell damage during oxidative stress.10
Objectives
Metformin, having a positive effect on almost all stages of lithium-induced renal injury, is a critical drug to investigate the prevention of lithium-induced renal injury. In this study, we assess the protective effect of metformin against the renal adverse effects of lithium use.
Materials and methods
Trial design
A randomized controlled animal study was carried out. Ethical approval was obtained from the Çanakkale Onsekiz Mart University (Turkey) Ethical Board of Animal Studies (approval No. 2018/1800054097). The study was conducted following the CONSORT guidelines,11, 12 and the methods used for the animal experiments are in accordance with the National Institutes of Health Guide for the Care and Use of Laboratory Animals (National Institutes of Health (NIH), Bethesda, USA).
Study setting
Twenty-four adult male Wistar albino rats weighing 250–300 g were purchased from the Laboratory Animal Production Unit of Çanakkale Onsekiz Mart University (Turkey) and maintained for an adaptation period of 1 week under standard conditions with a temperature of 22 ±2°C, a relative humidity of 70 ±4% and a 12 h light/dark cycle. All animals were provided with standard commercial pellet diets and tap water ad libitum.
Randomization
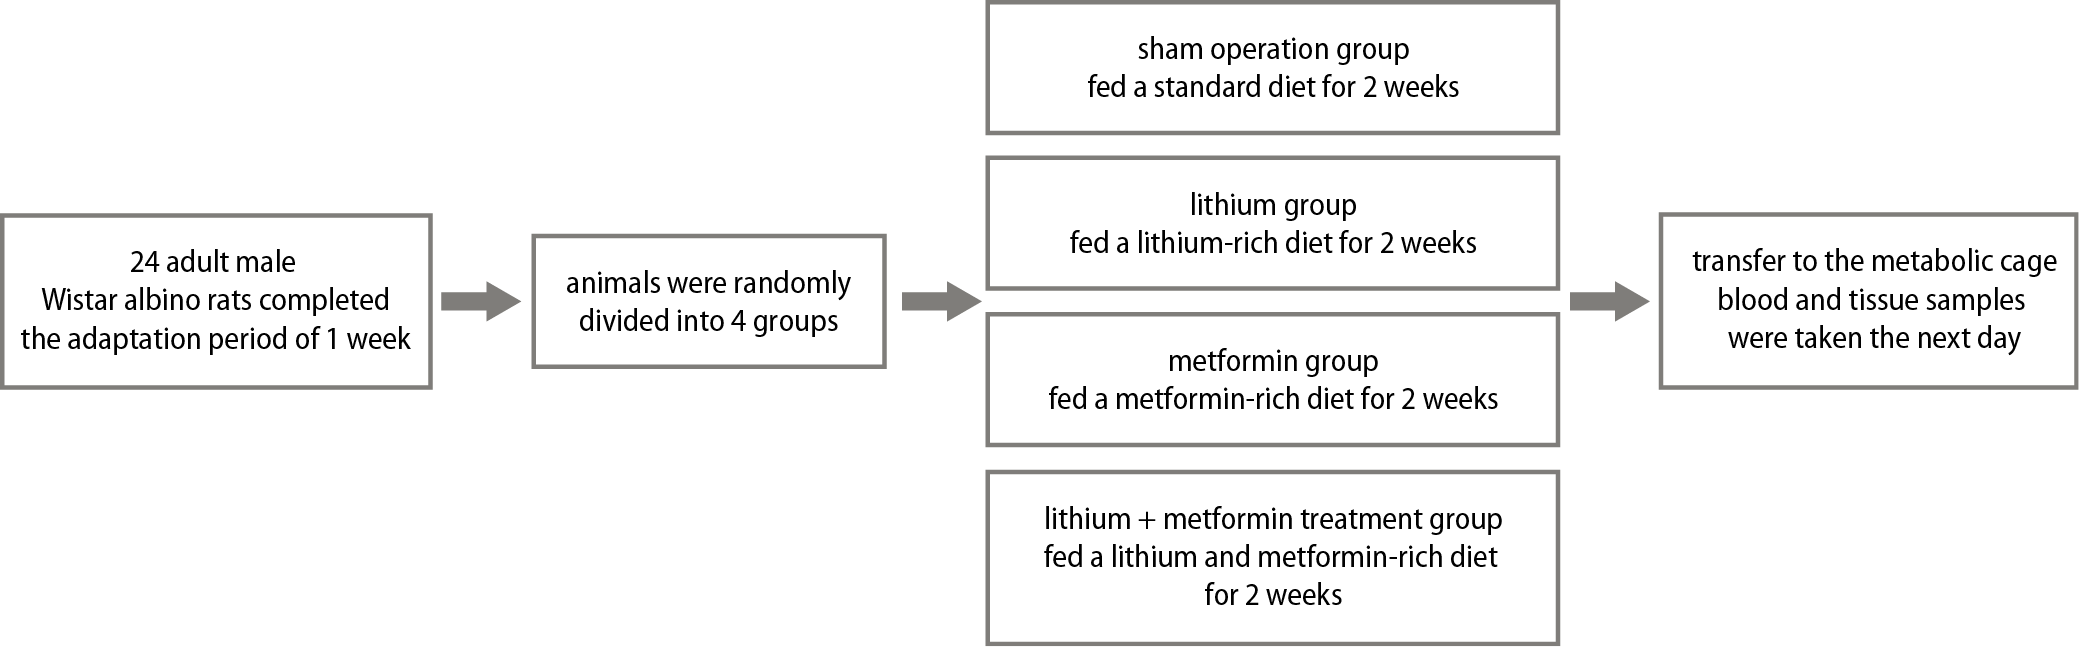
After the adaptation period, the animals were divided using a random numbers list into 4 groups of 6 rats each as follows:
Group 1 (sham operation group, n = 6) – fed a standard diet for 2 weeks and placed in a metabolic cage for 24 h on the 14th day. Blood and right kidney tissue samples were taken on the 15th day.
Group 2 (lithium group, n = 6) – fed a lithium-rich diet (LiCl; Li; 40 mmol/kg of dry food) for 2 weeks and placed in a metabolic cage for 24 h on the 14th day. Blood and right kidney tissue samples were taken on the 15th day.
Group 3 (metformin group, n = 6) – administered metformin (metformin hydrochloride, 800 mg/kg, by gavage) for 2 weeks and placed in a metabolic cage on the 14th day for 24 h. Blood and right kidney tissue samples were taken on the 15th day.
Group 4 (lithium + metformin group, n = 6) – fed with a lithium rich diet and administered metformin (LiCl; Li; 40 mmol/kg of dry food + metformin hydrochloride, 800 mg/kg, by gavage) for 2 weeks and placed in a metabolic cage on the 14th day for 24 h. Blood and right kidney tissue samples were taken on the 15th day (Figure 1).
Biochemical analysis
At the end of the experiment, all animals were deeply anesthetized with ketamine (50–60 mg/kg). Blood samples were collected from all subjects into tubes and centrifuged at 4000 rpm for 10 min. The resultant serum samples were aliquoted into polypropylene tubes and stored at −80°C until biochemical analysis. Urine samples were stored at 4°C until analysis. The right kidney was removed and sagittally divided in half, with half used for tissue biochemistry and the other half for the histopathological analysis. Finally, the rats were sacrificed by decapitation.
Blood and tissue biochemical markers were measured by spectrophotometric methods. Tissues from all experimental groups were prepared at 4°C to determine their total antioxidant status (TAS) and total oxidant status (TOS) levels. After washing with a phosphate-buffered solution (PBS), the tissue samples were weighed and cut into small pieces. The tissues were then homogenized using a Mixer Mill MM 400 (Retsch, Haan, Germany). Assays were performed on the supernatant of the homogenate, which was prepared by centrifugation at 4°C. The protein contents of the tissues were calculated according to the method developed by Lowry et al.13
Serum and tissue TAS (product code: RL0017) and TOS (product code: RL0024) were determined with spectrophotometric kits (Rel Assay Diagnostics, Gaziantep, Turkey). The ratio percentage of TOS (μmol H2O2 equivalent/L) to TAS (μmol Trolox equivalent/L) potential was used to calculate the oxidative stress index (OSI) — the indicator of the degree of oxidative stress.
Albumin, creatinine (Crea), chlorine (Cl), potassium (K), sodium (Na), lithium (Li), total protein, and urea were analyzed using Roche Diagnostic kits and Cobas c501 auto analyzer (Roche Diagnostics, Indianapolis, USA). Urine and blood osmolalities (mOsm/kg) were determined with the freezing point depression method, using an automatic cryoscopic osmometer (Osmomat 030-D; Gonotec, Berlin, Germany). The main outcome variable of the study was urine osmolality.
Histopathological analysis
Kidney tissue samples were fixed in a 10% neutral buffered formaldehyde solution for light microscopic examination. After the fixation, the samples were placed into cassettes and washed under running water for 2 h. To remove water, the tissues were passed through a series of increasing alcohol concentrations (60%, 70%, 80%, 90%, 96%, and 100%). The tissues were then passed through xylol for polishing and then were embedded in molten paraffin. Hematoxylin and eosin (H&E) staining and immunohistochemical AQP2 evaluation were performed on the 4-μm thick sections obtained from the paraffin blocks. The sections were evaluated on a Leica DCM 3000 (Leica Microsystems, Wetzlar, Germany), computer-assisted imaging system, using the Leica Q Vin 3 program, and pictures of the histological sections were taken. A score table was formed after the evaluations with H&E staining.
For the H&E staining method, sections taken from the experimental groups were kept in a 60°C oven for 60 min, then moved into xylol for 3 × 10 min and cleansed from paraffin. The slides were then passed through a series of increasing alcohol concentrations (70%, 90%, 96%, and 100%), washed in running water for 1 min, then stained in Harris hematoxylin for 2 min, and finally washed in running water for 2 × 2 min. The specimens were then soaked in a 1% ammonia-water mixture and washed again in running water for 1 min. The slides were kept in eosin for 2 min and passed through a series of increasing alcohol concentrations (70%, 80%, 96%, and 100%), xylolized for 2 × 1 min, and covered with entellan. To make a numerical evaluation of the total area size in the tissue, data were generated for each group and each animal in the whole area, using a ×4 magnification lens. Evaluation of the histopathological changes included congestion, hydropic swelling, tubular necrosis, tubular atrophy, and Bowman’s capsule dilatation. Tissue damage scores were assigned as follows: no visible change = 0, minimal or slight change = 1, moderate change = 2, and severe change = 3. After calculating the score of all rats for each of the histopathological changes, the total score was obtained by summing all of the scores together.
For immunohistochemical AQP2 staining, 4-μm thick sections were taken from the kidney tissue blocks of all experimental groups and transferred to slides. Sections were kept in a 60°C oven for 1 h and then moved to xylol for 3 × 10 min to achieve deparaffinization. The slides were then rehydrated through a series of increasing alcohol concentrations (70%, 80%, 96%, and 100%). Sections were passed through distilled water twice for 1 min to remove the alcohol. To remove the antigen mask, 1/10 dilution citrate buffer (ap-9003-999; Thermo Fisher Scientific, Waltham, USA) was applied in a microwave. The endogenous peroxidase activity was blocked in the tissues with 3% hydrogen peroxide (TA-125-HP; Thermo Fisher Scientific) for 10 min after washing with distilled water. Sections were then washed with PBS and protein-blocked (TA-125 PBQ; Thermo Fisher Scientific) for 10 min.
The AQP2 antibody (ab15116; Abcam, Cambridge, UK) was incubated with the tissue for 60 min in a humid environment. The HRP Polymer Amplifier Quanto (TL-125-QPB; Thermo Fisher Scientific) was rested for 20 min. Washing with PBS was carefully completed at every stage. The 3, 3’-diaminobenzidine (DAB) staining was performed to identify AQP2-positive cells, and hematoxylin was then applied for 1 min for background staining. The stained sections were passed through a series of increasing alcohol concentrations, water was removed, and then they were kept in xylol for 5 min to achieve transparency. Then, the sections were covered with entellan. Animals in all groups were evaluated and scored for AQP2 levels as follows: none = 0, 1%–25% = 1, 26%–50% = 2, and 51%–100% = 3.
Sample size
Sample size calculation was based on the resource equation method. In comparison of 4 groups (k) for mean urine osmolality with the one-way analysis of variance (ANOVA) using 6 animals (n) in each group, the equation (degree of freedom (df) = (n × k) – k) revealed a df of 20, which is in the acceptable range of 10–20.14, 15
Statistical analyses
Statistical analyses were conducted using IBM SPSS software, v. 24.0 (IBM Corp., Armonk, USA). The variables were investigated using analytical methods (Kolmogorov–Smirnov/Shapiro–Wilk test) to determine whether or not they were normally distributed (Table 1). The sample mean ± standard deviations were used to determine the average of the collected data if the quantitative variables were normally distributed; otherwise, the sample median (min–max) was used. One-way ANOVA tests were used to compare the biochemical and tissue parameters among the 4 groups. The Levene test was used to assess the homogeneity of the variances (Table 1). When an overall significance was observed, pairwise post hoc tests were performed using Tukey’s test. The ANOVA results are presented as F test (degrees of freedom) (F(df)). Values of p < 0.05 were considered statistically significant. The histopathological findings and AQP2 levels were evaluated with the Kruskal–Wallis test, as they were ordinal variables. The Mann–Whitney U test was performed to test the significance of pairwise differences, using the Bonferroni correction to adjust for multiple comparisons.
Results
Biochemical findings
The blood biochemical results for all groups are shown in Table 2. There were no significant differences between the sham and metformin groups for the plasma biochemistry values. When compared with the sham group, the Na, Cl, Li, TOS and OSI values were significantly higher in the lithium group (p = 0.018, p = 0.004, p = 0.002, p = 0.002, and p = 0.001, respectively). In the lithium + metformin group, the plasma Na, Cl, TOS and OSI values were lower compared to the lithium group (p = 0.035, p = 0.001, p = 0.003, and p = 0.001, respectively).
Tissue and osmolality analysis results for the groups are provided in Table 3. Compared to the sham group, the lithium group had significantly higher TOS, OSI, blood osmolality, and urine osmolality values (p = 0.010, p = 0.004, p = 0.004, and p = 0.002, respectively). In the lithium + metformin group, a reduction in TOS, OSI and blood osmolality, and an increase in urine osmolality values were observed compared to the lithium group (p = 0.004, p = 0.002, p = 0.004, and p = 0.001, respectively).
Histopathological findings
Histopathological analysis results and AQP2 levels for the groups are given in Table 4. No bleeding or interstitial fibrosis were observed in any of the sections. There were no significant differences in the variables between the sham and lithium + metformin groups. Congestion, hydropic swelling, and Bowman’s capsule dilatation scores in the lithium group were higher than in the sham group (p = 0.004, p = 0.008, and p = 0.002, respectively). In the lithium + metformin group, the median congestion and Bowman’s capsule dilatation pathological evaluation scores were lower compared to the lithium group (p = 0.009 and p = 0.004, respectively). The total score was higher in the lithium group when compared with the sham group (p = 0.002). However, compared with the lithium group, the overall score was significantly lower in the lithium + metformin group (p = 0.002; Figure 2). The AQP2 levels were significantly lower in the lithium group compared to the sham group (p = 0.009), and significantly higher in the lithium + metformin group compared to the lithium group (p = 0.011; Figure 3).
Discussion
Bipolar disorder is one of the leading causes of mental disability in the world. Lithium is widely used in the treatment of bipolar disorders and depression.2 A long-term use of lithium is known to produce permanent nephrotoxicity.1, 2, 3 Lithium causes damage to the kidneys by 3 mechanisms. The 1st one is a decrease in the amount of AQP2 in the kidney,4 the 2nd one is changes in the ENaCs of the collecting tubules1 and the 3rd one is oxidative stress due to mitochondrial damage in the kidney cells.2 Ultimately, acquired NDI, characterized by polyuria and polydipsia, may develop.1, 2, 3, 4
The most common kidney injury due to chronic lithium use is acquired NDI. Likewise, the most common cause of acquired NDI is lithium-induced NDI, which occurs in up to 50% of patients who receive the long-term lithium therapy.1, 4 Clinically, acquired NDI manifests as arginine vasopressin (AVP) resistant polyuria and polydipsia, and is often associated with natriuresis.4 In animal models of acquired NDI, it has been shown that the AVP-regulated water channel AQP2 is consistently and markedly decreased in the principal cells of renal medulla collecting duct.4, 16
Klein et al. have shown that metformin, an AMPK activator, increases phosphorylation of AQP2 in the rat inner medullary collecting ducts, and increases the apical plasma membrane accumulation of AQP2.8 It was also reported that metformin increases osmotic water permeability by increasing AQP2 accumulation in the apical plasma membrane, and that metformin increases urine osmolality. In the current study, the AQP2 level was low in the lithium group (p = 0.009) when compared to the sham group, whereas it increased in the group receiving lithium + metformin when compared to the lithium group (p = 0.011).
The ENaC is a likely candidate for lithium entry. Studies by Christensen et al. on transgenic mice lacking ENaC showed that ENaC-mediated lithium entry into the collecting duct principal cells contributes to the pathogenesis of lithium-induced nephrotoxicity, and the absence of functional ENaCs in the transgenic mice protects them from acquired NDI.5
Zheng et al. also showed that metformin inhibits the high-sodium-induced upregulation of ENaC expression.9 It was concluded that metformin with an AMPK activator might directly act in the endothelium by inhibiting ENaC expression and activity, thereby contributing to endothelial protection in response to the high-salt challenge.
The current study shows that the ENaC upregulation in the kidney caused by lithium salts is determined by metformin. Hypernatremia and hyperchloremia (seen in acquired NDI) were observed in the group receiving lithium, and sodium and chloride values in the group receiving lithium + metformin decreased to the levels close to those in the sham group. Similarly, when compared to the lithium group, urine osmolality in the lithium + metformin group reached levels close to those in the sham group.
Studies on oxidative stress in the kidneys caused by chronic lithium use are controversial. Vosahlikova et al. found that chronic lithium exposure has different oxidative responses in lipid peroxidation products and malondialdehyde levels depending on the cell culture type.17 In their study, the concentration of lipid peroxidation products in Jurkat cells decreased. On the other hand, in HEK293 cells, long-term Li exposure for 7 or 28 days resulted in a significant increase in the concentration of lipid peroxidation products. In their study on rats, Nciri et al. found that lithium increases the concentration of lipid peroxidation products by triggering oxidative stress in the kidneys, thus intensifying superoxide dismutase and catalase activity while reducing glutathione peroxidase activity from antioxidant enzymes.18 Again, results in rat studies on TAS and antioxidant enzymes superoxide dismutase, glutathione peroxidase and catalase in cell culture differ.19, 20 However, a literature review did not reveal any research related to TOS and OSI in the kidneys in lithium damage, which shows the actual oxidative stress state.13, 14, 15, 16 In the current study, we observed that TOS values in both plasma and tissue increased with chronic lithium exposure. Although it was not statistically significant, there was a decrease in TAS values, and the OSI value increased significantly.
In recent publications, metformin was reported to reduce the generation of reactive oxygen species (ROS) and prevent mitochondria-mediated apoptosis. It was also suggested that this agent can protect against oxidative stress-induced cell death.21, 22 In the present study, we observed that TOS and OSI values decreased significantly along with metformin treatment, whereas TAS increased, although not significantly.
Histopathological results showed convincing evidence regarding the protective nature of metformin against lithium-induced nephrotoxicity. The total histopathological score was high in the lithium group but significantly lower in the metformin group.
Limitations
Certain limitations of this study should be mentioned. First, varying doses of metformin were not administered. In addition, the study was not fully blind. However, to prevent bias, one of the study authors, those who conducted the blood and tissue analysis, and the biostatisticians did not know the group assignments. The small size of our animal sample constitutes another limitation.
Conclusions
Nephrogenic diabetes insipidus is one of the most critical conditions preventing lithium use, which is widely administered for many psychological disorders. The current study is the 1st to investigate the effects of metformin on lithium-induced NDI. Metformin, which had positive effects on almost all lithium-induced nephrotoxicity parameters, may be a novel therapeutic option for acquired NDI. We conclude that AMPK activation by metformin ameliorates NDI by increasing AQP2 and urine concentrating ability in lithium-induced nephrotoxicity. These findings suggest that metformin may be a novel therapeutic option for lithium-induced NDI. Since metformin is commercially available for human use, further clinical studies can be conducted with ease.