Abstract
Background. Medical preparedness for major international multi-sport tournaments requires effective planning of venue medical services for athlete and non-athlete populations. Understanding differences in medical intervention patterns is essential for resource allocation.
Objectives. To compare on-site medical interventions, hospital transports, and related medical conditions managed by venue medical teams (VMTs) between athlete and non-athlete populations during 2 international multi-sport tournaments, and to identify sport disciplines associated with higher hospital transport rates among athletes.
Materials and methods. Prospective data from the World Games 2017 and the European Games 2023, both held in Poland, were analyzed. The study included 9,672 athletes and 355,215 non-athletes. Interventions were classified as on-site medical interventions and hospital transports. Medical conditions were classified as injuries or illnesses and as mild or severe. Incidence rates per 1,000 participant-days and event rates per 100 participants were calculated.
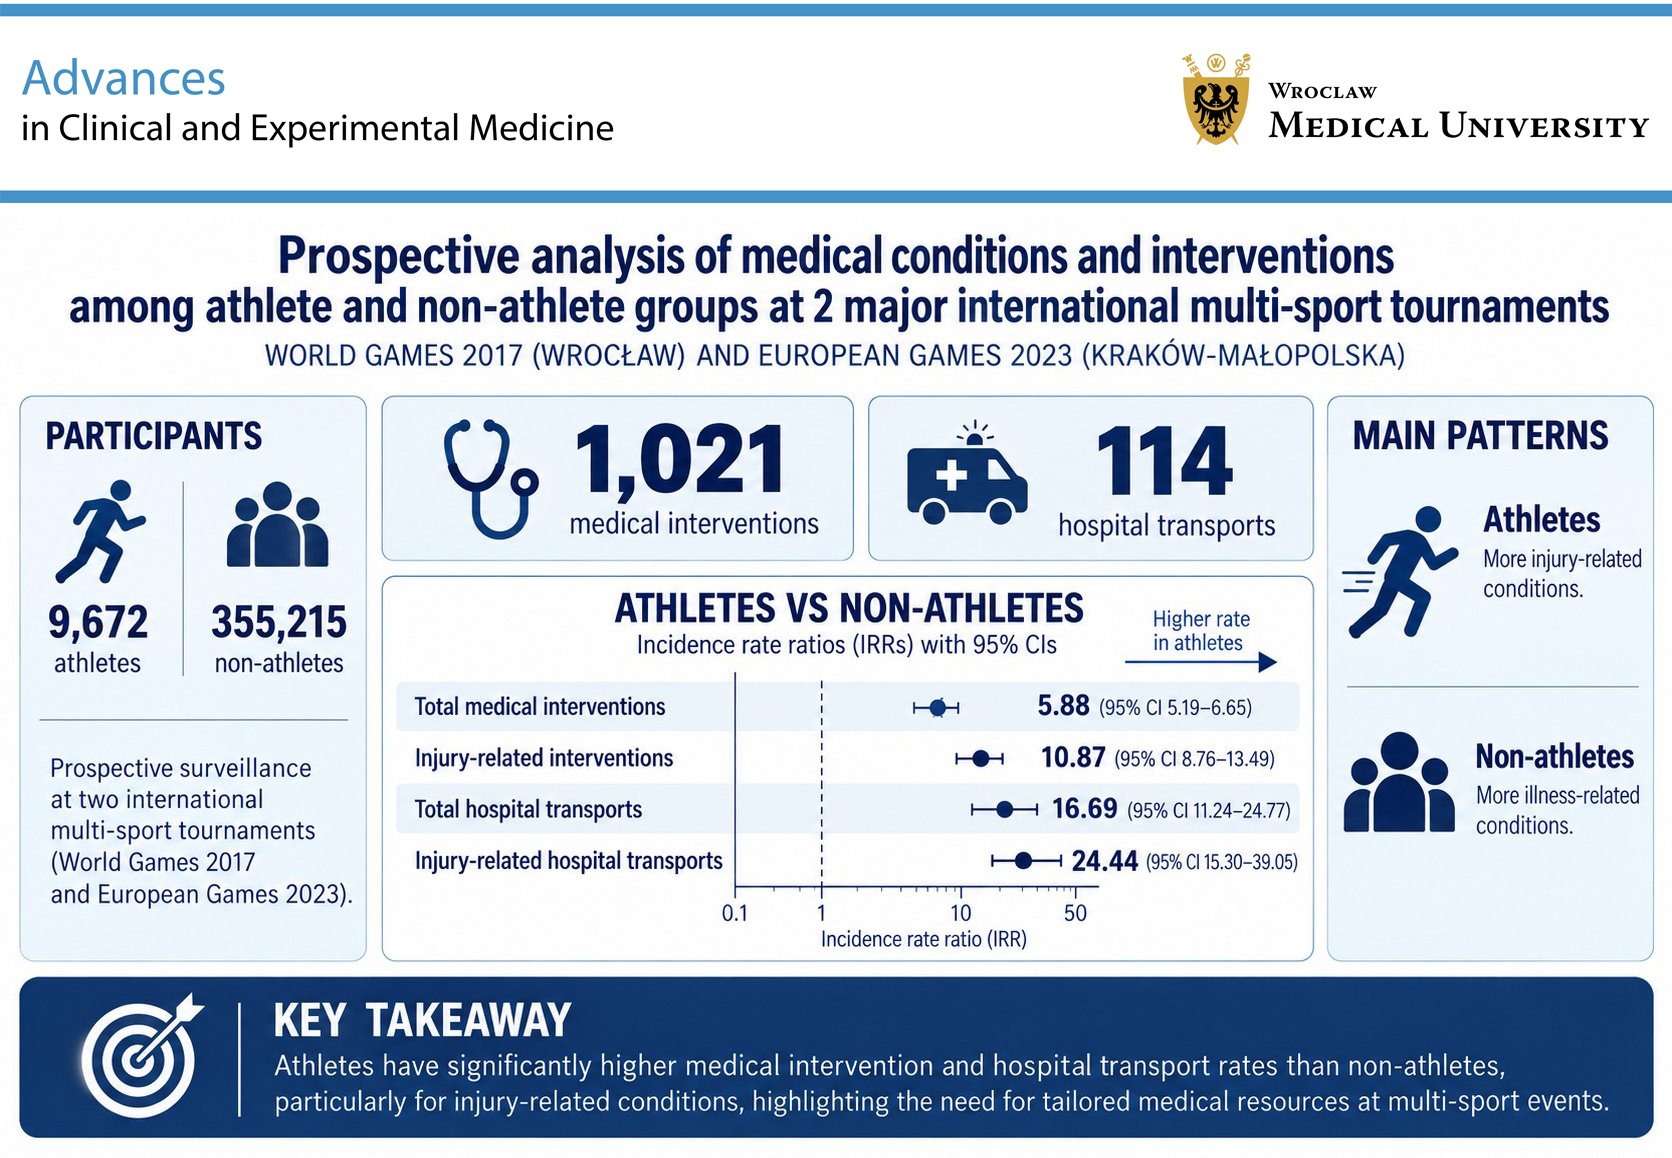
Results. A total of 1,021 medical interventions and 114 hospital transports were recorded. Compared with non-athletes, athletes demonstrated substantially higher incidence rates across all analyzed outcomes. The pooled incidence rate ratio (IRR) was 5.88 (95% confidence interval (95% CI): 5.19–6.65) for total medical interventions and 16.69 (95% CI: 11.24–24.77) for hospital transports, with the largest between-group differences observed for injury-related medical interventions (IRR = 10.87, 95% CI: 8.76–13.49) and injury-related hospital transports (IRR = 24.44, 95% CI: 15.30–39.05). Mild conditions predominated in both groups, whereas injury-related conditions accounted for a greater proportion of medical interventions among athletes and illness-related conditions among non-athletes. Hospital transports were uncommon in both groups but occurred substantially more frequently among athletes and were predominantly injury-related. Muaythai, American football, BMX freestyle cycling, sumo, and beach handball had the highest hospital transport rates.
Conclusions. Athletes and non-athletes demonstrated distinct patterns of medical interventions and related medical conditions during major international multi-sport tournaments. Combined surveillance of both populations provides a comprehensive assessment of VMT workload and supports evidence-based medical planning for future tournaments.
Key words: mass gathering medicine, hospital transport, major sporting tournament, on-site medical intervention
Background
Medical preparedness for major sport tournaments (MSTs) is designed to ensure the health and safety of all participants.1, 2, 3, 4 Effective medical planning requires an integrated model, considering all groups involved – participating athletes and non-athletes, including spectators, technical staff, and volunteers.5, 6, 7, 8, 9, 10 Unique challenges at multi-sport MSTs include dispersed venues, tight competition schedules, diverse sport disciplines, high participant mobility, and constrained medical resources.6, 7, 9, 10 Comprehensive risk analyses therefore incorporate tournament- and venue-specific characteristics, emergency medical system (EMS) and healthcare system capacities, public health, and crisis management.7, 8, 9, 10 Medical data from previous tournaments support precise venue planning.1, 8, 9, 10, 11 Athlete-specific surveillance data on injuries and illnesses have been analyzed across the most prominent tournaments worldwide.12, 13, 14, 15, 16, 17, 18, 19, 20, 21, 22, 23 The recently published meta-analysis of 27 articles showed that the overall incidences of injuries and illnesses during the Olympic Games (OG) were 6.50 (95% confidence interval (95% CI): 5.91–7.15) and 3.62 (95% CI: 2.83–4.65), respectively.12 The highest incidences of injuries were observed in taekwondo, football, boxing, handball, and weightlifting. Lower limb injuries had the highest incidence among injury-related medical conditions.12 For non-athlete groups, evidence from prior MSTs demonstrates low rates of on-site medical interventions, mostly related to weather conditions, with only modest increases in emergency department workload.18, 19, 20, 21, 22, 23, 24 The majority of medical conditions have been mild and managed on-site, with only a small proportion requiring hospital transport.17, 18, 19, 20, 21, 22, 23, 24
Despite the growing number of international multi-sport MSTs, comparative analyses evaluating medical service utilization across different types of multi-sport events remain scarce. Poland hosted 2 MSTs within a 6-year period: the World Games (WG) 2017 and the European Games (EG) 2023. Both tournaments were held in similar geographical, environmental, and healthcare policy conditions, with comparable medical reporting systems. This unique setting provides an opportunity to compare patterns of medical service utilization among athletes and non-athletes across different multi-sport MSTs.
Objectives
The primary objective was to analyze whether distinct patterns existed in medical interventions and hospital transport requirements managed by the venue medical teams (VMTs) among athlete and non-athlete populations during 2 international multi-sport MSTs. The study sought to compare their incidence rates (IRs) and patterns between athlete and non-athlete populations and between tournaments. The secondary objective – within the athlete cohort – was to identify sport disciplines associated with a higher frequency of hospital transports and to determine related medical conditions.
Materials and methods
World Games 2017 was a global tournament featuring non-Olympic disciplines. A total of 3,292 athletes competed in 26 indoor and outdoor venues over 11 days. Table 1 lists the disciplines and participants. The tournament was supported by 7,306 staff and volunteers and attracted an estimated 163,324 spectators, based on ticket distribution records. The local organizing committee distributed tickets, ensuring a primarily local audience. The host country provided medical services for all participants. The medical team included 480 medical staff, up to 40 ambulances per day, and 4 referral hospitals. No team physicians were officially registered.
European Games 2023 was a European tournament comprising 10 non-Olympic and 19 Olympic disciplines. A total of 6,380 athletes competed in 26 indoor and outdoor venues over 12 days. Table 2 lists the disciplines and participants. The event was supported by approx. 5,000 staff and 8,000 volunteers and attracted an estimated 171,585 spectators, primarily from the local area. Because of dispersed tournament locations, local medical staff included several hundred professionals from 5 medical service providers, with 7 local medical coordinators, 11 referral hospitals, and 5 ambulatory care units. Lifeguard and mountain rescue teams were additionally deployed for water and mountain sports. National team physicians provided medical support for athletes, and local medical services provided support and transport to hospitals.
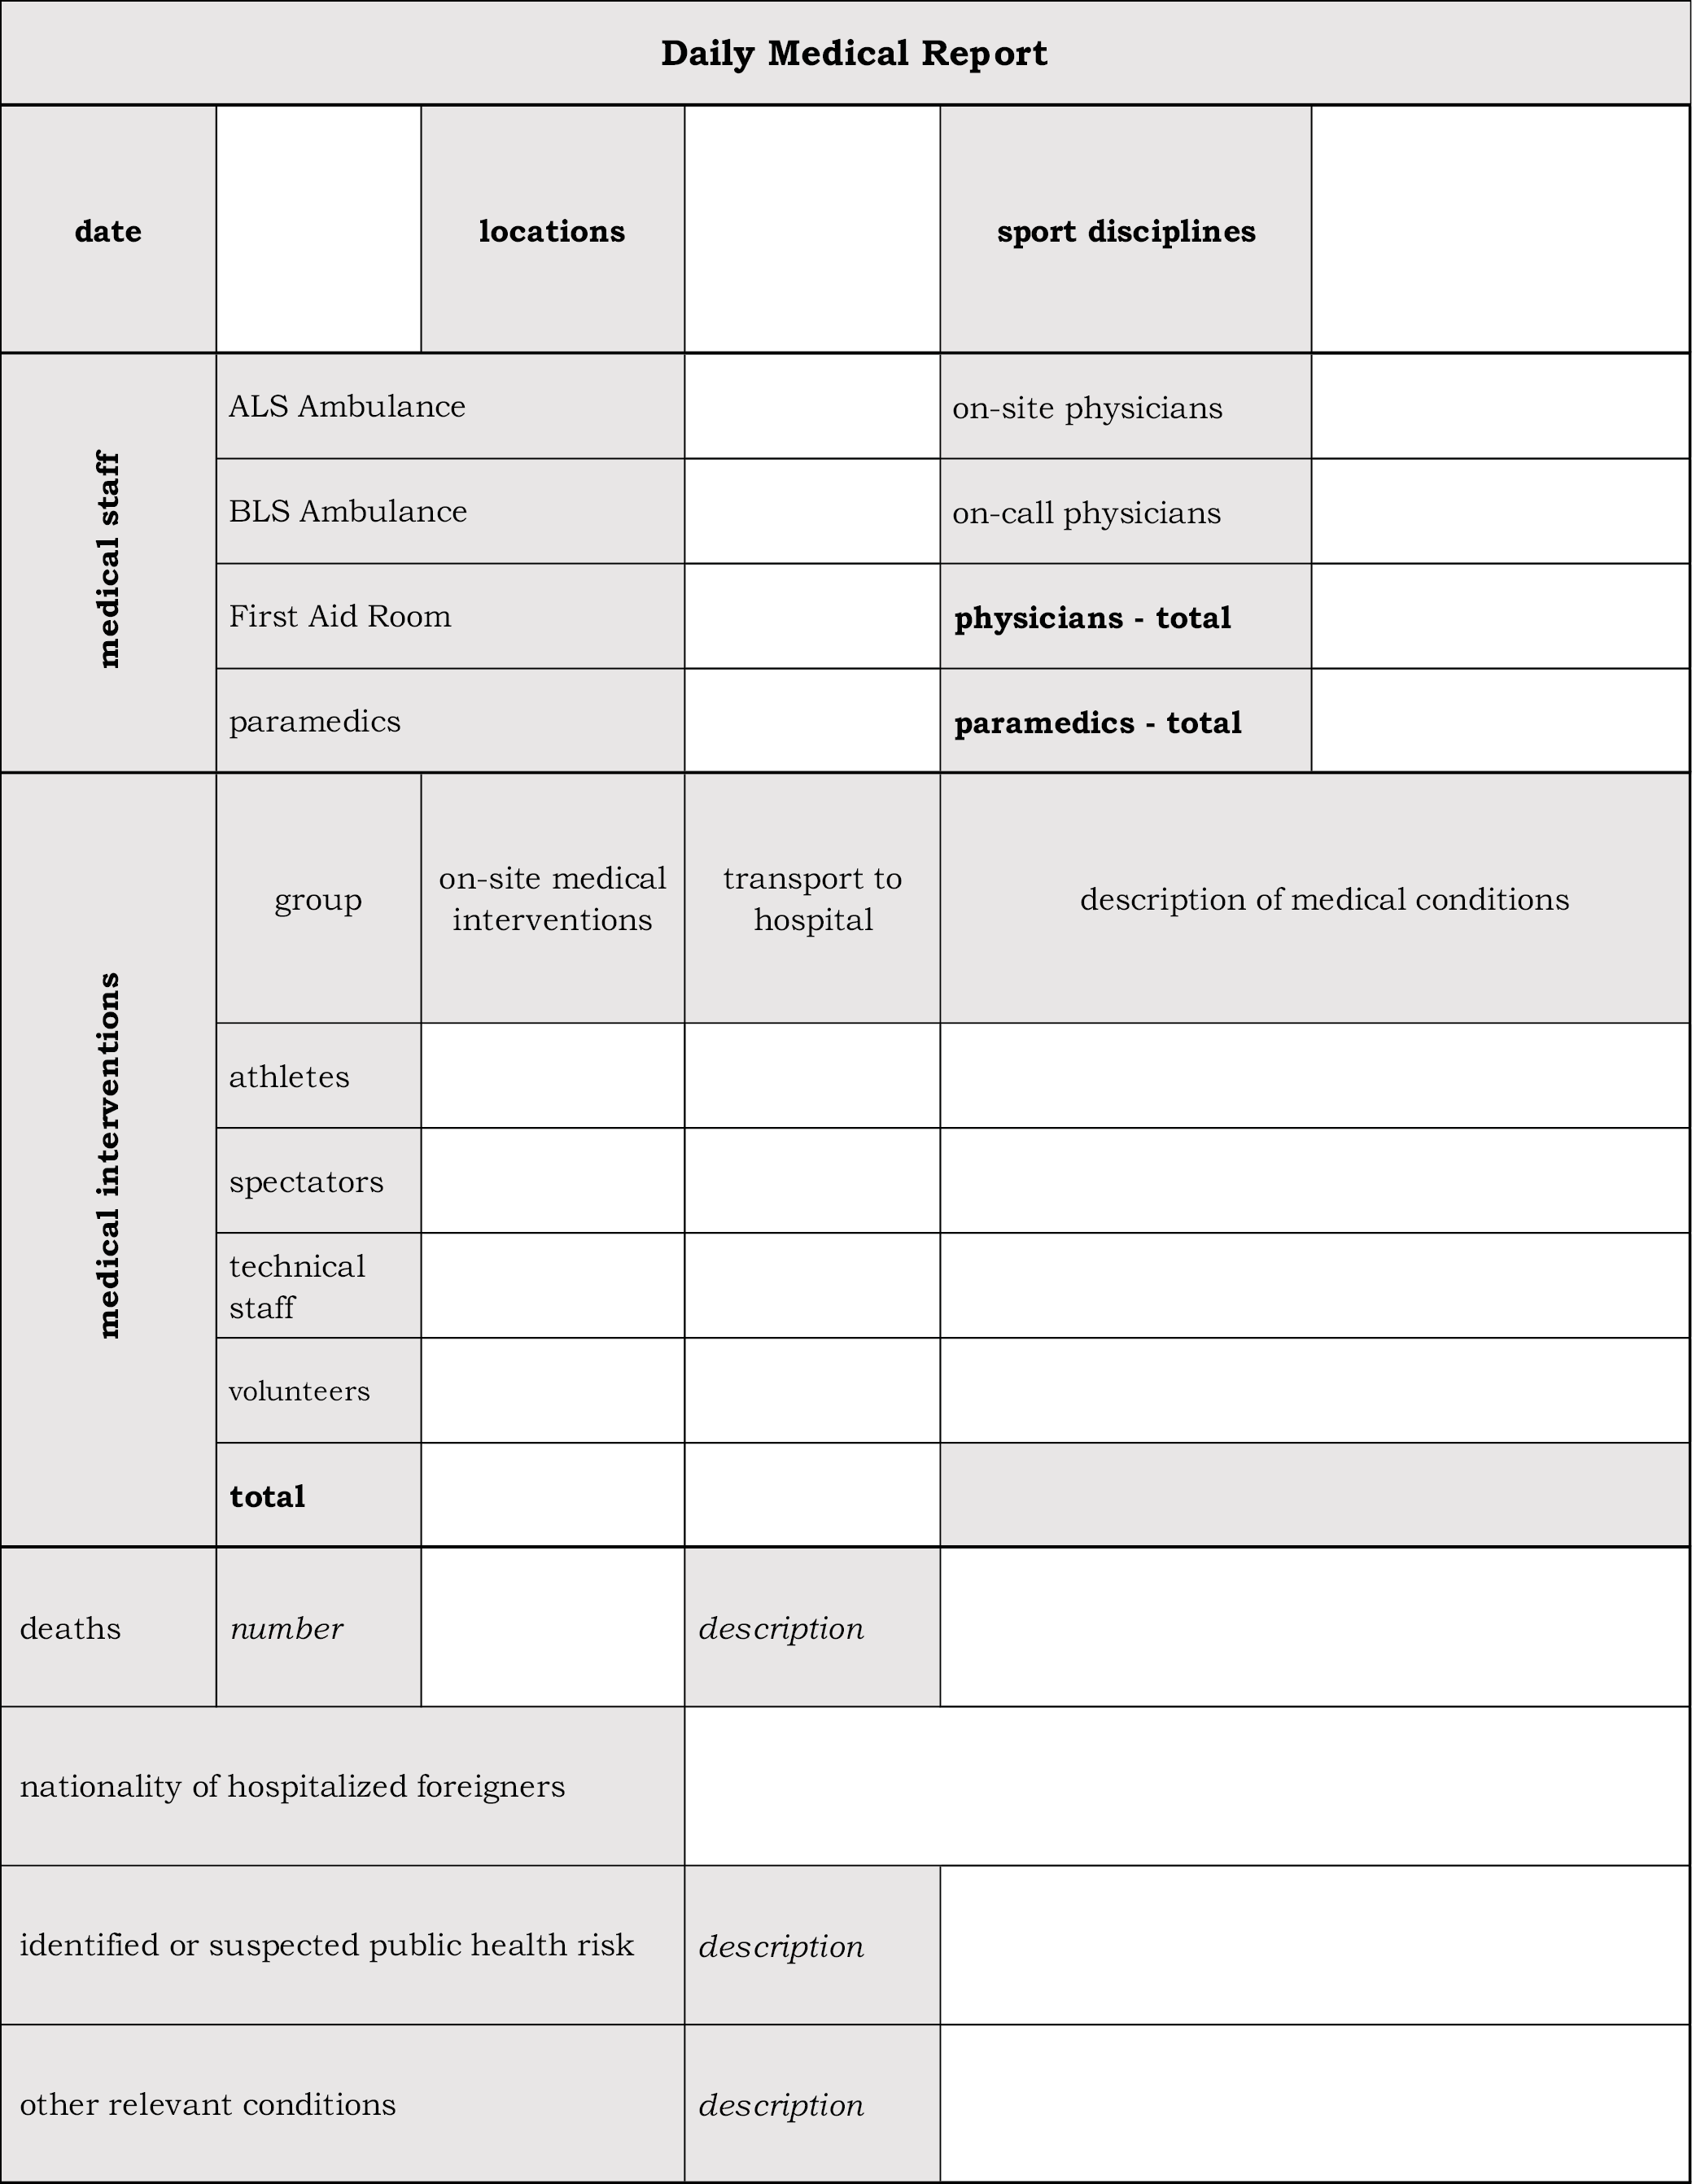
A standardized medical reporting system, tailored to the tournament settings, was implemented for both tournaments. Medical coordinators recorded anonymized medical data from VMTs daily and aggregated it into reports. Figure 1 shows an example of the daily report form. Data from team physicians were included only when local medical support was requested, including all hospital transports. Surveillance was based on the standardized metrics, including on-site medical interventions and hospital transports.25, 26, 27
Medical conditions were grouped into injuries and illnesses, mild and severe. The definitions of the International Olympic Committee (IOC) were adopted: an injury is tissue damage or other disarrangement of normal physical function due to participation in sports (for athletes) or tournament activities (for non-athletes), resulting from rapid or repetitive transfer of kinetic energy; an illness is a complaint or disorder not related to injury. Severe conditions were those resulting in prolonged absence from participation or requiring hospital transport, whereas mild conditions did not significantly restrict health.27 A statement was obtained from the Bioethics Committee at the Institute of Mother and Child in Warsaw (Poland), confirming that this analysis did not require individual consent.
The analyzed outcomes included on-site medical interventions and hospital transports related to injuries and illnesses recorded during the analyzed MSTs in both athlete and non-athlete groups. The primary outcomes were total medical interventions and total hospital transports provided by the VMTs. Secondary outcomes included injuries and illnesses, and mild and severe medical conditions. Secondary analyses were considered exploratory and interpreted primarily on the basis of incidence rate ratios (IRRs) and corresponding 95% CIs.
Outcome measures included incidence rates per 1,000 participant-days and event rates per 100 participants, each with 95% CIs. Participant-days were calculated as the total days of exposure contributed by all participants. For athletes, participant-days were estimated by multiplying the number of athletes in each discipline by the number of official competition days. For staff members and volunteers, participant-days corresponded to their working days, whereas spectator exposure was estimated from distributed single-day tickets, with each ticket representing 1 spectator-day. Event rates were compared using Poisson regression models with the logarithm of participant-days included as an offset. Incidence rate ratios with 95% CIs were estimated from model coefficients. Athletes and non-athletes were compared using pooled data from both tournaments, while tournaments were compared separately for athletes and non-athletes.
Because only 2 tournaments were available, clustering at the tournament level could not be evaluated reliably; therefore, tournaments were compared directly using Poisson IRRs. Sparse event counts, particularly illness-related hospital transports, were interpreted cautiously, and exact Poisson methods were considered where appropriate. Statistical inference was based primarily on effect estimates and 95% CIs. Associations were considered statistically significant when the 95% CI did not include 1.0. All analyses were performed in Microsoft Excel 2021 Professional Plus (Microsoft Corp., Redmond, USA), with additional validation in R v. 4.5.0 (R Foundation for Statistical Computing, Vienna, Austria).
The analysis was based on complete surveillance data and did not involve sampling of participants or medical events. Nevertheless, medical events were considered realizations of underlying stochastic processes. Incidence measures, 95% CIs, and IRRs were therefore calculated to quantify variability and enable standardized comparisons between tournaments and participant groups. These measures are not intended to support inference to the general population of athletes or non-athletes but to characterize uncertainty in event occurrence and observed differences.
Results
The cohort comprised nearly 365,000 participants – 9,672 athletes and 355,215 non-athletes. A total of 1,021 medical interventions and 114 hospital transports were reported. Table 3 presents the distribution of medical condition categories among medical interventions and hospital transports by group and tournament. There were 116 venue reports and 15 daily reports at WG 2017, and 134 venue reports and 16 daily reports at EG 2023, including pre-tournament days. The tournaments were not associated with any mass-casualty incidents, major public health threats, or fatalities.
Medical interventions and conditions in athletes
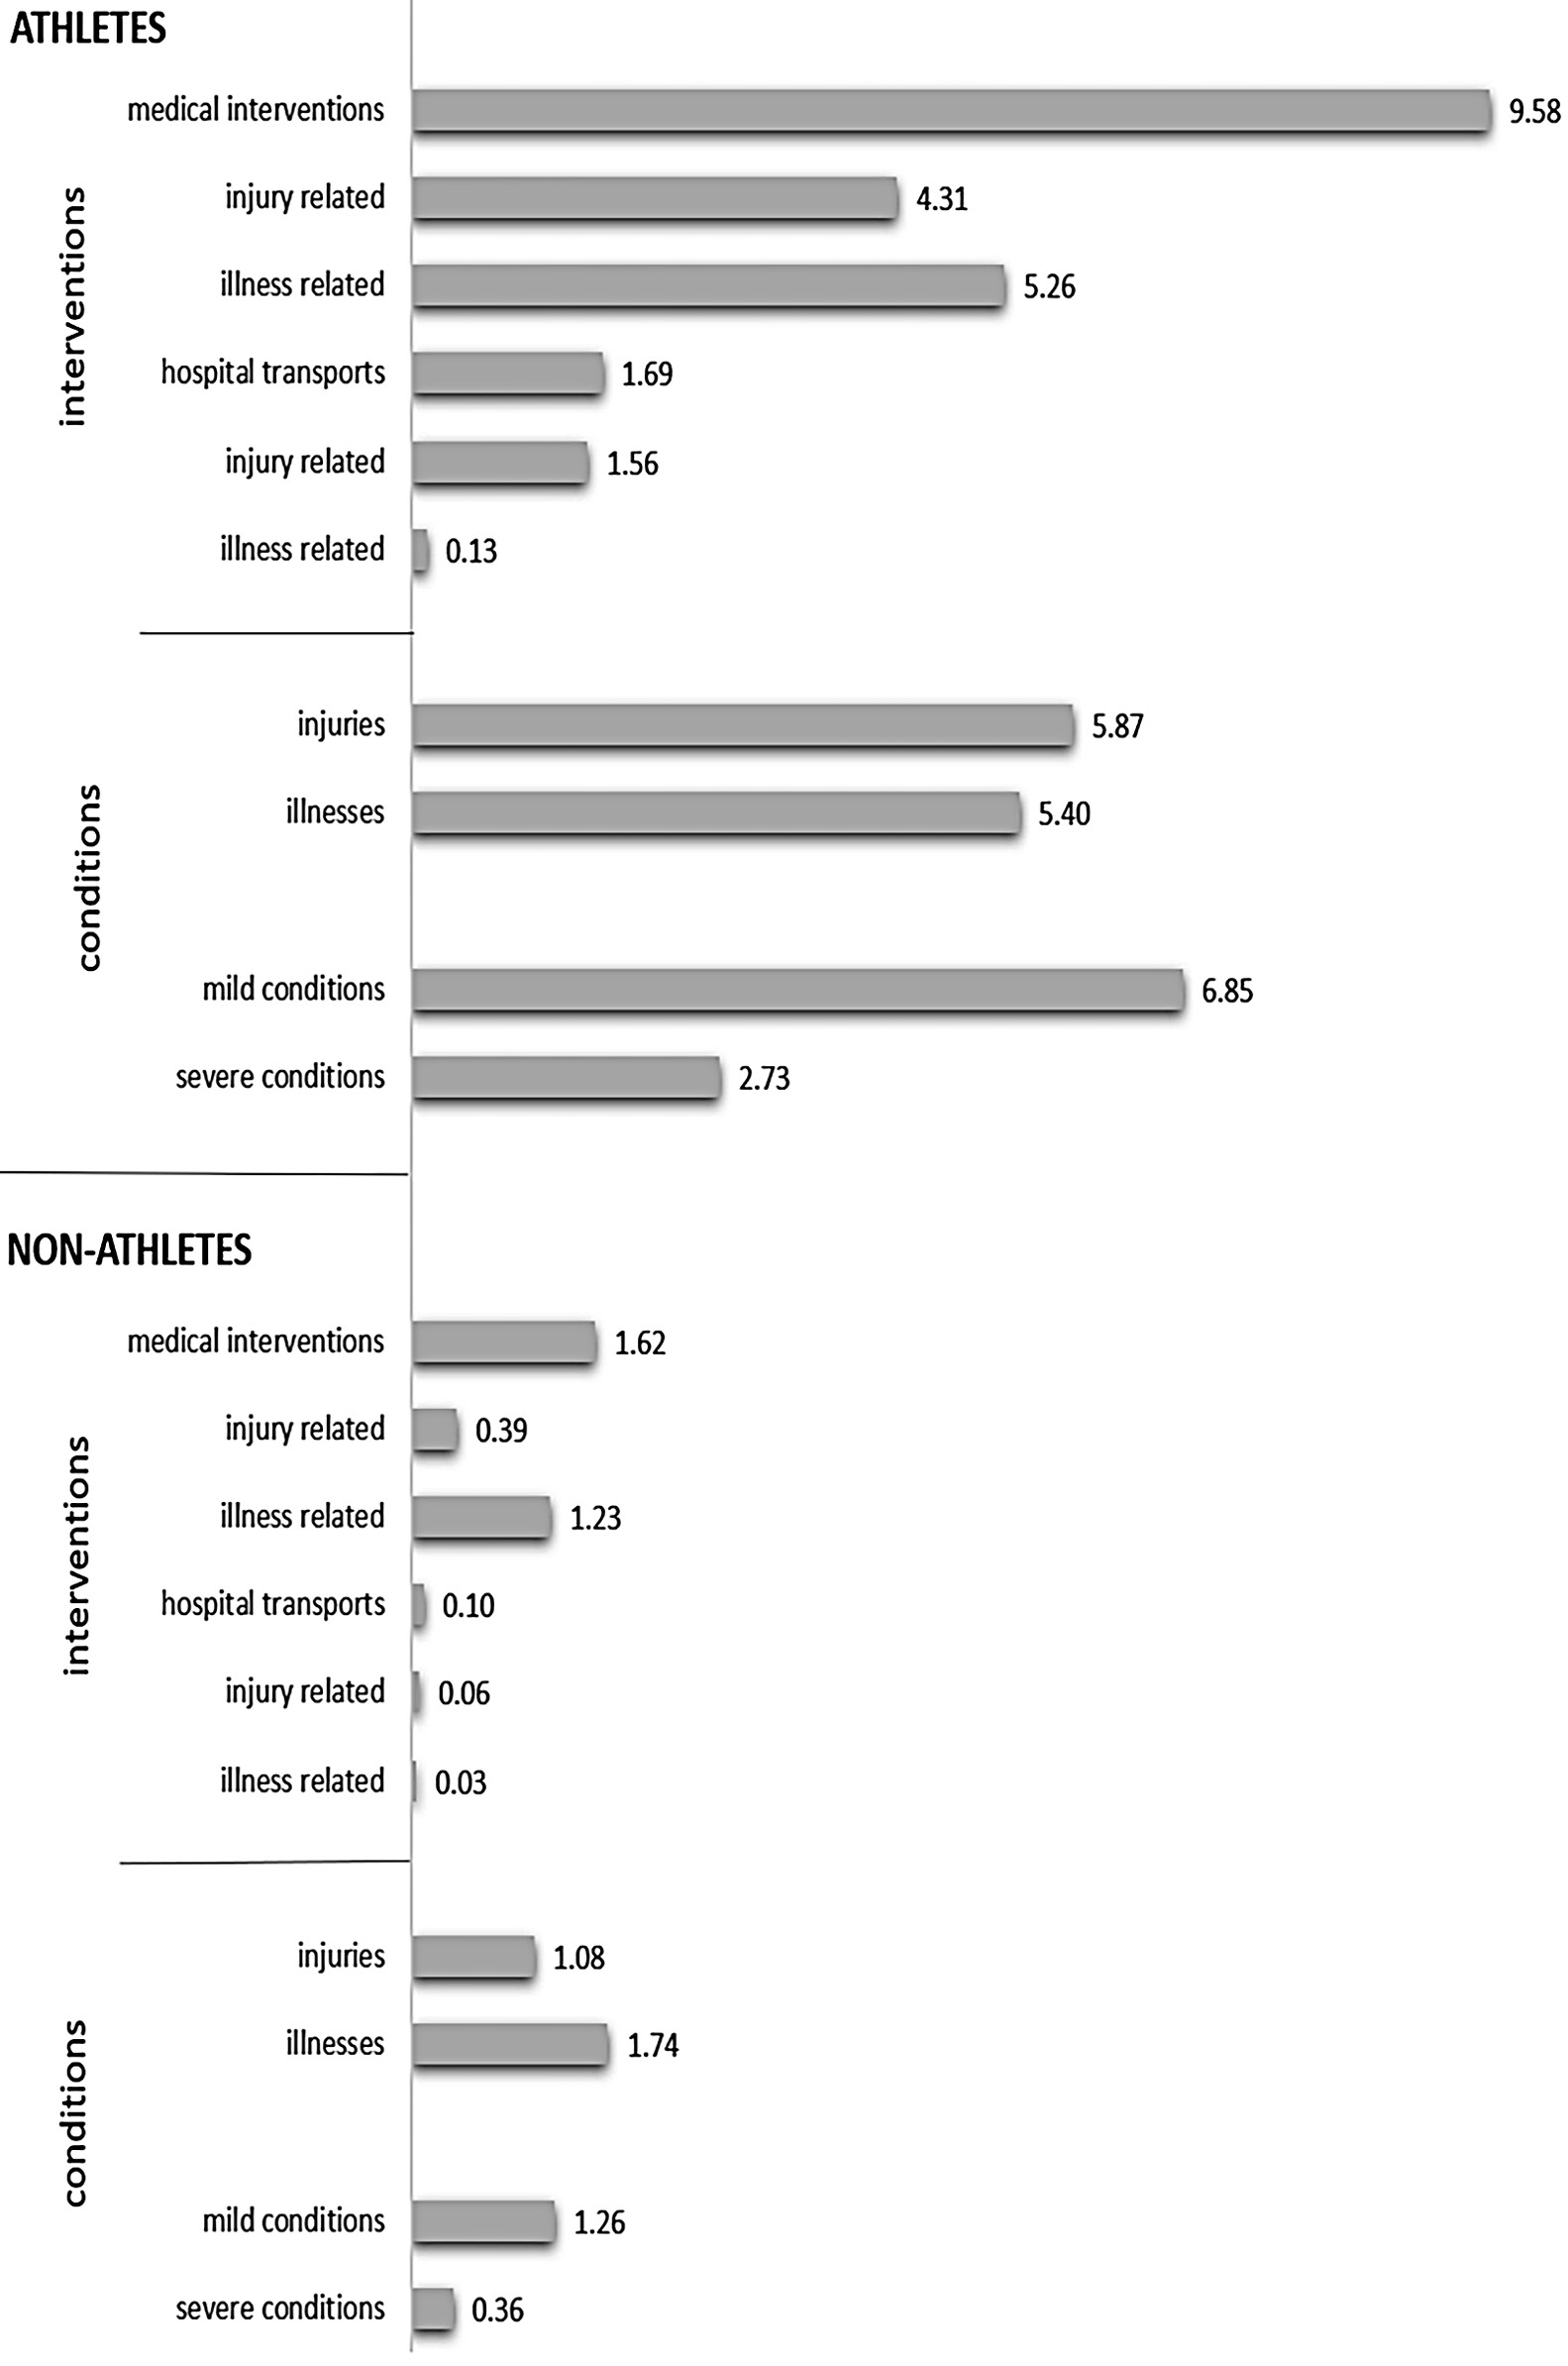
The athlete group reported 442 medical interventions and 78 hospital transports (46,127 participant-days). The pooled incidence rates for medical interventions and hospital transports were 9.58 (95% CI: 8.73–10.50) and 1.69 (95% CI: 1.36–2.09) per 1,000 participant-days, respectively. Injuries were related to 199 medical interventions and 73 hospital transports. The pooled injury incidence rate was 5.90 (95% CI: 5.24–6.62). The incidence rates for injury-related medical interventions and hospital transports were 4.31 (95% CI: 3.76–4.93) and 1.58 (95% CI: 1.26–1.97), respectively. Illnesses required 243 medical interventions and 5 hospital transports. The pooled illness incidence rate was 5.38 (95% CI: 4.75–6.07). The incidence rates for illness-related medical interventions and hospital transports were 5.27 (95% CI: 4.65–5.95) and 0.11 (95% CI: 0.05–0.22), respectively. Mild medical conditions accounted for 338 medical interventions and hospital transports, with a pooled incidence rate of 7.33 (95% CI: 6.59–8.13), whereas severe medical conditions accounted for 182 medical interventions and hospital transports, with an incidence rate of 3.95 (95% CI: 3.41–4.54).
Data on total medical interventions and medical conditions for WG 2017, EG 2023, and the pooled cohort are presented in Table 4, Table 5, Table 6.
Medical interventions and conditions in non-athletes
The non-athlete group reported 579 medical interventions and 36 hospital transports (355,215 participant-days). The pooled incidence rates for medical interventions and hospital transports were 1.63 (95% CI: 1.50–1.77) and 0.10 (95% CI: 0.07–0.14), respectively. Injuries were related to 141 medical interventions and 23 hospital transports. The pooled injury incidence rate was 0.46 (95% CI: 0.40–0.53). The incidence rates for injury-related medical interventions and hospital transports were 0.40 (95% CI: 0.34–0.47) and 0.06 (95% CI: 0.04–0.09), respectively. Illnesses required 438 medical interventions and 13 hospital transports. The pooled illness incidence rate was 1.27 (95% CI: 1.16–1.39). The incidence rates for illness-related medical interventions and hospital transports were 1.23 (95% CI: 1.12–1.35) and 0.04 (95% CI: 0.02–0.06), respectively. Mild medical conditions accounted for 460 medical interventions and hospital transports, with a pooled incidence rate of 1.29 (95% CI: 1.18–1.42), whereas severe medical conditions accounted for 155, with an incidence rate of 0.44 (95% CI: 0.37–0.51).
Athlete and non-athlete groups comparison
Compared with non-athletes, athletes demonstrated consistently higher incidence rates across all analyzed outcomes. In the pooled cohort, the IRR for total medical interventions was 5.88 (95% CI: 5.19–6.65), for injury-related medical interventions 10.87 (95% CI: 8.76–13.49), and for illness-related medical interventions 4.27 (95% CI: 3.65–5.00). Hospital transport rates were substantially higher among athletes. The pooled IRR for total hospital transports was 16.69 (95% CI: 11.24–24.77), 24.44 for injury-related hospital transports (95% CI: 15.30–39.05), and 2.96 for illness-related hospital transports (95% CI: 1.06–8.31). The latter estimate should be interpreted cautiously because of sparse event counts. Athletes also had a higher incidence of both mild and severe medical conditions, with pooled IRRs of 5.66 (95% CI: 4.92–6.51) and 9.04 (95% CI: 7.30–11.20), respectively. The observed differences were not limited to overall event rates but also reflected distinct patterns of medical conditions. Injury-related events accounted for a larger proportion of medical interventions among athletes, whereas illness-related events represented a relatively greater proportion among non-athletes.
Across tournaments, the total population demonstrated higher overall medical intervention rates during WG 2017 compared with EG 2023 (IRR = 1.26, 95% CI: 1.12–1.43), injury-related medical interventions (IRR = 1.72, 95% CI: 1.38–2.13), and severe medical conditions (IRR = 1.46, 95% CI: 1.18–1.81), whereas hospital transport rates remained comparable between tournaments. Among athletes, most medical outcomes occurred at significantly higher rates during WG 2017 than during EG 2023. In contrast, among non-athletes, most between-tournament differences were small and not statistically significant, except for severe medical conditions (IRR = 1.71, 95% CI: 1.24–2.37) and injury-related medical interventions (IRR = 1.91, 95% CI: 1.35–2.69).
Table 7 summarizes the comparative analyses of WG 2017, EG 2023, and the pooled cohort. Table 4, Table 5, Table 6 present descriptive incidence estimates with 95% CIs.
Sport discipline-specific hospital transports and related medical conditions
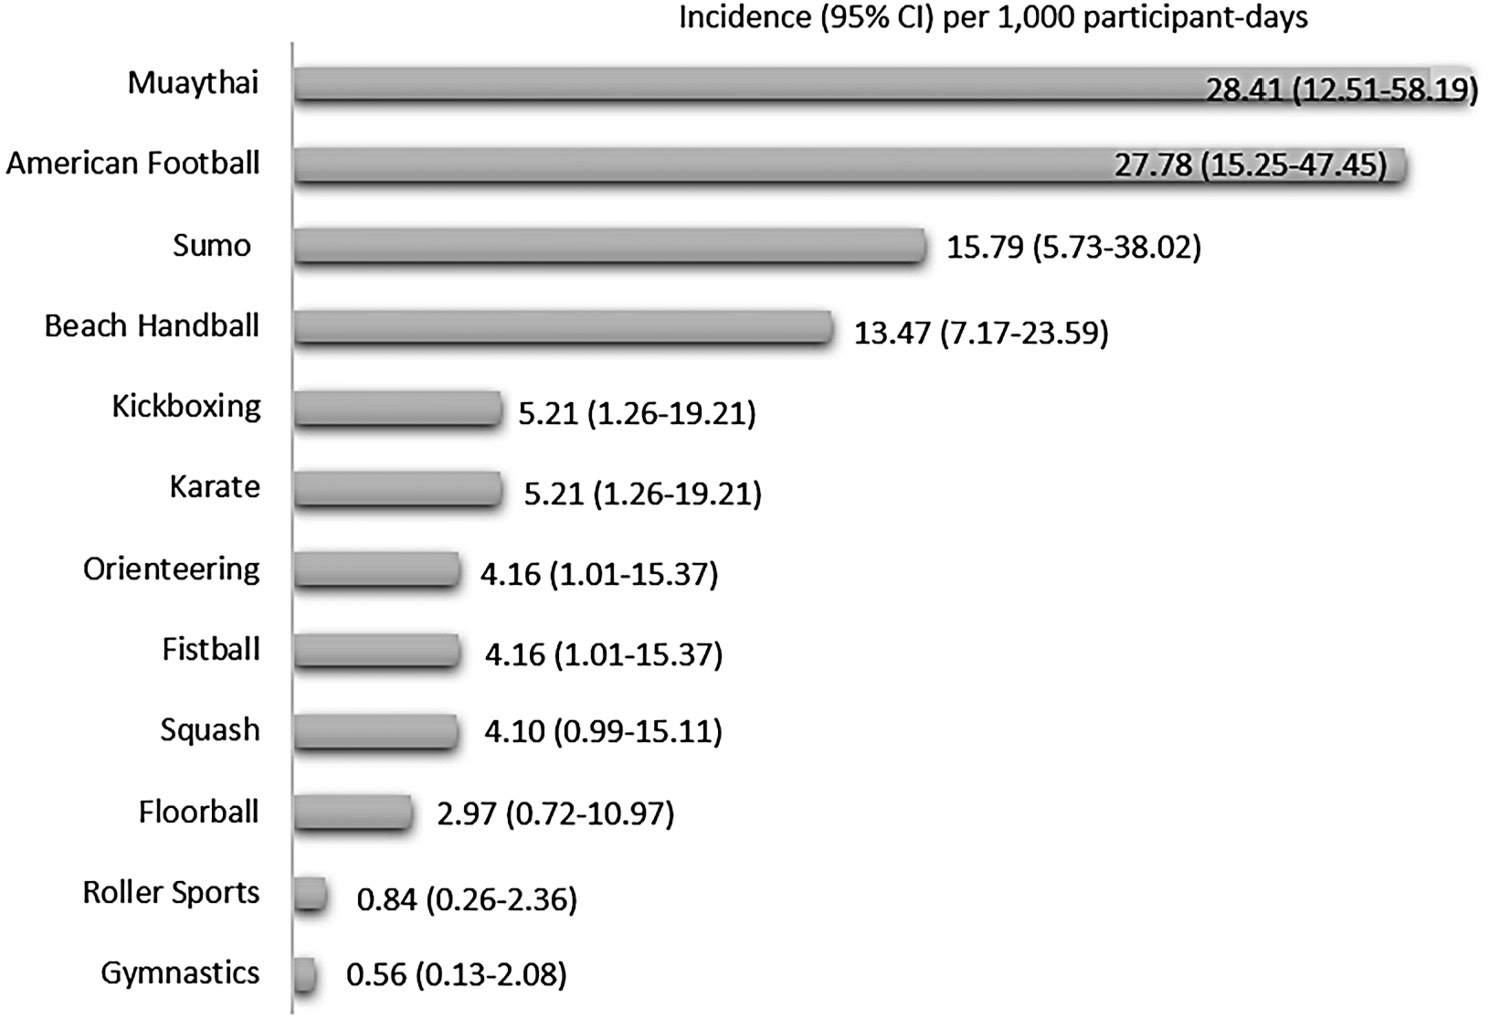
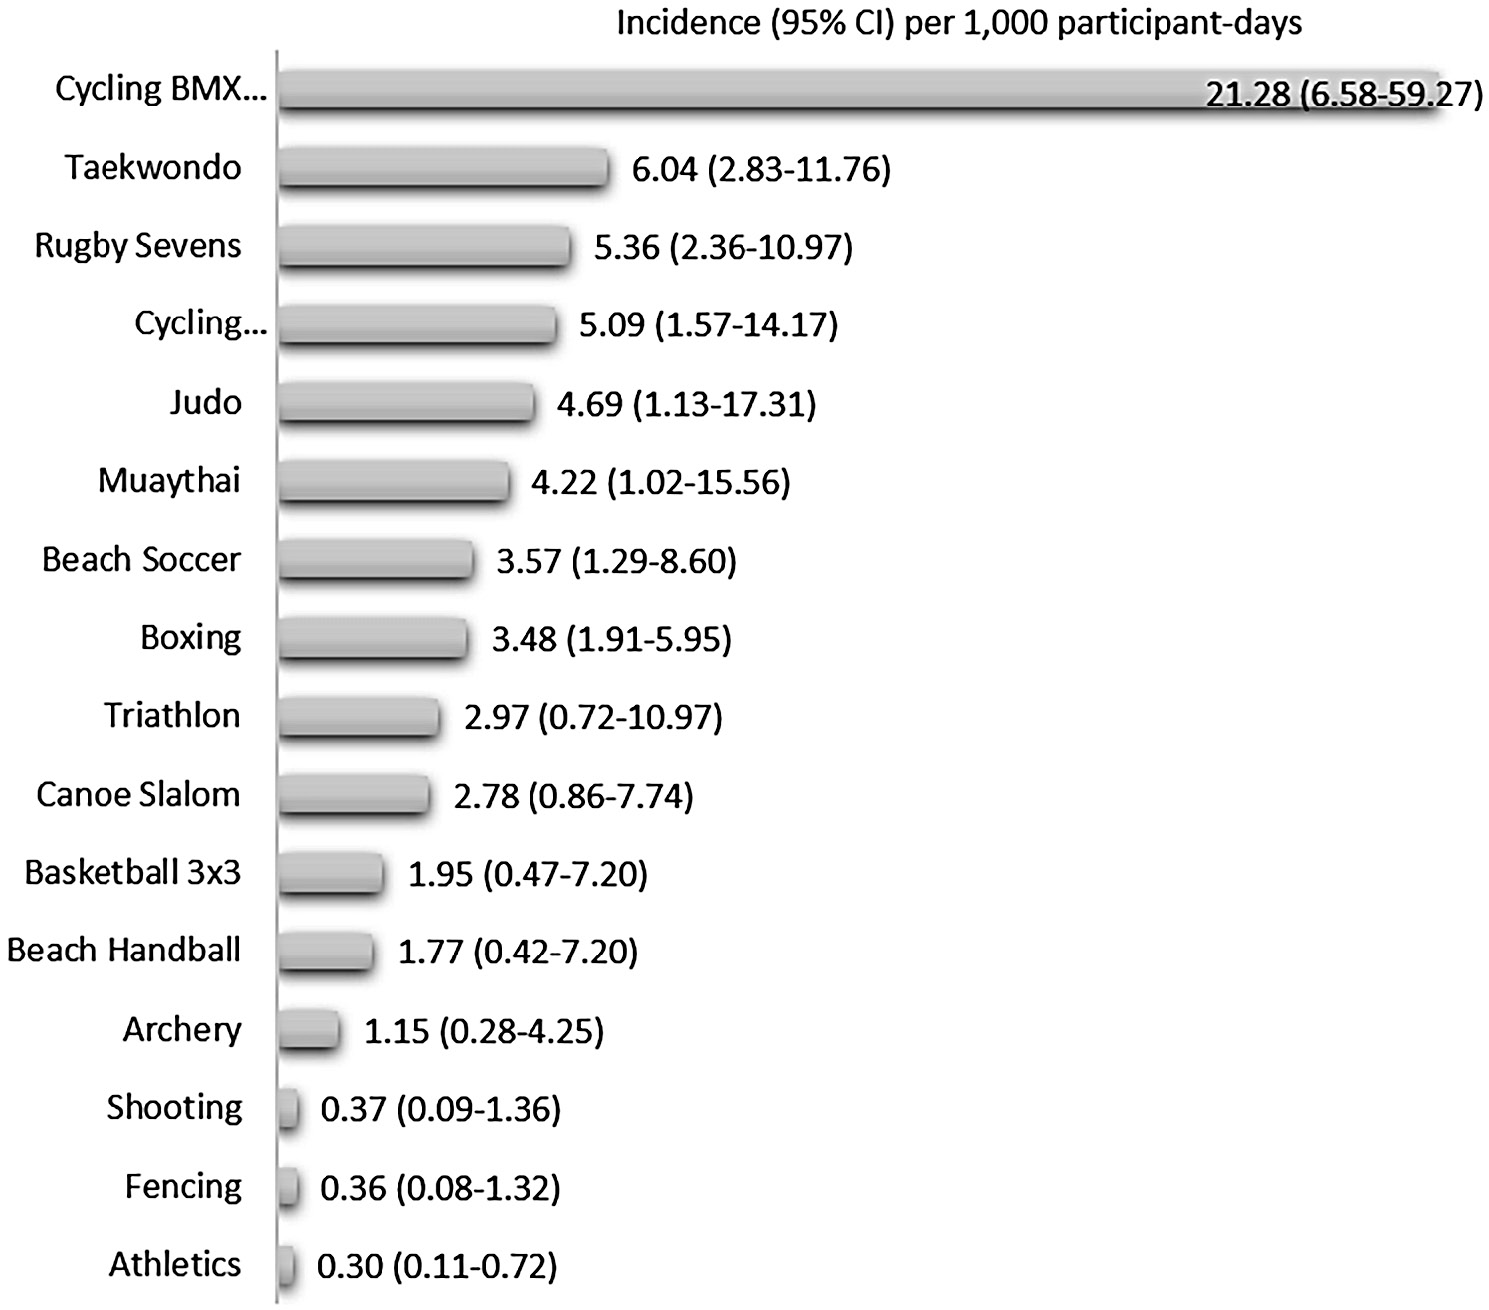
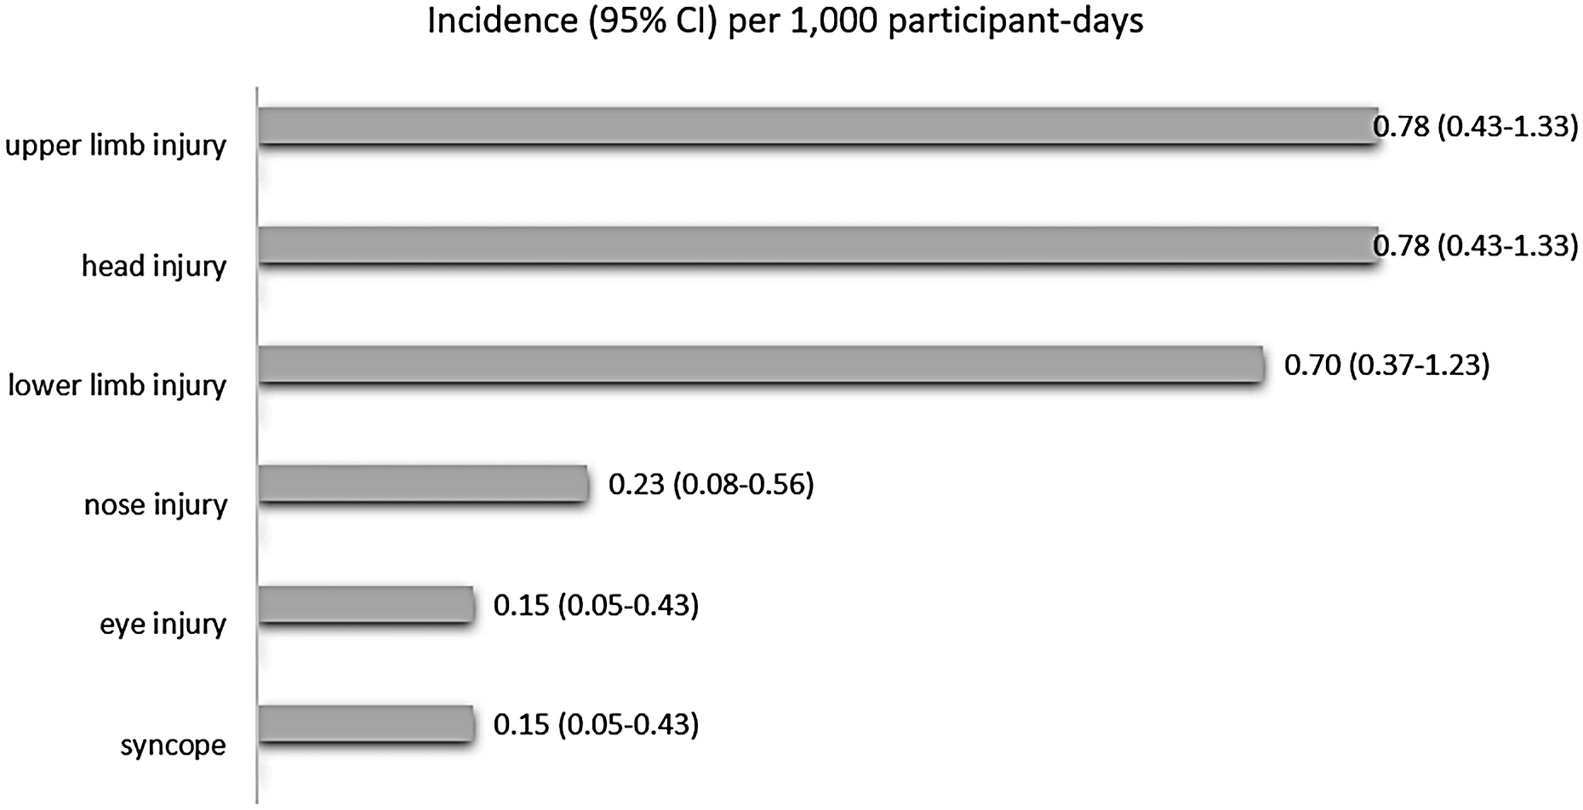
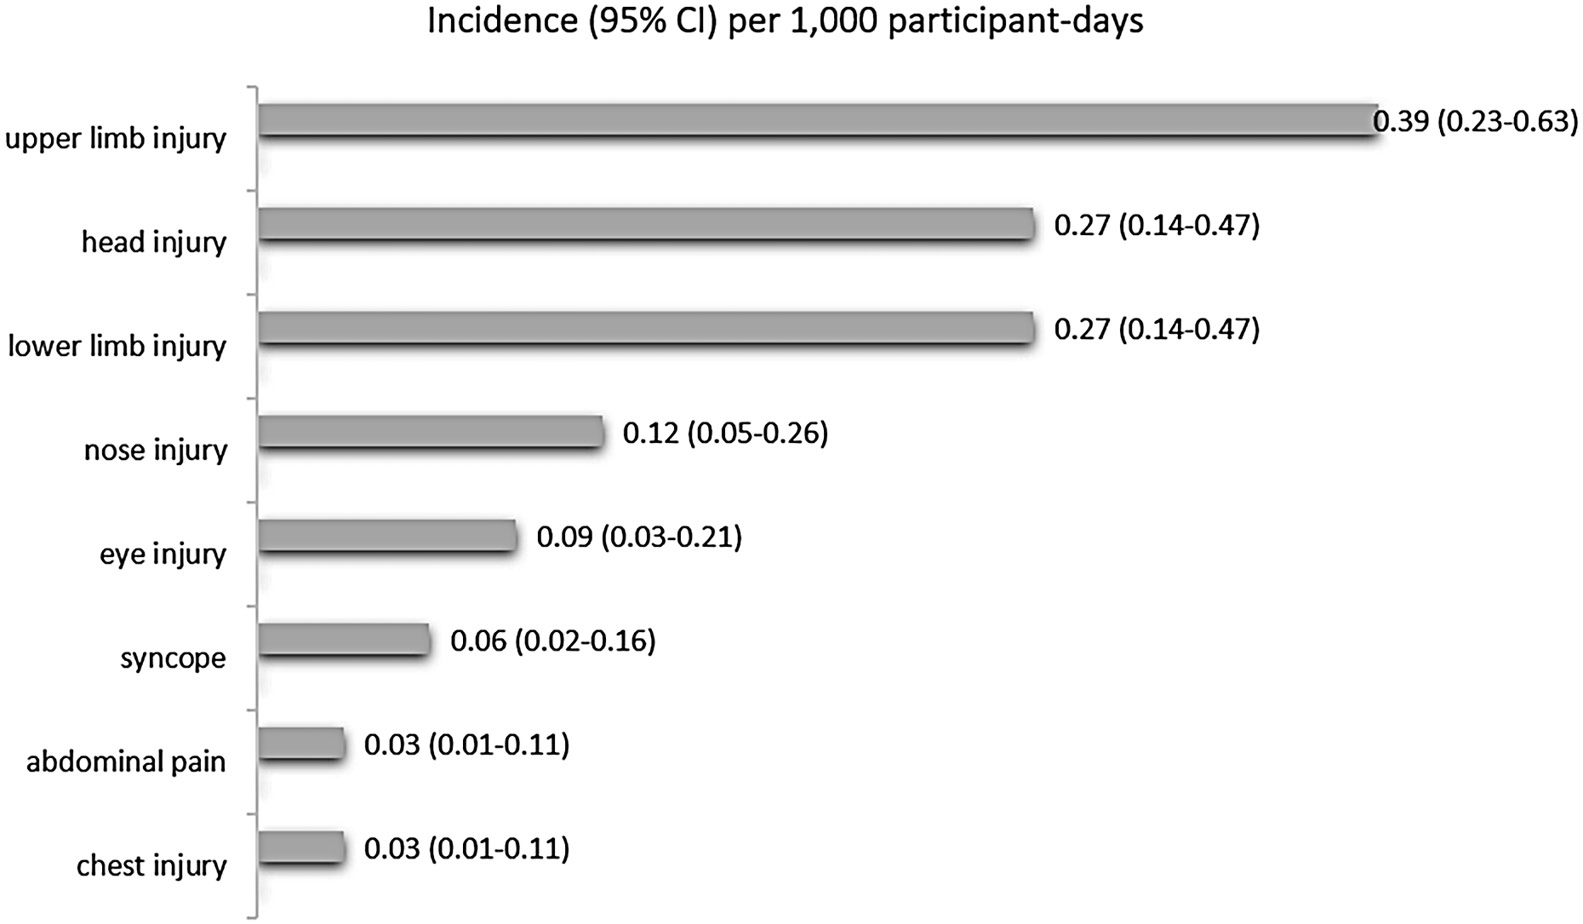
Among the disciplines, the highest incidence of hospital transports was observed in muaythai – 28.41 (95% CI: 9.22–66.30) and American football – 27.78 (95% CI: 13.32–51.08) at WG 2017; BMX freestyle cycling – 21.28 (95% CI: 2.58–76.86) at EG 2023; sumo – 15.79 (95% CI: 3.26–46.14) and beach handball – 13.47 (95% CI: 6.16–25.58) at WG 2017; taekwondo – 6.05 (95% CI: 2.22–13.16) and rugby sevens 5.36 (95% CI: 1.74–12.51) at EG 2023. Figure 2, Figure 3 present tournament data. These disciplines accounted for 40 of 78 hospital transports (51.3%). In the pooled athlete cohort, hospital transports were predominantly injury-related (93.6%). The highest IRs were reported for upper limb (0.50, 95% CI: 0.32–0.74), head (IR = 0.41, 95% CI: 0.25–0.64), and lower limb injuries (IR = 0.39, 95% CI: 0.23–0.62). Figure 4, Figure 5 present tournament data.
Discussion
This study analyzed patterns of medical interventions and conditions managed by the VMTs in athlete and non-athlete populations during 2 major international multi-sport tournaments held in Poland – the WG 2017 and the EG 2023. The primary outcomes were incidence rates of medical interventions and hospital transports; secondary analyses examined clinical characteristics and the severity of medical conditions to determine patterns of medical demand across participant groups.
Patterns of medical demands
Overall, both tournaments demonstrated a low incidence of medical interventions, ranging from 2.27 to 2.87 per 1,000 participant-days, with the hospital transport incidence approx. nine-to-tenfold lower (0.28 per 1,000 participant-days). Mild medical conditions predominated in all analyzed groups. Among participants requiring hospital transports, injury-related conditions predominated, with incidence rates fivefold higher than those for illnesses. These findings underscored the important role of VMTs in managing most medical interventions on-site, limiting the need for hospital transport and EMS utilization. Hospital transports were primarily required for severe and injury-related conditions. This pattern is further supported by the predominance of illnesses over injuries (IR 1.74 vs 1.09 per 1,000 participant-days) and mild over severe medical conditions (IR 1.99 vs 0.84). However, these results should be interpreted with caution, given the estimation approach used for the spectator group and the reliance on VMTs as the sole data source for athletes.
The athletes
In the athlete group, 5.4% of individuals required medical interventions or hospital transports from VMTs. The overall pattern of medical events in this group differed from that observed in the total cohort. Hospital transports occurred over fivefold less frequently than on-site medical interventions. Mild medical conditions continued to predominate by approximately twofold. Notably, injury and illness incidences were comparable. As expected, injury-related conditions predominated among hospital transports in this group and across all recorded hospital transports.
The incidence of injuries in the analyzed tournaments (IR = 4.31, 95% CI: 3.76–4.93) was lower than the benchmarks reported for the summer OGs: 6.01 (95% CI: 5.65–6.38) in Beijing 2008,12, 13 7.58 (95% CI: 7.18–7.99) in London 2012,12, 14 5.74 (95% CI: 5.41–6.09) in Rio de Janeiro 2016,12, 15 and 5.38 (95% CI: 5.06–5.72) in Tokyo 2020.12, 16 The summer Youth Olympic Games (YOG) in Buenos Aires 2018 demonstrated an even higher injury incidence of 11.95 (95% CI: 11.03–12.93).12, 17 The results observed in this study were closer to those reported for the 2021 Summer World University Games (WUG), which involved 6,500 athletes and reported an injury incidence of 4.9 (95% CI: 4.3–5.4).18
The observed illness incidence (IR = 5.27, 95% CI: 4.65–5.95) was higher than that reported for the OG: 4.22 (95% CI: 3.92–4.53) in 2012,12, 14 3.20 (95% CI: 2.95–3.46) in 2016,12, 15 and 2.28 (95% CI: 2.07–2.50) in 2020,12, 16 as well as for WUG 2021 (2.5, 95% CI: 2.1–2.9).18 YOG 2018 demonstrated a higher illness incidence of 6.45 (95% CI: 5.78–7.18).17 These differences may reflect variations in event scale, competitive demands, and reporting systems. During the OG, medical reporting relied primarily on team physicians, whereas in other MSTs, reporting relied on data collected by VMTs.
The lower incidence of venue medical interventions observed during EG 2023 may also reflect differences in medical service organization. At WG 2017, VMTs handled most athlete medical care, whereas at EG 2023, team physicians managed a substantial part of the medical workload. This difference in data-collection procedures may have led to underreporting of mild medical conditions.
The non-athletes
The profile of medical interventions in the non-athlete group differed from that observed in athletes. Only 0.16% of non-athletes required medical interventions at the venues and 0.01% required hospital transports. Injury-related medical intervention rates were lower, whereas illness-related rates were comparable to those observed in the total cohort. Hospital transport rates were approximately fourfold lower for injuries and comparable for illnesses, although illness-related estimates need to be interpreted with caution due to sparse event counts. Mild medical conditions were similar, while severe conditions were twofold less frequent. The patterns were consistent across both tournaments and aligned with those reported at previous events, including the Melbourne 2006 Commonwealth Games16 and the 2023 Ryder Cup.17
Difference in medical patterns
Comparisons between groups revealed distinct patterns of medical demands. Athletes had consistently higher rates of both on-site medical interventions and hospital transports than non-athletes across all analyzed outcomes, with the largest between-group differences for injury-related medical interventions, injury-related hospital transports, and severe medical conditions. Although illness-related medical interventions were also more frequent among athletes, illness-related hospital transports remained very infrequent in both groups. The distribution of medical conditions also differed between groups, with injury-related events representing a greater proportion of medical interventions among athletes, whereas non-athletes were characterized predominantly by illness-related and mild medical conditions. Furthermore, although mild medical conditions predominated in both groups, the relative difference between athletes and non-athletes was more pronounced for severe than for mild conditions. Collectively, these findings indicate that medical interventions in athletes were characterized by a substantially greater burden of injury-related and severe medical conditions, whereas illness-related and mild medical conditions predominated among non-athletes.
This overall pattern is consistent with the observed trends in other major international sporting tournaments.12, 13, 14, 15, 16, 17, 18, 19, 20, 21, 22, 23, 24, 28, 29, 30, 31, 32 Figure 6 presents the comparative patterns of medical interventions between athlete and non-athlete groups.
Determinants in hospital transport in athletes
In the present analysis, sport disciplines associated with a higher frequency of hospital transports were identified. Muaythai, American football, BMX freestyle cycling, sumo, and beach handball, each with hospital transport incidences exceeding 10 per 1,000 participant-days, represent contact, high-speed, or team disciplines with an inherently elevated risk of trauma. While several of these disciplines, such as taekwondo, football, handball, rugby, and cycling, align with Olympic disciplines known for elevated injury risk,12, 13, 14, 15, 16, 17 a number of non-Olympic disciplines represented in these tournaments also showed increased hospital transport rates. Boxing, despite accounting for the highest absolute number of hospital transports during EG 2023, exhibited a comparatively lower incidence. Among medical conditions requiring hospital transport, limb and head injuries predominated, consistent with previous reports.12 However, in the analyzed cohort, upper limb injuries predominated over lower limb injuries. Interpreting discipline-specific hospital transport rates requires caution, as several disciplines had few events, resulting in wide CIs and limited precision. Consequently, the observed differences may primarily reflect operational patterns relevant to medical resource planning during multisport tournaments rather than definitive evidence of true discipline-specific risk.
Practical implications
This study provides data-driven insights into medical demands during MSTs. The inclusion of all participant groups enabled a comprehensive assessment of medical needs at the venues.26, 28, 29, 30, 31, 32, 33, 34, 35 Distinct patterns of medical interventions and conditions between groups provide a basis for targeted prevention strategies and more informed medical planning for future tournaments.
The predominance of mild medical conditions and on-site interventions across all groups supports the overall medical safety of these MSTs.30, 31, 32, 33, 34, 35, 36 The higher incidence of illnesses in both groups should be considered in planning for future events. The overall low number of hospital transports guides EMS involvement and referral hospital selection, while underscoring the need for continuous coordination between entities.2, 3, 4, 5, 6, 31, 32, 33, 34, 35, 36, 37 The profile of hospital transports may inform the selection of referral hospitals,33, 36, 37 while the predominance of limb and head injuries and the identification of higher-risk sport disciplines support tailored medical planning.
As tournaments continue to grow in scale and complexity, continuous surveillance of medical data is essential to ensure the provision of required medical services, to monitor trends in medical needs, and to assess the effectiveness of the prevention strategies implemented.12, 34, 35, 36, 37, 38 A structured bottom-up reporting system enables reliable data collection for subsequent analyses. Integration of information from other stakeholders (team physicians, team managers, and event organizers) is required for a more comprehensive assessment of medical demands. Inclusion of the referral hospital data, particularly regarding patient follow-up, would strengthen the evidence for medical analyses.28, 32, 39 For non-athletes, accurate attendance data and demographic profiling would further enhance understanding of medical needs.2, 3, 4, 5, 6, 7, 8, 9, 10, 25, 26, 31, 32, 33
Expanding reporting systems in alignment with IOC surveillance frameworks, while adapting them to include non-athlete populations, would improve comparability and analytical potential across MSTs. Such standardization would ultimately strengthen medical data consistency.12
Limitations of the study
First, the non-athlete population was estimated from ticketing data, which may have overestimated attendance and, consequently, underestimated medical service utilization rates among spectators. Second, athlete-related data did not include reports from team physicians, potentially underrepresenting minor or sport-specific medical conditions managed outside VMTs. Importantly, the on-site medical response captured all conditions requiring hospital transport and included them in the dataset. In addition, the low number of hospital transports, particularly for illness-related conditions, limited the precision of incidence estimates. The dataset did not allow more detailed analyses, such as gender differences. Furthermore, the analysis included complete tournament populations rather than randomly selected samples. Therefore, the findings should be generalized with caution, and the reported CIs and statistical comparisons should be interpreted primarily as measures of variability and tools for comparison between the analyzed tournaments and participant groups. Finally, both tournaments were held in summer conditions, which should be considered when comparing these findings with events conducted in different environmental contexts.
Conclusions
This prospective study demonstrated distinct patterns in the incidence, type, and severity of medical interventions managed by VMTs among athlete and non-athlete populations during 2 international multi-sport tournaments. Athletes experienced substantially higher incidences of medical interventions and hospital transports across all analyzed outcomes, with the greatest between-group differences observed for injury-related and severe medical conditions. Although mild conditions predominated in both groups, illness-related conditions represented a relatively greater proportion of medical interventions among non-athletes, whereas injury-related conditions represented a greater proportion among athletes. Hospital transports were relatively uncommon in both groups but occurred substantially more frequently among athletes, with the vast majority being injury-related.
Comparisons between tournaments indicated generally similar patterns of medical events, although athletes demonstrated higher incidences of most medical outcomes during WG 2017 than during EG 2023. The combined analysis of athlete and non-athlete populations provided a comprehensive assessment of the overall medical workload encountered by VMTs and highlighted the value of standardized surveillance for comparing healthcare demands across participant groups and tournaments. Within the athlete cohort, several sport disciplines, including muaythai, American football, BMX freestyle cycling, sumo, and beach handball, showed higher hospital transport rates; however, the absolute number of events was low. Upper limb, head, and lower limb injuries were the most frequent conditions requiring hospital transport. These findings support evidence-based medical planning by accounting for differences in medical interventions, hospital transport requirements, and medical condition profiles between participant groups and sport disciplines at future international multi-sport tournaments.
Data Availability Statement
The aggregated dataset supporting the findings of this study is available in Zenodo at https://doi.org/10.5281/zenodo.21886930. No individual-level or personally identifiable data are included.
Consent for publication of personal information
Not applicable.
Use of AI and AI–assisted technology
Generative AI (Google Gemini 2.5 Pro, Google DeepMind) was used to improve language and readability; the authors reviewed and take full responsibility for the content.