Abstract
Background. Crohn’s disease (CD) is increasingly diagnosed in children, a population in which hepatic dysfunction and coexisting liver conditions are not uncommon. These factors may contribute to the development of hepatic fibrosis.
Objectives. This study aimed to evaluate liver involvement in pediatric CD at diagnosis and to explore the utility of noninvasive markers, including fibroblast growth factor 19 (FGF-19) and connective tissue growth factor (CTGF), in detecting early fibrotic changes.
Materials and methods. Fifty children with newly diagnosed CD and 23 healthy controls without gastrointestinal disorders were enrolled. All participants underwent liver function testing, noninvasive fibrosis scoring, serum FGF-19 and CTGF measurement, and liver elastography.
Results. No patient in either group demonstrated significant hepatic fibrosis (>F2 on the METAVIR scale). No statistically significant differences were found in liver elastography results between the study group and the control group (3.98 kPa vs 3.92 kPa, p = 0.430). A positive correlation was found between liver stiffness values and fecal calprotectin levels, suggesting a link to intestinal inflammation. Compared to controls, CD patients had significantly lower serum FGF-19 (87.8 pg/mL vs 123.7 pg/mL, p = 0.028) and higher CTGF concentrations (710.8 pg/mL vs 252.2 pg/mL, p < 0.001).
Conclusions. Elevated liver stiffness was uncommon at the time of CD diagnosis in pediatric patients; no patients had findings suggestive of advanced fibrosis (≥F3), and only 1 patient had liver stiffness corresponding to F2 fibrosis. Altered levels of FGF-19 and CTGF may reflect intestinal inflammation and a potential fibrotic response within the gut rather than the liver. Elevated elastography values appear to be influenced by intestinal disease activity, underscoring the importance of distinguishing hepatic from intestinal sources of biomarker changes in this population.
Key words: children, elastography, liver fibrosis, FGF-19, CTGF
Background
In recent years, a rising incidence of Crohn’s disease (CD) among children has been observed.1, 2 It is an autoimmune disorder that can affect any part of the gastrointestinal tract, most commonly involving the terminal ileum. As CD is a chronic, autoimmune condition, it requires special attention, particularly in terms of identifying potential complications and comorbidities. Hepatic dysfunction is quite common in pediatric patients with CD.3 According to available data, elevated transaminase activity is observed in up to 30% of children with CD across various disease stages. This elevation may be related to the therapeutic regimen or coexisting disorders or may represent an extraintestinal manifestation of the disease.4, 5, 6 Special consideration should be given to some other autoimmune, potentially coexisting diseases, especially primary sclerosing cholangitis (PSC), but also autoimmune hepatitis (AIH) and AIH-PSC overlap syndrome, which may coexist with CD and require appropriate clinical management. According to the existing guidelines, patients diagnosed with CD should be monitored for the presence of these associated disorders, especially PSC.7
To date, liver biopsy remains the gold standard for diagnosing liver diseases, including those leading to fibrosis, across all age groups. Although the procedure is brief, it requires general anesthesia in pediatric patients and carries risks of complications such as bleeding or bile duct injury. Despite these limitations, it is essential for the assessment of histopathological changes,8, 9 including the presence and severity of fibrosis. Nonetheless, alternative, less invasive methods for evaluating liver fibrosis are increasingly being adopted in clinical practice.
Due to the need for noninvasive and minimally invasive methods to assess the presence and severity of liver fibrosis in children, ongoing efforts are being made to identify optimal alternatives to invasive procedures. Liver fibrosis indices such as fibrosis-4 (FIB-4) and AST-to-platelet ratio index (APRI), commonly used in adult populations, appear to have potential applicability in pediatric patients as well.10, 11, 12
A simple method for assessing fibrosis in patients with CD may also involve measuring fibrosis-related biomarkers, such as fibroblast growth factor 19 (FGF-19) and connective tissue growth factor (CTGF), which may exert profibrotic effects on hepatic cells.13, 14 FGF-19 is a protein produced in the ileum that plays a key role in regulating bile acid synthesis,15 and its serum level may be associated with the degree of liver disease progression.16 CTGF is involved in fibrosis development in various organs, including the lungs, kidneys, and liver. It also plays a role in tumor progression, angiogenesis, and cartilage formation.14
Another noninvasive method for assessing liver fibrosis is ultrasound elastography, whose results correlate well with tissue stiffness as determined by biopsy.17 This technique has already been used in adult patients with CD18, 19, 20 and has also been applied as a diagnostic tool in various pediatric conditions.21, 22, 23 Although ultrasound elastography is a simple, accessible, and noninvasive method, its role in diagnosing liver diseases in pediatric patients with CD has not yet been established. It should also be noted that this method has certain limitations – successful measurement requires patient cooperation, which may be challenging in very young children. Although CD predominantly affects individuals in young adulthood, pediatric patients are generally able to cooperate, making this diagnostic technique a simple and practical option in this population.
Objectives
The primary aim of the study was to assess the presence and severity of liver fibrosis in children with newly diagnosed CD using noninvasive methods such as liver fibrosis indices (APRI and FIB-4), fibrosis biomarkers (FGF-19 and CTGF), and liver elastography. The secondary aim of our study was to assess the presence and severity of hepatic fibrosis in relation to the location of gastrointestinal inflammatory lesions at the time of diagnosis.
Materials and methods
Study participants
A single-center prospective study was conducted, including 50 pediatric patients with newly diagnosed CD and no previously identified liver disease, as well as a control group of 23 patients without any previously diagnosed chronic gastrointestinal disorders. The control patients were suspected of having gastrointestinal diseases, which were subsequently excluded based on diagnostic evaluation. They showed no signs of intestinal or hepatic inflammation, as determined in laboratory and imaging studies. All participants were hospitalized at the Department of Pediatrics and Gastroenterology, University Children’s Hospital (Cracow, Poland) between May 2022 and November 2024. The mean age of patients was 12.8 years in the study group and 13.2 years in the control group.
The study was conducted in accordance with the Declaration of Helsinki; informed consent was obtained from the parents of all participants and from patients aged 13 years and older. The study protocol was approved by the Bioethics Committee at Jagiellonian University in Cracow, Poland (approval No. KBET 1072.6120.101.2021).
Data collection and laboratory assessment
Following the diagnosis of CD, patients in the study group underwent baseline biochemical testing in a fasting state, including liver fibrosis assessment using FIB-4 (calculated from alanine aminotransferase (ALT), aspartate aminotransferase (AST), platelet count (PLT), and age) and APRI (based on AST, the upper limit of normal for AST, and PLT). The same tests were conducted on healthy individuals in the control group using an identical protocol. CTGF measurements were performed using the Human Connective Tissue Growth Factor (CTGF) Enzyme-Linked Immunosorbent Assay (ELISA) Kit (DLdevelop, Wuxi, China), and FGF-19 measurements were performed using the Human FGF-19 Quantikine ELISA (R&D Systems, Minneapolis, USA). Blood samples for laboratory determinations were collected in the morning from fasting participants in both groups. The measurements were performed in serum samples.
Elastography technique
Liver elastography was performed with the point shear-wave method on the Arietta V70 (Hitachi Aloka, Slough, UK) using a convex C251 probe (1.8–5.0 MHz). All examinations in both patient groups were conducted by a single investigator after the patients had fasted for at least 3 h. Measurements were obtained via an intercostal approach. For each patient, 10 measurements were taken, and the median value was expressed in kilopascals (kPa) and interpreted according to the METAVIR scoring system: F0 < 6.5 kPa (no fibrosis), F1 < 9.1 kPa (mild fibrosis), F2 < 10.8 kPa (moderate fibrosis), F3 < 13.3 kPa (advanced fibrosis), and F4 ≥ 13.3 kPa (cirrhosis).24 Measurements were considered valid when the interquartile range-to-median ratio (IQR/median) was <0.3. All procedures were performed in accordance with the EFSUMB Guidelines and Recommendations on the Clinical Use of Liver Ultrasound Elastography, Update 2017.25
Statistical analyses
All analyses were performed on original, non-transformed data. Quantitative variables were analyzed using descriptive statistics, including mean, standard deviation (SD), median, quartiles, and minimum and maximum values. Qualitative variables were analyzed by calculating absolute and relative frequencies for all possible values. Comparisons of qualitative variables between groups were performed using Pearson’s χ2 test for independence (with Yates’s correction for 2×2 tables) or Fisher’s exact or Fisher–Freeman–Halton test when the assumptions of the χ2 test regarding expected frequencies were not met. Comparisons of quantitative variables between 2 groups were conducted using the Mann–Whitney U test. For comparisons involving 3 or more groups, the Kruskal–Wallis test was applied, followed by Dunn’s post hoc test when differences were statistically significant. Correlations between quantitative variables were assessed using Spearman’s rank correlation. Prior to correlation analysis, the monotonicity assumption was evaluated through visual inspection of scatter plots. No substantive non-monotonic patterns (e.g., U-shaped or inverted U-shaped relationships) were observed; therefore, nonparametric correlations were considered appropriate. Diagnostic plots used to assess distributional characteristics and monotonicity are provided in Supplementary data (Supplementary Fig. 1–40). A significance level of 0.05 was adopted for all analyses; thus, p-values below 0.05 were considered statistically significant. Each statistical comparison corresponded to a separate, predefined hypothesis rather than to a single overarching test; therefore, no multiplicity correction was applied. This analytical framework aligns with interpreting each association as an independent inferential question. Nevertheless, the potential inflation of the type I error rate inherent in multiple independent tests is acknowledged, and borderline p-values should be interpreted with caution. Missing data were handled using an available-case (pairwise deletion) approach. No imputation procedures were applied. For each statistical test or correlation, only observations with complete data for the variables involved were included; therefore, sample sizes vary across analyses. Statistical analyses were performed using R v. 4.5.1 (R Foundation for Statistical Computing, Vienna, Austria).
Results
Patients’ characteristics
The study included 50 patients (22 girls and 28 boys) in the study group and 23 patients (13 girls and 10 boys) in the control group. No statistically significant differences were observed between the groups in terms of age, sex, or body mass index (BMI; detailed data are presented in Table 1).
In the study group, significantly lower levels of hemoglobin and albumin were observed, along with significantly increased inflammatory markers (PLT, erythrocyte sedimentation rate (ESR), C-reactive protein (CRP), calprotectin) and gamma-glutamyl transpeptidase (GGT), with no differences in AST and ALT. Additionally, in this group of patients, 4 had elevated GGT levels, and only 1 patient had increased transaminase values (>2× the upper limit of normal) at the time of diagnosis. A comparison of laboratory test results in the study group is presented in Table 2.
Disease characteristics in patients with newly diagnosed CD were assessed using the Paris classification,26 while disease severity was evaluated using the Pediatric Crohn’s Disease Activity Index (PCDAI).27 The results are presented in Table 3.
Liver fibrosis assessment
In the studied cohort, elastography values corresponding to METAVIR stage F2 were identified in only 1 patient. This patient also presented with elevated GGT levels; however, subsequent diagnostic work-up excluded liver disease. All remaining patients demonstrated liver elastography values not exceeding F2. In those with elastography readings above 6.5 kPa, mildly elevated ALT and AST levels were noted – remaining below twice the upper limit of normal – alongside increased GGT concentrations. In the control group, abnormal elastography values (>6.5 kPa) were noted in 2 participants, whose liver enzyme levels remained within reference ranges. Elastography values did not differ significantly between the groups. Liver fibrosis indices were significantly higher in the control group compared to the study group. However, none of the patients had values indicative of liver fibrosis. With respect to fibrosis-related proteins, FGF-19 levels were significantly reduced in the study group, whereas CTGF levels were significantly increased. Liver fibrosis parameters are detailed in Table 4.
Correlations between elastography, fibrotic markers, and biochemical parameters
Elastography
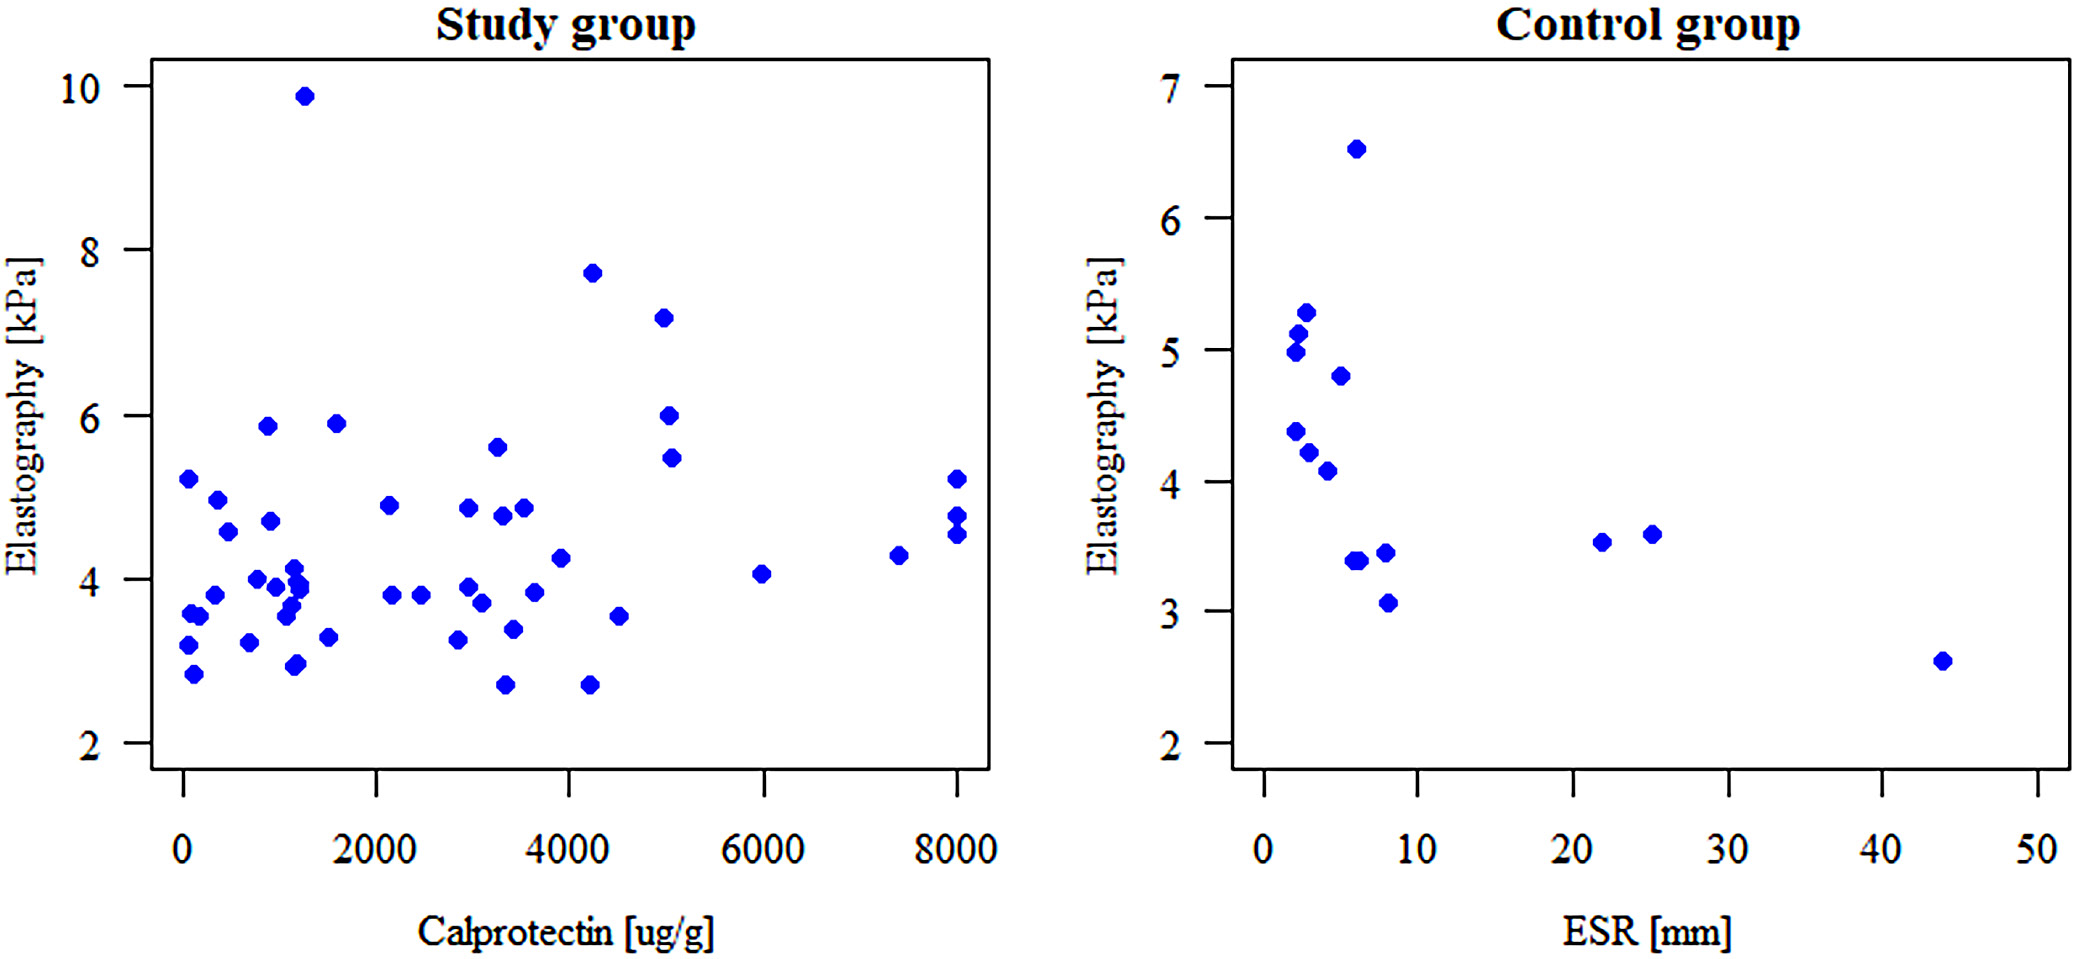
The median liver elastography values and IQRs Q1–Q3) were 3.98 kPa (3.56–4.90 kPa) in the study group and 3.92 kPa (3.38–4.73 kPa) in the control group, and the difference between groups was not statistically significant (p = 0.430). In the study group, a statistically significant positive correlation was observed between liver elastography values and fecal calprotectin levels (rho = 0.310, 95% confidence interval (95% CI): 0.03 to 0.54, n = 49, p = 0.036). No significant correlations were found between elastography and other inflammatory markers, including CRP (n = 49), ESR (n = 47), or PLT (n = 50). In the control group, a statistically significant negative correlation was noted between elastography and ESR (rho = −0.692, 95% CI: –0.89 to –0.28, n = 15, p = 0.004), while no significant associations were found with CRP (n = 23), PLT (n = 23), or calprotectin (n = 12). Across both groups, no significant correlations were observed between elastography values and liver enzyme activity (ALT, AST, and GGT). Additionally, no statistically significant differences in elastography or METAVIR scores were found between the study and control groups. No significant correlations were observed between elastography and liver fibrosis indices (FIB-4 and APRI) in either group. Elastography values were also not associated with disease severity as assessed using PCDAI. Correlations with liver elastography are illustrated in Figure 1. The remaining correlation plots have been included in the Supplementary data (Supplementary Fig. 1–6 and 21–26).
FGF-19 and CTGF
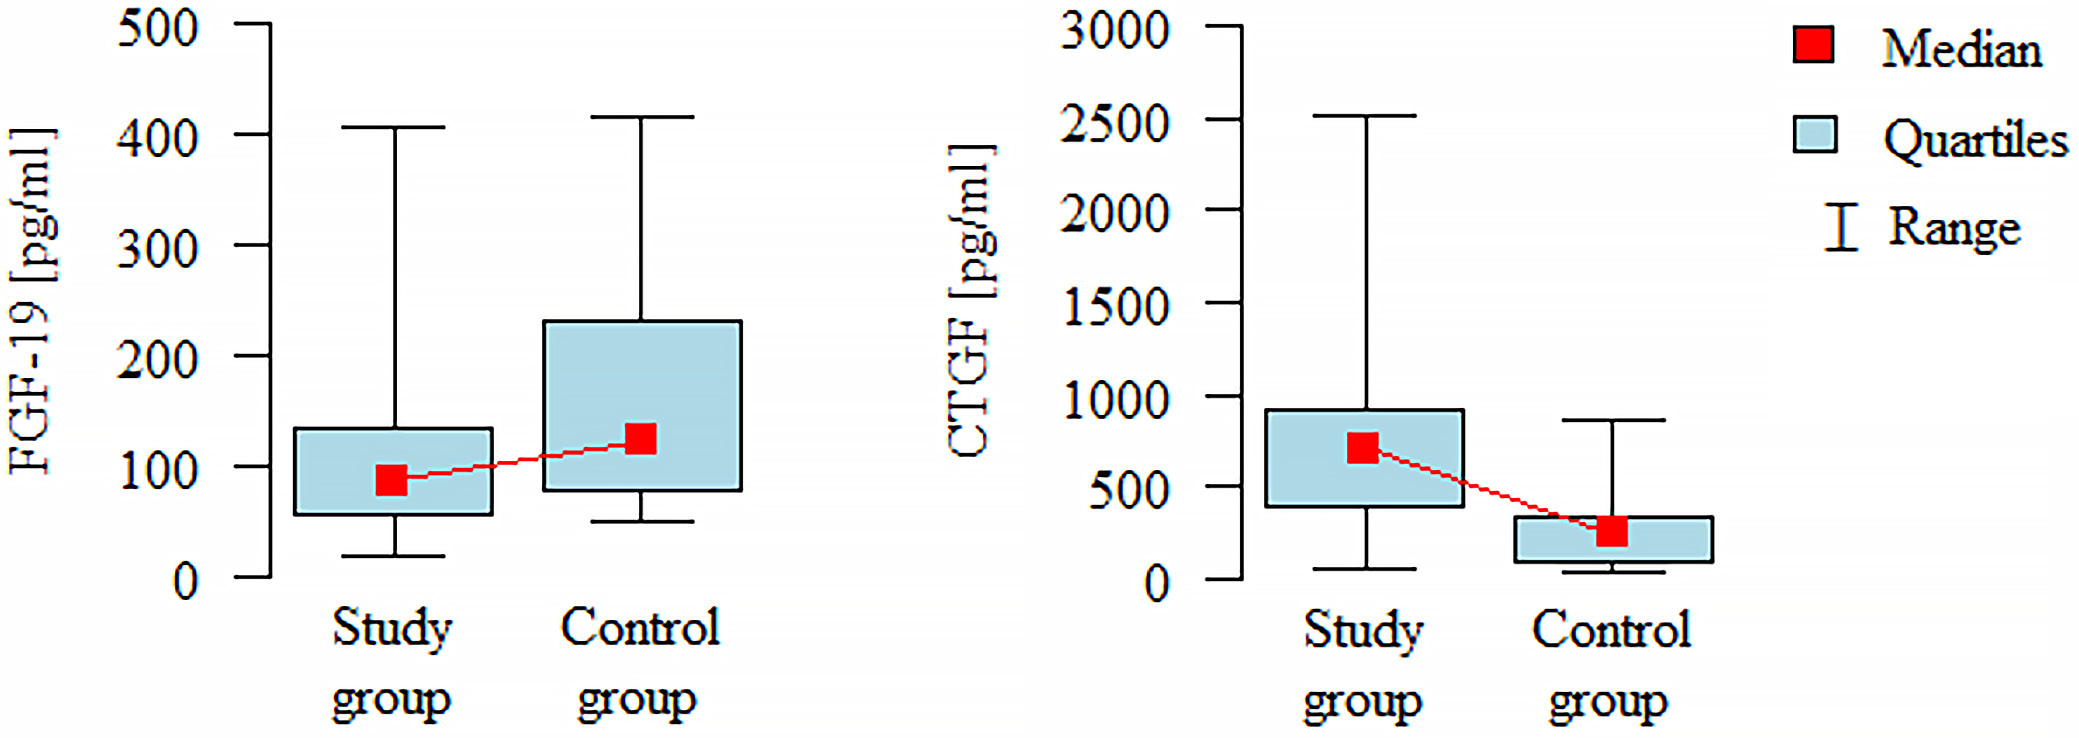
Statistically significant differences in fibrosis-related protein levels were observed between the study and control groups. Patients in the study group had significantly lower serum levels of FGF-19 compared to controls (Mann–Whitney (M-W) test: n = (49, 21); p = 0.028), while CTGF levels were significantly higher in the study group (M-W test: n = (49, 21); p < 0.001). No significant correlations were found between FGF-19 or CTGF levels and inflammatory markers (CRP, ESR, PLT, and calprotectin) or liver enzyme activity (ALT, AST, and GGT) in either group. Furthermore, no associations were observed between protein levels and disease severity as measured using PCDAI. Differences in the concentrations of FGF-19 and CTGF proteins between the study and control groups are shown in Figure 2. The remaining correlation plots are included in the Supplementary data (Supplementary Fig. 7–20 and 27–40).
Subgroup analysis based on Paris classification
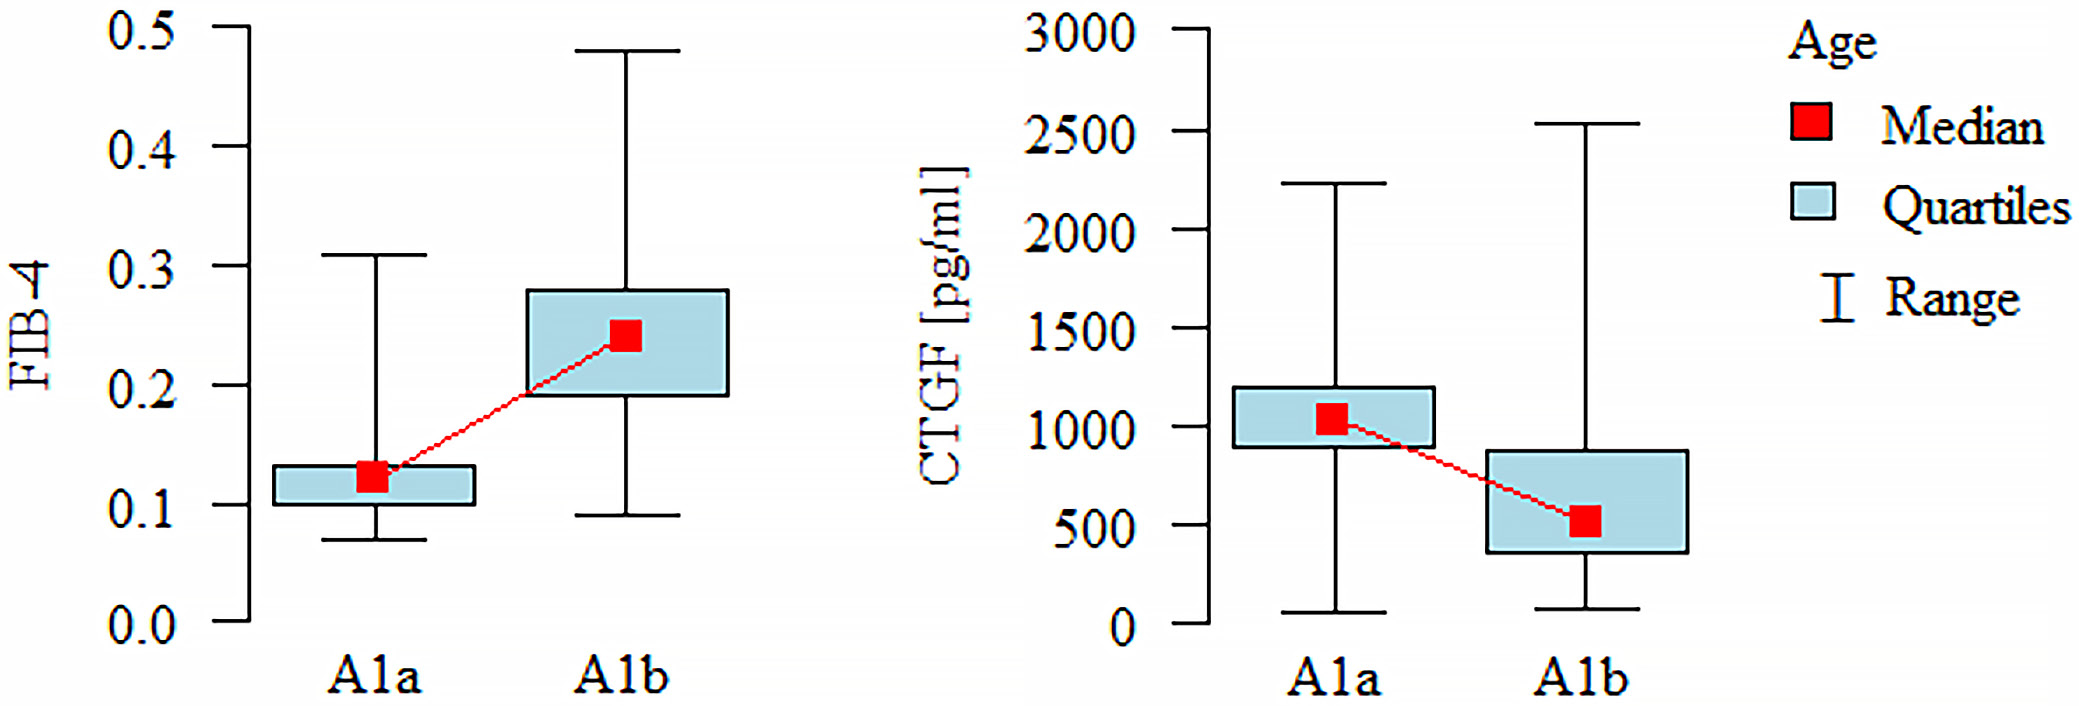
When patients were stratified according to the Paris classification, significant differences in FIB-4 and CTGF values were observed across age subgroups. Higher FIB-4 values were found in patients classified as A1b compared to those classified as A1a (M-W test: n = (13, 37); p = 0.001), while CTGF levels were significantly higher in the A1a subgroup (M-W test: n = (13, 36); p = 0.002). No significant differences were noted for elastography, FGF-19, or APRI values across age categories. No significant associations were found between disease location and any other parameters assessed using the Paris classification. The difference in APRI values between patients with inflammatory disease behavior (B1) and those in other groups was of borderline statistical significance (M-W test: n = (43, 7); p = 0.049), whereas no significant differences were observed for FIB-4, FGF-19, CTGF, or elastography. No significant differences in the analyzed markers were observed with respect to growth impairment status. Differences in FIB-4 and CTGF values across individual age groups are presented in Figure 3.
Discussion
Our study aimed to evaluate whether pediatric patients with newly diagnosed CD exhibit signs of liver fibrosis at the time of diagnosis, using noninvasive methods including liver ultrasound elastography and serum measurements of FGF-19 and CTGF. To the best of our knowledge, the usefulness of ultrasound liver elastography and the assessment of these fibrosis-related proteins have not previously been investigated in this patient population.
To date, liver biopsy remains the gold standard for diagnosing hepatic fibrosis, with histopathological evaluation of the biopsy specimen being the most accurate method for assessing fibrotic changes in the liver.28 Although biopsy is often unavoidable in patients with suspected fibrosis, there is a growing need for less invasive techniques to evaluate the presence and severity of fibrotic alterations.29, 30 One such method is ultrasound elastography, which has demonstrated good concordance with biopsy results, mainly in the adult population,31, 32, 33 but also in children.34 Despite its limitations – such as the need for patient cooperation, specialized equipment, and operator expertise – elastography is increasingly used in the diagnosis and monitoring of liver diseases.
In pediatric patients with CD, hepatic dysfunction is frequently observed at various stages of the disease and may lead to chronic liver disease.35, 36 These findings suggest that significant liver fibrosis is uncommon at disease onset. However, CD diagnosis in pediatric patients is typically established relatively early after symptom onset; longitudinal follow-up is warranted to assess the potential development of fibrotic changes over time.
Of particular interest is the observed correlation between liver stiffness and fecal calprotectin levels, which may indicate that increased hepatic stiffness is associated with intestinal inflammation. These findings may suggest that inflammatory involvement of the intestine is associated with alterations in hepatic tissue characteristics even in the absence of fibrosis. However, this relationship requires further studies to confirm its existence and to elucidate the underlying mechanisms. Elevated fecal calprotectin levels have previously been reported in patients with non-alcoholic fatty liver disease (NAFLD, currently referred to as metabolic dysfunction-associated fatty liver disease (MASLD)) and obesity,37 which may indicate a link between inflammation of the liver and intestines.
To investigate the presence of liver fibrosis in our patient cohort, we also measured 2 proteins – FGF-19 and CTGF – both implicated in fibrotic processes, including hepatic fibrosis.13, 14, 38 In the study group, FGF-19 levels were significantly lower than in controls, whereas CTGF levels were significantly higher. No correlation was found between the concentrations of these proteins and liver elastography values. The lower FGF-19 and higher CTGF levels detected in the study group may indicate that fibrosis is present not in the liver but elsewhere, e.g., in the intestines, where the inflammatory process is ongoing. However, further studies assessing the presence of intestinal fibrosis at the time of diagnosis would be required to confirm this possibility. Previous studies have shown reduced FGF-19 levels in patients with intestinal failure and liver diseases, often associated with ongoing inflammation or intestinal resection. Such a decrease in FGF-19 may contribute to the development of hepatic disorders, suggesting that CD patients with low FGF-19 levels should be monitored for potential liver involvement over time.39, 40 Reduced levels of FGF-19 have also been observed in adult patients with inflammatory bowel disease, with its concentration inversely correlated with the severity of inflammation,41 and this observation may be related to the expression of the farnesoid X receptor, which is predominantly located in the ileum.42, 43 Similarly, elevated CTGF expression has been reported in inflamed intestinal segments of patients with inflammatory bowel diseases, including CD, supporting its role in intestinal fibrosis. Accordingly, increased CTGF concentrations in newly diagnosed CD may reflect ongoing inflammatory or fibrotic processes within the intestinal wall driven by inflammation.44, 45
FIB-4 and APRI scores were also assessed in all patients. None of the evaluated individuals had values indicative of liver fibrosis. Interestingly, both indices were significantly higher in the control group compared to the study group, which was most likely related to a statistically significant difference in PLT – a parameter used in the calculation of both scores. No association was observed between the values of these indices and liver elastography measurements.
Limitations of the study
This study has several limitations. First, the number of participants enrolled in both the study and control groups was relatively small, and the sample sizes between groups were unequal. Additionally, complete data on some basic laboratory parameters were unavailable for all participants. Another limitation is the absence of liver fibrosis assessment using the diagnostic gold standard – liver biopsy. However, given the invasive nature of this procedure and the lack of clear clinical indications in the study population, its application would have been ethically unjustified. Furthermore, histopathological analysis of intestinal tissue samples to assess fibrosis was not performed, limiting the ability to determine whether reduced FGF-19 levels and elevated CTGF concentrations are directly associated with intestinal fibrosis. An additional limitation of the study is the use of the liver fibrosis indices FIB-4 and APRI, which rely, among other parameters, on PLT – a value that may increase in the presence of inflammation.
Conclusions
Patients with newly diagnosed CD showed no evidence of advanced liver fibrosis at the time of diagnosis, although one patient had liver stiffness values corresponding to F2 according to the METAVIR classification. These findings suggest that advanced hepatic fibrosis is uncommon at CD diagnosis, while early hepatic involvement cannot be excluded. The observed correlation between elevated elastography values and calprotectin levels may reflect intestinal, rather than hepatic, inflammation. Notably, the decreased concentration of FGF-19 and the increased concentration of CTGF in these patients may be indicative of inflammatory or fibrotic processes occurring within the intestinal wall, rather than in the liver. This interpretation is supported by the absence of liver fibrosis or inflammation in the studied group, pointing toward a gut-specific fibrogenic response. Although noninvasive techniques for liver fibrosis assessment are evolving, none currently match the diagnostic precision of liver biopsy. Longitudinal studies are needed to monitor potential hepatic changes over time, but current findings may emphasize the intestinal origin of biomarker activity in early CD.
Supplementary data
The supplementary materials are available at https://doi.org/10.5281/zenodo.21294419. The package contains the following files:
Supplementary Fig. 1. Scatter plot illustrating the relationship between PLT and elastography values in the study group.
Supplementary Fig. 2. Scatter plot illustrating the relationship between CRP and elastography values in the study group.
Supplementary Fig. 3. Scatter plot illustrating the relationship between ESR and elastography values in the study group.
Supplementary Fig. 4. Scatter plot illustrating the relationship between ALT and elastography values in the study group.
Supplementary Fig. 5. Scatter plot illustrating the relationship between AST and elastography values in the study group.
Supplementary Fig. 6. Scatter plot illustrating the relationship between GGT and elastography values in the study group.
Supplementary Fig. 7. Scatter plot illustrating the relationship between PLT and FGF-19 in the study group.
Supplementary Fig. 8. Scatter plot illustrating the relationship between CRP and FGF-19 in the study group.
Supplementary Fig. 9. Scatter plot illustrating the relationship between ESR and FGF-19 in the study group.
Supplementary Fig. 10. Scatter plot illustrating the relationship between ALT and FGF-19 in the study group.
Supplementary Fig. 11. Scatter plot illustrating the relationship between AST and FGF-19 in the study group.
Supplementary Fig. 12. Scatter plot illustrating the relationship between GGT and FGF-19 in the study group.
Supplementary Fig. 13. Scatter plot illustrating the relationship between calprotectin and FGF-19 in the study group.
Supplementary Fig. 14. Scatter plot illustrating the relationship between PLT and CTGF in the study group.
Supplementary Fig. 15. Scatter plot illustrating the relationship between CRP and CTGF in the study group.
Supplementary Fig. 16. Scatter plot illustrating the relationship between ESR and CTGF in the study group.
Supplementary Fig. 17. Scatter plot illustrating the relationship between ALT and CTGF in the study group.
Supplementary Fig. 18. Scatter plot illustrating the relationship between AST and CTGF in the study group.
Supplementary Fig. 19. Scatter plot illustrating the relationship between GGT and CTGF in the study group.
Supplementary Fig. 20. Scatter plot illustrating the relationship between calprotectin and CTGF in the study group.
Supplementary Fig. 21. Scatter plot illustrating the relationship between PLT and elastography values in the control group.
Supplementary Fig. 22. Scatter plot illustrating the relationship between CRP and elastography values in the control group.
Supplementary Fig. 23. Scatter plot illustrating the relationship between ALT and elastography values in the control group.
Supplementary Fig. 24. Scatter plot illustrating the relationship between AST and elastography values in the control group.
Supplementary Fig. 25. Scatter plot illustrating the relationship between GGT and elastography values in the control group.
Supplementary Fig. 26. Scatter plot illustrating the relationship between calprotectin and elastography values in the control group.
Supplementary Fig. 27. Scatter plot illustrating the relationship between PLT and FGF-19 values in the control group.
Supplementary Fig. 28. Scatter plot illustrating the relationship between CRP and FGF-19 values in the control group.
Supplementary Fig. 29. Scatter plot illustrating the relationship between ESR and FGF-19 values in the control group.
Supplementary Fig. 30. Scatter plot illustrating the relationship between ALT and FGF-19 values in the control group.
Supplementary Fig. 31. Scatter plot illustrating the relationship between AST and FGF-19 values in the control group.
Supplementary Fig. 32. Scatter plot illustrating the relationship between GGT and FGF-19 values in the control group.
Supplementary Fig. 33. Scatter plot illustrating the relationship between calprotectin and FGF-19 values in the control group.
Supplementary Fig. 34. Scatter plot illustrating the relationship between PLT and CTGF values in the control group.
Supplementary Fig. 35. Scatter plot illustrating the relationship between CRP and CTGF values in the control group.
Supplementary Fig. 36. Scatter plot illustrating the relationship between ESR and CTGF values in the control group.
Supplementary Fig. 37. Scatter plot illustrating the relationship between ALT and CTGF values in the control group.
Supplementary Fig. 38. Scatter plot illustrating the relationship between AST and CTGF values in the control group.
Supplementary Fig. 39. Scatter plot illustrating the relationship between GGT and CTGF values in the control group.
Supplementary Fig. 40. Scatter plot illustrating the relationship between calprotectin and CTGF values in the control group.
Supplementary Table 1. Results of tests to check the assumptions.
Supplementary Table 2. Shapiro–Wilk test results for the study and control groups. All values were considered statistically significant at p < 0.05.
Supplementary Table 3. Correlations recalculated using the Kendall coefficient for elastography and laboratory test results in the study group.
Supplementary Table 4. Correlations recalculated using the Kendall coefficient for FIB-4 and laboratory test results in the study group.
Supplementary Table 5. Correlations recalculated using the Kendall coefficient for APRI and laboratory test results in the study group.
Supplementary Table 6. Correlations recalculated using the Kendall coefficient for elastography and laboratory test results in the control group.
Supplementary Table 7. Correlations recalculated using the Kendall coefficient for FIB-4 and laboratory test results in the control group.
Supplementary Table 8. Correlations recalculated using the Kendall coefficient for APRI and laboratory test results in the control group.
Data Availability Statement
The participants in this study did not provide written consent for their data to be shared publicly; therefore, due to the sensitive nature of the research, the supporting data are not available.
Consent for publication of personal information
Not applicable.
Use of AI and AI-assisted technologies
Not applicable.