


Abstract
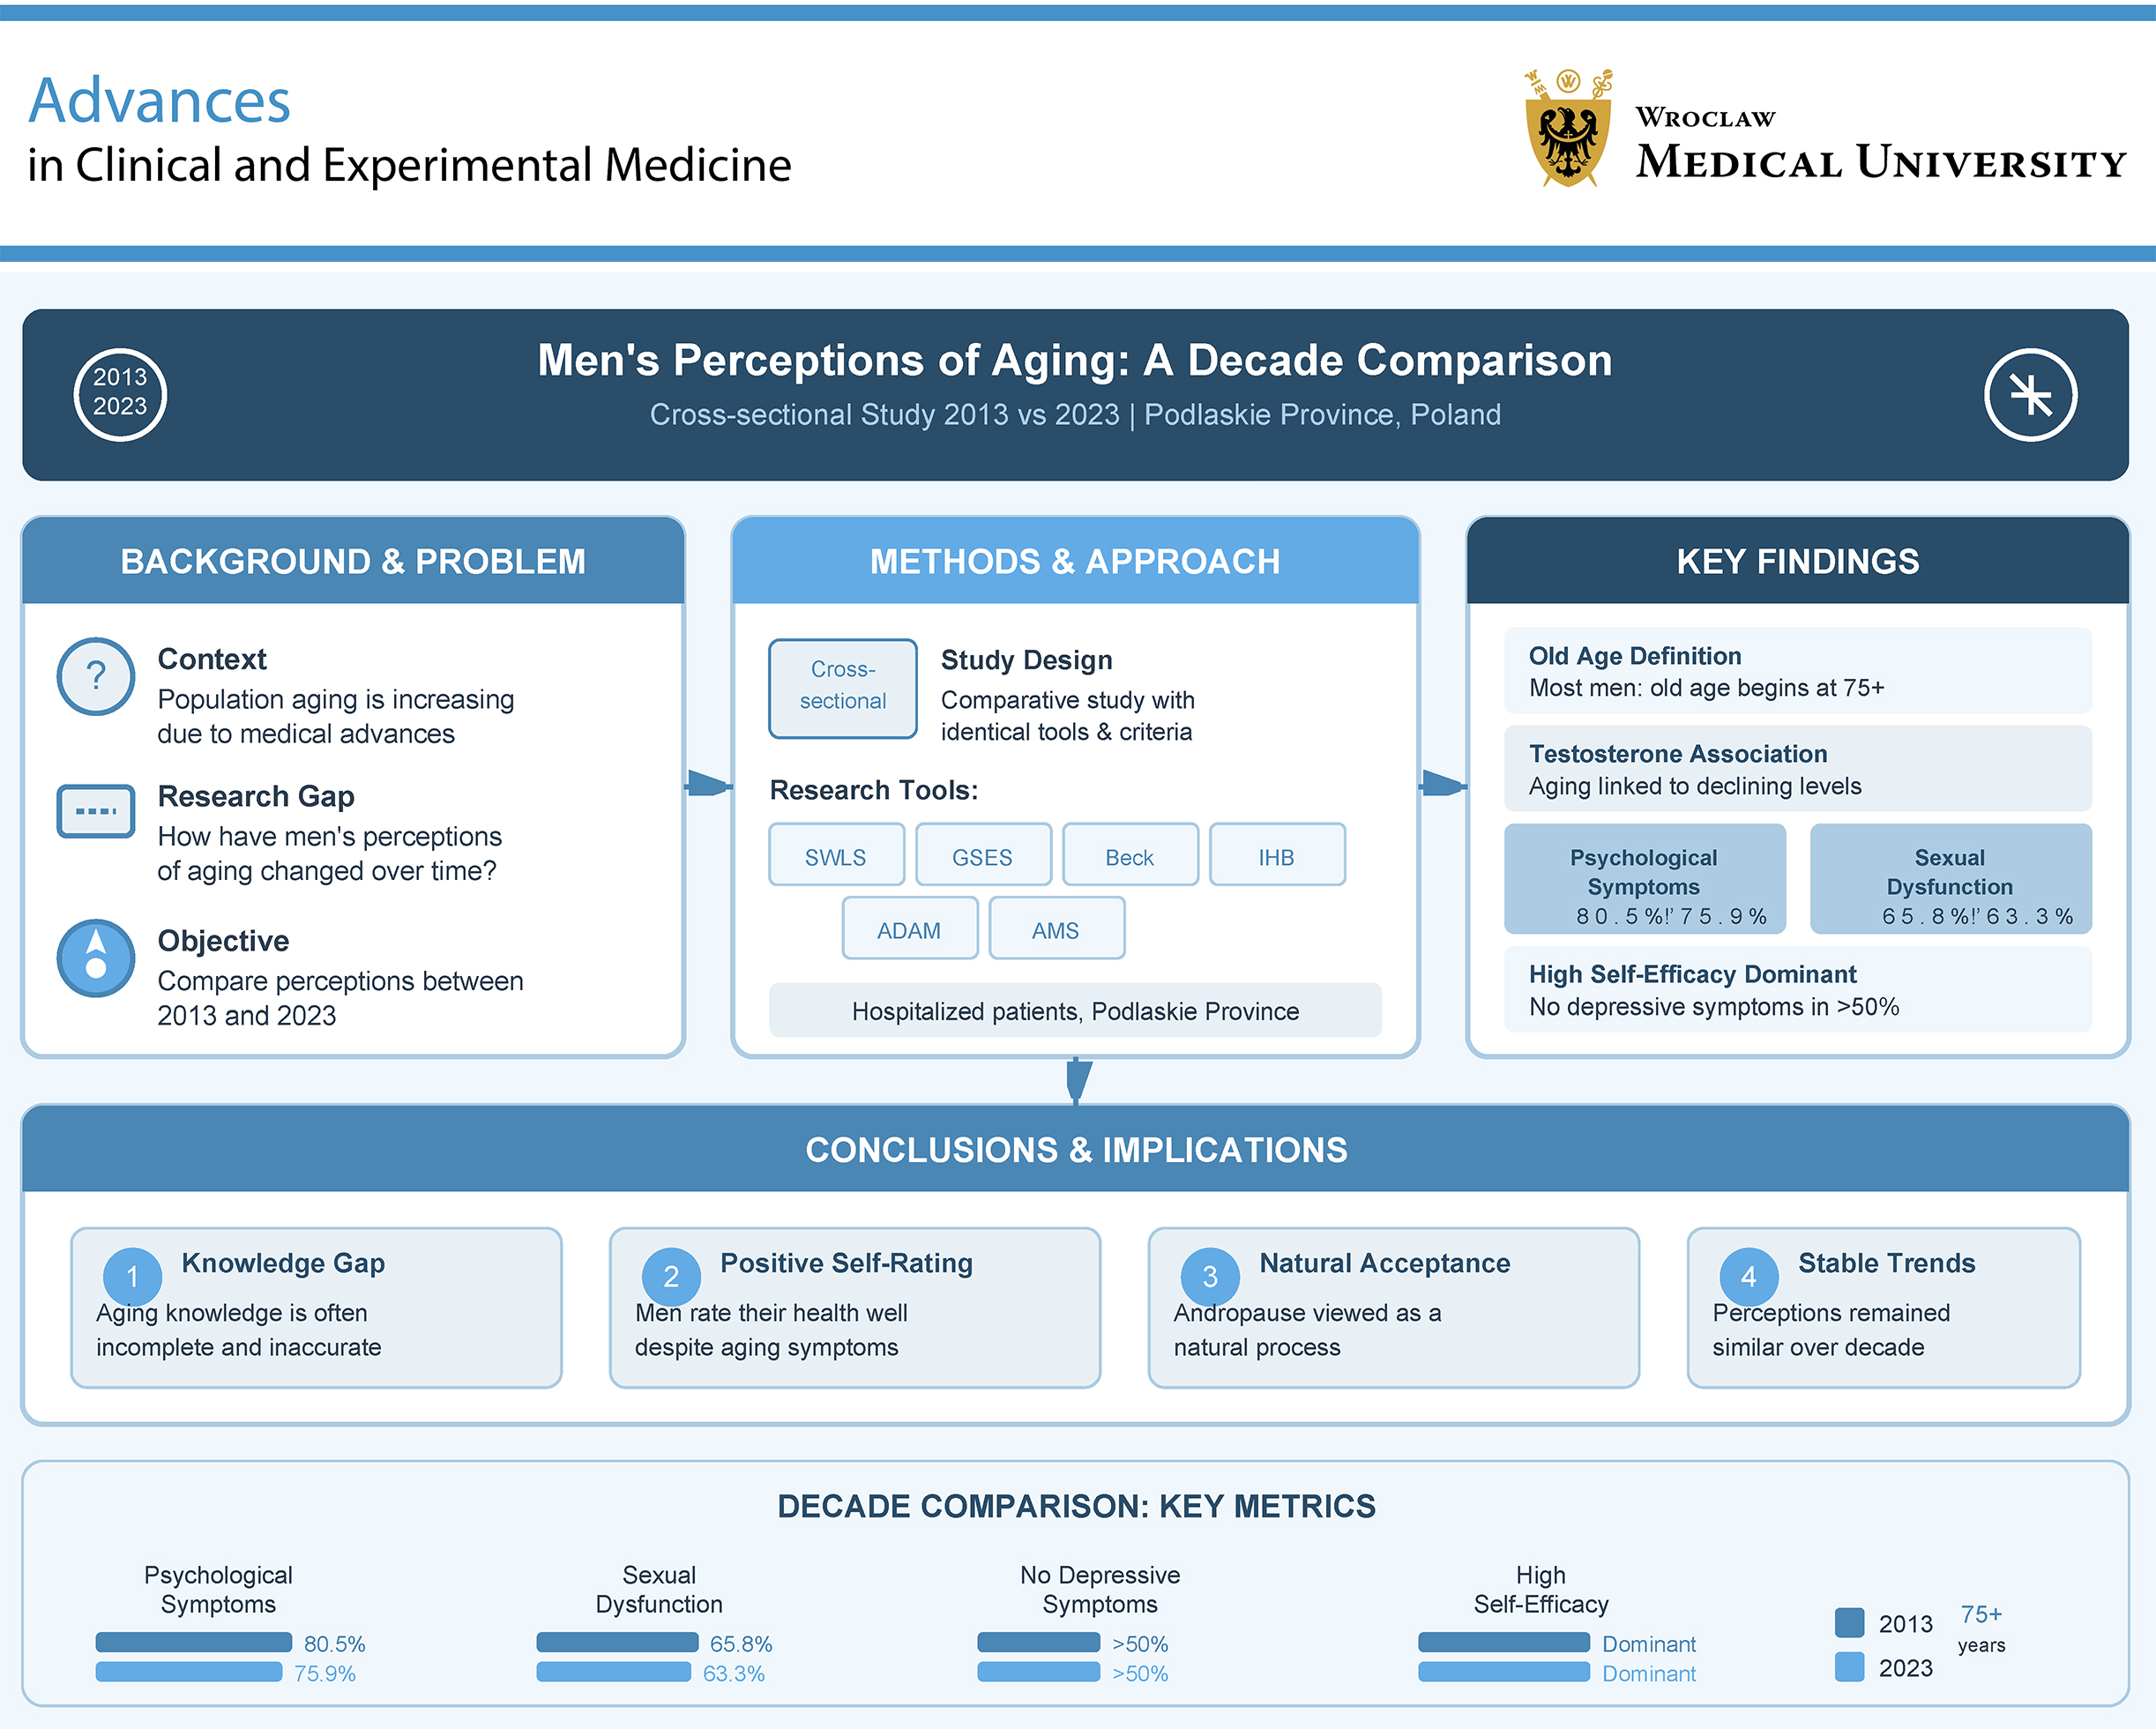
Background. Owing to medical advances and improved living conditions, life expectancy continues to increase. Consequently, population aging poses growing challenges for healthcare systems.
Objectives. The aim of this study was to assess whether men’s perceptions of aging have changed between 2013 and 2023.
Materials and methods. A cross-sectional comparative study was conducted in 2013 and 2023 using identical research tools and inclusion criteria. Participants were randomly selected from hospitalized patients in the Podlaskie Province, Poland. The following instruments were used: an original questionnaire, the Satisfaction with Life Scale (SWLS), the Generalised Self-Efficacy Scale (GSES), the Beck Depression Inventory (BDI), the Inventory of Health Behaviour (IHB), the Androgen Deficiency in Aging Male questionnaire (ADAM), and the Aging Males’ Symptoms Scale (AMS).
Results. Most respondents in both 2013 and 2023 associated old age with declining testosterone levels and considered it to begin after the age of 75. Men generally rated their health as good and regarded andropause as a natural process. Psychological symptoms of aging were reported by 80.5% of respondents in 2013 and 75.9% in 2023, while sexual dysfunction was reported by 65.8% and 63.3%, respectively. More than half of the respondents had no depressive symptoms according to the BDI. Men with high self-efficacy predominated in both study periods.
Conclusions. Respondents’ knowledge of the aging process remains incomplete and often inaccurate. Despite this, men generally rated their health positively and perceived andropause as a natural process. Psychological symptoms of aging and sexual dysfunction were reported by a substantial proportion of participants.
Key words: aging, aging male, andropause, quality of life, mental health
Background
As emphasized by Królikowska,1 population health can be assessed using various indicators and analyzed in relation to gender, both as a factor differentiating the health status of populations and as a key determinant of health inequalities between women and men. Within this framework, 2 main correlations can be distinguished: the 1st related to biological differences (sex) and the 2nd to sociocultural factors (gender). Health outcomes may improve when individual and group health behaviors, including risk-related behaviors, are less influenced by gender-related factors.
Medical advances and improved living conditions have led to increased life expectancy, making population aging a global issue. United Nations projections2 indicate that the proportion of children and young people in developing countries will decrease from approx. 33% in 2000 to 26% in 2025. In Europe, it is projected that by 2060, the population aged 65 and over will increase by around 12 percentage points, reaching 29.5% of the total population.3 In Poland, by 2035, individuals in the so-called “third age” are expected to account for approx. 23% of the population, increasing to as much as 34.5% in the 2nd half of the century. Poland is projected to become one of the 3 fastest-aging countries in the European Union (EU), with older adults comprising around 35% of the population by 2050.3 Therefore, measuring population health is crucial for several reasons.4 Population health measures provide essential information to assess and improve community health. Monitoring population health allows the identification of health problems within communities. It helps identify patterns, trends, and disparities related to diseases, risk factors, and social determinants of health. Data on population health inform policy development. Policymakers rely on this information to make informed decisions about resource allocation, preventive measures, and interventions. Shared measurement systems ensure accountability across various sectors, including public health, healthcare, and private entities. Integrating efforts to improve population health is more effective when everyone uses appropriate, standardized measures. Combined with epidemiology, population health data provides insights into disease patterns, risk factors, and health service utilization. These insights guide public health strategies and interventions.
Medical professionals have underestimated the issue of male aging and andropause. The concept of andropause remains relatively unfamiliar among both men and healthcare providers.5 The term is often used to describe a condition comparable to female menopause. From a biopsychosocial perspective, andropause refers to the aging process and the development of various disorders affecting multiple aspects of an individual’s functioning. Other terms, such as viropause, male menopause, or low testosterone syndrome, as well as acronyms such as ADAM (androgen deficiency in aging males), PEDAM (partial endocrine deficiency in aging males), and PADAM (partial androgen deficiency in aging males), have been used in the literature but have not gained widespread acceptance. While menopause in women is typically characterized by pronounced symptoms, andropause in men usually presents more subtly. However, these symptoms are not universal and may result from factors other than testosterone decline.
Falling testosterone levels lead to alterations in sexual and psychological functions and body composition. These changes comprise mood swings, depression, poor concentration and memory, anxiety and irritability, decreased libido, erectile dysfunction, reduced muscle mass and strength, loss of body hair, and osteoporosis.6, 7
Men’s perceptions of the aging process vary according to age.8 Diehl et al. investigated how self-perceptions of aging changed over time in middle-aged and older adults, following them for up to 21 years. The 3 dimensions included participants’ regarding physical losses, social losses, and ongoing development. The study revealed that, beginning around age 65, participants experienced increased perceptions of physical and social losses, which became more pronounced with advancing age. Participants around the age of 55 began to report fewer perceptions of ongoing development, with a steeper decline observed after age 70.
Existing research on male aging and andropause is inconsistent.9 Despite extensive investigation of the male–female health paradox, it remains unclear whether behavioral factors or biological and social differences primarily account for gender disparities in health. Andropause is commonly used to describe age-related declines in androgen levels, vitality, and reproductive function in men. However, this concept is not universally accepted, as it is difficult to distinguish the effects of aging from other factors such as stress, illness, or medication use. Some researchers question the validity of the concept, whereas others recognize subtle changes in sexual function, cognitive performance, fatigue, and body composition in older men. Testosterone replacement therapy may be associated with adverse effects and should be used with caution. Although it is not intended to treat conditions such as obesity, diabetes, or physical inactivity, identifying and treating hypogonadism may support improvements in overall health and lifestyle. To our knowledge, there is a lack of long-term research on how men in Poland perceive and understand andropause and aging.
Objectives
This study aimed to examine whether men’s perceptions of aging have changed between 2013 and 2023. The analysis included biopsychosocial aspects of aging, such as life satisfaction, self-efficacy, risk of depression, health-related behaviors, quality of life, and aging symptoms.
The following hypotheses were formulated:
Hypothesis 1: There is a significant difference in the perception of aging between men in 2013 and 2023, with men in 2023 demonstrating a more positive outlook on aging.
Hypothesis 2: The prevalence of depressive symptoms is higher among men experiencing andropause in 2023 compared to 2013.
Hypothesis 3: Knowledge and awareness of andropause have increased significantly among men between 2013 and 2023.
Materials and methods
Study design and population
This cross-sectional comparative study was conducted in 2013 and 2023 and included 308 male participants in 2013 and 349 in 2023. A purposive sampling method was applied. Sample size was estimated to ensure a 95% confidence level with a margin of error of ±5%, indicating that at least 172 participants were required. Identical research tools and inclusion criteria were used in both study periods. Participants were purposefully selected from patients hospitalized at the Teaching Hospital of the Medical University of Bialystok (Poland) and the Provincial Specialist Hospital in Biała Podlaska (Poland), as well as from students at the Pope John Paul II State School of Higher Education in Biała Podlaska, the Medical University of Bialystok, and the University of Medical Sciences in Bialystok. Questionnaires were administered to participants by the study authors. Inclusion criteria were: male sex, age 18–90 years, willingness to provide informed consent, and ability to complete the questionnaires. Exclusion criteria included age below 18 or above 90 years, lack of informed consent, and inability to complete the questionnaires.
All methods were carried out in accordance with relevant guidelines and regulations. Ethical approval was obtained from the Bioethics Committee of the Medical University of Bialystok for both study periods: approval No. R-I-022/55/2012 (2013) and approval No. APK.002.515.2021 (2023). Participation in the survey was voluntary, and all participants could withdraw from the study at any time without any obligation to continue. No personally identifiable data were collected.
In 2013, 340 questionnaires were distributed, and 308 were completed, resulting in a response rate of 90%. In 2023, 370 questionnaires were distributed, and 349 were completed, yielding a response rate of 94%. Significant differences were observed between the 2013 and 2023 groups in terms of age, residence, household composition, social and living conditions, and education. No significant differences were found between the groups regarding marital status. Details are presented in Table 1.
The COVID-19 pandemic had a profound impact on the psychological, social, and physical environment.10 Lockdowns, social distancing, and restrictions on gatherings substantially increased feelings of loneliness. Among older men, this isolation may have contributed to increased symptoms of depression. Chronic stress and uncertainty are well-established risk factors for depressive disorders. Health anxiety was one of the most significant psychological features of the COVID-19 pandemic. This period contributed to the exacerbation of both mental and physical health conditions.
Data collection
The study used a self-developed questionnaire designed for men. It covered topics such as perceptions of old age and its potential advantages, perception of one’s chronological age, willingness to live to old age, self-assessment of health, and frequency of medical care. The questionnaire also included items on symptoms associated with aging (psychological, somatic-vegetative, sexual, and cognitive), knowledge of hormonal changes during male aging, opinions on hormone therapy and its effects, willingness to undergo such therapy, and awareness of and sources of information about andropause. Additional items addressed the perceived usefulness of this information, interest in expanding knowledge about andropause, preferred educational sources, and characteristics associated with men experiencing andropause. All scales used in the study have been validated in Poland.
Instruments
SWLS – The Satisfaction with Life Scale
It was published by Diener, Emmons, Larsen, and Griffin (and in the Polish version by Juczyński). The SWLS is a 5-item, 7-point Likert scale that assesses global cognitive judgments of one’s life satisfaction as a single factor.11 As opposed to the emotional or affective component, the scale was developed to represent the judgment or cognitive component and thus does not measure positive or negative affect. The SWLS is stable yet sensitive enough to detect changes in life satisfaction during psychotherapy or in response to significant life events. The reliability coefficient (Cronbach’s α) of the SWLS is 0.81, and the consistency index is 0.86.
Respondents rate the extent to which each statement relates to their life, where: 1 – strongly disagree, 2 – disagree, 3 – slightly disagree, 4 – neither agree nor disagree, 5 – slightly agree, 6 – agree, and 7 – strongly agree. The scores are summed, and the overall score indicates the level of life satisfaction. Scoring ranges from 5 to 35, whereby higher scores indicate greater life satisfaction: a score of 5–9 – extremely dissatisfied with life, a score of 10–14 – very dissatisfied with life, a score of 15–19 – slightly dissatisfied with life, a score of 20 – neither satisfied nor dissatisfied with life, a score of 21–25 – slightly satisfied with life, a score of 26–30 – very satisfied with life, and a score of 31–35 – extremely satisfied with life.11
GSES – Standardized Generalized Self-Efficacy Scale
The scale was developed by Schwarzer, Jerusalem, and Juczyński.11 Self-efficacy is defined as the ability to set challenging goals, commit to difficult tasks, and strive to achieve them, and is considered an important predictor of behavior change. The scale demonstrates high reliability, with a Cronbach’s α coefficient of 0.85. It consists of items rated on a 4-point Likert scale: 1 – not at all true, 2 – hardly true, 3 – moderately true, and 4 – exactly true. Scores range from 10 to 40, with higher scores indicating greater self-efficacy.11
Standardized Beck Depression Inventory
The Beck Depression Inventory (BDI) is one of the most widely used self-report scales for assessing depression worldwide. Since its development in 1961, it has been employed in over 14,000 empirical studies. The advantages of the BDI include good internal consistency, sensitivity to change, broad construct validity, the ability to differentiate between depressed and non-depressed individuals, and cross-cultural reliability. Its main limitations include the lack of representative norms, the potential subjectivity of interpretation, and concerns regarding its factorial validity. Cronbach’s α coefficient was 0.91 in the overall sample and 0.93 among patients with depression. Scores are interpreted as follows: 0–11 – no depression; 12–26 – mild depression; 27–49 – moderate depression; and 50–63 – severe depression.12
IHB – Standardized Inventory of Health Behavior
The instrument was published by Juczyński. The instrument was developed based on existing literature relating to lifestyle modifications. A high score on the scale indicates poor health behavior. In other words, the higher the scale score, the poorer the health behavior, and vice versa. The IHB internal consistency, measured with Cronbach’s α, is 0.85 for the whole inventory, while its 4 subscales range from 0.60 to 0.65. Respondents indicated how often they performed specific health-related activities, rating each behavior listed in the inventory on a 5-point scale: 1 – almost never, 2 – rarely, 3 – occasionally, 4 – often, and 5 – almost always. The numerical values marked by the respondents were summed to obtain a score between 24 and 120. The higher the score obtained by the respondent, the higher the intensity of their declared health behavior.11
The standardized Morley Questionnaire (Androgen Deficiency in the Aging Male – ADAM)
The ADAM questionnaire consists of 10 “yes or no” questions concerning symptoms of androgen deficiency. These “yes or no” questions, although effective in identifying symptoms associated with androgen deficiency, provide no information about the severity of these symptoms. Thus, there is no simple, noninvasive way to monitor treatment response using this tool alone unless symptoms completely resolve. It does not provide a clear answer as to whether the patient suffers from andropause syndrome. However, affirmative answers to questions 1–7 or to 3 other questions suggest that the complaints result from hormonal disorders.13, 14
AMS – The Aging Males’ Symptoms Scale – Standardized Aging Male Symptoms Scale
The Polish version was provided by Heinemann. The scale assesses symptoms related to male physiological and psychological aging. It contains 17 different symptoms typical of the andropause period. Respondents assess whether each symptom has occurred in themselves using a scale from 1 to 5, where 1 – no symptom, 2 – mild, 3 – moderate, 4 – severe, and 5 – extreme. Respondents may also report other symptoms not included in the scale. The scale is divided into 3 subscales corresponding to different groups of disorders: somatic, psychological, and sexual. Somatic symptoms include general deterioration of health, muscle and joint pain, sleep problems, fatigue, exhaustion, and decreased strength: no or slight symptoms are defined by scores less than or equal to 8; mild symptoms by scores of 9–12; moderate by scores of 13–18; and severe by scores of 19 and above. Psychological symptoms include anxiety, nervousness, irritability, depression, and burnout: no or slight symptoms are defined by scores less than or equal to 5; mild by scores of 6–8; moderate by scores of 9–11; and severe by scores of 12 and above. Sexual symptoms include decreased ability to perform sexually, reduced number of morning erections, and decreased libido; this group also includes reduced beard growth: no or minor symptoms are defined by scores less than or equal to 5; mild by scores of 6–7; moderate by scores of 8–10; and severe by scores of 11 or more.15, 16
Statistical analyses
The statistical analysis was conducted using Statistica v. 13 PL (StatSoft Poland, Cracow, Poland). The normality of the data was assessed using the Kolmogorov–Smirnov test. The data were not normally distributed; therefore, the Mann–Whitney U test was used to compare numeric data, and Pearson’s χ2 test with Yates’ correction was used to compare percentages. Fisher’s exact test was applied when any cell had an expected count of 5 or fewer. A significance level of p < 0.05 was considered statistically significant.
The relationship between categorical variables was examined using contingency table analysis. To determine whether an observed association between the variables was statistically significant, Pearson’s χ2 test of independence was employed. A p < 0.05 was considered indicative of a significant association. We used 2 × 2, 3 × 2, 4 × 2, and 5 × 2 contingency tables.
Results
The evaluated groups showed significant differences in attitudes toward old age, beliefs about successful aging, and self-identification with chronological age. Details are presented in Table 2.
In 2013, men reported significantly (p < 0.001) more frequent mental symptoms, such as hyperactivity (16.9%), nervousness and anger (37.3%), mood swings and irritability (36.7%), and discouragement (36.7%), than in 2023. Moreover, in 2023, respondents reported significantly (p < 0.001) more frequent depression (67.0%), inability to experience joy (39.8%), lack of vitality (39.5%), and a sense of “emptiness” (38.7%) than in 2013. In 2013, men reported significantly (p < 0.001) more frequent physical symptoms, such as muscular pain (42.2%), excessive sweating (20.5%), and palpitations (38.6%) than in 2023. In 2023, regarding physical symptoms, respondents reported significantly higher (p < 0.001) rates of weakness (60.5%), fatigue (47.3%), and decreased libido (90%) than in 2013. Details are presented in Table 3.
Significant (p < 0.001) differences between the groups were found in respondents’ self-rated health assessments. Also, regarding the frequency of seeking medical care, we noted some differences. More often, respondents sought medical care “when needed”. Details are presented in Table 4.
In 2023, respondents were more likely (87.7%) to say they knew what “andropause” meant than in 2013. Significant (p < 0.001) differences were found between the groups regarding andropause. In 2023, most men (58.7%) reported that andropause was natural significantly more often (p < 0.001) than in 2013. In 2013, men had significantly (p < 0.001) more difficulty expressing their opinions on andropause. In 2023, more respondents described men after andropause as sensitive (27.8%) and professionally active (23.5%). In 2023, men more frequently described post-andropause men as sexually inactive (42.3%) and unfit (35.8%) compared to 2013. Details are presented in Table 5.
Significant differences (p < 0.001) were observed between the groups regarding the perceived benefits of hormone therapy. In 2013, most respondents (58.8%) reported that they were unsure whether hormone therapy was beneficial during andropause (p < 0.001). In 2023, men reported significantly more frequent positive effects of hormone therapy (p < 0.001), including improved sleep (44.7%), enhanced erections (42.1%), and reduced fat mass (54.7%). Details are presented in Table 6.
Study respondents reported similar levels of life satisfaction. In 2023, they had a much higher sense of self-efficacy than men did in 2013. Beck Depression Inventory data indicate that respondents in 2013 had significantly lower scores than those in 2023 (p < 0.001), with no signs of depression. In 2013, respondents’ health behavior levels were significantly higher (p < 0.01) than those in 2023. In 2023, respondents reported a significantly higher frequency of andropause symptoms (p < 0.001) than in 2013, as measured using the Morley scale. Participants experienced physical and mental symptoms and sexual signs of andropause at a similar level in 2013 and 2023 (Table 7).
Respondents reported that the press (15.6% in 2013) and the Internet (26.4% in 2023) were the primary sources of information about andropause (p < 0.001). More than half of the participants (53.6%) reported greater interest in learning more about andropause in 2023 than in 2013 (p < 0.001). In 2013, 57.7% of respondents believed that physicians should educate all men about andropause (p < 0.01). By 2023, 69.6% suggested this role for psychologists. Significant (p < 0.001) differences between the groups were found regarding willingness to learn more about andropause. Details are presented in Table 8.
Discussion
Population aging impacts healthcare systems, social structures, and the economy. Increased longevity leads to greater demand for healthcare services, as older individuals often manage multiple chronic conditions requiring ongoing medical care. Consequently, healthcare systems must allocate resources effectively across hospital funding, long-term care, and specialized geriatric services to meet these demands. The healthcare workforce also faces challenges in addressing the complex needs of older patients.17, 18 Additionally, social issues such as isolation and loneliness can become more prevalent among older adults, potentially contributing to mental health problems.19
Andropause is a natural part of the aging process in men, yet public awareness of the condition remains relatively low. Consistent with this general observation, the current study found that participating men demonstrated limited knowledge about andropause in both 2013 and 2023. Consistent with previous research,20, 21, 22, 23 our results show low knowledge about male andropause. However, knowledge levels vary internationally. For example, in an Iranian study,20 73.6% of men reported andropause symptoms, while 73.6% reported minimal understanding of the condition. That study20 also found that knowledge of andropause correlated with education, occupation, and income, and that symptom prevalence was significantly associated with body mass index (BMI) and occupation.
Andropause awareness differs significantly across populations. A Nigerian study21 found that nearly half (45.1%) of respondents lacked knowledge of andropause, despite 96% experiencing typical physical symptoms, which reportedly peaked between the ages of 54 and 62. Conversely, knowledge was extremely low among males in India,22 where only 2.2% knew the term “andropause” and 11.4% were aware of its treatment. In Sweden,23 over half (65.4%) had heard of the “male climacteric”, associating it mainly with reduced libido and erectile function. Showing greater familiarity, 79.4% of Chinese male respondents in Hong Kong24 recognized the term “andropause”.
In terms of mental symptoms associated with old age, in 2013 the respondents mentioned nervousness and anger, whereas in 2023 they reported depression. Our findings are consistent with previous reports.24, 25 Chinese males reported irritability more often (72.5%). Regarding physical symptoms of andropause, they reported loss of energy (66.5%) and loss of libido (60.7%). In the present study, males reported physical symptoms more often in 2013, including joint pain, and in 2023, memory impairment.
According to Ashat et al.,22 52% of men aged 40–70 experience some form of sexual dysfunction. In 2013, 46% of respondents and 91% in 2023 reported reduced libido. Similarly, a Chinese study25 reported that 60.7% of respondents associated loss of libido with andropause.
Cognitive impairment was indicated in both studies, while other reported symptoms of old age included hypertension in 2013 and hearing impairment in 2023. The study found that men rated their health positively more often in 2023 than in 2013 (87.1% vs 50.6%). In comparison, a Polish study showed that men attending the University of the Third Age reported lower health ratings.
The literature suggests that optimism and life satisfaction positively influence health outcomes, as individuals with an optimistic outlook are more likely to engage in preventive healthcare measures, effectively manage illnesses, and recover more quickly. A study conducted by the Centre for Public Opinion Research,26 involving a representative sample of 1,018 adult residents of Poland, revealed that 75% of participants were satisfied with their lives. Men reported higher satisfaction levels than women. Similarly, the current study demonstrated that respondents in both 2013 and 2023 reported considerable life satisfaction.
Based on data obtained by Pryczek and Bielawska-Batorowicz,27 over 90% of respondents reported that andropause symptoms vary between men and do not prevent them from remaining professionally active. They believed that the condition is natural and does not require hospitalization. Additionally, a Chinese study24 found that 88.2% of respondents reported that andropause is a natural part of the aging process. Similarly, in our study, conducted in 2013 and 2023, respondents considered andropause a natural phenomenon.
Declining male hormone levels have been associated with changes such as depression, loss of libido, sexual dysfunction, and alterations in body composition. However, healthcare professionals29 reported infrequent inquiries from patients regarding low testosterone levels. In the current study, a significant proportion of men in 2013 and 2023 reported a correlation between advancing age and decreased testosterone levels (76.6% vs 75.1%). Testosterone replacement therapy is one of the key issues in the treatment of men with andropause28.
The AMS and Morley scales are commonly used to assess male reproductive health and andropause symptoms. Our study is consistent with previous reports based on the AMS and Morley scales.29, 30, 31, 32 Furthermore, Jankowska et al.32 found that age and social position are major determinants of symptom intensity in aging men, as measured using the AMS scale in Poland. Age is a significant determinant affecting the severity of depressive symptoms in male populations.33, 34, 35 Our study found that depression rates and risks were moderate. In a study conducted in China, the incidence of depression was 14%.35 In Turkey, it was 38.7%.36 In an Iranian study,37 there was a significant association between andropause and sexual quality of life among older men.
The stronger the sense of self-efficacy and the associated expectations, the greater the confidence in one’s ability to achieve positive outcomes. The study by Byra38 found that men had higher levels of self-efficacy than women. Our study also confirmed this, as men with high self-efficacy predominated in both 2013 and 2023.
In the context under discussion, it seems important to analyze men’s level of knowledge about aging and the sources of information on this topic. In our study, the primary sources of knowledge about andropause were the media and the Internet. In contrast, according to Yan’s study,24 the main source of information on andropause was the mass media (76.4%), followed by doctors and healthcare providers (10.8%). However, the Internet was the least common source of information (1.0%).
There is limited research in the Polish literature on men’s views of aging, their awareness of its symptoms, and related education. This gap can foster biases and unhealthy behaviors that may accelerate aging. Further research into various aspects of male aging, extending beyond the symptomatology of this period, is worthwhile. Broadening this knowledge can help break stereotypes, encourage healthy behaviors among men, and lead to the development of effective health education programs tailored to them. Physicians and nurses should increase their involvement in educating men about andropause. Currently, andropause screening is not routinely used in clinical practice. We suggest that screening older men for andropause symptoms is important. Such screening can contribute to earlier detection of symptoms associated with andropause, such as fatigue, depression, decreased libido, and other physical and emotional changes.
Limitations of the study
The study groups of men in 2013 and 2023 were relatively small, which may have limited the ability to draw more generalizable conclusions. The participants in this study were not randomly selected, which can lead to a biased sample that is not representative of the studied population. The most significant limitation of not randomly selecting participants is that the results cannot be reliably generalized to the larger population. Selection bias is the most critical issue. When participants are not chosen randomly, a systematic error is introduced because some individuals have a higher or lower chance of being selected. This results in a skewed sample that does not accurately represent the diversity of the target population. Because the sample is not representative, the study’s findings have low external validity. This means that we cannot confidently claim that the conclusions drawn from the sample are true for the entire population. The results are only valid for the specific, and likely biased, group of people who participated.
Conclusions
This study compared men’s perceptions of andropause using data from 2013 and 2023. Over the 10-year period, knowledge of andropause among men remained limited and did not change significantly between the 2 survey years. While the relatively small sample size may limit the generalizability of the findings, a key strength of the study is the use of validated questionnaires administered to respondents from the same geographical area in both 2013 and 2023.
Supplementary data
The supplementary materials are available at https://doi.org/10.5281/zenodo.19554902. The package contains the following files:
Supplementary Table 1. Health assessment of the respondents. This table provides a comparative analysis of respondents self-reported health status and the frequency of seeking medical care between 2013 and 2023.
Supplementary Table 2. Respondents opinions on andropause. This table illustrates changes in the awareness of andropause and the evolving perceptions regarding its symptoms and psychosocial impact on men over a 10-year period.
Supplementary Table 3. Shifting opinions on the benefits of hormone therapy and the increasing willingness of men to undergo such treatment between 2013 and 2023.
Data from 2013 – all the results from the surveys conducted in 2013.
Data from 2023 – all the results from the surveys conducted in 2023.
Data distribution.
Data Availability Statement
The datasets supporting the findings of the current study are openly available in Figshare at https://figshare.com/s/7dd1e59cbb300057d5ad.
Consent for publication of personal information
Not applicable.
Use of AI and AI-assisted technologies
Not applicable.