


Abstract
Background. Several studies have reported the presence of Epstein–Barr virus (EBV) in prostate carcinoma tissues and have investigated how EBV might contribute to prostate cancer (PCa) development. To the best of our knowledge, no comprehensive systematic review and meta-analysis have been performed to: 1) estimate the pooled prevalence of EBV in PCa, particularly in samples with high and low Gleason scores; and 2) examine the association between EBV and PCa aggressiveness, measured using high-grade and/or Gleason scores.
Objectives. This study aimed to achieve 2 primary objectives: 1) to estimate the pooled prevalence of EBV in PCa; and 2) to determine the association between EBV infection and cancer aggressiveness, specifically in relation to moderate-to-high Gleason scores (7 and above).
Materials and methods. PubMed, Embase, and Google Scholar were systematically searched for relevant observational studies on EBV and PCa from database inception through December 31, 2024. The quality of the studies was assessed using the JBI criteria based on study design. A meta-analysis was conducted using 9 and 4 studies, respectively, to estimate the pooled EBV prevalence and the association between EBV infection and Gleason scores, along with 95% confidence and prediction intervals.
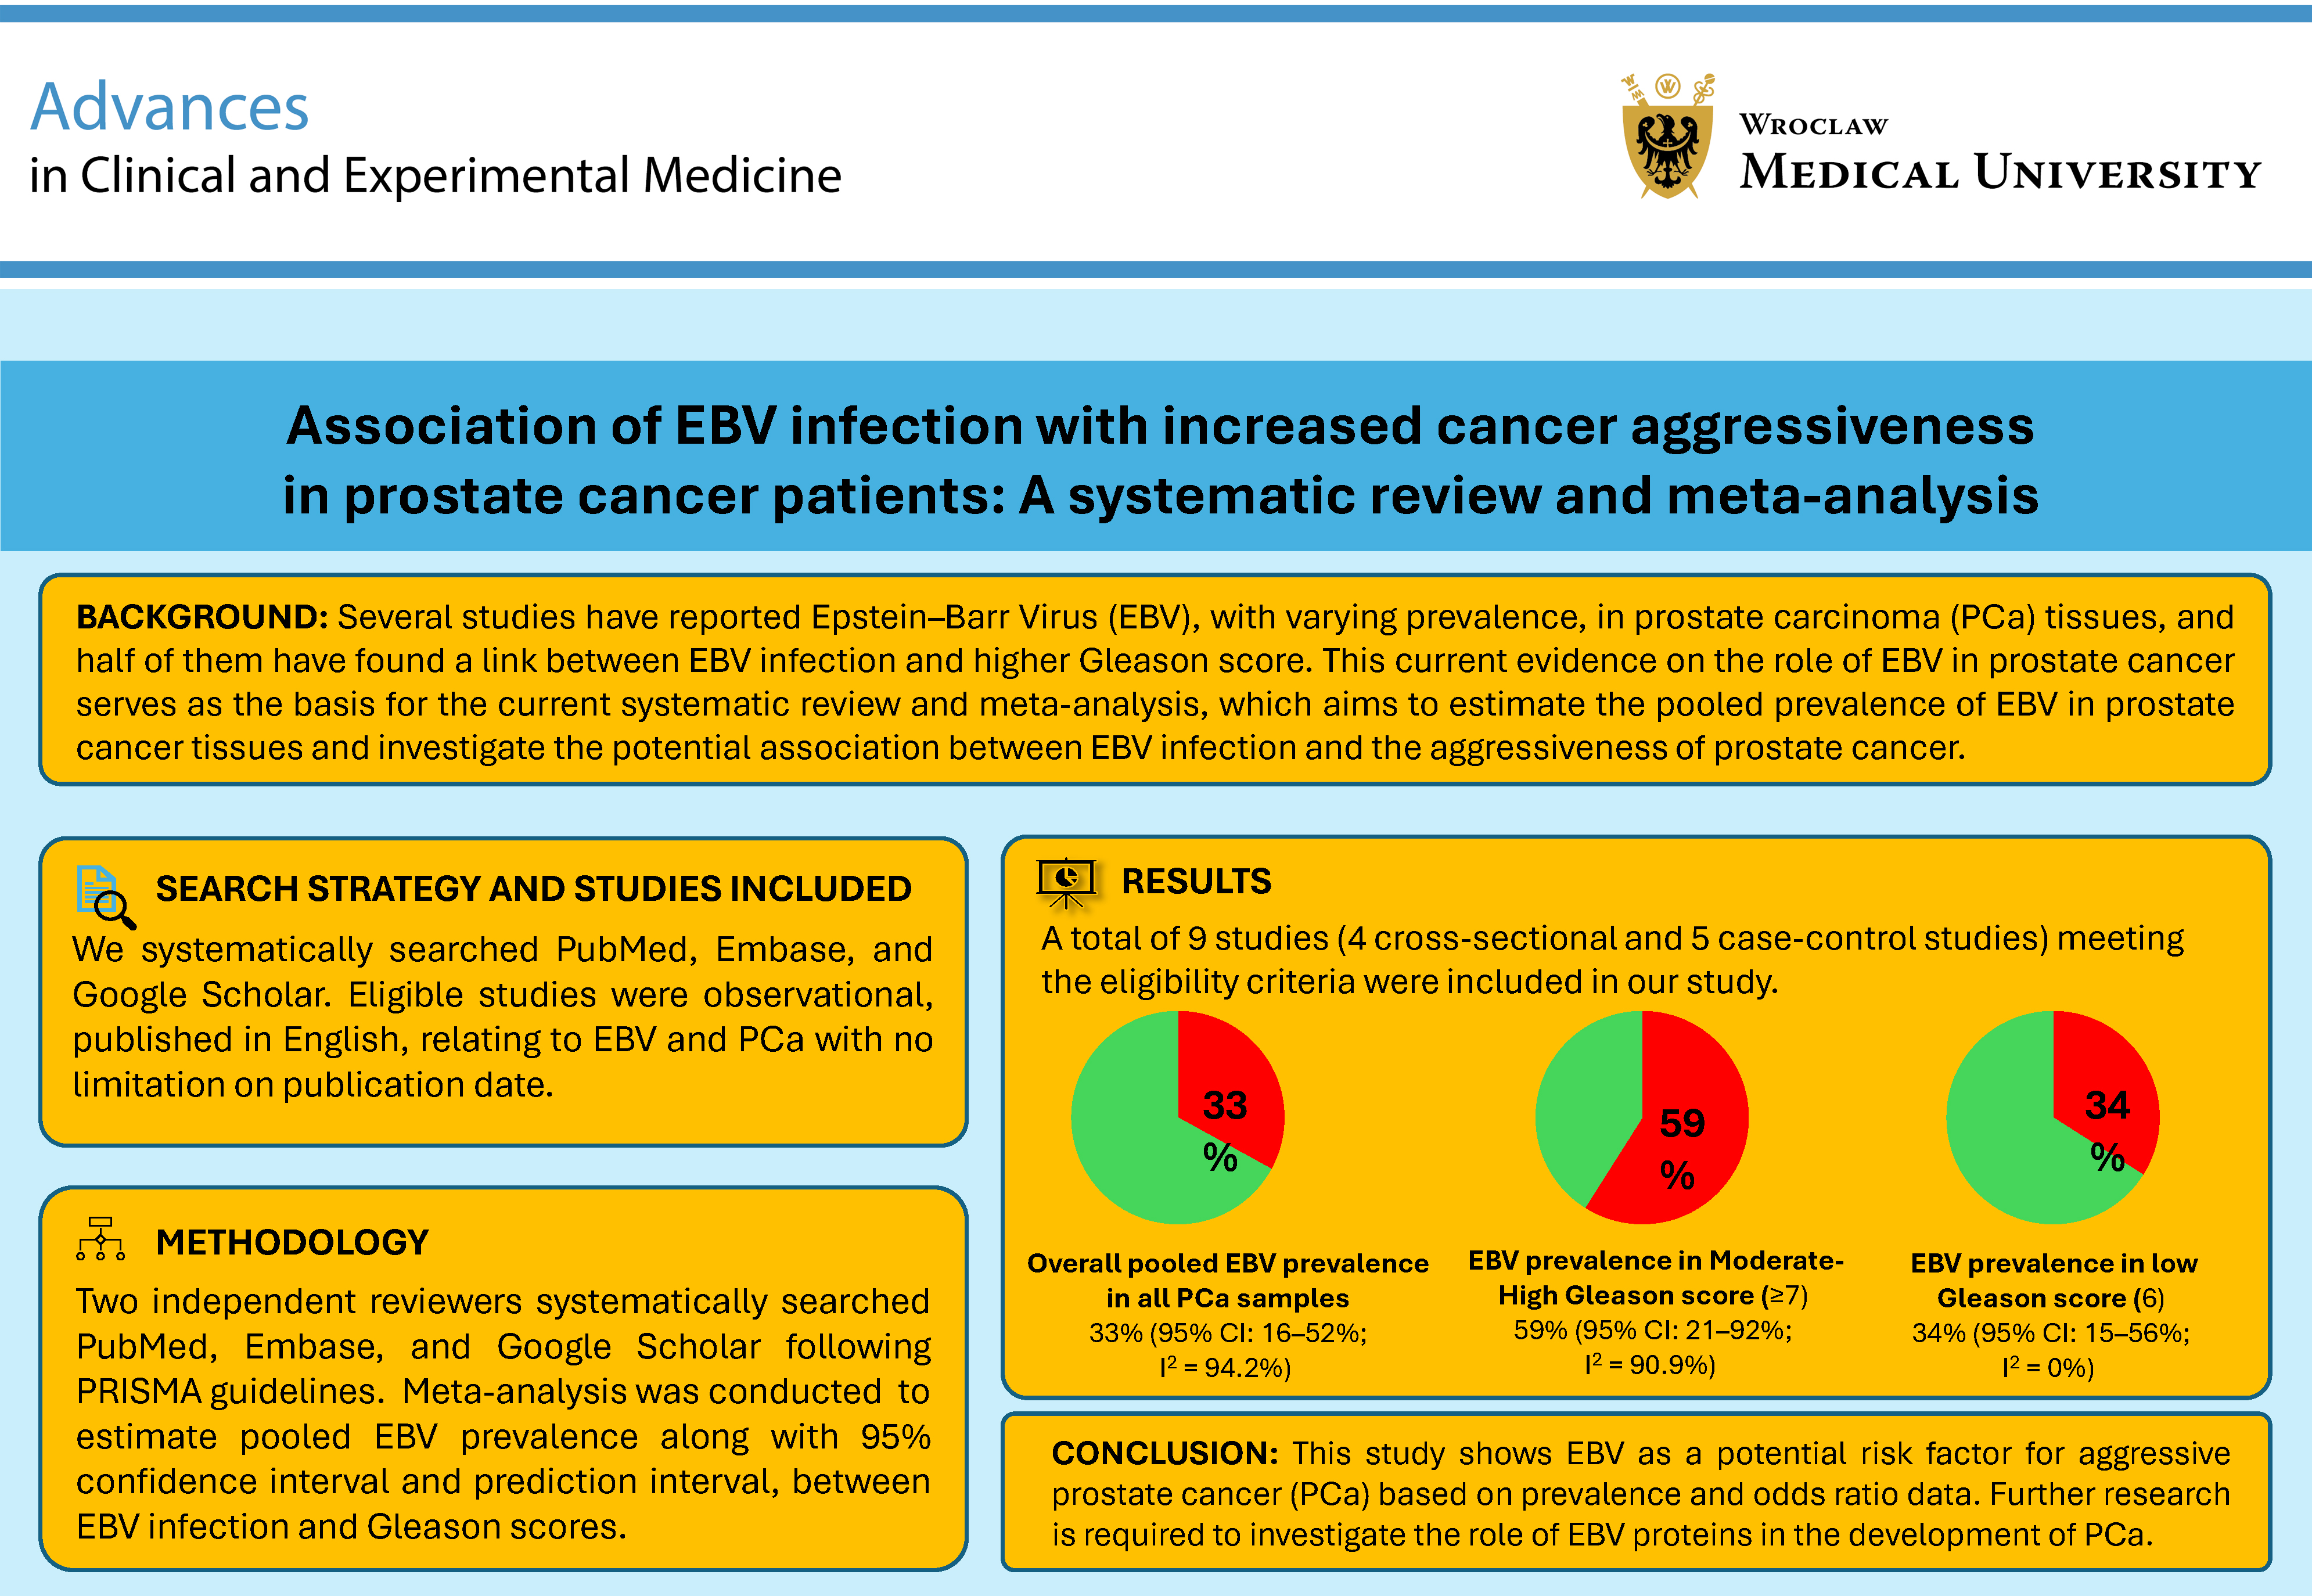
Results. A total of 9 studies were included in the analysis. The pooled EBV prevalence among 927 PCa samples was estimated at 33% (95% confidence interval (95% CI): 16–52%; I2 = 94.17%), while EBV prevalence in PCa samples with moderate-to-high (≥7) and low (6) Gleason scores was 59% (95% CI: 21–92%; I2 = 90.86%) and 34% (95% CI: 15–56%; I2 = 0.00%), respectively. Similarly, EBV presence in PCa samples was associated with increased odds of moderate-to-high Gleason scores (odds ratio (OR) = 2.38, 95% CI: 1.82–3.13, I2 = 0.00%, p = 0.002).
Conclusions. This study highlights EBV as a possible risk factor for aggressive prostate cancer (PCa). Additional research is necessary to explore how EBV proteins contribute to PCa development.
Key words: prostate cancer, Epstein–Barr virus, Gleason score, cancer aggressiveness
Introduction
Globally, prostate cancer (PCa) ranks as the 2nd most frequently diagnosed cancer and the 5th leading cause of death among men aged 55–65 years.1, 2, 3 In 2020, it accounted for approx. 43% of all cancers diagnosed in men, alongside lung and colorectal cancers.4 Based on GLOBOCAN 2020 data, PCa accounted for about 1.4 million new male cancer cases, representing 15% of all cancers diagnosed in men.5
To support prognostic and treatment decisions, the International Society of Urological Pathology (ISUP) and the World Health Organization (WHO) adopted the Gleason grading system, combined with serum prostate-specific antigen (PSA) levels, as the standard method for assessing prostate adenocarcinoma.6, 7, 8 The Gleason grading system is based on histological tissue patterns, ranging from Gleason 1 to Gleason 5, with Gleason 1 indicating the most differentiated histopathological pattern and a favorable prognosis, while Gleason 5 signifies the least differentiated tumor and a poor prognosis.9
A typical Gleason score consists of 2 numbers – the primary and secondary grades – assigned to different regions of the tumor. These 2 numbers are combined to produce a final score between 6 and 10. For example, a score of 3 + 3 = 6 means the tumor is entirely composed of grade 3 features, while a score of 5 + 5 = 10 indicates the tumor is entirely grade 5.9
The oncogenesis of PCa can be attributed to various genetic, environmental, and acquired factors. Several viruses have been demonstrated to infect prostate tissue, including cytomegalovirus (CMV), herpes simplex virus 2 (HSV-2), human papillomavirus (HPV), Kaposi’s sarcoma-associated herpesvirus (KSHV), and Epstein–Barr virus (EBV), which are notably associated with the progression of PCa.10, 11, 12
Several studies have reported varying prevalence rates of EBV in prostate carcinoma tissues and have investigated how EBV might contribute to PCa development. Additionally, analysis of the EBV latency profile has shown that EBV exhibits an “II/III-like” latency pattern in PCa tissues.13
Similarly, other studies examining the link between EBV and PCa have found that patients with a history of infectious mononucleosis (caused by EBV) exhibit a significant trend toward an increased risk of developing PCa.14 Furthermore, EBV infection- and latency-related gene expression has been associated with the survival of precancerous cells with anti-apoptotic properties, which may promote PCa progression.14, 15
One study analyzing PCa tissues with and without EBV revealed significantly higher primary and total Gleason scores in tissues infected with EBV.13
Objectives
To the best of our knowledge, no comprehensive systematic review and meta-analysis have been conducted to: 1) estimate the pooled prevalence of EBV in PCa, particularly in samples with high and low Gleason scores; and 2) examine the relationship between EBV infection and PCa aggressiveness, assessed through high-grade and/or Gleason scores. An earlier study by Jafari-Sales et al.16 examined the presence of EBV in PCa; however, its scope was limited, focusing only on the percentage of EBV-positive PCa samples and the prevalence of EBV in PCa by region. It did not evaluate the relationship between EBV status and clinicopathological parameters, including tumor grade.
In contrast, the present study applies formal meta-analytic methods to quantify the pooled prevalence of EBV in PCa and to evaluate its association with Gleason grade as a marker of tumor aggressiveness.
Methodology
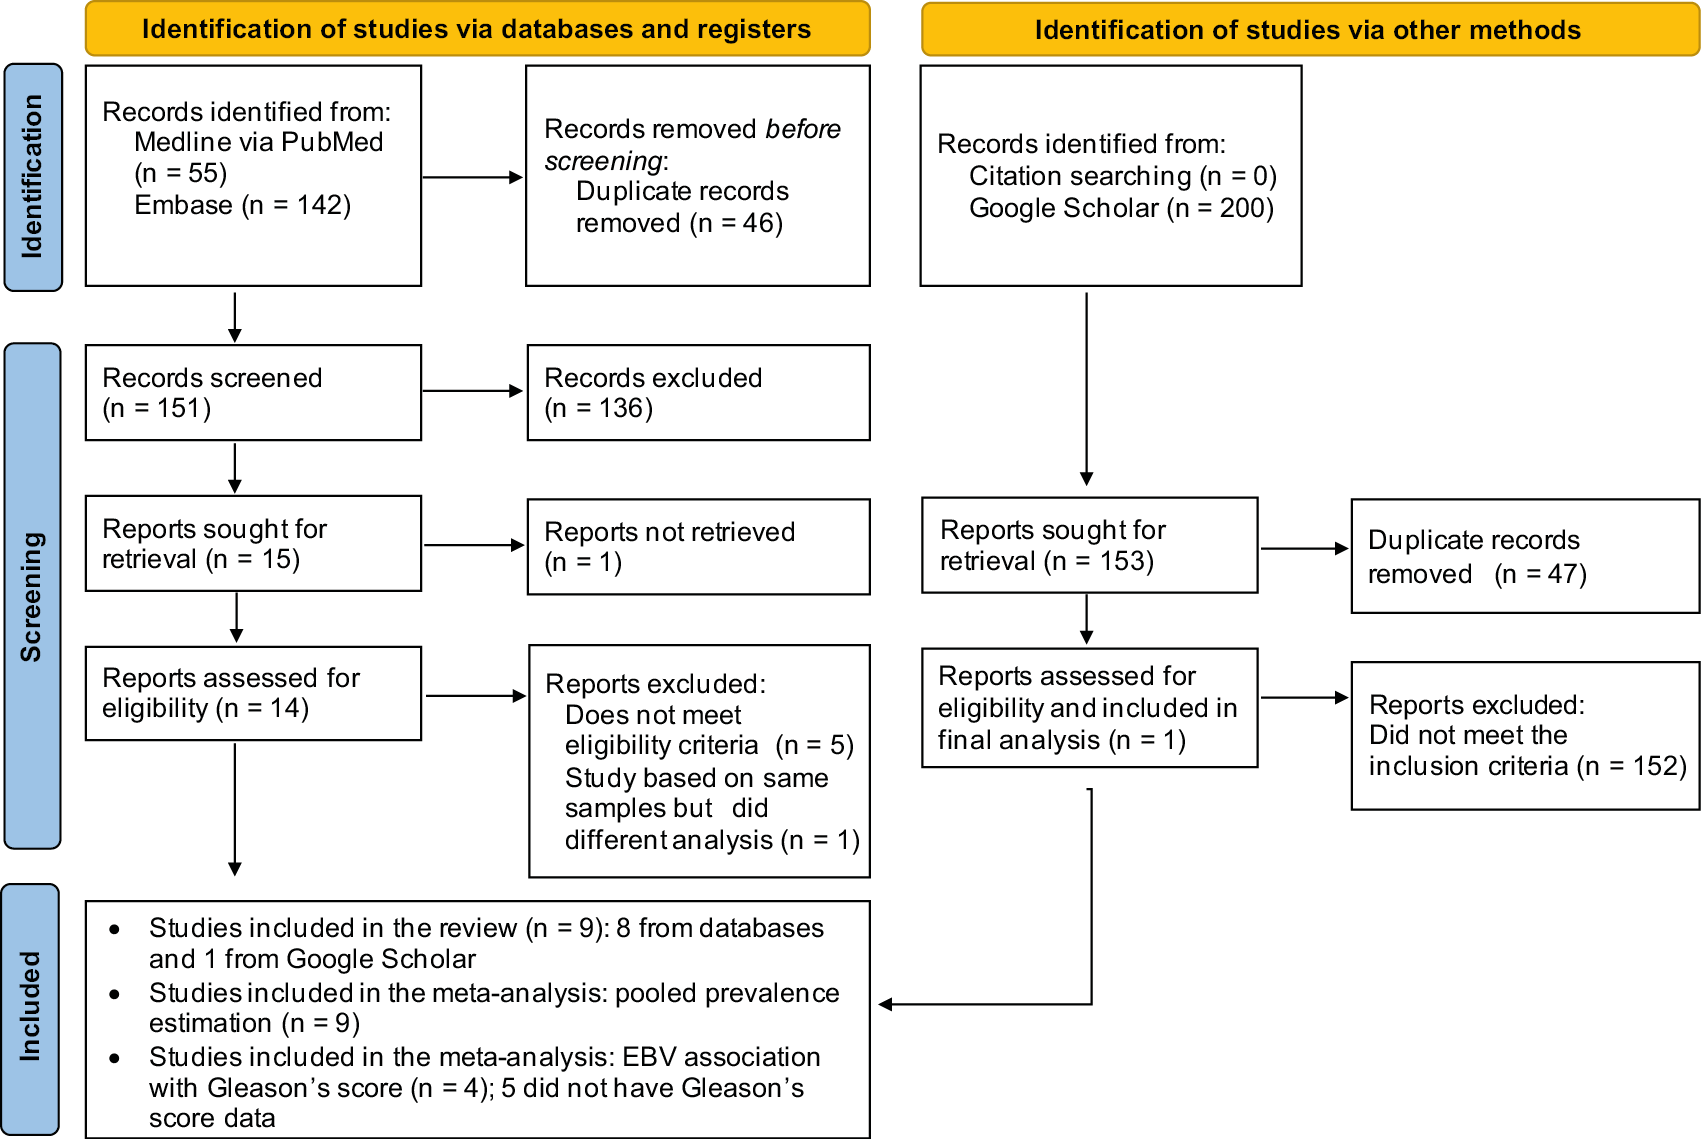
This study was conducted in accordance with the Preferred Reporting Items for Systematic Reviews and Meta-Analyses (PRISMA) 2020 guidelines for reporting systematic reviews and meta-analyses (Figure 1).17 The study used the PICO framework, where the Population (P) was PCa patients, the Exposure (E) was PCa samples with EBV infection, the Comparison (C) was PCa samples without EBV infection, and the Outcome (O) was increased PCa aggressiveness.18
The study protocol was registered in the PROSPERO database (registration No. CRD42024594565).
Search strategy
For this systematic review and meta-analysis, a comprehensive search was conducted in the PubMed, Embase, and Google Scholar (for gray literature) databases using the keywords “EBV,” “prostate cancer,” and “progression,” or “aggressiveness” (Table 1) to identify articles from database inception through December 31, 2024.
The Google Scholar search was limited to the first 200 results (approx. 20 pages). Additionally, references from the shortlisted articles and the articles citing them were reviewed to identify any missed citations. The search was performed without language restrictions, including articles in all languages and from all regions.
Eligibility criteria and selection of studies
This study included only original observational research (cross-sectional, case-control, and cohort studies) that reported data on PCa, EBV presence or absence, and cancer aggressiveness (e.g., Gleason scores). Studies lacking any of these data were excluded. Similarly, narrative reviews, systematic reviews, meta-analyses, case reports, and similar publications were also excluded. Articles from PubMed, Embase, and Google Scholar were imported into EndNote X7 (Clarivate Analytics, Philadelphia, USA), where duplicates were removed. The titles and abstracts of the remaining articles were manually screened, and those that did not meet the eligibility criteria were excluded. Full texts were then retrieved, and articles without full text were also excluded (Figure 1).
The final set of studies was used for data extraction. Two authors (S.H.A. and Z.O.) performed the search and data extraction, resolving disagreements through discussion with a 3rd author (R.B.) and reaching mutual agreement.
Critical appraisal of studies
Since the studies included in our analyses were either cross-sectional or case-control, the Joanna Briggs Institute (JBI) checklist for cross-sectional and case-control studies was used to appraise the shortlisted studies.19, 20 The JBI checklist assesses the methodological quality and risk of bias for each study, using 8 domains/questions for cross-sectional studies and 10 domains/questions for case-control studies. In our analysis, studies scoring above 70% were classified as high-quality, whereas those scoring between 50% and 70% were designated as medium quality.21
Data extraction
From the selected studies, data on study authors, study dates, design, location, sample types, total samples (cancer and control), total cancer samples, total control samples, and EBV status in both cancer and control samples (when available) were extracted. Additionally, since Gleason scores were the only marker of cancer aggressiveness reported across all included studies, data on Gleason scores in cancer and control samples, with and without EBV, were also extracted and recorded. The data were then organized in a Microsoft Excel 2013 (Microsoft Corp., Redmond, USA) spreadsheet for further analysis.
Study outcomes
This study aimed to achieve 2 primary outcomes: 1) to estimate the pooled prevalence of EBV in PCa; and 2) to determine the association between EBV infection and cancer aggressiveness, specifically in relation to moderate-to-high Gleason scores (7 and above).
Data synthesis
In this meta-analysis, EBV prevalence was defined as the proportion of PCa samples that tested positive for EBV divided by the total number of PCa samples. The prevalence was expressed as a percentage. All meta-analysis results were presented in a forest plot.
Next, the study estimated the association between EBV status and the presence of: 1) moderate-to-high Gleason scores; and 2) low Gleason scores in PCa tissues. For these analyses, pooled odds were calculated by combining studies with EBV status and Gleason score data. A continuity correction (treatment arm continuity correction) was applied to address studies with zero cells in 2 × 2 tables.
For all analyses, a random-effects model with restricted maximum likelihood (REML) was used to account for heterogeneity between studies. The 95% confidence interval (95% CI) was estimated using the Knapp–Hartung adjustment for standard errors (SEs). Similarly, the 95% prediction interval was calculated to estimate the range of EBV prevalence or odds ratio (OR) in PCa if new studies are conducted under similar conditions.22
The OR, 95% CI, and 95% prediction interval were estimated as described above. In all analyses, study heterogeneity was assessed using the tau-squared value (τ2), I2 statistic, and Cochran’s Q test. Since the total number of studies in the meta-analyses was fewer than 10, publication bias was not assessed.23
The subgroup analysis was conducted to estimate the pooled EBV prevalence in PCa tissues: 1) with moderate-to-high Gleason scores; 2) with low Gleason scores; and 3) in normal prostate tissues. To assess the influence of individual studies on the overall results of the meta-analysis, an omit-one-study (OOS)24 sensitivity analysis was performed using the statistical parameters described above. The meta-analysis was performed using Stata v. 19.0 (StataCorp, College Station, USA). In all analyses, p < 0.05 was considered statistically significant.
Results
Study selection
A total of 197 records (55 from PubMed and 142 from Embase) were retrieved. Of these, 46 duplicate records were excluded, and the titles and abstracts of 151 studies were further screened.
Of the 151 studies, 14 full-text articles were obtained, while the others were excluded due to irrelevance or unavailability of full texts (Figure 1). After full-text screening, 6 studies were excluded: 5 did not meet the inclusion criteria, and 1 used the same samples but performed a different analysis. Additionally, a search of gray literature using Google Scholar yielded 200 records, of which 199 were excluded because they were duplicates, did not meet the inclusion criteria, or used the same samples but with different analyses. In total, 9 studies25, 26, 27, 28, 29, 30, 31, 32, 33 meeting the eligibility criteria were selected for further analysis.
Study characteristics
Of the 9 selected studies, 4 were cross-sectional and 5 were case-control (Table 2).25, 26, 27, 28, 29, 30, 31, 32, 33 The critical appraisal of cross-sectional studies showed that 3 studies scored 75% and 1 scored 62.5%, indicating moderate to high methodological quality and a potentially low risk of bias (Table 2). Similarly, the appraisal of case-control studies showed that 3 studies were of high quality (score 70%), while 2 were of moderate quality (score 60%), indicating a generally low risk of bias across these studies (Table 2). The publication dates of the 9 selected studies25, 26, 27, 28, 29, 30, 31, 32, 33 ranged from 2002 to 2024. The studies were conducted in Pakistan, China, the USA, Iraq, Morocco, Iran, Poland, and Australia (Table 3).25, 26, 27, 28, 29, 30, 31, 32, 33 Four studies included fresh prostate tumor and/or normal samples; 3 used formalin-fixed paraffin-embedded tissue; and 2 only mentioned prostate or normal samples without indicating whether they were fresh or frozen (Table 3). Similarly, 6 studies used polymerase chain reaction (PCR), 2 used immunohistochemistry (IHC), and 1 analyzed RNA sequencing data to detect EBV in PCa samples (Table 3). In total, 927 samples were analyzed. Overall, EBV was detected in PCa samples at varying percentages (Table 3). About half of the studies found EBV-positive PCa linked to higher Gleason scores, indicating more aggressive cancer (Table 3).
Epstein–Barr virus prevalence in prostate cancer samples
Epstein–Barr virus prevalence across all prostate cancer samples
Of the 9 studies examining EBV presence in PCa samples, the pooled prevalence was estimated at 33% (95% CI: 16–52%; Figure 2). Measures of heterogeneity indicated high variability among studies (τ2 = 0.23; I2 = 94.17%; p < 0.001). The 95% prediction interval for the overall prevalence ranged from 0% to 88.9%, indicating that future studies are likely to report prevalence estimates within this range.
To evaluate the effect of individual studies, an OOS sensitivity analysis was performed, showing prevalence estimates ranging from 30.9% to 38.6%. The overlapping 95% CIs indicated that no individual study significantly influenced the pooled prevalence (Supplementary Table 1). Publication bias could not be assessed because fewer than 10 studies were included in the meta-analysis. To investigate potential sources of heterogeneity (I2 > 75%), we conducted several prespecified subgroup analyses based on clinical characteristics and methodological factors. Studies were categorized by geographic region (Western, Middle East/Africa, or East Asia), detection method (PCR, IHC, RNA-Seq), tumor grade (high Gleason grade and mixed/low grade), sample type (fresh, frozen vs formalin-fixed and paraffin-embedded (FFPE) and study design (case-control and cross-sectional). The between-group variance was assessed using Cochran’s Q test (Qb), with a p < 0.050 indicating a statistically significant difference between subgroups (Table 4). Subgroup analysis showed that geographic region was a significant driver of this variation (p = 0.013), with the highest prevalence observed in the Middle East and Africa (40.7%; I2 = 94.64%) and the lowest in East Asia (7%). Furthermore, the detection method significantly influenced the reported prevalence (p = 0.040), with PCR-based studies reporting a much higher pooled estimate (42.6%; I2 = 95.56%) than IHC or RNA-Seq. Notably, heterogeneity decreased to 77.97% within the IHC subgroup. However, the estimates should be interpreted with caution due to the small number of studies in each analysis. No significant differences were observed when subgrouping by Gleason grade (p = 0.456), sample type (p = 0.090), or study design (p = 0.265). The OOS sensitivity analysis showed that the pooled prevalence estimates were not influenced by any individual study across the subgroups (Supplementary Table 2).
Epstein–Barr virus prevalence in prostate cancer samples with moderate-to-high (7 and above) and low (6) Gleason scores
This subgroup analysis was conducted using 5 and 4 studies, respectively, as the remaining studies lacked Gleason score data. The pooled EBV prevalence in PCa samples with moderate-to-high (7 and above) Gleason scores was estimated at 59% (95% CI: 21–92%; Supplementary Fig. 1). The heterogeneity measures indicated substantial inter-study variability (τ2 = 0.28; I2 = 90.86%; Q = 0.000). The 95% prediction interval for pooled prevalence ranged from 0% to 100%. The OOS sensitivity analysis indicated that EBV prevalence ranged from 49.2% to 64.1% in PCa samples with moderate-to-high Gleason scores, with overlapping 95% CIs (Supplementary Table 4), suggesting that no individual study disproportionately influenced the pooled EBV prevalence. A subgroup analysis was performed due to high heterogeneity in the pooled prevalence across samples with moderate-to-high (7 or above) Gleason scores. The studies were categorized based on geographic region (Western, Middle East/Africa, or East Asia), detection method (PCR vs IHC/RNA-Seq), tumor grade (high Gleason grade/associated vs mixed/low grade), sample type (fresh/frozen vs FFPE), and study design (case-control vs cross-sectional) (Supplementary Table 3). The analysis indicated possible differences in EBV prevalence across geographic regions (p = 0.030), with a pooled prevalence of 46% (I2 = 94.2%) in the Middle East and Africa. Sample type also significantly influenced prevalence (p < 0.001), with FFPE showing a pooled prevalence of 35% (I2 = 97.12%). No significant differences were observed by detection method (p = 0.120).
These results should be interpreted cautiously because many subgroups included only a single study, which does not constitute a true pooled estimate, and heterogeneity was high in some subgroups (I2 up to 97%). Conversely, the difference attributable to study design was more robust (p < 0.001), with case-control studies showing a much higher prevalence (64%; I2 = 80.52%) than cross-sectional studies (34%; I2 = 0.00%).
Similarly, the pooled EBV prevalence in PCa samples with low (6) Gleason scores was estimated at 34% (95% CI: 15–56%; Supplementary Fig. 1), with no evidence of inter-study heterogeneity (τ2 = 0.00; I2 = 0.00%; Q = 0.26). The 95% prediction interval for pooled prevalence ranged from 9.2% to 63.8%. It is important to note that, since only 4 studies were included in this meta-analysis, publication bias could not be assessed.
Epstein–Barr virus prevalence in normal prostate samples
This subgroup analysis was conducted using 5 studies that analyzed the presence of EBV in normal prostate samples. The pooled EBV prevalence was estimated at 17% (95% CI: 6–39%; Supplementary Fig. 1), with low inter-study heterogeneity (τ2 = 0.27; I2 = 37.08%; Q = 0.17). The 95% prediction interval for pooled prevalence ranged from 0% to 88.9%. It is important to note that, since only 5 studies were included in this meta-analysis, publication bias could not be assessed.
Association of EBV with prostate cancer aggressiveness
Next, the association between EBV and PCa aggressiveness was examined. Only 4 studies were included in this analysis, as the study by Mezher and Auda26 lacked data on Gleason scores in EBV-negative PCa samples.
The results suggested that the presence of EBV in PCa samples was associated with higher odds of moderate-to-high Gleason scores (summary OR: 2.38, 95% CI: 1.82–3.13; p = 0.002; Figure 3). Measures of heterogeneity did not indicate inter-study variability (τ2 = 0.00; I2 = 0.00%; Q = 0.97), likely due to the limited number of studies. The 95% prediction interval for the overall OR ranged from 1.65 to 3.44.
Additionally, the association between EBV and low Gleason scores was examined. The results indicated that EBV presence in PCa samples was associated with lower odds of low (6) Gleason scores (summary OR: 0.42, 95% CI: 0.32–0.55; p = 0.002; Supplementary Fig. 2). Heterogeneity measures did not suggest inter-study variability (τ2 = 0.00; I2 = 0.00%; Q = 0.97). The 95% prediction interval for the pooled OR ranged from 0.29 to 0.61. It is important to note that, since only 4 studies were included in this meta-analysis, publication bias could not be assessed.
Discussion
This systematic review and meta-analysis aimed to estimate the pooled prevalence of EBV in PCa tissues and to explore the potential link between EBV infection and PCa aggressiveness. Epstein–Barr virus has previously been associated with several cancers, most notably nasopharyngeal and gastric carcinomas,34 where chronic EBV infection, together with host and environmental factors, contributes to cancer progression.35, 36 Within this broader oncogenic context, the present findings provide quantitative evidence that EBV is commonly identified in PCa tissues, thereby emphasizing the need for further research into its role in prostate tumor biology and disease progression.
Our analysis estimated a pooled prevalence of EBV in PCa tissue at 33% (95% CI: 16–52%). Substantial heterogeneity was observed (I2 = 94.1%), indicating considerable variation across studies, which may be attributed to differences in study location, detection methods, sample type, or study precision.37 However, sensitivity analysis (OOS) yielded pooled prevalence estimates within a narrow range (30–39%), with overlapping 95% CIs, suggesting that no individual study significantly influenced the overall estimate.26, 33
Although PCa is not typically considered to be driven by EBV, the grade-dependent enrichment observed in this study is consistent with patterns reported in other EBV-associated epithelial cancers. The EBV–PCa relationship remains poorly characterized. Unlike in lymphoid and other epithelial cancers, studies have reported a wide range of EBV prevalence in PCa tissues (8–64%),25, 26, 27, 28, 29, 30, 31, 32, 33 with only 1 study noting a higher prevalence of EBV in prostate tissue than in matched peripheral blood samples from the same patients.32 One important yet unresolved question in this field is how EBV infects PCa tissues. Several mechanisms have been proposed for EBV entry into epithelial cells. Current evidence supports a model where viral entry occurs via fusion of the viral envelope with the host cell membrane, mediated primarily by EBV glycoproteins gB and the gH/gL complex.38 In epithelial cells, gH/gL interacts with integrins such as αvβ5, αvβ6, and αvβ8, facilitating membrane fusion and viral entry.39 Given that prostate epithelial cells express integrins, including αvβ6 and αvβ8, particularly in malignant or inflammatory states, it is biologically plausible that these cells are permissive to EBV entry.40
In established EBV-associated malignancies, EBV positivity is consistently associated with higher-grade tumors, altered differentiation patterns, and adverse pathological features, suggesting a relationship between viral presence and aggressive disease phenotypes.41 In PCa, tumor aggressiveness is commonly assessed using the Gleason grading system.42
Our analysis showed a higher pooled prevalence of EBV in PCa tissues with moderate-to-high Gleason scores (59%, 95% CI: 21–92%) compared to low Gleason score tumors (34%, 95% CI: 15–56%) and normal prostate samples (17%, 95% CI: 6–39%). Our analysis further demonstrated that EBV detection rates increase across tumor grades, supporting a grade-dependent relationship rather than a uniform distribution of viral presence across PCa subtypes.
Among the studies included in the meta-analysis, higher EBV viral loads and antibody titers were reported in patients with higher Gleason scores,28, 29 providing additional support for the pattern identified in our analysis. These findings, combined with the pooled ORs from our study, suggest that EBV detection in PCa may be linked to more aggressive tumors rather than representing incidental background infection.28, 29
In EBV-related cancers, such as nasopharyngeal carcinoma, viral persistence is associated with aggressive tumor behavior.41 However, these findings should be interpreted with caution because the pooled OR was based on unadjusted estimates, as adjusted ORs were inconsistently reported. The observed association may also be influenced by confounders such as small sample sizes, differences in EBV detection methods, and variability in diagnostic criteria.
Emerging molecular evidence provides a plausible biological explanation for the observed EBV enrichment in higher-grade PCa, as identified in this meta-analysis. A study examining EBV latency in PCa tissue identified a latency II/III-like profile,33 consistent with expression patterns associated with oncogenic activity in other EBV-related epithelial malignancies.
Additionally, 1 study demonstrated that EBV-positive PCa tissues exhibit higher expression levels of vimentin, a key marker of epithelial–mesenchymal transition, altered expression of several oncomiRs (including miR-146b, miR-183-3p, miR-196a, and miR-126) and oncogenes (such as AR, CDH1, and CDC20), as well as reduced CD3+ lymphocytic infiltration, implying a more aggressive and immunosuppressive tumor microenvironment.13 Furthermore, a clinical study found that patients with EBV-positive PCa exhibited higher EBV antibody levels and viral loads, which correlated with higher Gleason scores.43 Experimental evidence from prostate and other epithelial tissues suggests that EBV latent gene expression may support the survival of premalignant cells, thereby promoting genomic instability and disease progression.44, 45
EBV/HPV co-infection has also been shown to contribute to PCa development by increasing the expression of anti-apoptotic molecules such as survivin and Bcl-2, inflammatory mediators including nuclear factor kappa B (NF-κB), tumor necrosis factor alpha (TNF-α), interleukin (IL)-6, IL-17, reactive oxygen species (ROS), and anti-anoikis factors such as N-cadherin and Twist.25,46 The EBV/HPV co-infection has further been shown to promote chronic inflammation and facilitate immune evasion, creating a microenvironment that supports cell proliferation, angiogenesis, metastasis, and resistance to apoptosis.29
Taken together, it is biologically plausible that the expression of EBV latent proteins in prostate tissue could contribute to tumor progression and higher Gleason grades,27, 31, 32, 33 although direct evidence supporting this mechanism in PCa remains limited.
Limitations of the study
We acknowledge limitations regarding the generalizability and quality of evidence in our analysis. First, this meta-analysis considered only the Gleason score as an indicator of PCa progression. While the Gleason score is a significant marker, other factors, such as PSA levels and dysregulation of tumor suppressors or oncogenes, also influence tumor aggressiveness. However, since most existing studies focused solely on the Gleason score, we used it as the primary marker. Second, this study included only 9 and 4 studies, which may limit the generalizability and statistical robustness of the findings and increase uncertainty around the pooled results. Additionally, because the meta-analysis included <10 studies, publication bias could not be assessed.23 Due to the limited number of published studies in this area, the results may also be affected by publication bias arising from the geographical clustering of the papers,47, 48 which could result in an overrepresentation of data from specific regions, reflecting local epidemiological trends, healthcare access, and diagnostic methods rather than providing a global view. This ultimately restricts the applicability of the findings and highlights the need for larger, multi-regional studies to confirm EBV infection in PCa across diverse populations. The presence of confounders, discussed above, may affect the reliability of the analysis and increase the risk of bias and study heterogeneity. Therefore, the findings should be interpreted with caution.
Conclusions
This study provides support for a potential link between EBV infection and PCa aggressiveness and highlights the need for further research into underlying mechanisms. Future research should focus on the following key areas: 1) conducting statistically robust epidemiological studies with large sample sizes to determine the prevalence of EBV in PCa tissues and its association with tumor aggressiveness; 2) investigating the localization of EBV within PCa tissues; 3) examining how EBV genes and proteins, particularly latency-associated proteins, influence tumor progression; and 4) exploring the potential of EBV infection as a prognostic biomarker for aggressive PCa. A deeper understanding of these mechanisms may improve our knowledge of the complex processes underlying prostate carcinogenesis and may also have therapeutic implications.
Supplementary data
The supplementary files are available at https://doi.org/10.5281/zenodo.19183381. The package contains the following files:
Supplementary Table 1. OOS sensitivity analysis assessing the effect of omitting each included study on pooled EBV prevalence. Each row presents the omitted study, the proportion, the 95% CI, and the heterogeneity measure (I2) for EBV in PCa tissues after exclusion.
Supplementary Table 2. OOS sensitivity analysis assessing the effect of omitting each included study on pooled EBV prevalence across subgroups. Each row presents the omitted study, the proportion, and the 95% CI for EBV in PCa tissues after exclusion.
Supplementary Table 3. Subgroups based on high Gleason grade (Gleason 7 and above).
Supplementary Table 4. OOS sensitivity analysis assessing the effect of omitting each included study on pooled EBV prevalence in PCa samples with moderate-to-high Gleason scores (7 and above). Each row presents the omitted study, the proportion, and the 95% CI for EBV in PCa tissues after exclusion.
Supplementary Fig. 1. Forest plots of pooled EBV prevalence in prostate tissue, stratified by Gleason grade and normal controls. A. PCa with moderate-to-high Gleason scores (≥7); B. PCa with low Gleason scores (≤6); C. normal prostate samples. For each study, the number of EBV-positive samples, total sample size, and study-specific prevalence with 95% CIs are shown. Study weights are indicated by square size, and horizontal lines represent 95% CIs. The pooled prevalence estimate is shown as a diamond. Heterogeneity statistics and meta-analytic parameters are reported within each panel.
Supplementary Fig. 2. Forest plot showing the association between low Gleason score and EBV status in PCa samples. The figure displays the number of PCa samples with low (6) Gleason scores, their EBV-positive and EBV-negative status, the ORs with 95% CIs for each study, and the contribution weight of each study to the overall analysis. Blue squares and lines represent the ORs and their 95% CIs. The overall (summary) OR and 95% CI are indicated by green diamonds and lines, respectively. The figure also includes heterogeneity statistics and details of the meta-analytic parameters.
Use of AI and AI-assisted technologies
Not applicable.
.jpg)
.jpg)