Abstract
Background. Sleep disorders are common and heterogeneous conditions associated with systemic inflammation. They can impair quality of life and increase disease burden. Currently, studies investigating the association between sleep disorders and high-density lipoprotein (HDL)-related inflammatory biomarkers are lacking.
Objectives. This study aimed to explore the associations between HDL-related inflammatory biomarkers and sleep disorders.
Materials and methods. This study utilized data from the National Health and Nutrition Examination Survey (NHANES; 2005–2014). Multivariable logistic regression models were applied to explore the associations between HDL-related inflammatory biomarkers, including platelet-to-HDL ratio (PHR), lymphocyte-to-HDL ratio (LHR), neutrophil-to-HDL ratio (NHR), and monocyte-to-HDL ratio (MHR), and the prevalence of sleep disorders and sleep duration. Subgroup analyses were conducted to investigate potential interactions. In addition, the nonlinear relationship between these inflammatory biomarkers and the likelihood of sleep disorders was assessed using restricted cubic spline (RCS) models. Finally, the robustness of the observed associations was examined through sensitivity analyses.
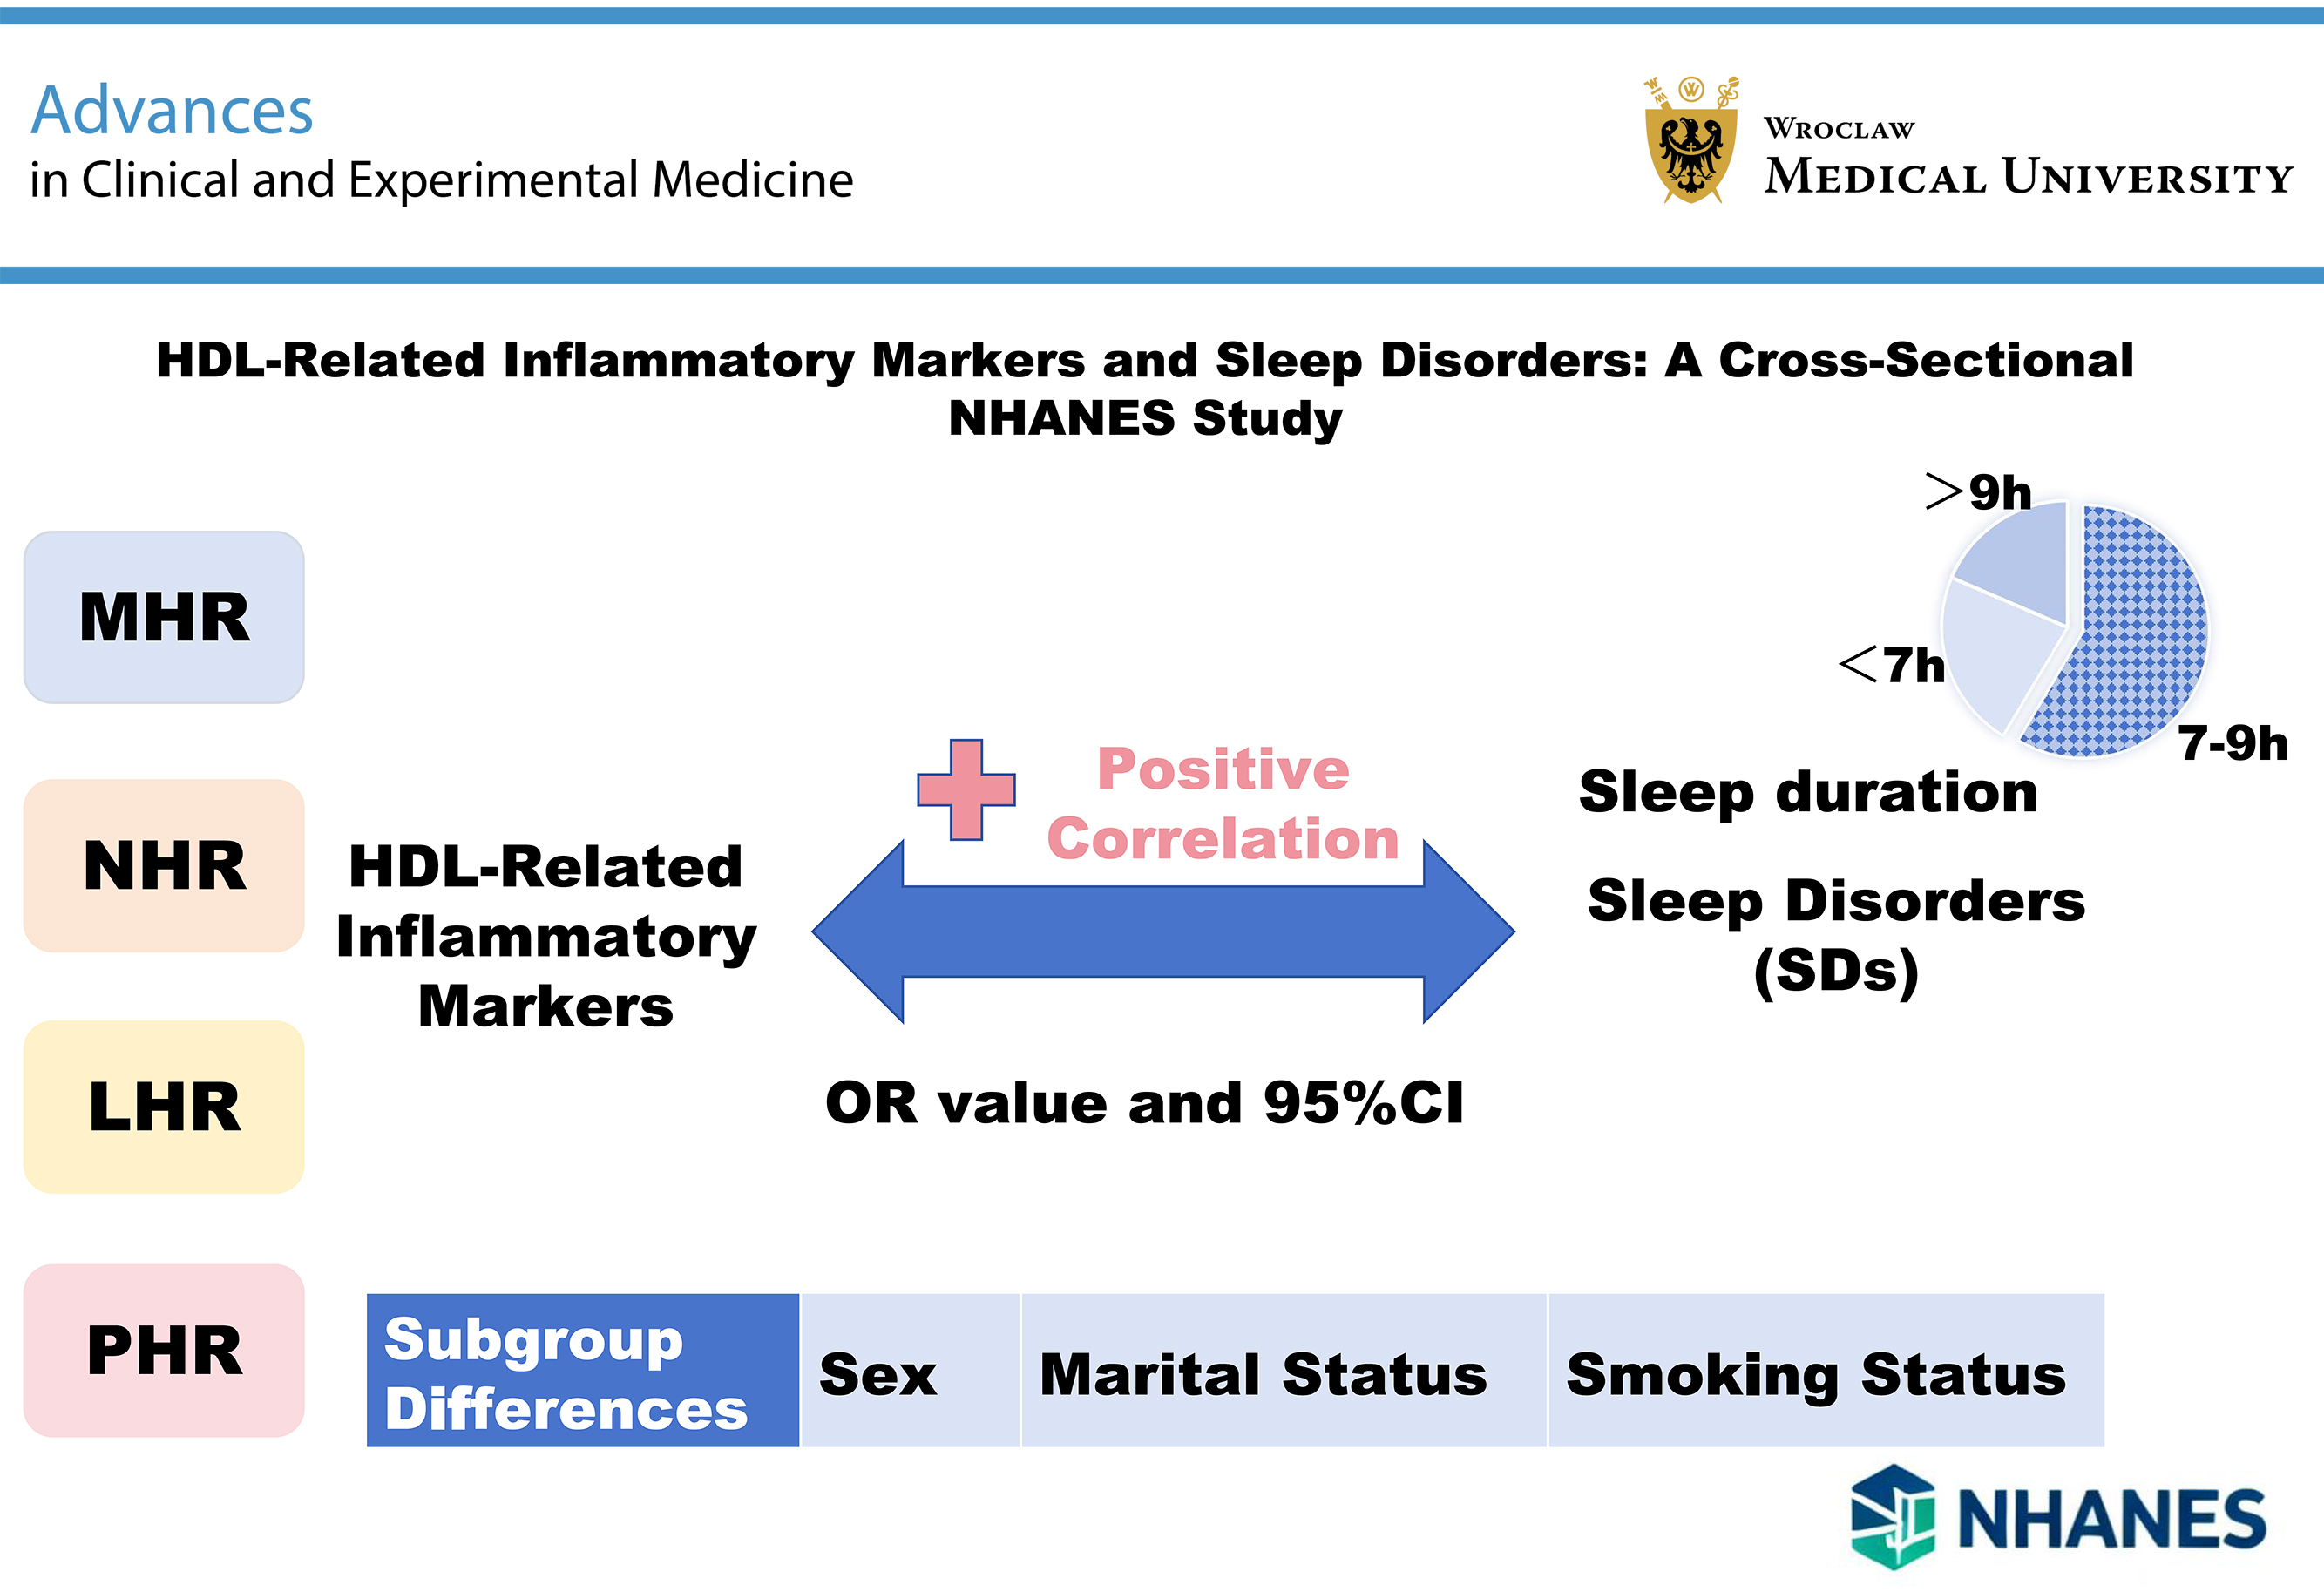
Results. A total of 23,045 individuals were included. In the fully adjusted models, higher MHR (odds ratio (OR) = 1.33; 95% confidence interval (95% CI): 1.11–1.60), NHR (OR = 1.25; 95% CI: 1.04–1.49), LHR (OR = 1.24; 95% CI: 1.05–1.48), and PHR (OR = 1.18; 95% CI: 1.00–1.39) were positively associated with an increased prevalence of sleep disorders. The RCS analysis revealed linear relationships between these inflammatory biomarkers and the likelihood of sleep disorders (all p for nonlinearity >0.05). Subgroup analyses indicated that sex and marital status significantly interacted with all 4 indices (all p for interaction <0.05). Compared with individuals with the recommended sleep duration (7–9 h/day), those with short (<7 h/day) and long (>9 h/day) sleep durations had elevated NHR levels.
Conclusions. This study revealed a linear association between HDL-related inflammatory biomarkers and sleep disorders. Moreover, sex and marital status modified the associations of all 4 indices with sleep disorders. In addition, these inflammatory biomarkers were associated with sleep duration.
Key words: sleep disorders, high-density lipoproteins, inflammation mediators, biomarkers, National Health and Nutrition Examination Survey (NHANES)
Background
Sleep is a vital physiological process essential for maintaining normal bodily functions and brain activity. It plays a key role in restoring physical and neurological systems, enhancing cognitive performance, and promoting mental wellbeing.1 Sleep disorders have become a major global public health issue, with a steadily increasing prevalence affecting approx. 30% of the global population.2 According to the International Classification of Sleep Disorders, 3rd Edition (ICSD-3), sleep disorders are classified into 7 categories: insomnia, sleep-related breathing disorders, circadian rhythm sleep-wake disorders, parasomnias, central disorders of hypersomnolence, sleep-related movement disorders, and other sleep disorders.3 Currently, the underlying mechanisms of sleep disorders remain incompletely understood, and no definitive diagnostic biomarkers are available. Moreover, the diagnosis of sleep disorders often relies on complex and costly polysomnography.4 Notably, chronic sleep disorders are closely associated with a range of serious health outcomes, including obesity, hypertension, type 2 diabetes, cardiovascular disease (CVD), and increased all-cause mortality.5 Given the substantial disease burden associated with sleep disorders, identifying modifiable biomarkers is of significant value for developing preventive strategies against sleep disorders.
Inflammation plays a central role in the pathophysiology of sleep disorders. It can affect the central nervous system through neural signaling, humoral mediators, and transport across the blood–brain barrier (BBB), thereby modulating neurotransmitter systems and disrupting sleep.6 High-density lipoprotein (HDL) plays a pivotal role in lipid metabolism by transporting lipids from peripheral tissues back to the liver, a process known as reverse cholesterol transport.7 Beyond its well-known cardiovascular protective effects, increasing evidence supports the anti-inflammatory, antioxidant, and immunomodulatory functions of HDL.8 The complexity of HDL arises from its composition of multiple subunits, each with unique protein and lipid components that play key regulatory roles in both the innate and adaptive immune systems.9 On the one hand, HDL exerts anti-inflammatory effects by inhibiting the release of inflammatory cytokines, neutralizing endotoxins, modulating vascular endothelial cell function, and regulating immune cell activity.10 On the other hand, systemic inflammation can impair HDL function by reducing its antioxidant capacity and cholesterol efflux efficiency and may even promote a pro-inflammatory phenotype.11
Notably, inflammation can reach the central nervous system through direct neural pathways, humoral mediators, and transport across the BBB via active mechanisms and cellular routes, thereby modulating neurotransmitter systems and ultimately disrupting sleep.6 Previous studies have reported associations between sleep disorders and various inflammatory markers (including HDL and C-reactive protein (CRP)), as well as metabolic indicators (such as HbA1c (glycated hemoglobin), blood glucose, and insulin).12 However, research specifically focusing on HDL-related inflammatory biomarkers in relation to sleep disorders remains lacking. It is hypothesized that composite indices reflecting the overall inflammatory and immunoregulatory functions of HDL may better reveal the underlying inflammatory pathology of sleep disorders than individual blood cell counts or lipid parameters and could potentially serve as novel diagnostic or risk assessment markers.
In recent years, a series of HDL-related inflammatory indices derived from routine blood tests, such as the lymphocyte-to-HDL cholesterol ratio (LHR), monocyte-to-HDL cholesterol ratio (MHR), neutrophil-to-HDL cholesterol ratio (NHR), and platelet-to-HDL cholesterol ratio (PHR), have emerged as novel biomarkers. Due to their accessibility and low cost, these indices have been extensively studied and have demonstrated significant value in risk prediction across various conditions, including CVD, metabolic syndrome, and periodontitis.13, 14, 15, 16 However, whether these HDL-associated inflammatory indices are associated with sleep disorders remains unclear.
Objectives
We hypothesized that higher levels of HDL-related inflammatory biomarkers (MHR, NHR, LHR, and PHR) would be positively associated with sleep disorders and abnormal sleep duration. To test this hypothesis, we aimed to investigate these associations using data from the National Health and Nutrition Examination Survey (NHANES). Since these indices are derived from routine blood counts and lipid profiles, confirming their association with sleep disorders could provide clinicians with a simple, cost-effective tool for the early identification of high-risk individuals. This would facilitate targeted interventions, offering a practical biomarker-based approach for screening and prevention, with potentially significant implications for public health and quality of life.
Materials and methods
Data source and study population
The NHANES, conducted by the National Center for Health Statistics (NCHS) of the U.S. Centers for Disease Control and Prevention (CDC), aims to assess the health and nutritional status of adults and children in the USA. The survey protocol was approved by the National Center for Health Statistics (NCHS) Research Ethics Review Board (ERB) under its continuous protocol for NHANES (ERB Approval Protocols #2005-06 and #2011-17). All participants provided written informed consent.
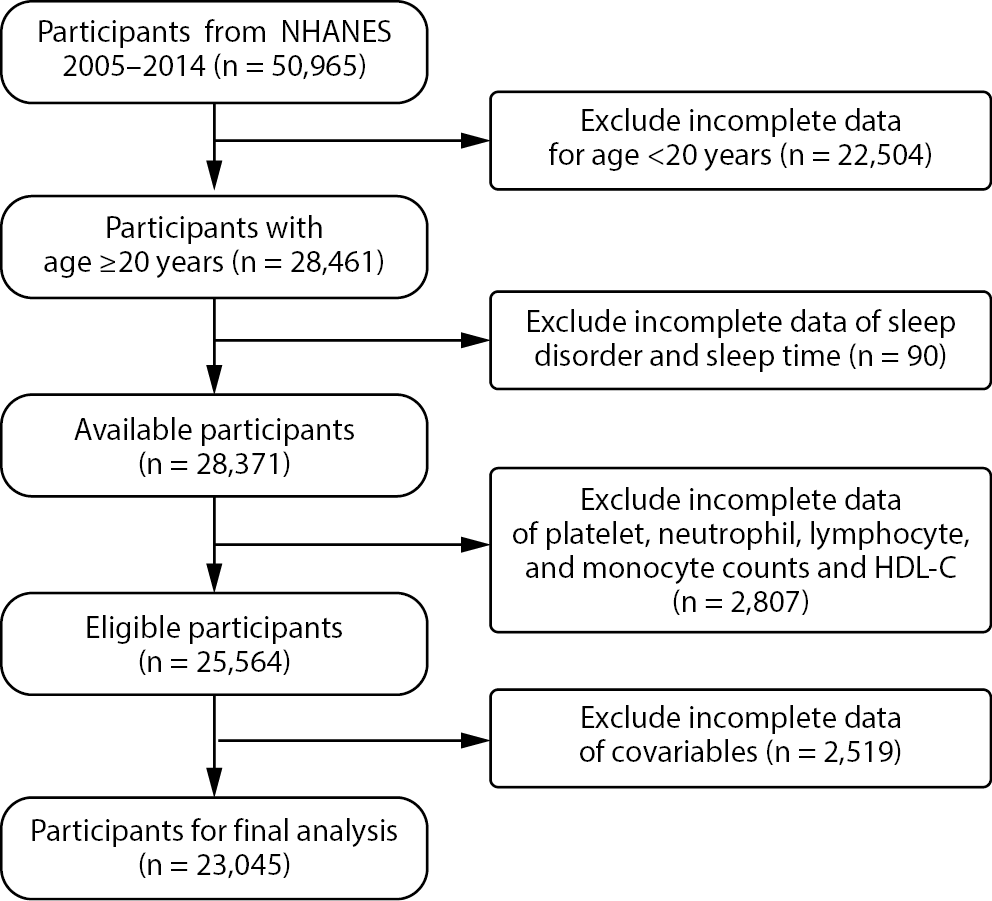
As illustrated in Figure 1, data from 5 consecutive NHANES cycles (2005–2014), including U.S. individuals aged 20 years and older, were collected. To ensure comprehensiveness and validity, individuals were excluded if they: 1) lacked assessment data on sleep disorders or sleep duration; 2) had incomplete data on platelet, neutrophil, lymphocyte, monocyte counts, or HDL cholesterol (HDL-C); or 3) had missing covariate data, including age, sex, race, education level, marital status, smoking status, alcohol consumption, diabetes, hypertension, CVD, or body mass index (BMI).
Exposure variables
Exposure variables, including monocyte, lymphocyte, neutrophil, and platelet counts, as well as HDL-C levels, were obtained from the whole blood cell count database of NHANES. The MHR was calculated as monocyte/HDL-C, NHR as neutrophil/HDL-C, PHR as platelet/HDL-C, and LHR as lymphocyte/HDL-C. Given the skewed distributions of these indices, log transformation was applied when the 4 biomarkers were analyzed as continuous variables.16
Outcome variables
Sleep disorders were determined based on responses to NHANES item SLQ060: “Have you ever been told by a doctor or other health professional that you have a sleep disorder?” Responses included “Don’t know,” “No,” “Yes,” and “Refused.” Individuals with missing responses or those answering “Don’t know” or “Refused” were excluded. Sleep duration was evaluated using the question: “How many hours of sleep do you usually get?” Following the National Sleep Foundation recommendations, sleep duration was categorized as short (<7 h/day), recommended (7–9 h/day), or long (>9 h/day).17
Covariates
Demographic and lifestyle factors were collected, including age, sex, race, education level, marital status, smoking status, alcohol consumption, diabetes, hypertension, CVD, and BMI. Age was categorized as <40, 40–60, and >60 years. Race was categorized as non-Hispanic Black, Hispanic, Mexican American, non-Hispanic White, or other. Marital status was grouped as widowed, married, separated, divorced, cohabiting, or never married. Education level was categorized as below high school, high school diploma, or above. Drinkers were defined as individuals who consumed more than 12 alcoholic drinks per year. Smokers were defined as individuals who had smoked more than 100 cigarettes in their lifetime. Body mass index was classified as ≤25 kg/m2 or >25 kg/m2. Alcohol intake frequency was categorized as 1–5 times/month, 5–10 times/month, ≥10 times/month, never, or unknown. Smoking status was classified as current, former, or never smoker. The diagnoses of diabetes and hypertension were based on responses to the questionnaire item: “Has a doctor ever diagnosed you with diabetes or hypertension?” Cardiovascular disease included angina, stroke, myocardial infarction, heart failure, and coronary heart disease.
Statistical analyses
Sample weights were applied in accordance with the NHANES 2005–2014 guidelines (https://wwwn.cdc.gov/nchs/nhanes/tutorials/weighting.aspx). Considering the 5 consecutive 2-year cycles, sample weights were adjusted by dividing the 2-year examination center weights (WTMEC2YR) by 5 to ensure nationally representative estimates. For all continuous variables subjected to intergroup comparisons, we tested for normality within each study group separately. For variables that were normally distributed in all groups, results are presented as mean ± standard deviation (mean ±SD). An independent samples t-test was used for comparisons if the assumption of homogeneity of variances was met; otherwise, Welch’s t test was applied. For continuous variables that were not normally distributed in any of the study groups, results are presented as median (interquartile range (IQR)), and the Mann–Whitney U test was used for intergroup comparisons. The results of the normality and homogeneity tests are provided in Supplementary Table 1. Categorical variables were expressed as numbers and percentages (n (%)) and were compared between groups using the χ2 test. We reviewed all contingency tables used in the analysis and verified that the minimum expected frequency in each cell exceeded 5, thereby satisfying the assumptions of Pearson’s χ2 test. Detailed results are provided in Supplementary Table 2. Potential multicollinearity among covariates was evaluated using variance inflation factors (VIFs), and all covariates included in the models had VIF values below 10, indicating no significant multicollinearity in the present study (Supplementary Table 3). Additionally, the linearity assumption between continuous predictors and the logit of the outcome was assessed using the Box–Tidwell test. Detailed results are provided in Supplementary Table 4. Weighted multivariable logistic regression models were applied to examine the associations between HDL-related inflammatory indices and the presence of sleep disorders. Weighted multivariable logistic regression models were further used to investigate the associations between these biomarkers and sleep duration, categorized as short (<7 h/day), recommended (7–9 h/day), or long (>9 h/day). Model 1 was unadjusted; Model 2 was adjusted for key demographic variables, including sex, age, and race; Model 3 was further adjusted for education level, marital status, smoking status, alcohol consumption, diabetes, hypertension, CVD, and BMI. Restricted cubic splines (RCS) with 3 knots placed at the 25th, 50th, and 75th percentiles were used to investigate the nonlinear association between the HDL-related inflammatory markers and sleep disorders. Subgroup analyses were conducted to examine whether the associations between HDL-related inflammatory indices and sleep disorders varied across different population characteristics, and likelihood ratio tests were performed to assess potential interactions between the HDL-related inflammatory indices and these characteristics. Sensitivity analyses were also conducted to verify the robustness of the results. First, unweighted data were used for repeated analyses. Second, propensity score matching (PSM) using nearest-neighbor matching at a 1 : 3 ratio was performed to balance group differences. Following matching, the primary analysis was repeated. The relevant code can be found in Supplementary File 1. Third, outliers were addressed using the winsorization method, and regression analyses were subsequently performed based on the processed data. All statistical analyses were conducted using R software v. 4.4.1 (R Foundation for Statistical Computing, Vienna, Austria), and a two-sided p < 0.05 was considered statistically significant.
Results
Baseline characteristics of study population
Baseline characteristics of the included individuals were compared according to the presence or absence of sleep disorders (Table 1). A total of 23,045 individuals were included, of whom 48.93% were male. Among participants in the sleep-disorder group, 52.64% were male, 51.73% were aged 40–60 years, 75.93% were non-Hispanic White, 84.82% had a high-school education or above, 58.27% were married, 84.13% had a BMI > 25 kg/m2, 38.10% consumed alcohol 1–5 times per month, and 44.06% had never smoked. The prevalence of hypertension among individuals with sleep disorders was 52.07%. The results showed that individuals with sleep disorders had significantly higher monocyte and neutrophil counts, along with lower HDL-C levels, resulting in elevated MHR, LHR, NHR, and PHR values (all p < 0.05).
Associations between HDL-related inflammatory indices and sleep disorders
The HDL-related inflammatory biomarkers were treated as continuous variables in the regression models. In Model 3 (fully adjusted), positive associations were observed between sleep disorders and log(MHR) (odds ratio (OR) = 1.30, 95% confidence interval (95% CI): 1.10–1.52), log(NHR) (OR = 1.21, 95% CI: 1.05–1.38), log(LHR) (OR = 1.18, 95% CI: 1.03–1.36), and log(PHR) (OR = 1.20, 95% CI: 1.02–1.43) (Table 2). Subsequently, these 4 indices were categorized into tertiles for further analysis. In Model 3, compared with the lowest tertile (T1), the highest tertile (T3) was significantly associated with a greater likelihood of sleep disorders (MHR (OR = 1.33, 95% CI: 1.11–1.60), NHR (OR = 1.25, 95% CI: 1.04–1.49), LHR (OR = 1.24, 95% CI: 1.05–1.48), and PHR (OR = 1.18, 95% CI: 1.00–1.39)) (Table 2).
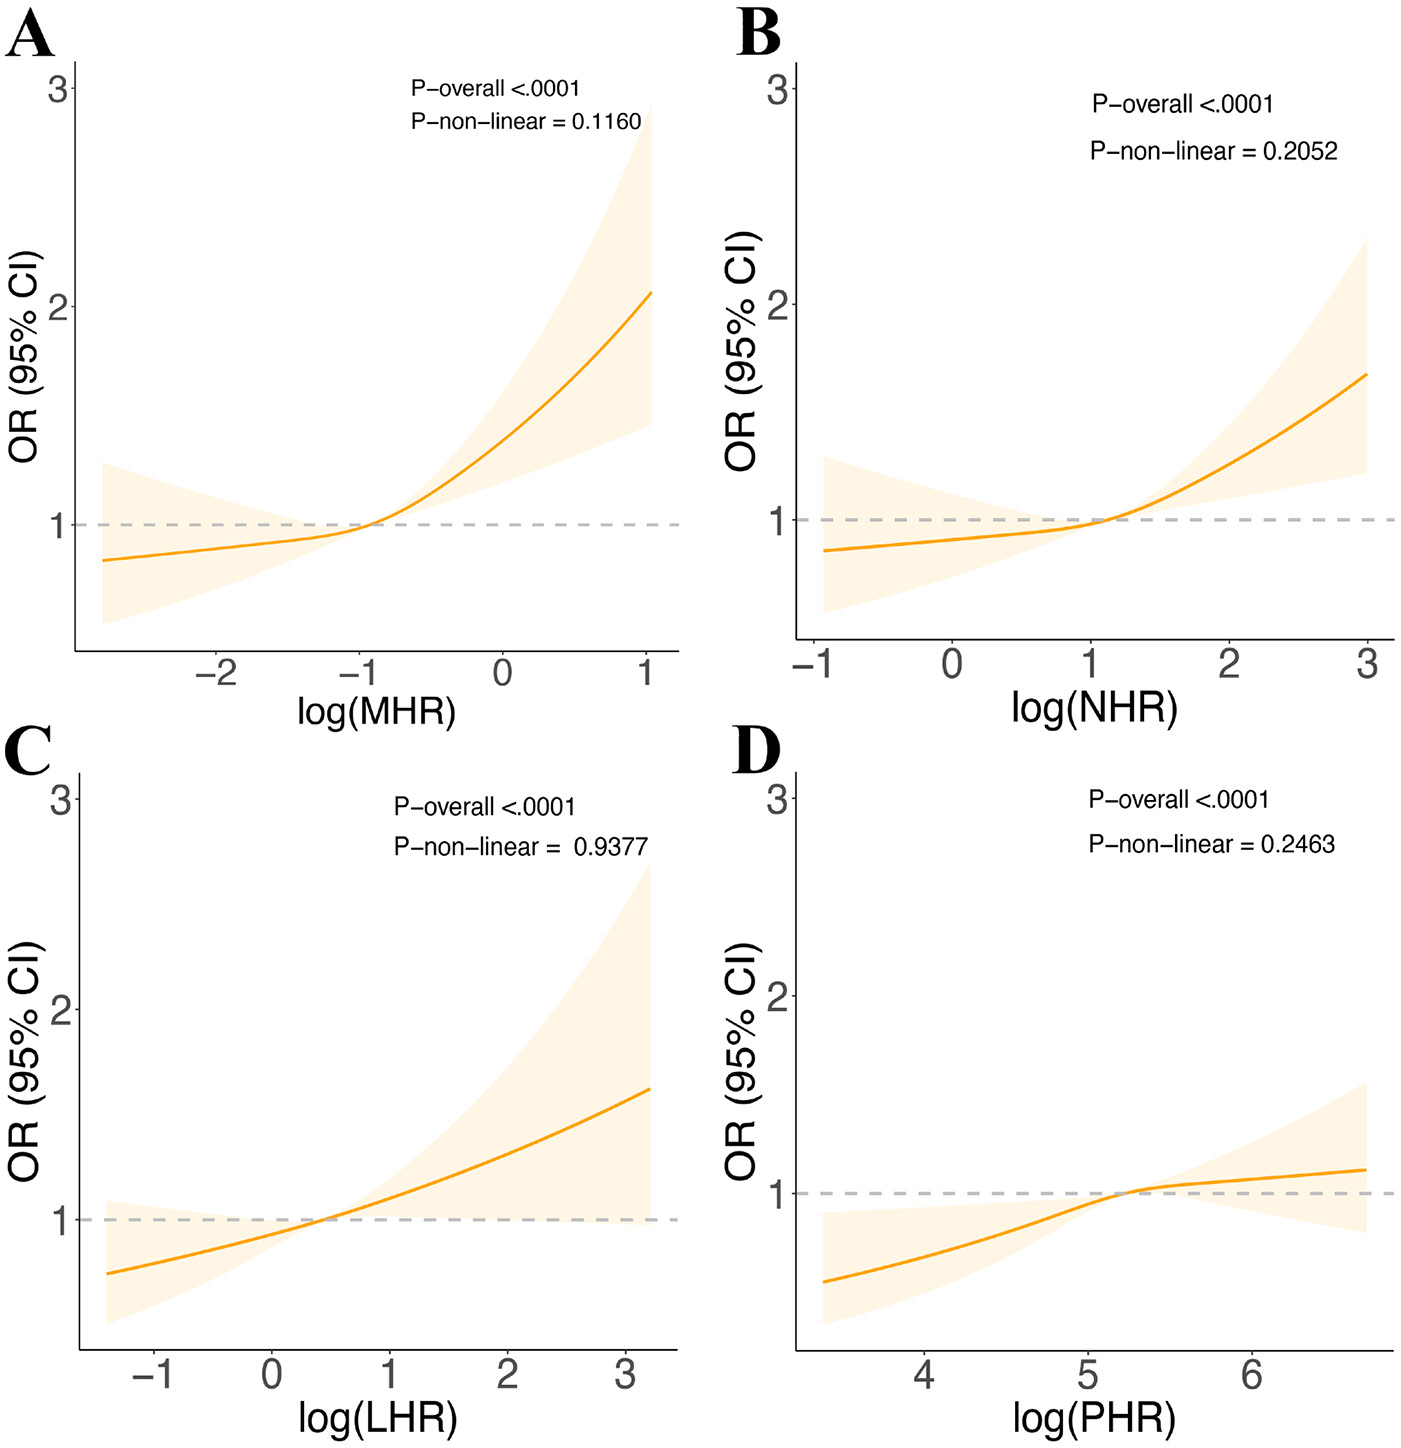
In addition, RCS analyses were performed to further investigate the nonlinear relationships between the 4 indices and sleep disorders. As illustrated in Figure 2 the results suggested linear associations between all 4 indices and the likelihood of sleep disorders (p for nonlinearity >0.05).
Subgroup analysis
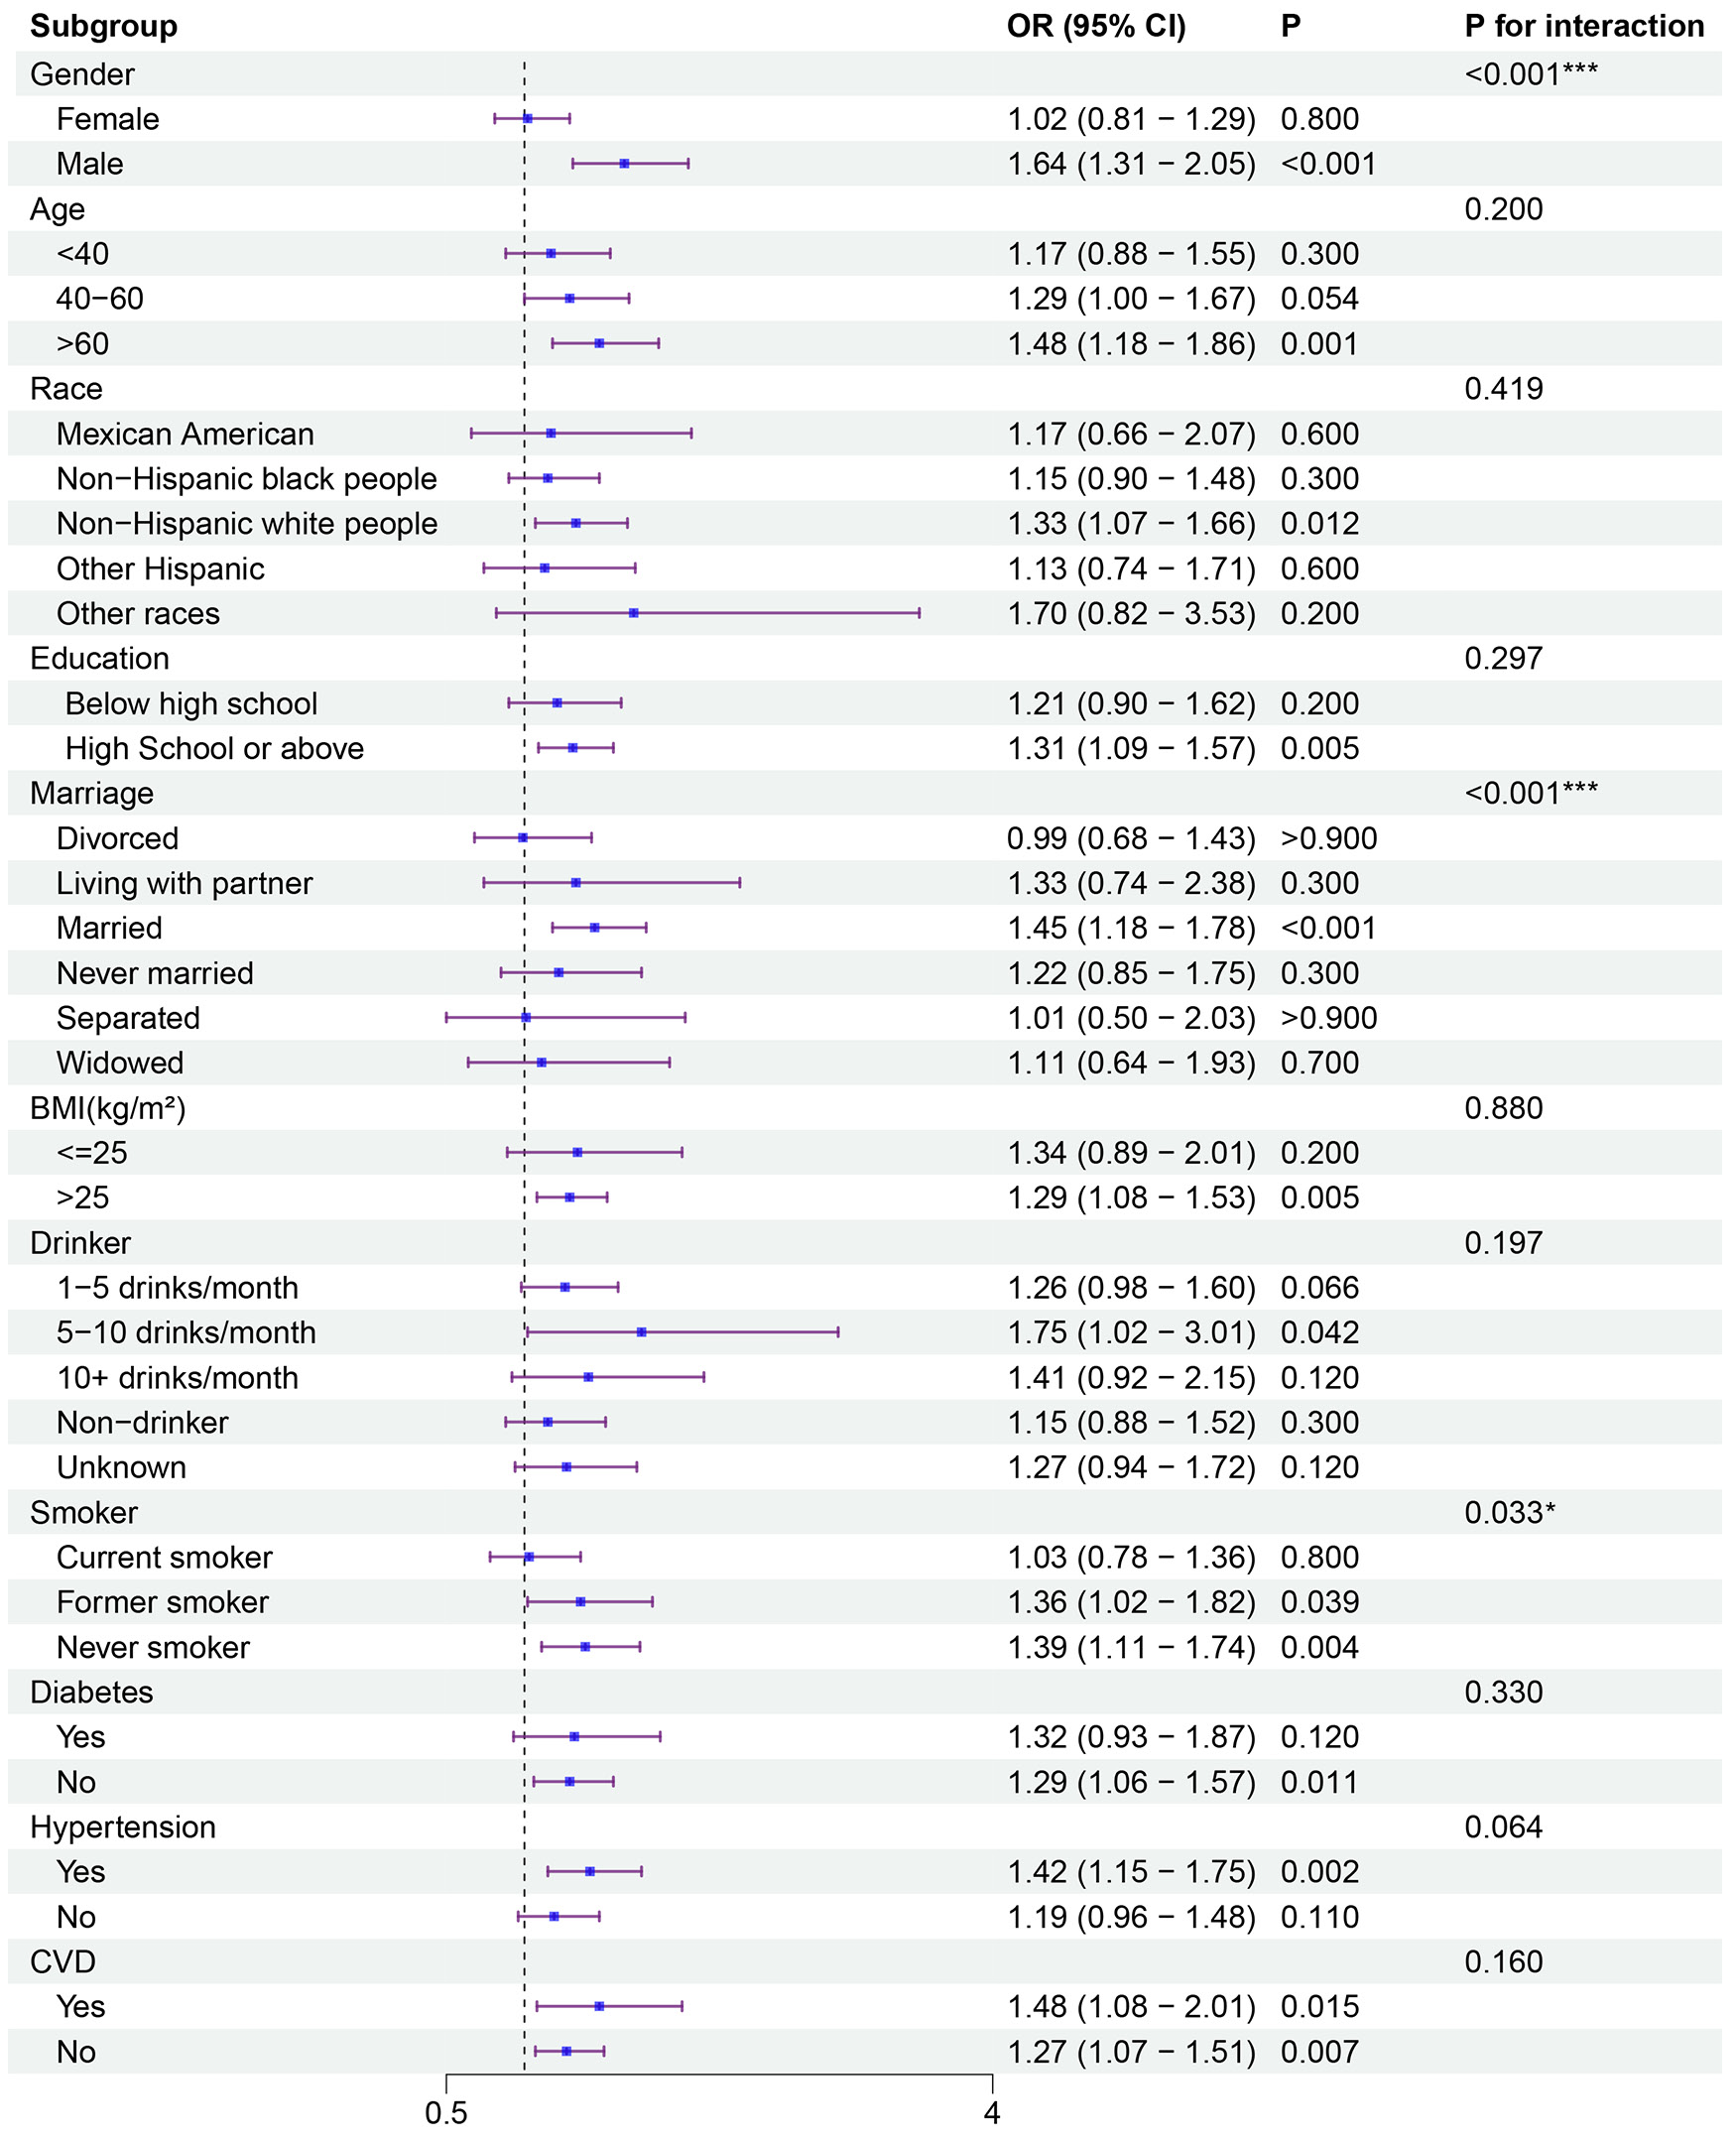
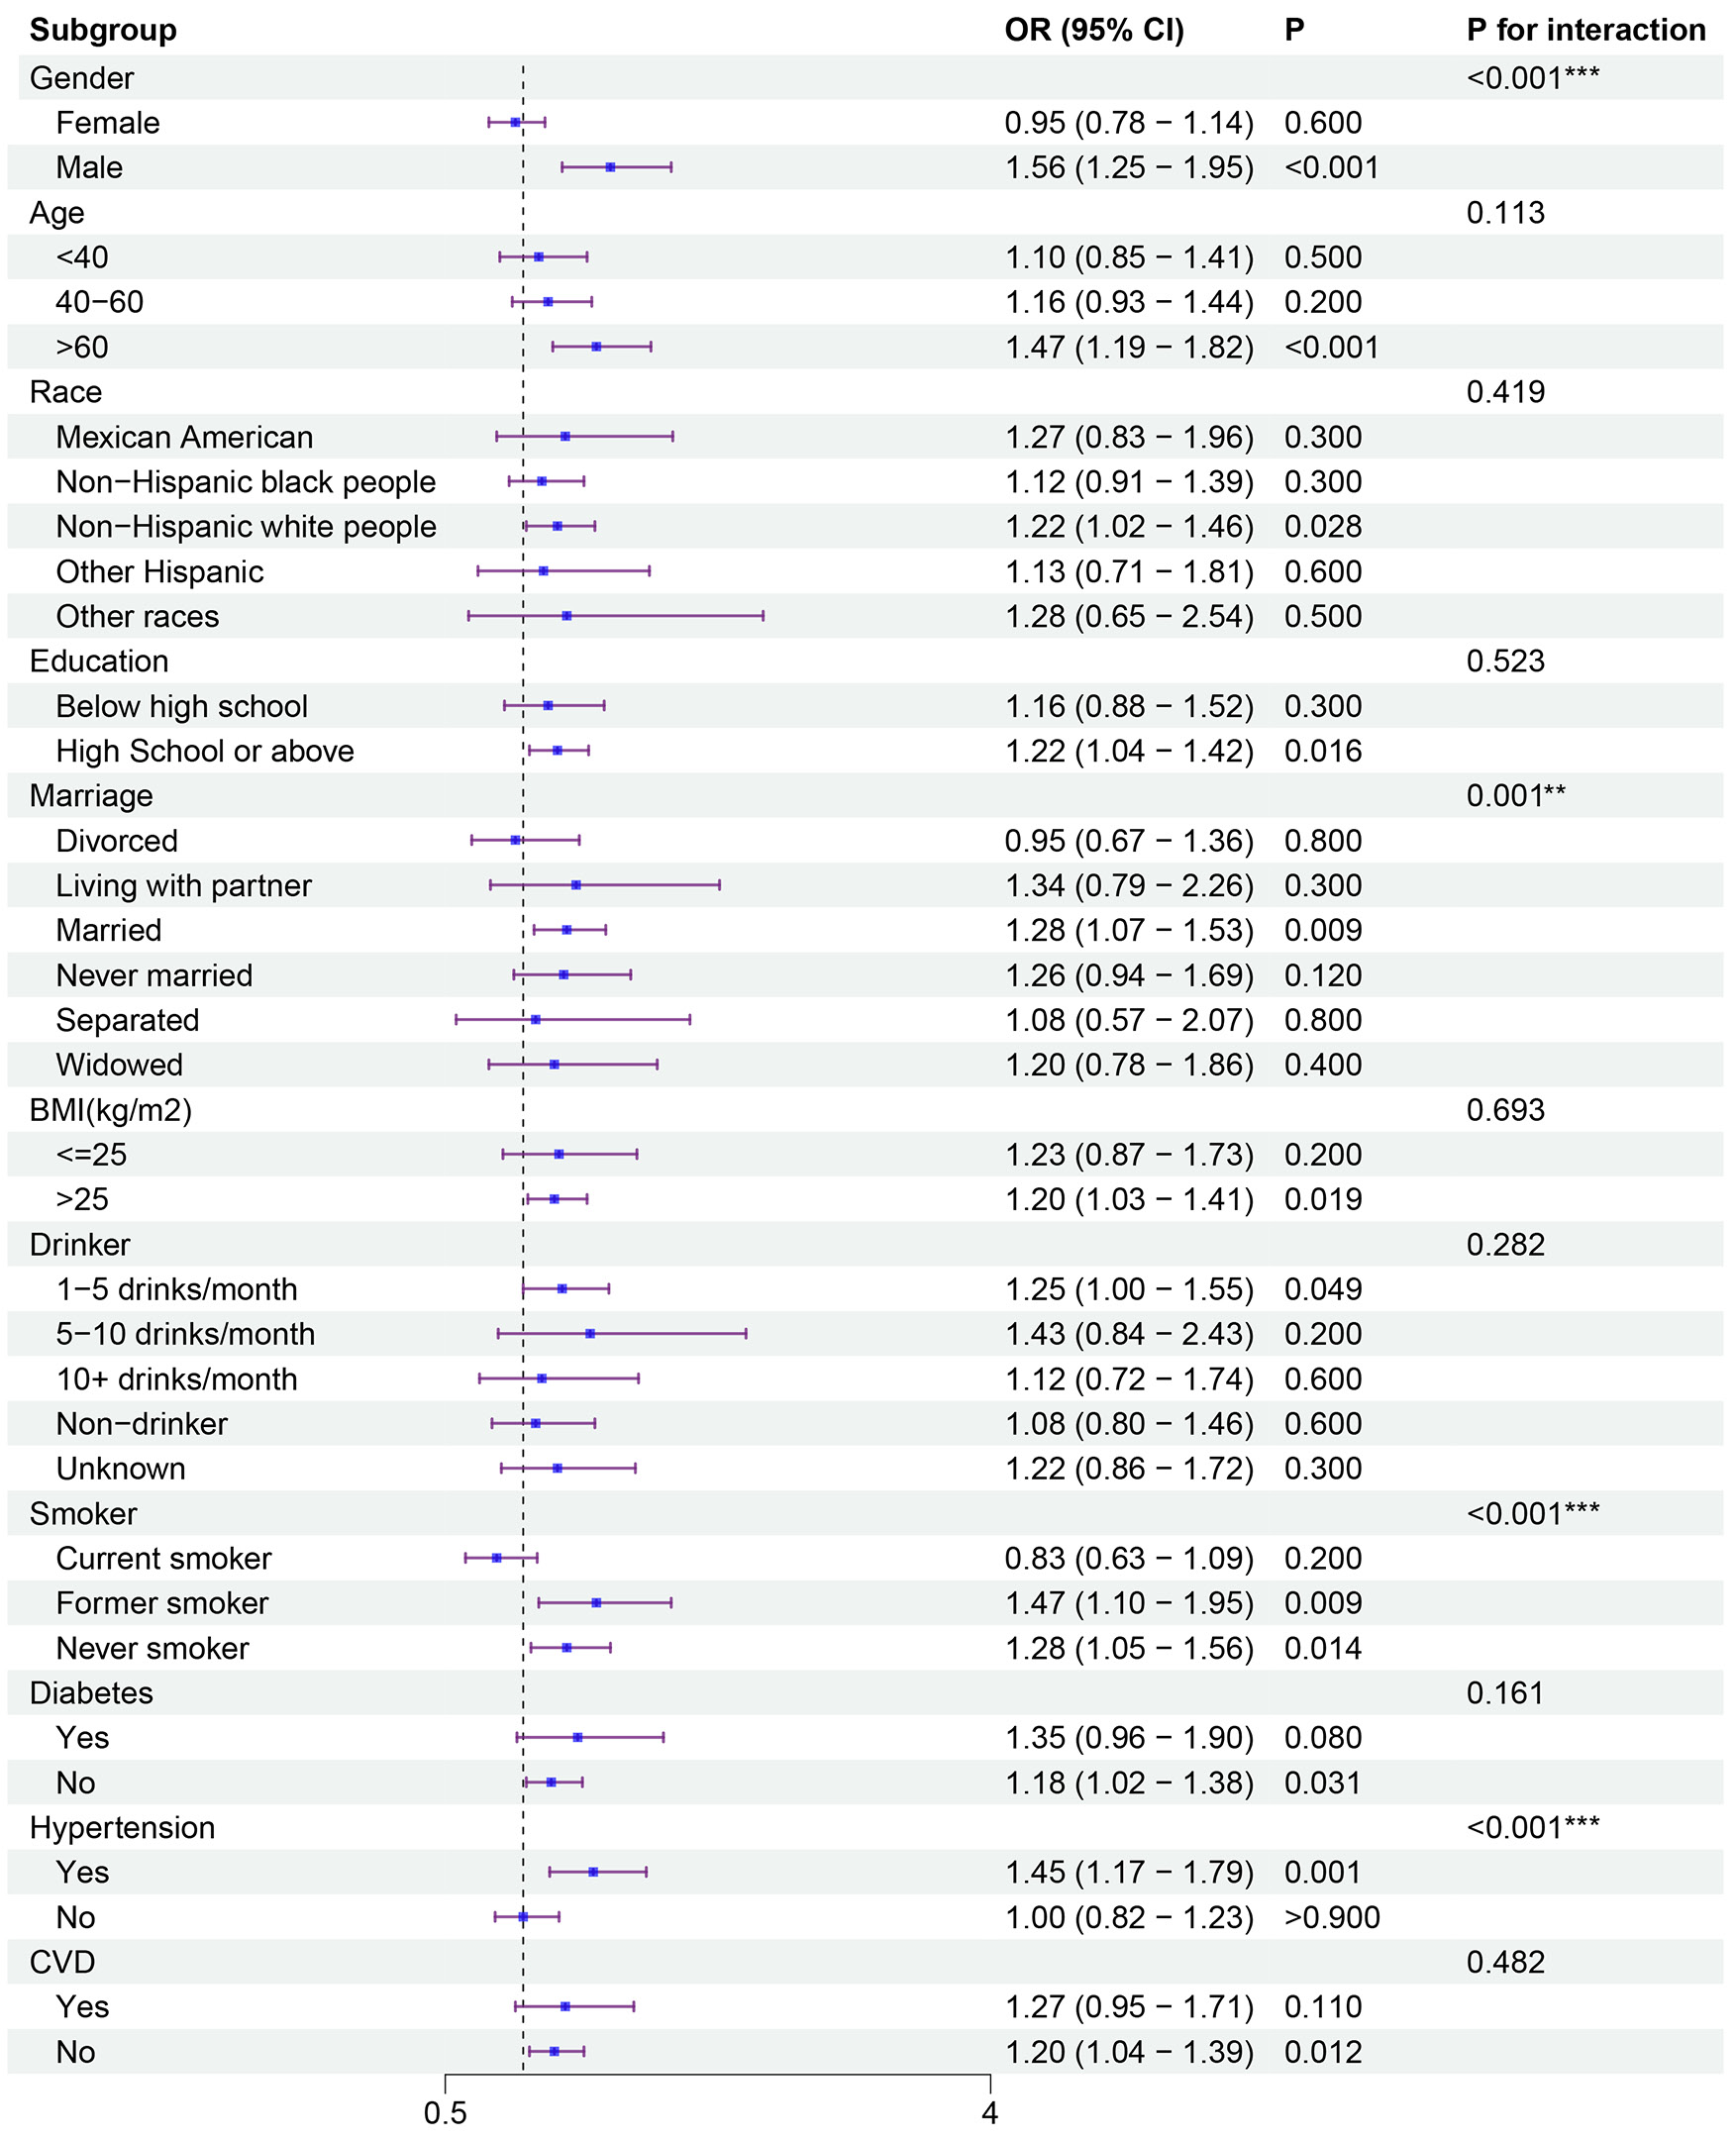
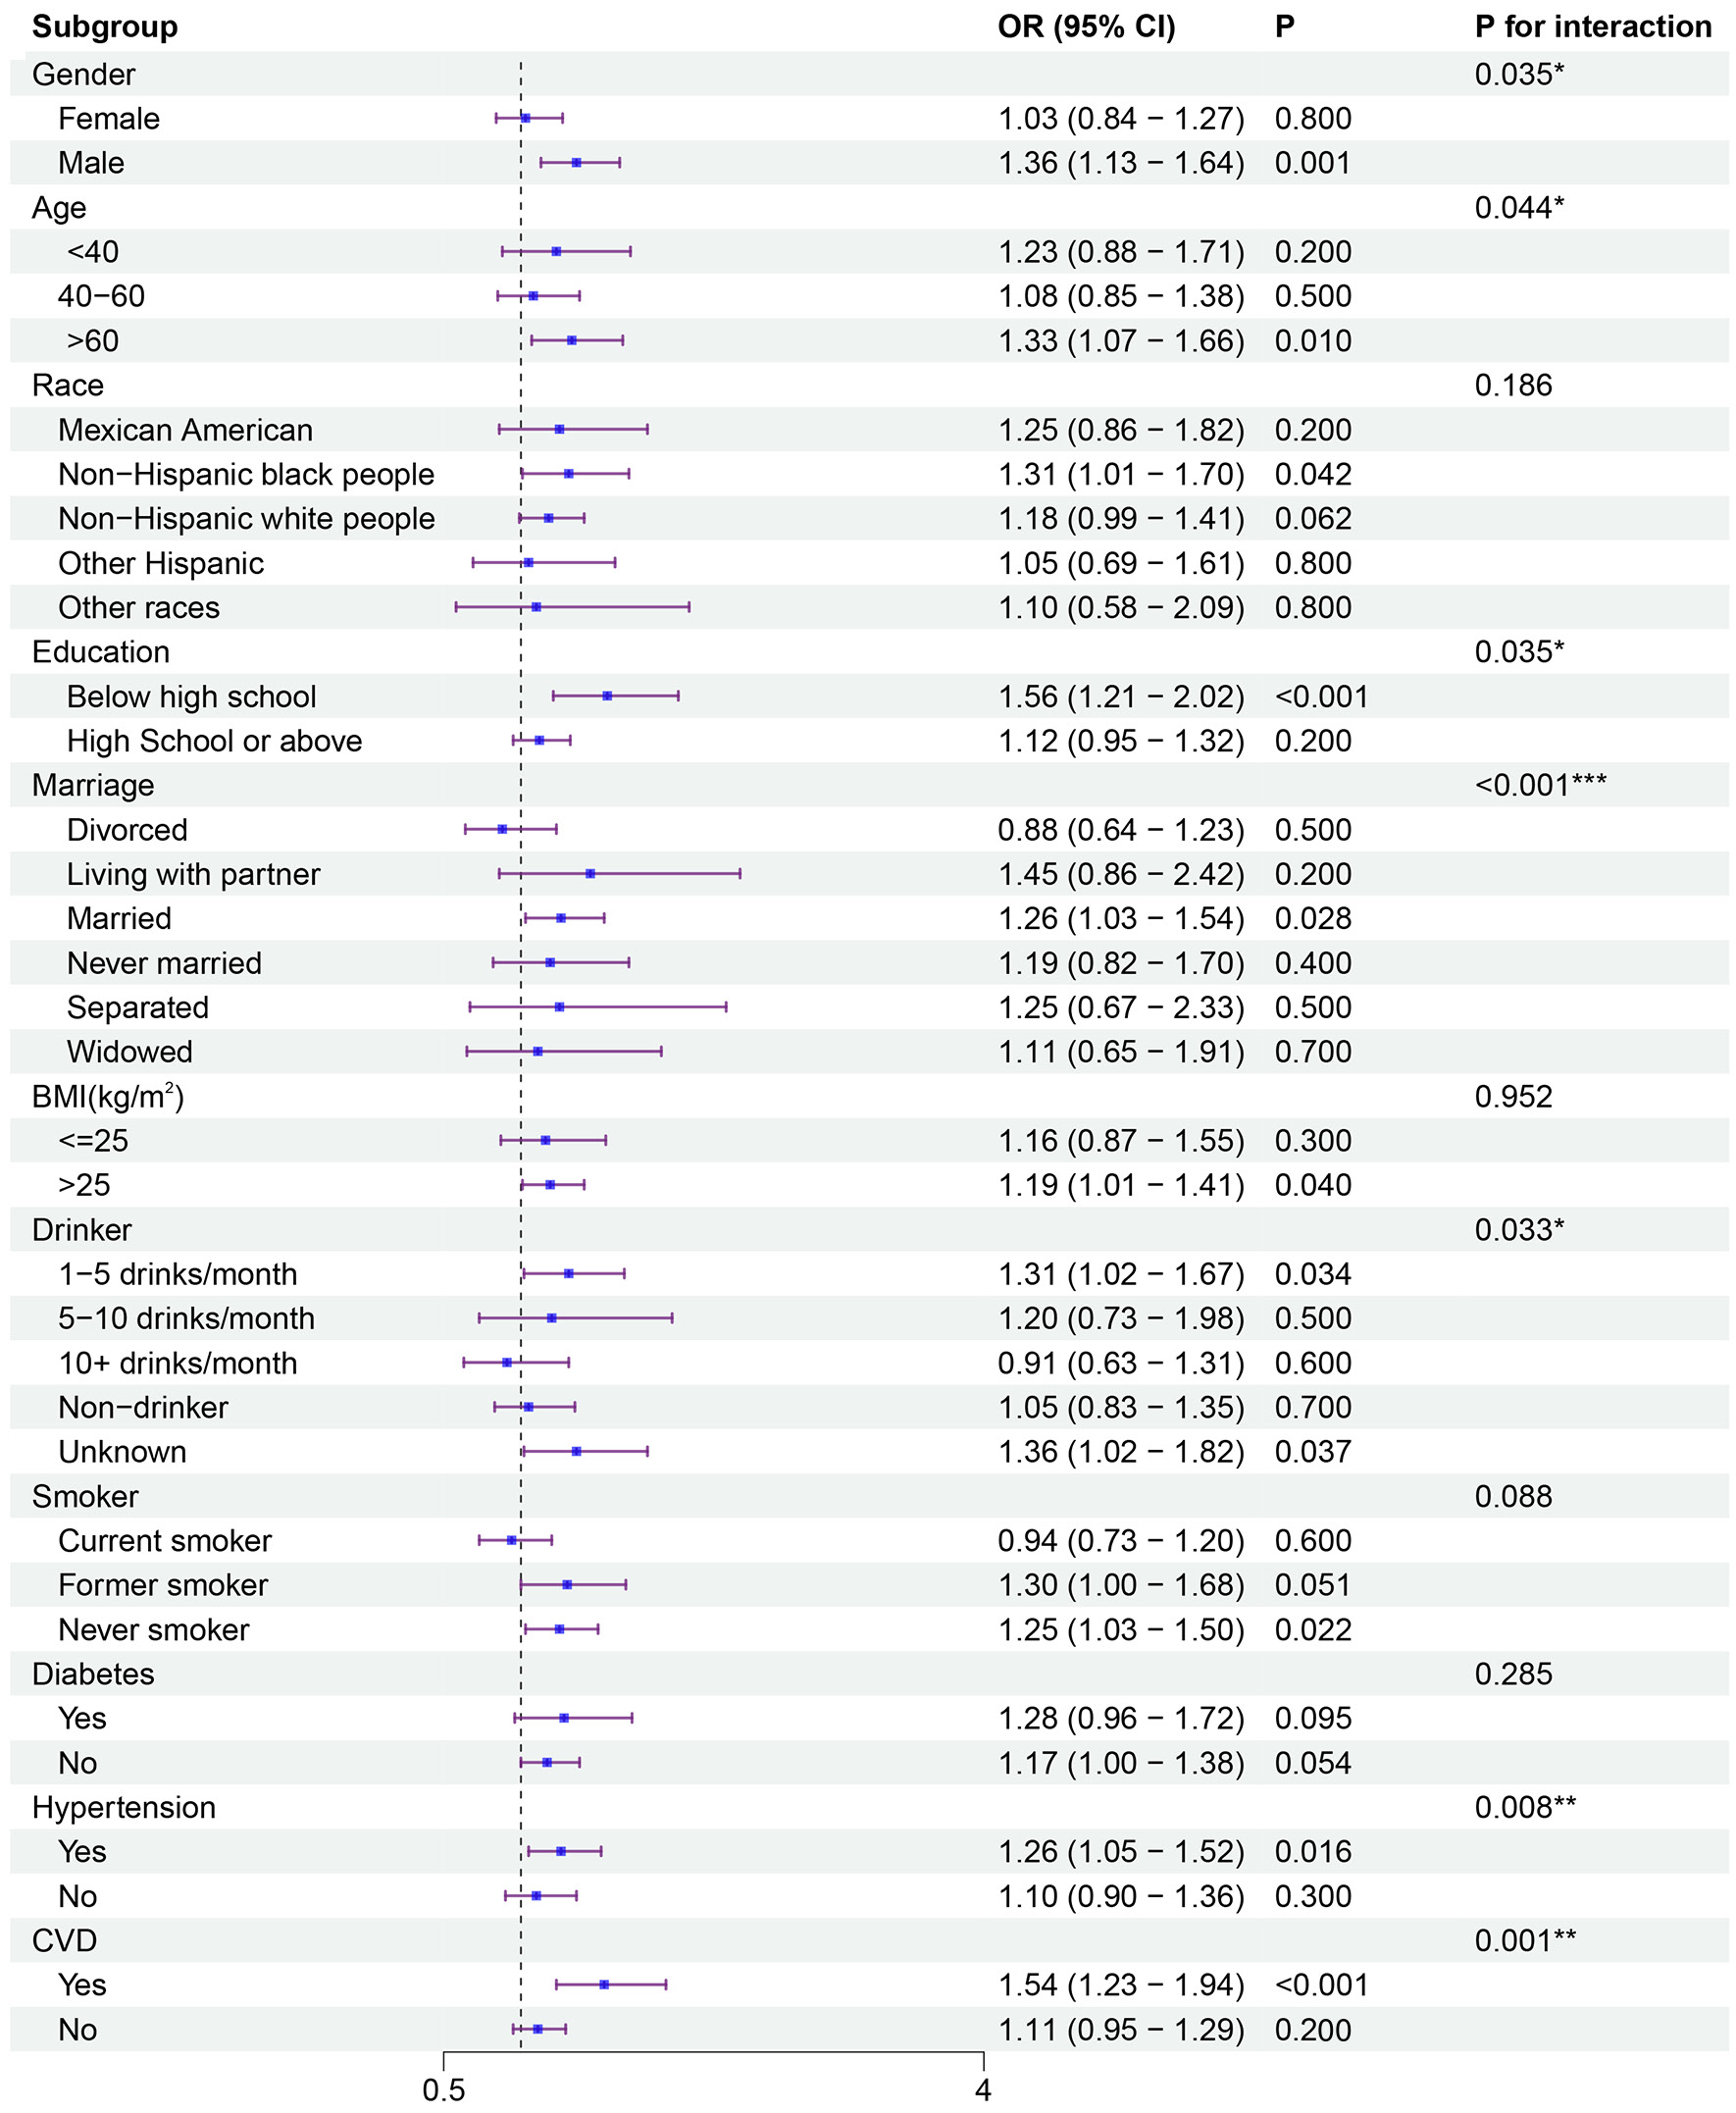
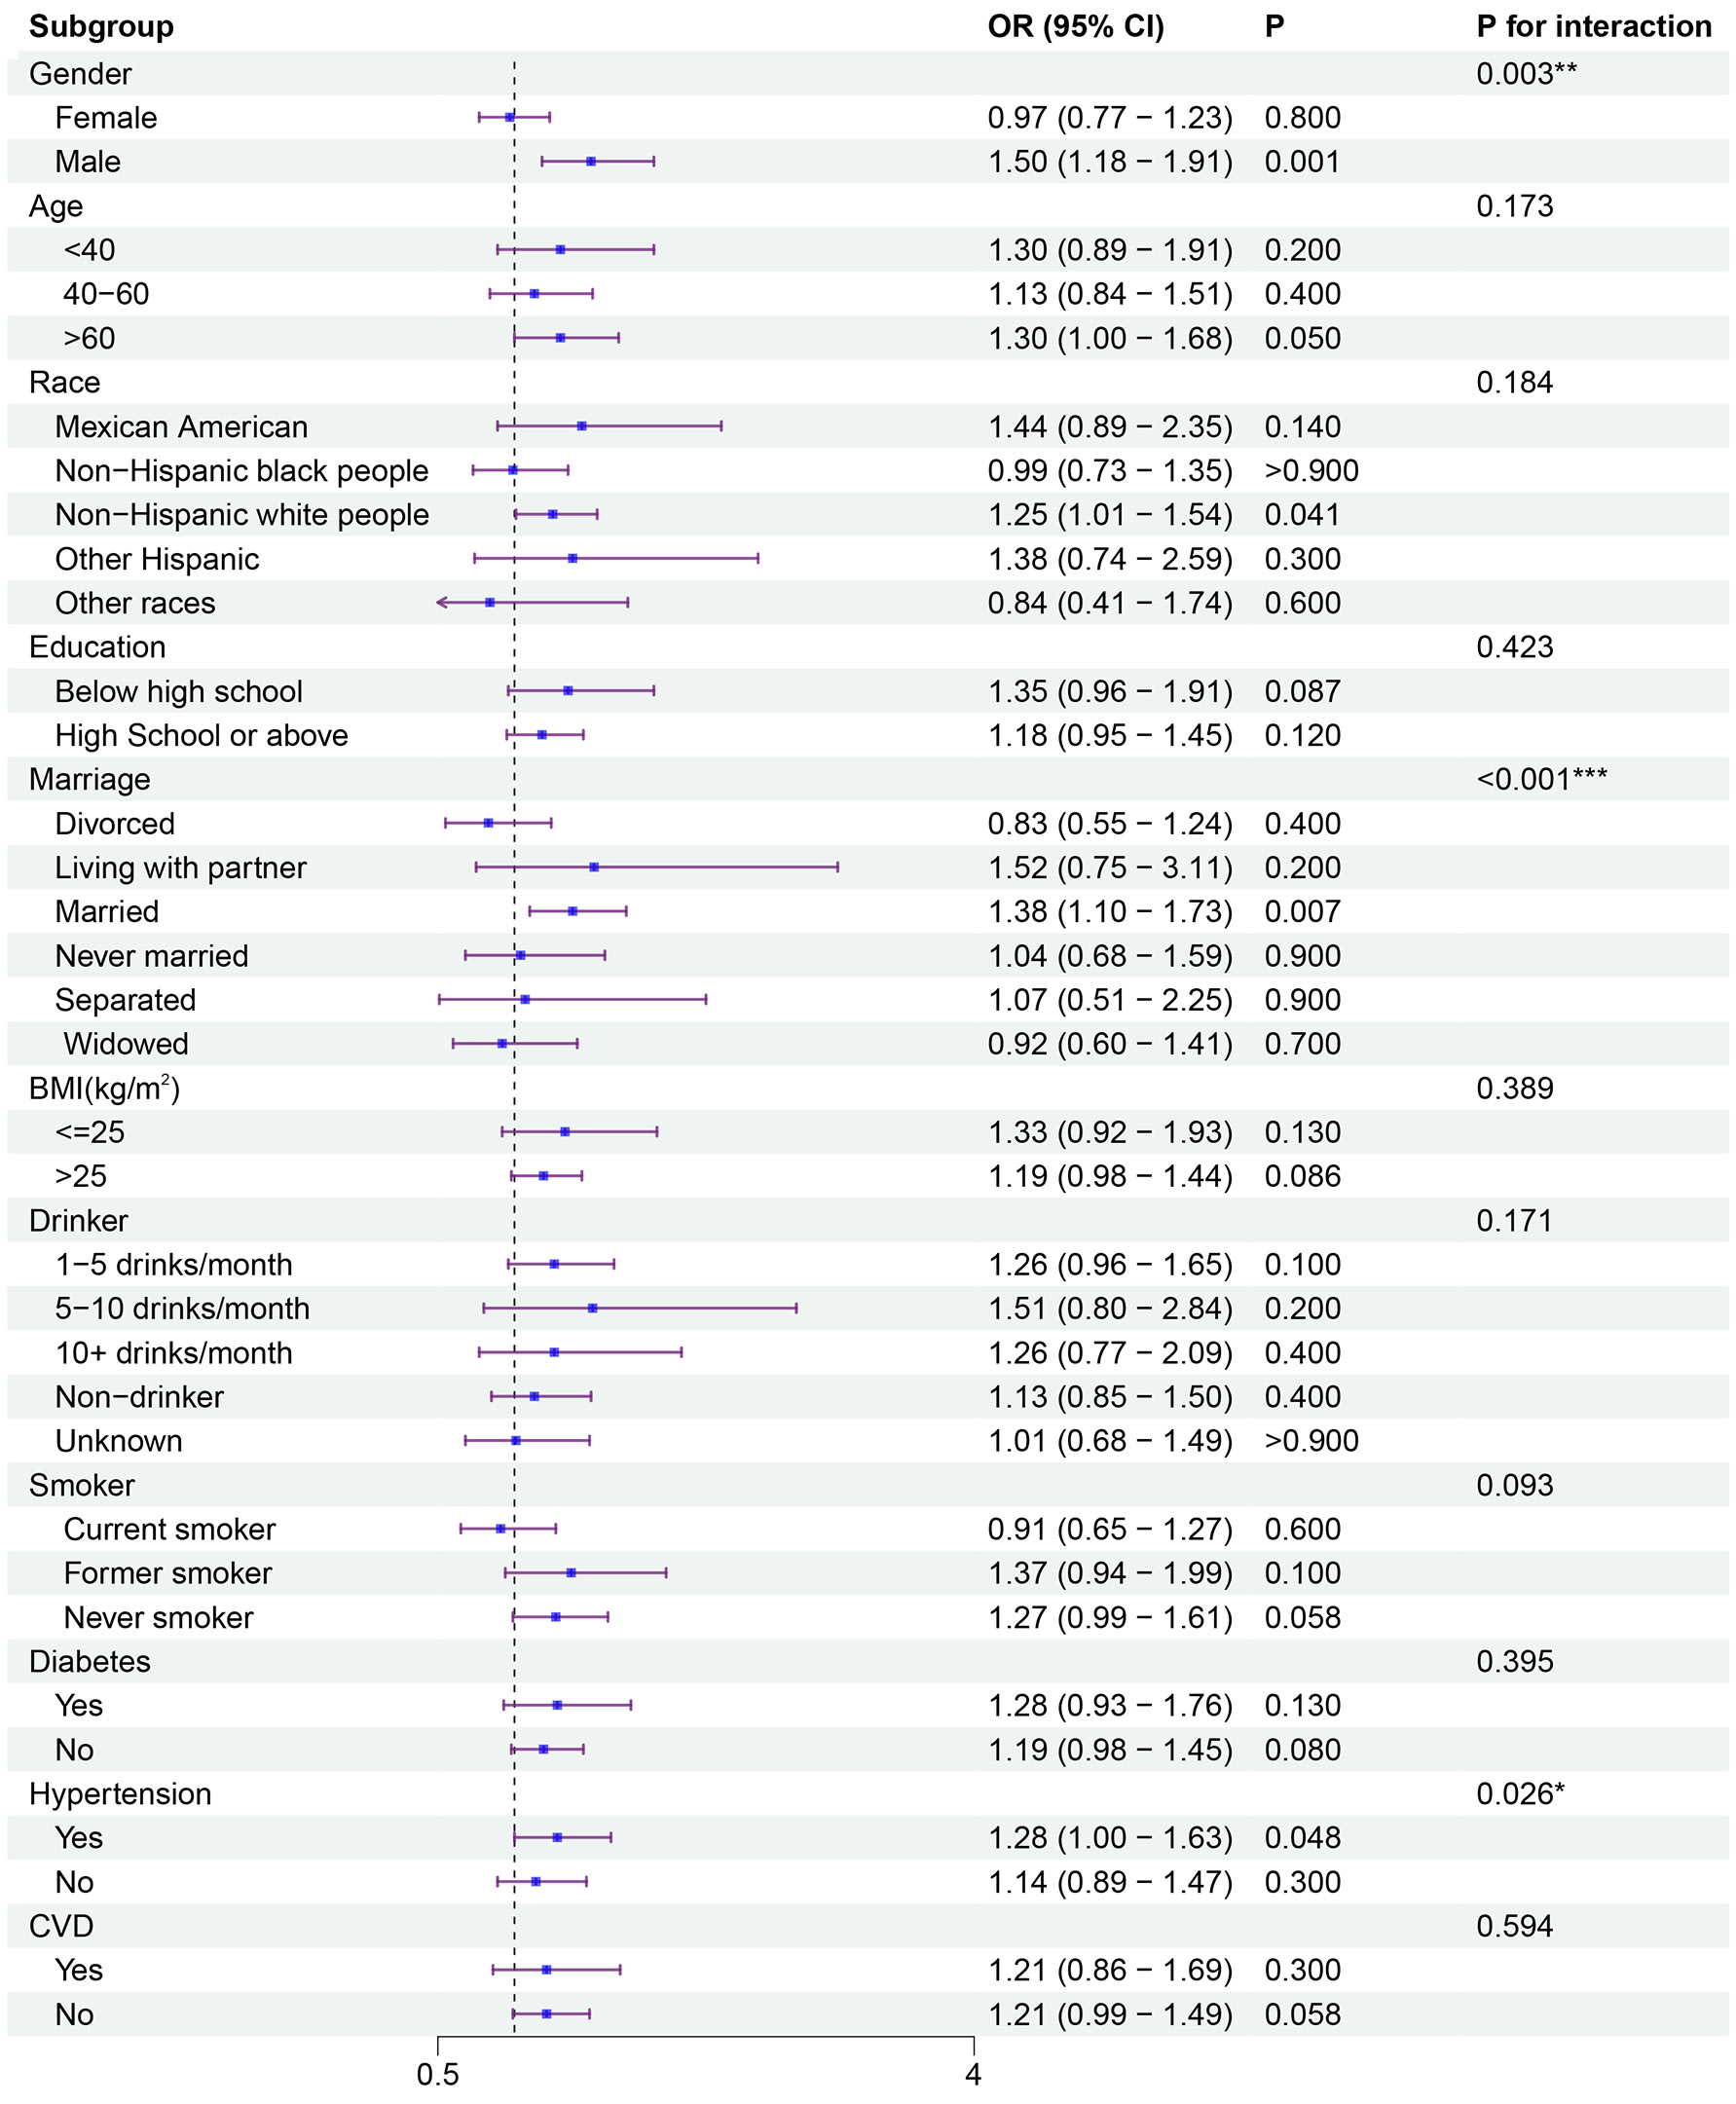
To assess associations across different population subgroups, subgroup analyses were performed (Figure 3, Figure 4, Figure 5, Figure 6). Significant interactions with sex and marital status were observed for all 4 indices. Smoking status interacted with MHR (p for interaction = 0.033) and NHR (p for interaction < 0.001), but not with LHR (p for interaction = 0.088) or PHR (p for interaction = 0.093). All 4 indices were associated with sleep disorders among males and married participants. Among never smokers, MHR, NHR, and LHR, but not PHR, showed significant associations.
Associations between HDL-related inflammatory indices and sleep duration
Regression models were used to examine the associations between HDL-related inflammatory markers (as continuous variables) and sleep duration. In Model 3, compared with the recommended sleep duration (7–9 h/day), log(NHR) was positively associated with long sleep duration (>9 h/day; OR = 1.39, 95% CI: 1.17–1.66) and short sleep duration (<7 h/day; OR = 1.06, 95% CI: 1.00–1.13). Log(MHR) was positively associated with long sleep duration (OR = 1.33, 95% CI: 1.10–1.61), whereas log(LHR) was positively associated with short sleep duration (OR = 1.10, 95% CI: 1.03–1.17). As illustrated in Table 3, there was no evidence of significant associations between log(PHR) and either short or long sleep duration.
Sensitivity analysis
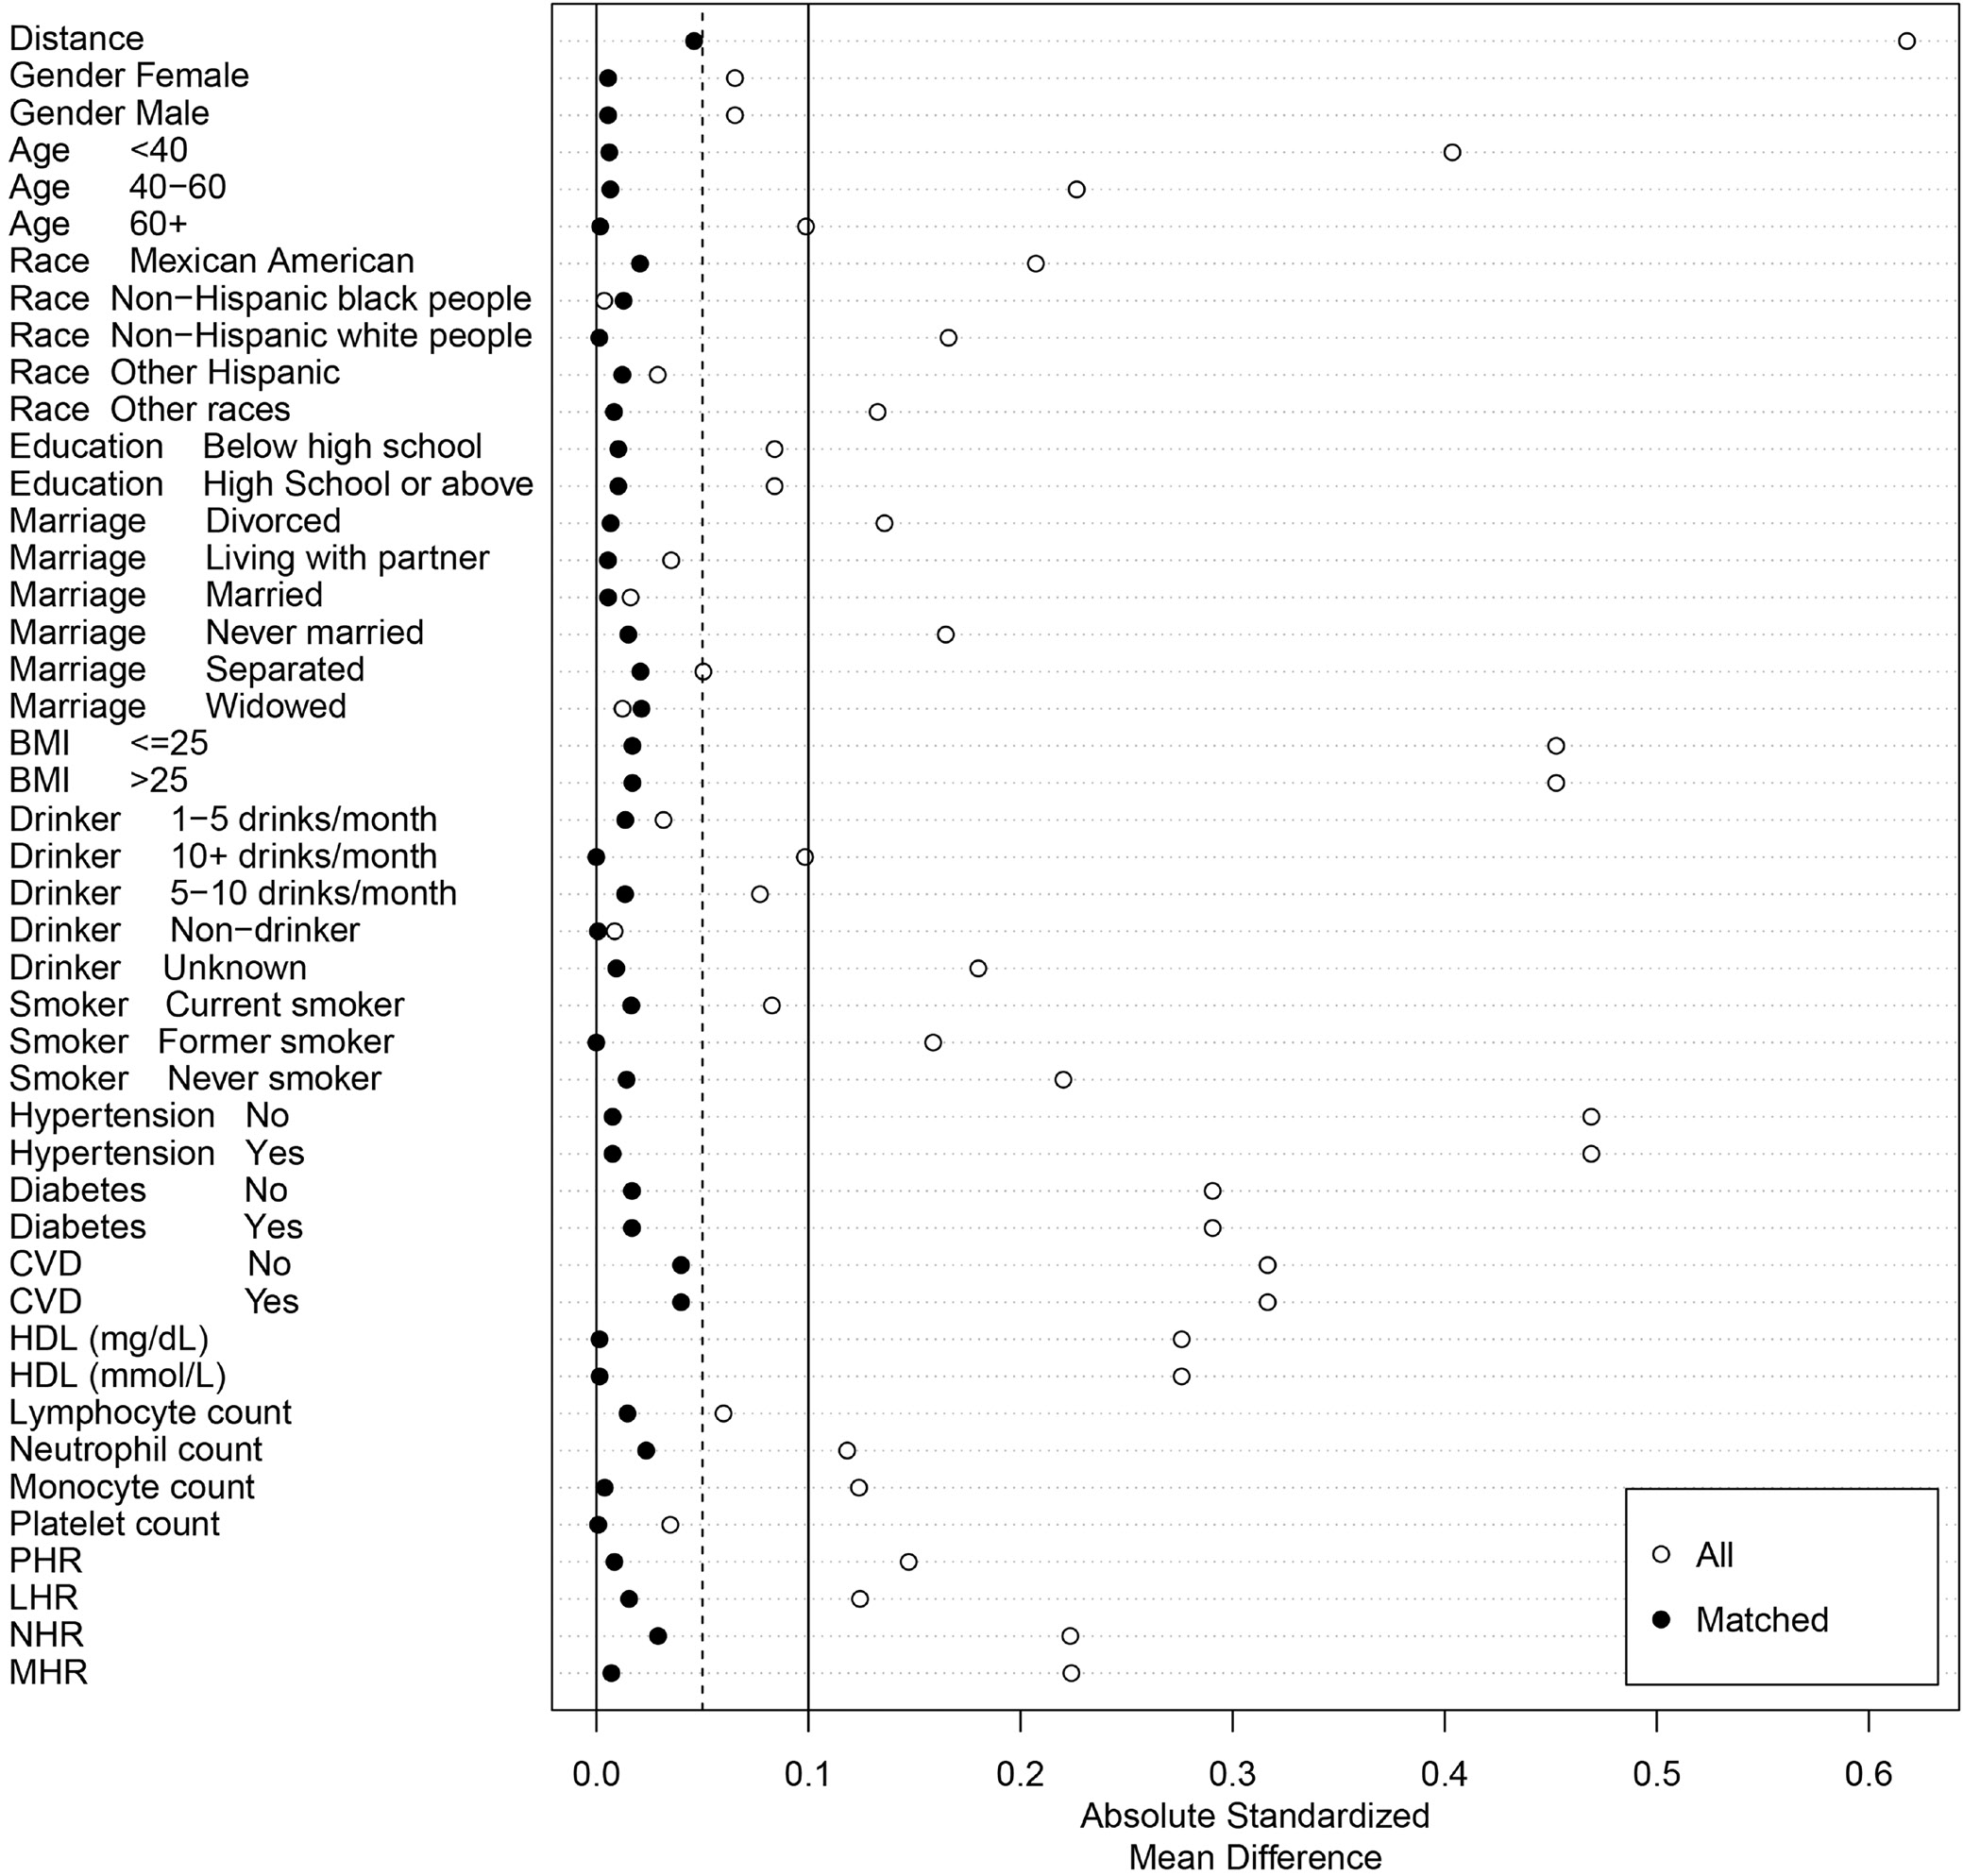
The robustness of the associations was examined using 3 sensitivity analyses. First, the primary analysis was repeated using unweighted data. In Model 3, log(MHR) (OR = 1.29, 95% CI: 1.13–1.47), log(NHR) (OR = 1.27, 95% CI: 1.12–1.45), and log(LHR) (OR = 1.29, 95% CI: 1.14–1.47) remained positively associated with the prevalence of sleep disorders, whereas no significant association was observed for log(PHR) (Supplementary Table 5). Second, PSM was employed to control for potential confounding (Figure 7). After matching, differences in covariates, including age, sex, marital status, race, BMI, smoking status, alcohol consumption, education level, diabetes, hypertension, and CVD, were successfully balanced between groups (Supplementary Table 6). Post-matching analyses indicated that log(MHR) (OR = 1.42, 95% CI: 1.16–1.73) and log(NHR) (OR = 1.25, 95% CI: 1.03–1.52) remained significantly associated with a greater likelihood of sleep disorders (Supplementary Table 7). Third, outliers of the exposure variables (log(MHR), log(NHR), log(LHR), and log(PHR)) were handled using the winsorization method, followed by regression analyses. In Model 3, positive associations were observed between sleep disorders and log(MHR) (OR = 1.30, 95% CI: 1.10–1.52), log(NHR) (OR = 1.21, 95% CI: 1.05–1.38), log(LHR) (OR = 1.18, 95% CI: 1.03–1.36), and log(PHR) (OR = 1.20, 95% CI: 1.02–1.43) (Supplementary Table 8).
Discussion
This study, based on NHANES data, examined the associations between HDL-related inflammatory biomarkers and sleep disorders. The results indicated that NHR, LHR, MHR, and PHR were positively associated with the likelihood of sleep disorders. Furthermore, RCS analyses confirmed linear relationships between these indices and the prevalence of sleep disorders. Subgroup analyses indicated that sex and marital status significantly modified the associations of all 4 indices with sleep disorders, whereas smoking status significantly modified the associations of MHR and NHR only. This study also found that elevated MHR was significantly associated with long sleep duration, whereas higher NHR was significantly associated with both long and short sleep durations. In addition, elevated LHR was significantly associated with short sleep duration.
Previous studies have mainly focused on the relationship between sleep disorders and abnormalities in lipid metabolism. Multiple cross-sectional studies revealed a characteristic lipid pattern in individuals with circadian rhythm disorders and sleep-related breathing disorders. This pattern is characterized by higher levels of triglycerides, total cholesterol, and low-density lipoprotein, together with lower HDL levels.18, 19 The underlying mechanism may be associated with impaired anti-inflammatory functions of HDL.20, 21 In contrast to previous research, this study not only confirmed reduced HDL levels in individuals with sleep disorders but also revealed a novel pattern of inflammatory imbalance involving platelets, neutrophils, and monocytes. By introducing multidimensional inflammatory ratios (MHR, NHR, LHR, and PHR), this study systematically elucidated the lipid–immune interaction network implicated in the pathophysiology of sleep disorders. This finding goes beyond the conventional framework based on individual lipid markers and may provide a valuable perspective for identifying novel clinical biomarkers.
This study suggests that HDL dysfunction, rather than a mere reduction in HDL concentration, might contribute to the development of sleep disorders through impaired anti-inflammatory activity. Existing evidence supports the role of HDL-related inflammatory indices as promising biomarkers for sleep disorders. Meng et al. demonstrated that MHR was positively associated with the severity of obstructive sleep apnea (OSA).22 Their findings indicate that MHR may serve as an independent biomarker for the diagnosis of OSA and may help improve clinical assessment and guide targeted intervention strategies.22 These findings are consistent with our results. Using a larger representative sample of American adults, our study demonstrated that MHR, NHR, and LHR were significantly associated with the development and progression of sleep disorders. These indices have also been proposed as early predictors of various diseases, including atherosclerosis, CVD, type 2 diabetes, and first-onset psychiatric disorders, all of which frequently co-occur with sleep disorders.23, 24, 25
The pathogenesis of sleep disorders is closely associated with immune status and systemic inflammation. During inflammation, activated immune cells (such as lymphocytes and neutrophils) regulate immune responses by releasing pro- and anti-inflammatory mediators.26 Neutrophils, as key effectors in the early stages of inflammation, release chemokines to recruit lymphocytes and monocytes, thereby triggering adaptive immune responses.27 Through HDL-mediated inflammatory regulation, monocytes constitute a dynamic network involved in oxidative stress responses, signal transduction, and lipid homeostasis.28 Interactions between HDL and immune cells, including neutrophils, monocytes, and lymphocytes, can impair the anti-inflammatory effects of HDL.29, 30, 31 Inflammation reduces the antioxidant and anti-inflammatory activities of HDL and increases lipid hydroperoxides, pro-inflammatory proteins, and oxidized high-density lipoprotein (HDLox), ultimately compromising its anti-inflammatory functions.32, 33, 34 The inflammatory microenvironment may induce immune dysfunction and disrupt neuroendocrine regulation, contributing to the onset and progression of neuropsychiatric disorders.35 Peripheral inflammatory cytokines cross the BBB, initiate neuroinflammation, and facilitate the development of mental illness.36 Persistent neuroinflammation leads to structural damage, such as neuronal atrophy and excessive synaptic pruning, and disrupts hypothalamic–pituitary–adrenal (HPA) axis regulation. Consequently, neuroendocrine dysfunction may impair circadian rhythm regulation, thereby contributing to the development of sleep disorders.27
Subgroup analyses indicated significant interactions with sex and marital status for all 4 indices, whereas smoking status interacted significantly only with MHR and NHR. Among never smokers, MHR, NHR, and LHR, but not PHR, were significantly associated with sleep disorders. This finding may reflect 2 intersecting biological mechanisms: 1) stronger associations in males may be related to the testosterone–estrogen balance. Animal studies have reported that testosterone can enhance neutrophil chemotaxis by upregulating the TLR4/NF-κB signaling pathway.37 Estrogen can inhibit interleukin (IL)-6 secretion from monocytes, potentially providing a protective effect in females.38 These results suggest that sex-specific cut-off values should be established for inflammatory indices when used as biomarkers. 2) Stronger associations in married individuals may reflect the impact of marriage-related stress on immune homeostasis. Chronic social stress can promote the differentiation of hematopoietic stem cells in the bone marrow toward pro-inflammatory monocytes and enhance platelet aggregation via HPA axis activation.39 Notably, this “social stress–inflammation amplification” effect may be particularly pronounced in ostensibly healthy individuals (such as non-smokers). This might be due to the absence of the anti-inflammatory effects of nicotine on α7 nicotinic acetylcholine receptors.40 Nonetheless, the anti-inflammatory effects of nicotine represent a double-edged sword. Its mechanism involves complex neuroimmune interactions. Although it shows therapeutic potential under certain pathological conditions, its clinical application remains limited. Advances in chemical modification or targeted drug delivery technologies are needed to overcome this barrier.
Sleep duration can modulate the immune system, and growing evidence suggests a relationship between sleep duration and inflammatory biomarkers.41, 42 Prior research has indicated that blood cell-based inflammatory markers, such as the systemic immune-inflammation index, white blood cell count, neutrophil count, and the neutrophil-to-lymphocyte ratio, may mediate the relationship between sleep duration and cognitive decline.43 The present study observed distinct association patterns between MHR, NHR, and LHR (which reflect the dynamic activity of the immune–metabolic axis) and sleep duration, suggesting that this axis may play heterogeneous roles in the regulation of sleep-related inflammation.44 Specifically, elevated MHR was associated with longer sleep duration, whereas higher NHR was related to both short and long sleep durations. In contrast, elevated LHR was associated with shorter sleep duration.
The association between prolonged sleep duration and elevated inflammatory markers may reflect underlying pathological conditions, such as sleep fragmentation, OSA, or the early asymptomatic stages of neurodegenerative diseases.45, 46 Notably, prolonged but poor-quality sleep, especially when driven by sleep fragmentation or OSA, can induce intermittent hypoxia and tissue stress. These stressors may activate the HPA axis and sympathetic nervous system (SNS), leading to increased release of chemokines (such as MCP-1/CCL2) and enhanced mobilization of monocytes from the bone marrow into peripheral tissues.47 Once activated, monocytes can differentiate into macrophages and release pro-inflammatory cytokines (such as IL-6 or tumor necrosis factor alpha (TNF-α)), contributing to a chronic low-grade inflammatory state.48 This pathway may be a key source of elevated inflammatory biomarkers among long sleepers.
In addition to monocyte-driven inflammation, the elevated NHR values observed in both short and long sleep durations underscore the high sensitivity of neutrophils, which are rapid responders of innate immunity, to sleep disorders. Short sleep duration is associated with heightened sympathetic activity and hyperactivation of the HPA axis. Repeated activation of this system may trigger pro-inflammatory responses and elevate circulating levels of inflammatory markers.6 Short sleep duration can strongly activate the SNS and trigger catecholamine release, thereby rapidly mobilizing neutrophil reserves from the bone marrow into the circulation.49 In contrast, prolonged sleep, especially with coexisting OSA or sleep fragmentation, may lead to intermittent hypoxia and tissue stress, potentially activating inflammatory signaling pathways such as nuclear factor kappa-light-chain-enhancer of activated B cells (NF-κB). This, in turn, may stimulate the production of granulocyte colony-stimulating factor and promote neutrophil proliferation and activation.50 Activated neutrophils can release pro-inflammatory effectors, including myeloperoxidase and neutrophil extracellular traps. Therefore, neutrophils may serve as a key cellular bridge linking sleep duration and systemic inflammation.
The association between elevated LHR and short sleep duration may reflect complex interactions between adaptive immune dysregulation and stress resulting from sleep deprivation. Short sleep can chronically activate the HPA axis and SNS, exerting bidirectional effects on lymphocyte subsets: 1) potentially suppressing the function of certain anti-inflammatory regulatory T cells51; 2) promoting the activation of, or altering the distribution of, pro-inflammatory T-cell subsets such as Th1 and Th1752; and 3) impairing the cytotoxic activity of natural killer (NK) cells, although changes in their numbers may be complex.53 Alterations in the proportions and functions of these lymphocyte subsets may collectively disrupt immune homeostasis and promote a pro-inflammatory environment.54 As a composite marker, an elevated LHR may reflect these complex dynamic changes in lymphocytes. Although these pathways offer plausible biological explanations, causal relationships require experimental validation through sleep intervention studies combined with immunophenotyping and animal models investigating the time-dependent migration of immune cells.
Using the NHANES database, this study enrolled a nationally representative adult population (n = 23,045). The rigorous sampling design and standardized data collection procedures substantially enhanced the generalizability of the findings. Compared with previous small-scale or single-center studies, the large sample size in our study not only improved statistical power but also minimized the risk of bias due to population heterogeneity. This was the first study to systematically examine the association between HDL-related inflammatory biomarkers and sleep disorders. Our study extended beyond the traditional focus on HDL-C concentration and may offer new insights into the impact of lipid dysfunction on the pathophysiology of sleep disorders. By integrating multiple analytical approaches, including regression, RCS, subgroup, and interaction analyses, this study uncovered complex association patterns (such as threshold effects and population specificity) between HDL-related inflammatory biomarkers and sleep disorders, thereby avoiding the limitations of conclusions based on a single analytical method. Robust statistical methods were employed throughout the study. Sensitivity analyses and PSM were applied to balance intergroup confounding and validate the stability of the associations involving MHR, NHR, LHR, and PHR. To minimize the impact of residual confounding factors, a multivariable logistic regression model was employed, adjusting for demographic characteristics, lifestyle factors, and metabolic disorders.
Limitations of the study
Nonetheless, some limitations should be acknowledged. First, although statistical analyses identified associations between HDL-related inflammatory markers and sleep disorders, the cross-sectional design precluded the inference of temporal or causal relationships. Future prospective cohort studies or Mendelian randomization studies are required to explore these causal relationships. Second, the definition of sleep disorders in this study primarily relied on self-reported questionnaires, lacking support from objective diagnostic measures. This approach has certain limitations, such as misclassification due to subjective bias, inaccurate perception of sleep status, and difficulty distinguishing sleep disorder subtypes. These factors may affect the internal and external validity, as well as the generalizability, of the findings. To obtain more reliable and comprehensive assessments and enhance clinical applicability, future research should incorporate objective measurements, such as polysomnography for diagnostic evaluation and actigraphy for long-term monitoring, to validate and complement self-reported data. Third, a major limitation of this study is the performance of multiple statistical hypothesis tests. While this approach facilitated the exploration of multiple aspects of our research question, it also increased the risk of type I errors. Given the exploratory nature of the study, we did not apply formal correction for multiple comparisons. Consequently, we strongly urge readers to exercise caution when interpreting the statistically significant findings reported in this study and to recognize that some of the observed associations may represent false-positive findings arising by chance. Future confirmatory studies utilizing independent samples with predefined primary hypotheses and appropriate correction methods are warranted to verify the reliability of these findings.
Conclusions
This study identified a linear association between HDL-related inflammatory biomarkers and sleep disorders. Significant interactions with sex and marital status were observed. Moreover, these indices were also associated with sleep duration. These findings may provide new insights into the inflammatory mechanisms underlying sleep disorders and highlight the potential role of HDL-related inflammatory indices in preventive medicine, particularly in informing early intervention strategies.
Supplementary data
The supplementary materials are available at https://doi.org/10.5281/zenodo.17737165. The package contains the following files:
Supplementary Table 1. Results of normality and homogeneity of variance tests for continuous variables.
Supplementary Table 2. χ2 test expected frequencies.
Supplementary Table 3. Statistical assessment of collinearity in regression analysis.
Supplementary Table 4. Box–Tidwell test results for log odds linearity.
Supplementary Table 5. Association between HDL-related inflammation index and sleep disorders (unadjusted model).
Supplementary Table 6. Baseline characteristics of participants after PSM (n = 7,728).
Supplementary Table 7. Association between HDL-related inflammation index and sleep disorder after PSM.
Supplementary Table 8. Association between HDL-associated inflammatory markers and sleep disorders after outlier treatment by winsorization.
Supplementary File 1. RCS and PSM analysis code.
Data Availability Statement
Data sharing does not apply to this article, as all data are already included in the manuscript and its supplementary files.
Consent for publication of personal information
Not applicable.
Use of AI and AI-assisted technology
Not applicable