


Abstract
Background. Malnutrition is common among patients with heart failure (HF), yet accurate assessment of nutritional status in this population remains challenging. The phase angle (PhA) derived from bioelectrical impedance analysis (BIA) has been proposed as a marker of nutritional status at the cellular level; however, concerns persist regarding its dependence on hydration status.
Objectives. This study aimed to assess the association between HF and nutritional status, with particular emphasis on phase angle (PhA) measured at 50 kHz, and to evaluate its diagnostic value in comparison with other indices, including the Nutritional Risk Screening 2002 (NRS 2002), body mass index (BMI), and selected laboratory parameters.
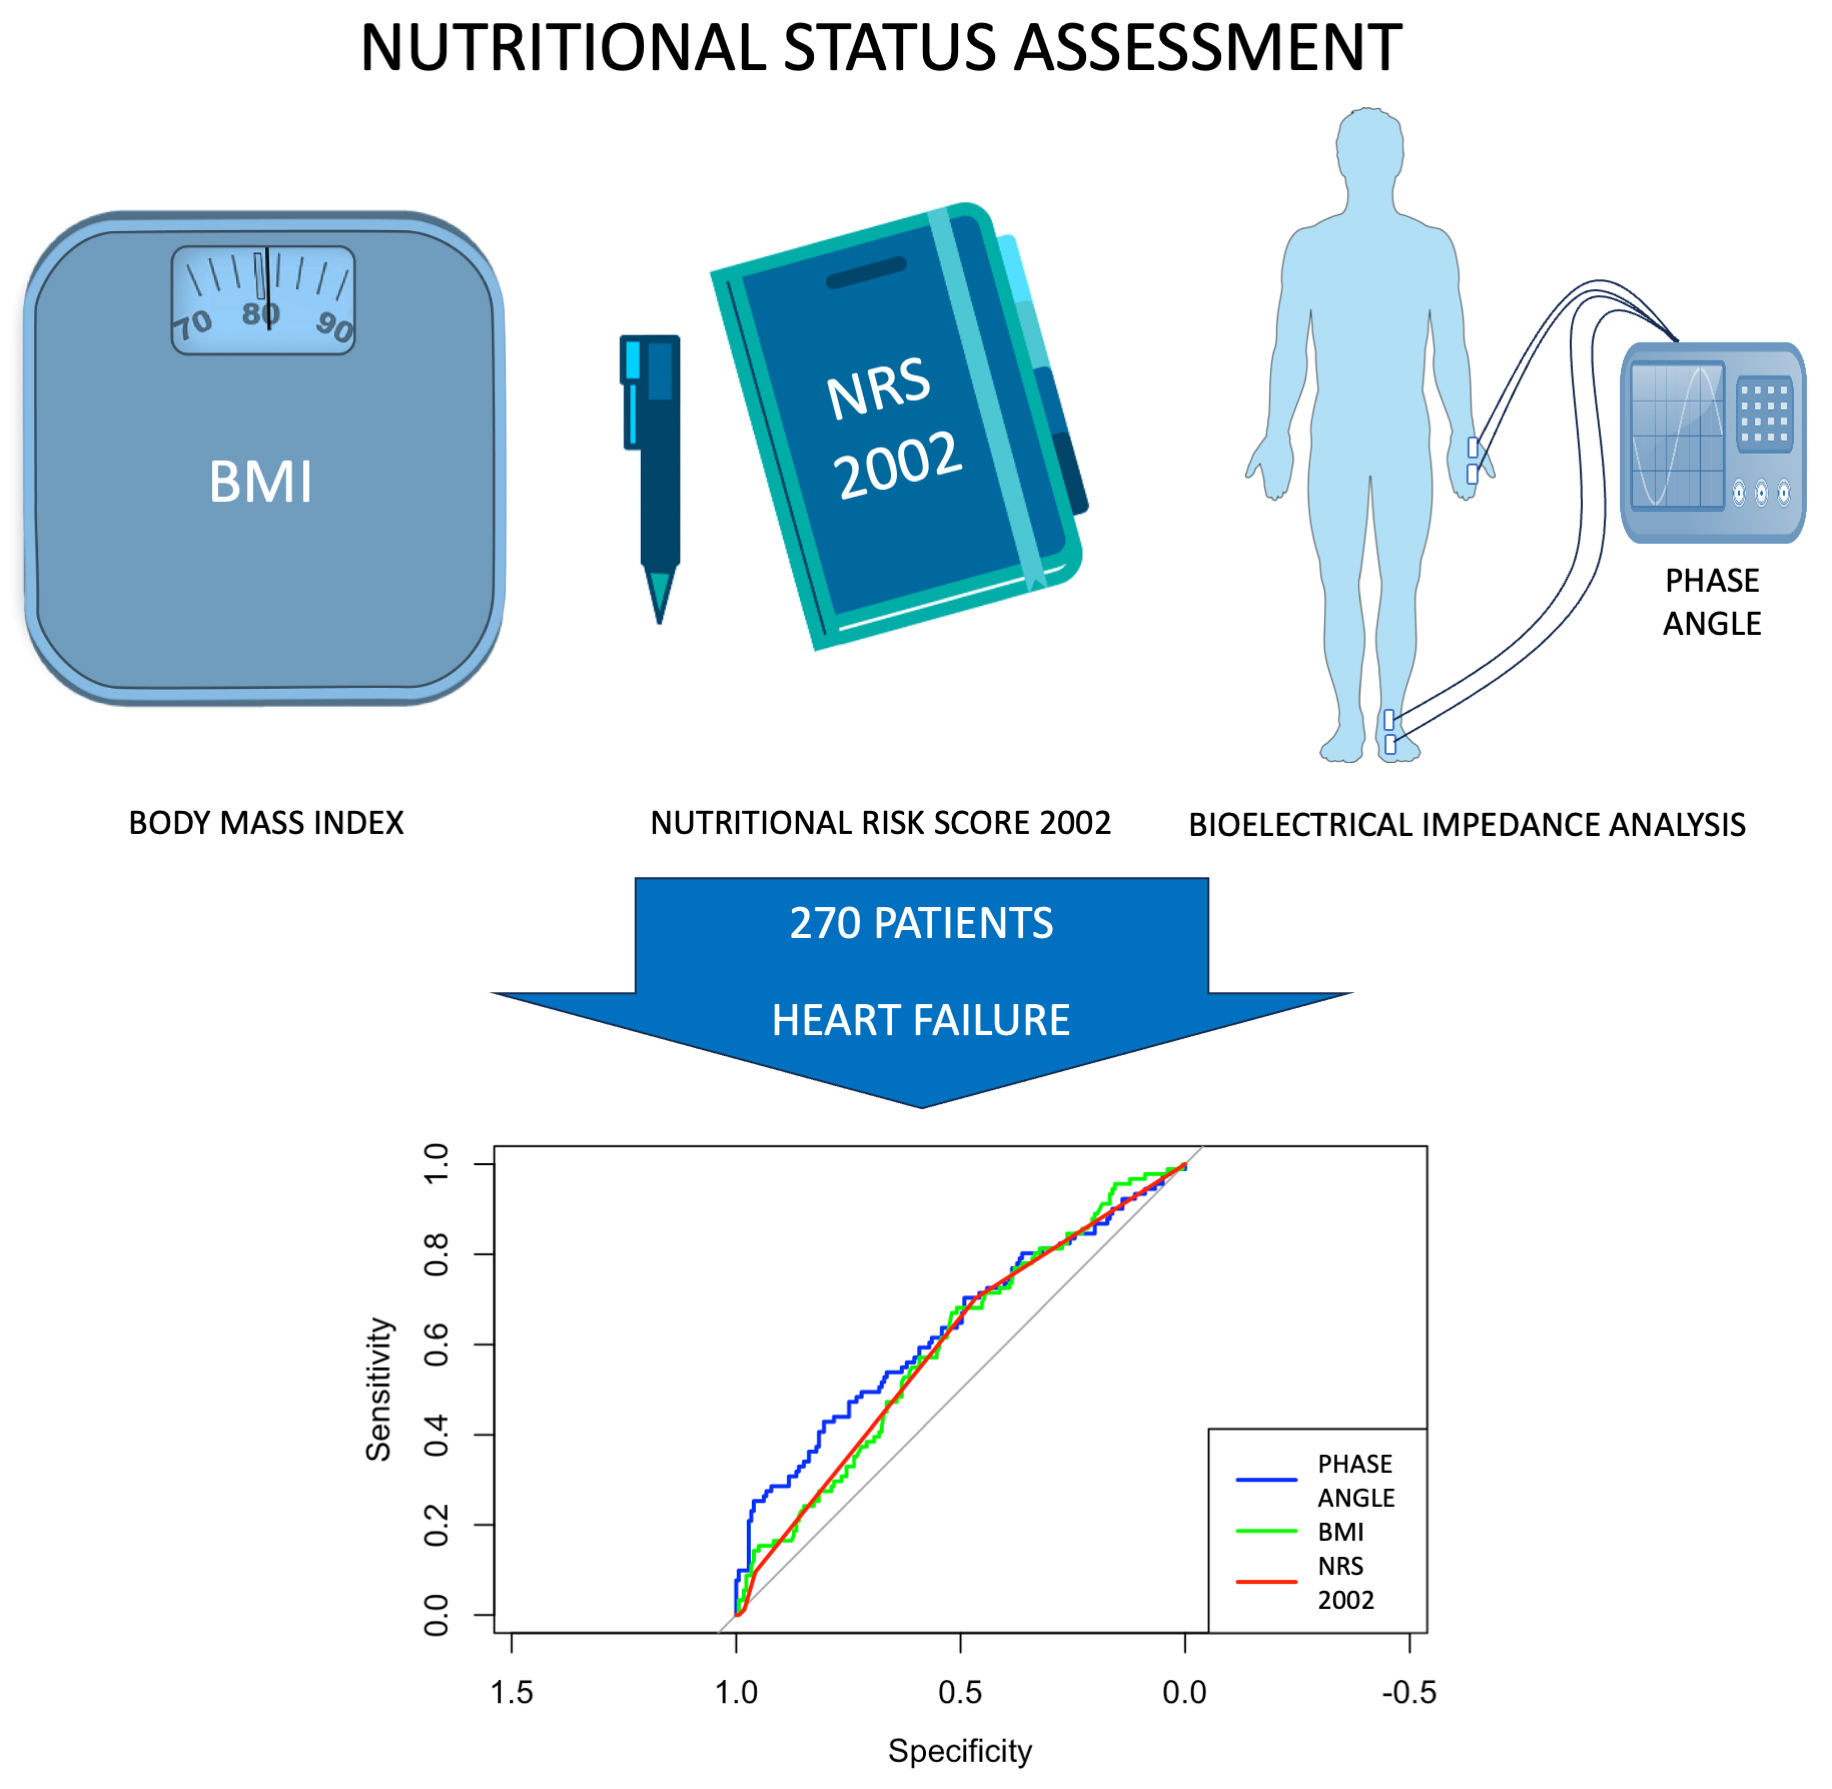
Materials and methods. In this cross-sectional study, 270 patients with chronic coronary syndrome were evaluated using laboratory tests, anthropometric measurements, the NRS 2002, and BIA. Patients were stratified according to HF status. Statistical analyses included parametric and non-parametric tests, correlation analyses, multivariable logistic regression models, and receiver operating characteristic (ROC) curve analysis. Adjustments were made for age, sex, BMI, estimated glomerular filtration rate (eGFR), hemoglobin, and extracellular fluid percentage (ECF%).
Results. Heart failure was present in 91 of 270 patients (33.7%). Patients with HF had significantly lower PhA (median 4.79 vs 5.22; p < 0.001), higher NRS 2002 scores (p = 0.010), and lower eGFR and hemoglobin levels. In multivariable logistic regression analysis, PhA remained independently associated with HF (odds ratio (OR) = 0.62; p = 0.016), whereas NRS 2002 and ECF% were not significant. Inclusion of ECF% did not improve model performance. In ROC analysis, PhA showed modestly higher discriminative ability for HF (area under the curve (AUC) = 0.636) compared with NRS 2002 (AUC = 0.594) and BMI (AUC = 0.598).
Conclusions. Heart failure is associated with impaired nutritional status. Phase angle appears to be a clinically relevant marker that remains independently associated with HF after adjustment for hydration status and may be considered as a complementary tool for routine nutritional screening in this high-risk population.
Key words: heart failure, malnutrition, bioelectrical impedance analysis, phase angle, nutritional assessment
Background
Malnutrition is increasingly recognized as a clinically relevant and prognostically significant factor in patients with chronic coronary syndrome (CCS), particularly when complicated by coexisting heart failure (HF).1, 2, 3, 4 In this population, nutritional deterioration is multifactorial and results from chronic inflammation, neurohormonal activation, increased catabolism, gastrointestinal congestion, reduced oral intake, and progressive physical inactivity.5, 6 These mechanisms may contribute to altered body composition and impaired metabolic reserve. As a result, malnutrition may remain underdiagnosed in patients with HF despite its well-established association with adverse outcomes, including prolonged hospitalization, higher readmission rates, and increased mortality.7, 8, 9
Assessing nutritional status in patients with cardiovascular diseases remains particularly challenging.10 Traditional anthropometric measures, such as body mass index (BMI) and weight loss, as well as widely adopted screening tools like the Nutritional Risk Screening 2002 (NRS 2002), are useful but have important limitations, especially in populations affected by fluid shifts and sarcopenia.11, 12 Moreover, these tools primarily focus on involuntary weight loss, reduced intake, or recent catabolic events and often fail to detect subtle or functional forms of malnutrition.13 Moreover, BMI may be misleading in patients with HF, as the so-called “obesity paradox” and the frequent occurrence of fluid overload may obscure underlying tissue loss and metabolic impairment. In contrast, other parameters such as the waist-to-hip ratio, which more accurately reflect central adiposity, have not demonstrated a protective effect of obesity in patients with heart failure with preserved ejection fraction (HFpEF).12 Therefore, there is a growing need for diagnostic tools that go beyond anthropometric measures and allow evaluation of nutritional status at the cellular level.
Bioelectrical impedance analysis (BIA) has emerged as a promising, nonivasive method for assessing body composition and hydration status in various clinical settings.14 It enables the estimation of fat mass (FM), fat-free mass (FFM), and total body water (TBW), including the distribution between intracellular (ICF) and extracellular fluid (ECF) compartments. Among the parameters derived from BIA, phase angle (PhA) has attracted increasing attention as a functional biomarker. Phase angle reflects the relationship between resistance and reactance, arising from cell membrane capacitance, and is considered a surrogate marker of cellular membrane integrity and nutritional status at the cellular level.11, 15 Lower PhA values have consistently been associated with adverse outcomes in diverse populations, including patients with cancer, kidney disease, and those undergoing cardiac surgery.16, 17, 18, 19, 20, 21, 22, 23
Despite its growing validation across multiple disciplines, the role of PhA in cardiovascular patients, particularly those with HF, remains insufficiently explored. In this population, fluid overload and altered body water distribution, especially expansion of the ECF compartment, may affect the accuracy and interpretability of BIA-derived parameters.15 Consequently, concerns have been raised regarding the clinical applicability of PhA in patients with fluid shifts, such as those with HF. Therefore, further investigation into the reliability and interpretative value of PhA in HF represents an important knowledge gap. It remains unclear whether PhA can be reliably used to detect nutritional impairment in patients with HF independently of fluid status, renal function, and conventional screening measures.
Objectives
This study aimed to evaluate whether PhA measured at 50 kHz serves as a valid marker of nutritional status in patients with HF after adjustment for hydration-related variables. We hypothesized that PhA would be significantly lower in patients with HF and that this association would remain independent of hydration status and other clinical confounders.
Materials and methods
This cross-sectional observational study included 270 adult patients hospitalized with a diagnosis of CCS in 2023 and 2024. All patients underwent comprehensive nutritional and clinical assessments during hospital admission. The sample size was determined by the number of eligible patients during the study period and was considered adequate to allow univariable and multivariable analyses in the overall cohort. Inclusion criteria were age ≥18 years and a confirmed diagnosis of CCS based on International Classification of Diseases, 10th Revision (ICD-10) codes (I20.8 and I25.0).
The diagnosis of HF was also verified using ICD-10 codes (I50.0 and I50.1) and was supported by clinical records and available echocardiographic findings. These data were used to classify patients into subgroups of HF with reduced (HFrEF), mildly reduced (HFmrEF), and preserved ejection fraction (HFpEF) according to established left ventricular ejection fraction (LVEF) cut-off values.24 Exclusion criteria included acute coronary syndrome within the preceding 4 weeks, acute decompensated HF, severe chronic kidney disease requiring dialysis, active malignancy, and contraindications to BIA, including the presence of implantable cardiac devices (pacemaker, implantable cardioverter-defibrillator, cardiac resynchronization therapy device), pregnancy, limb amputation, or open wounds.
This study was conducted in accordance with the STrengthening the Reporting of OBservational studies in Epidemiology (STROBE) guidelines. The study protocol was approved by the Bioethics Committee of the Medical University of Lublin, Poland (approval No. KE-0254/221/10/2023). The study was conducted in accordance with the Declaration of Helsinki. All participants provided written informed consent.
Demographic and clinical data, including age and sex, were recorded. Body weight was measured using a calibrated digital scale, with patients wearing light clothing and no shoes. Height was measured to the nearest 0.5 cm using a stadiometer. Body mass index (BMI) was calculated as weight in kilograms divided by height in meters squared (kg/m2). Blood samples were collected on the same day as the BIA measurement and analyzed for hemoglobin, hematocrit, serum creatinine, sodium, and potassium concentrations. Estimated glomerular filtration rate (eGFR) was calculated using the Chronic Kidney Disease Epidemiology Collaboration (CKD-EPI) formula. All laboratory analyses were performed in accordance with Good Laboratory Practice (GLP). Nutritional status was assessed using 2 independent methods: the NRS 2002 score, which evaluates BMI, recent weight loss, recent reduction in food intake, and disease severity; and BIA, which was performed using the ImpediMed SFB7 device (ImpediMed, Brisbane, Australia), a validated, multifrequency, phase-sensitive analyzer. Patients were examined in a fasted and rested state (min. 4 h since the last meal or fluid intake), in a supine position with limbs abducted to approx. 30°. Four adhesive electrodes were placed in the standard tetrapolar configuration on the left wrist and ankle. The analysis included FM, FFM, TBW, ECF, ICF, resistance, and reactance. Phase angle was calculated with the standard formula: PhA (°) = arctangent (reactance/resistance) × (180/π). All measurements were performed by trained personnel following standardized protocols to ensure consistency and minimize inter-operator variability.
Statistical analyses
Statistical analysis was performed using RStudio v. 4.4.2 (R Foundation for Statistical Computing, Vienna, Austria). The following R packages were used: car 3.1-3, ResourceSelection 0.3-6, rms 8.0-0, pROC 1.18.5, DescTools 0.99.60, pscl 1.5.9, ggplot2 3.5.1, ggpubr 0.6.0, cowplot 1.1.3, dplyr 1.1.4, tidyr 1.3.1, and broom 1.0.7. Continuous variables were tested for normality using the Shapiro–Wilk test. Depending on the distribution, descriptive statistics were expressed as means ± standard deviation (SD; for normally distributed data) or medians with interquartile range (IQR; for non-normally distributed data) for continuous variables, and as counts with percentages for categorical variables. Between-group comparisons (e.g., HF vs non-HF) were performed using the t-test or Mann–Whitney U test (for 2 groups) and analysis of variance (ANOVA), Welch’s ANOVA, or the Kruskal–Wallis test (for more than 2 groups) for continuous variables. Categorical variables were compared between groups using Pearson’s χ2 test of independence. For 2×2 tables, Yates’ continuity correction was applied when any expected cell count was between 5 and 9, while Fisher’s exact test was used when any expected cell count was <5. All tests were two-sided with α = 0.05. Correlation analyses were conducted using Pearson’s or Spearman’s rank correlation coefficients (R) to assess associations between PhA and clinical or nutritional parameters.
To identify parameters associated with HF status, multivariable logistic regression was used, with HF as the dependent variable and PhA, age, sex, BMI, hemoglobin, eGFR, NRS 2002 score, and ECF% as covariates. A separate multivariable linear regression model was constructed to examine determinants of PhA. Covariate selection was based on clinical relevance. Model assumptions and multicollinearity were checked. The overall significance of the logistic regression model was assessed using the likelihood-ratio χ2 test. Wald χ2 statistics were reported for individual regression coefficients. Model calibration was assessed using the Hosmer–Lemeshow χ2 test.
Odds ratios and 95% confidence intervals (95% CIs) were calculated using the Wald method, as profile likelihood intervals could not be computed for all variables due to model convergence limitations. Finally, the diagnostic performance of PhA, NRS 2002, and BMI for identifying HF was assessed using receiver operating characteristic (ROC) curve analysis. Area under the curve (AUC) values were calculated and compared using the DeLong method. A two-sided p < 0.05 was considered statistically significant throughout. Power analysis was performed in R v. 4.4.2 using the pwr package and custom R scripts.
Results
Out of 270 patients, 91 (33.7%) were diagnosed with HF. The median age of the population was 72 years, and 52% were male. Compared to non-HF patients, those with HF were older (median 75 vs 70 years, p < 0.001). Univariate comparisons also showed that patients with HF had significantly lower PhA (median 4.79 vs 5.22; p < 0.001), lower BMI (median 28.04 vs 29.59; p = 0.008), and higher NRS 2002 scores (median 1.00 in both groups; IQR differed; p = 0.01). Serum sodium and potassium levels were modestly but significantly different between groups, suggesting altered hydration status in HF. Details of the baseline characteristics of the study population and subgroup comparisons are presented in Table 1.
Among HF patients, LVEF data were available for 74 patients, with 32 classified as HFrEF, 19 as HFmrEF, and 23 as HFpEF. The comparison between HF subgroups showed significant differences in age, NRS 2002 score, hemoglobin, and hematocrit. Patients with HFrEF were significantly younger and had higher hemoglobin and hematocrit levels, while those with HFpEF demonstrated higher NRS 2002 scores. No significant differences were observed in renal function, electrolytes, BMI, PhA at 50 kHz, body composition parameters, or sex distribution. Details are presented in Table 2.
Correlation analyses revealed that PhA was strongly and inversely correlated with ECF% (r = −0.61, p < 0.001), confirming its sensitivity to fluid status. Moreover, PhA was negatively correlated with NRS 2002 (r = −0.46, p < 0.001) and positively correlated with eGFR and hemoglobin. In subgroup analyses, PhA maintained a consistent inverse correlation with ECF% across all HF subgroups, while positive associations with hemoglobin and hematocrit were particularly evident in HFmrEF and HFpEF. The negative correlation with NRS 2002 was strongest in HFrEF and HFmrEF. Detailed correlation results are presented in Table 3.
In multivariable logistic regression, PhA remained independently associated with HF status after adjustment for age, sex, BMI, eGFR, hemoglobin, and NRS 2002. Specifically, lower PhA was associated with higher odds of HF (odds ratio (OR) = 0.62; p = 0.016), even after adjustment for ECF%. Additionally, male sex (OR = 2.27; p = 0.010), lower BMI (OR = 0.92; p = 0.016), and lower eGFR (OR = 0.97; p = 0.003) were also significantly associated with HF. The overall multivariable logistic regression model was statistically significant (likelihood ratio χ2 = 35.35, degrees of freedom (df) = 8, p < 0.001), indicating that the included predictors collectively explained a significant proportion of the variance in HF occurrence.
Model assumptions were met (all variance inflation factors (VIFs) < 2.1). Discrimination was modest (C-index = 0.718; 95% CI: 0.652–0.785). Explained variance was as follows: Nagelkerke R2 = 0.184, McFadden R2 = 0.111, and Tjur R2 = 0.136. Calibration was adequate (Hosmer–Lemeshow p = 0.945). The inclusion of ECF% did not significantly improve the model (Δχ2 = 0.72; p = 0.40), indicating that the association between PhA and HF was independent of hydration status. Details of the model are presented in Table 4.
Post hoc power analyses were conducted for both univariate and multivariable analyses. The comparison of PhA between patients with and without HF yielded a Cohen’s d of 0.464, with a power of 94.8% (α = 0.05). Additionally, in the multivariable logistic regression model adjusted for clinical confounders, the observed Z score for PhA was 2.42, corresponding to a power exceeding 99%, confirming a sufficient sample size to detect this independent association. Moreover, ROC curve analysis demonstrated that PhA had the highest AUC (0.636), followed by BMI (0.598) and NRS 2002 (0.594).
Discussion
This study demonstrates that HF in patients with CCS is independently associated with lower PhA, suggesting the presence of malnutrition at a cellular and functional level. Importantly, PhA at 50 kHz retained its association even after adjustment for potential confounders such as hydration status, renal function, age, BMI, and hemoglobin. These findings highlight the potential of PhA to serve as a reliable and clinically relevant biomarker of nutritional status in cardiology, particularly in the context of HF, where traditional anthropometric measures may be insufficient. Our findings are consistent with prior studies demonstrating that reduced PhA is not only a marker of nutritional depletion but also of sarcopenia and physical decline, which are prevalent in HF.25, 26, 27, 28
Moreover, while the overall discriminatory performance of all tested parameters was modest, PhA showed a marginally stronger association than both NRS 2002 and BMI in identifying patients with HF. Although NRS 2002 and BMI were associated with HF status in univariable comparisons, only PhA and BMI remained significantly associated in multivariable models. The lack of statistical significance of NRS 2002 in adjusted analyses may reflect its limitations as a screening tool focused primarily on recent weight loss and reduced intake, without accounting for compositional or functional aspects of nutrition.
In hospitalized patients, PhA was associated with prolonged hospital stay and non-survival and was shown to be a useful marker of malnutrition when compared with NRS 2002, as well as for cachexia detection.29, 30 Its role in malnutrition detection compared with NRS 2002 was also demonstrated in hospitalized geriatric populations,31 in patients with gastrointestinal diseases,32 with multimorbidity,33 and in patients presenting to the emergency department.34 A study in cardiac surgery patients showed that PhA identified more malnourished patients than the European Society for Clinical Nutrition and Metabolism (ESPEN) criteria.35 When validated against the Global Leadership Initiative on Malnutrition (GLIM) criteria, which serve as the gold standard in malnutrition assessment, PhA demonstrated excellent accuracy in detecting malnutrition, while NRS 2002 showed a good level of accuracy.36
Body mass index, similarly, is a blunt measure in cardiovascular populations, where obesity and fluid overload are common and may obscure underlying malnutrition or sarcopenia.12 In other populations, PhA has outperformed BMI in nutritional status assessment. For example, in underweight populations, patients with anorexia nervosa, despite similar body mass, had significantly lower PhA compared with constitutionally lean individuals.37 Similarly, in hemodialysis patients, those with obesity paradoxically presented lower PhA than individuals with normal BMI.38 Phase angle has also been suggested as a valuable tool for disease-related malnutrition assessment, with limitations in the correlation between PhA and BMI in patients with obesity.39 It has also been shown to be a useful parameter for muscle wasting detection in cardiovascular patients.26
The observed association between low PhA and HF is consistent with prior studies in diverse clinical populations.1, 40, 41 As already mentioned, PhA has been linked to adverse outcomes in other conditions16, 17, 18 and serves as a marker of cell membrane integrity, body cell mass, and metabolic reserve.25, 29 The role of PhA in HF has also been demonstrated in multiple studies.13, 42 Our findings extend these observations in the HF population and demonstrate that PhA maintains clinical relevance even in the presence of potential overhydration confounders such as ECF%, which can be elevated in HF and is known to influence impedance-derived parameters.15, 40, 43
From a physiological perspective, PhA reflects the capacity of cell membranes to store electrical current, an ability that is impaired in malnourished cells.14, 23 The independence of PhA from ECF% supports the hypothesis that it captures aspects of nutritional status at the cellular level that extend beyond simple volume redistribution. Moreover, ROC analysis further reinforced the potential future clinical utility of PhA. Although all AUC values were modest, PhA showed better discriminatory ability compared to NRS 2002 and BMI; however, the differences in AUC values were small and should be interpreted with caution. On the other hand, this observation is particularly relevant in cardiology, where nutritional risk is often underappreciated and traditional tools may fail to detect malnutrition in patients with preserved or elevated body weight. Therefore, PhA appears to be a valid marker of nutritional status compared with BMI and NRS 2002. The identification of functionally relevant, early-stage malnutrition using PhA may potentially help tailor dietary interventions, optimize rehabilitation, and reduce readmissions in high-risk cardiac populations. Its modest AUC indicates that it should not be used as a standalone diagnostic test; however, the application of PhA may complement existing nutritional tools by providing a more objective and functional perspective on nutritional status. Nevertheless, this requires prospective validation, ideally with endpoints such as mortality or rehospitalization.
There is only one meta-analysis available, which identified a PhA cut-off of 4.65° for increased mortality in HF; however, the authors indicated that data on the application of PhA in HF are still limited.44 Future research should focus on prospective validation of PhA in HF cohorts, ideally through further assessment of its predictive value for hard outcomes such as mortality, functional decline, or hospital readmission. Moreover, longitudinal analyses are needed to evaluate whether serial PhA measurements can monitor changes in nutritional status in HF.
In addition, combining PhA with established tools such as BMI and NRS 2002 may help develop integrated screening models that capture both structural and functional dimensions of malnutrition. Further research should also explore cut-off values specific to HF phenotypes (HFrEF, HFmrEF, HFpEF) and examine the impact of comorbidities and obesity, which frequently complicate nutritional assessment in this population.
Limitations of the study
Despite its novelty, several limitations of this study must be acknowledged. First, the cross-sectional design precludes causal inference and limits the ability to assess temporal changes in nutritional status. Moreover, the study was performed in stable patients; therefore, these findings may not be generalizable to populations with acute conditions. Left ventricular ejection fraction values were not available for all patients with HF; thus, multivariable analyses in HF-type subgroups remained underpowered. Therefore, we suggest performing larger studies that would allow subgroup analyses. Moreover, the ROC analysis revealed only modest discriminatory accuracy, highlighting that PhA, while valid, should not be regarded as a stand-alone diagnostic tool. Finally, prospective studies with long-term outcomes (e.g., mortality, rehospitalization) are needed to further establish the prognostic value of PhA and its role in clinical screening algorithms.
Conclusions
Heart failure in CCS is associated with impaired nutritional status, as reflected by lower PhA values. Phase angle is a reliable and clinically meaningful marker that reflects malnutrition at the cellular level, independent of hydration status. Phase angle provides an integrative assessment of nutritional integrity and functional reserve and may serve as a valuable addition to routine nutritional screening in high-risk cardiovascular populations, particularly those with HF. The incorporation of PhA into clinical workflows and its combination with other assessment tools could potentially enhance early identification of malnutrition and, in the future, support individualized dietary interventions and potentially improve patient outcomes in cardiology settings.
Supplementary data
The supplementary materials are available at https://doi.org/10.5281/zenodo.17359293. The package contains the following files:
Supplementary Table 1. Normality assessment with Shapiro–Wilk test results (p-values).
Supplementary Table 2. The results of the analysis of equal variances for comparison between patients with and without HF, and within HF subtypes.
Supplementary Fig. 1. Scatterplots for Pearson’s correlations.
Data Availability Statement
The datasets supporting the findings of the current study are openly available in Zenodo at DOI https://doi.org/10.5281/zenodo.17347574.
Consent for publication
Not applicable.
Use of AI and AI-assisted technologies
Not applicable.