Abstract
Background. Osteoarthritis (OA) is a degenerative joint disease characterized by synovial inflammation, cartilage degradation, and subchondral bone remodeling. Currently, no universally accepted or clinically validated biomarkers exist for OA diagnosis and treatment, highlighting the need to identify potential genetic biomarkers to support early detection and therapeutic research.
Objectives. This study aimed to identify and preliminarily validate potential diagnostic biomarkers for OA using integrated bioinformatics and machine learning (ML) approaches to provide molecular insights supporting early diagnosis and therapeutic strategies.
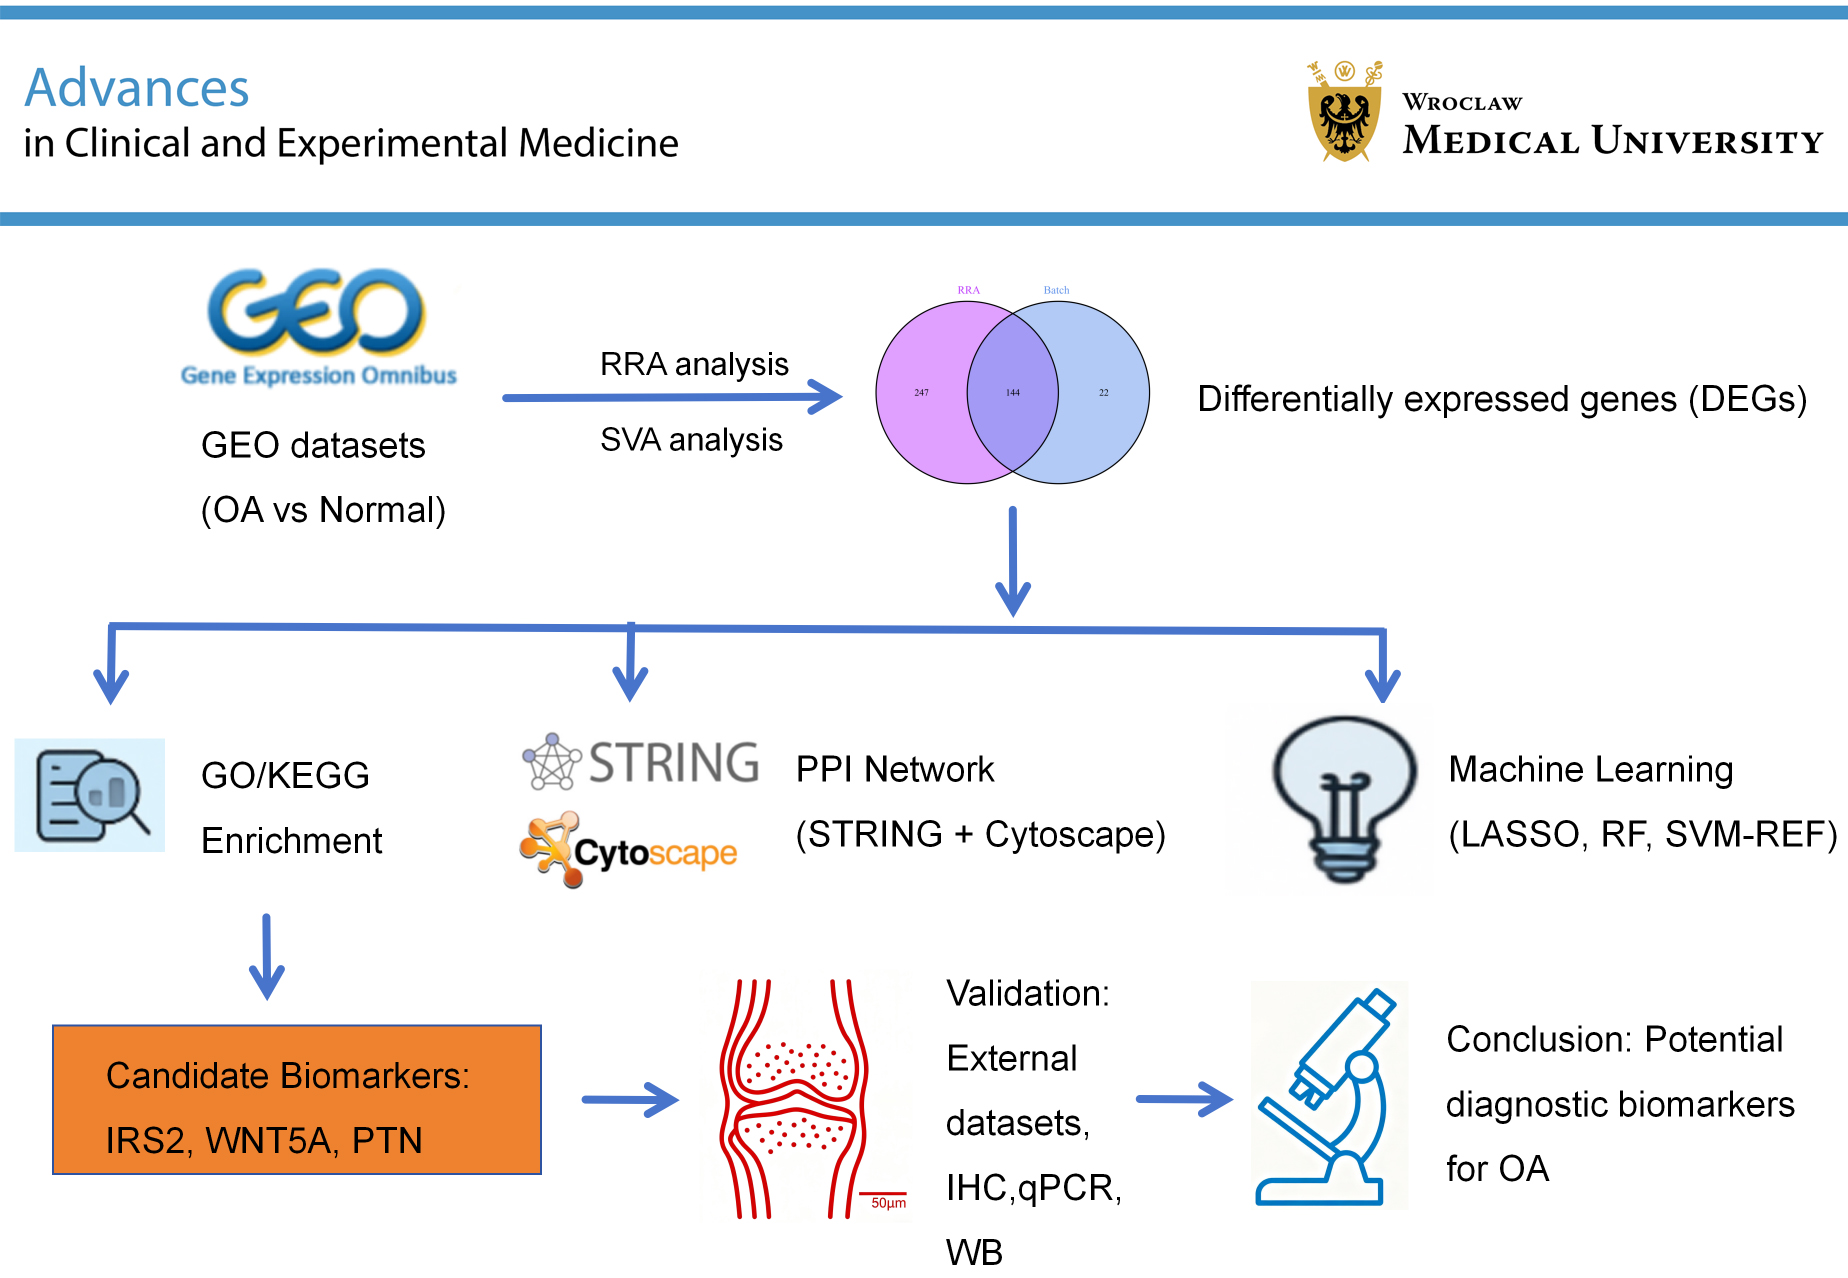
Materials and methods. Gene expression data from OA patients and normal controls were obtained from the Gene Expression Omnibus (GEO) database. Differentially expressed genes (DEGs) were identified using R. Protein–protein interaction (PPI) network analysis and functional module analysis were performed to screen for hub genes. Gene Ontology and Kyoto Encyclopedia of Genes and Genomes (KEGG) enrichment analyses were conducted to determine the biological roles and pathways of DEGs, along with transcription factor prediction. Three ML models (least absolute shrinkage and selection operator (LASSO), support vector machine recursive feature elimination (SVM-RFE), and Random Forest) were used to identify OA-specific characteristic genes. Key diagnostic genes were identified from the intersection of the ML results and validated using external datasets of cartilage, synovium, and blood. IRS2 expression was further validated via in vivo (animal model) and in vitro (cell culture) experiments.
Results. Fifteen OA-related characteristic genes were identified, including IRS2, ADM, SIK1, PTN, CX3CR1, WNT5A, IL21R, APOD, CRLF1, FKBP5, PNMAL1, NPR3, RARRES1, ASPN, and POSTN. Functional enrichment analysis suggested involvement in extracellular matrix (ECM) organization, interleukin-17 (IL-17) and relaxin signaling, and the AGE-RAGE pathway in diabetic complications. Three genes showed strong diagnostic potential. IRS2 was downregulated, while WNT5A and PTN were upregulated in OA samples. Immunohistochemistry (IHC), real-time quantitative polymerase chain reaction (qPCR), and western blotting (WB) confirmed the downregulation of IRS2 in OA samples, consistent with bioinformatics predictions, in both chondrocytes and mouse joint tissues.
Conclusions. IRS2, WNT5A, and PTN may serve as potential diagnostic biomarkers for osteoarthritis, supporting early or tissue-specific diagnosis and offering insights for future clinical and therapeutic applications.
Key words: machine learning, osteoarthritis, biomarkers, bioinformatics, tissue-specific expressed genes
Background
Osteoarthritis (OA) remains a global health challenge,1 affecting an estimated 600 million people worldwide, or 7.6% of the world’s population,2 with a higher prevalence among women.3 The incidence and disability rates of OA have been rising since 1990,4 and its prevalence is expected to nearly double in the next decade.5 Additionally, similar to rheumatoid arthritis, OA imposes a substantial socioeconomic burden, with costs estimated to have reached 80 billion USD in 2016 and growing at 5.7% per year.4, 6 In the elderly, OA is a leading cause of mobility impairment and disability.7, 8
Osteoarthritis is clinically characterized by chronic joint pain, stiffness, swelling, reduced range of motion, and progressive loss of function, which can significantly impair quality of life.9 Pathologically, it involves extracellular matrix (ECM) degradation, altered type II collagen (COL2A1) synthesis, elevated matrix metalloproteinase 13 (MMP13) expression, and cyclooxygenase-2 (COX2)-mediated inflammation triggered by pro-inflammatory cytokines.10 These factors act on cartilage, synovium, and subchondral bone, which interact and contribute to disease progression.11, 12, 13 The etiology of OA is multifactorial, involving age, obesity, joint injury, genetics, and mechanical stress.7, 8 However, the exact mechanisms remain unclear, and effective early diagnostic tools are still lacking.
With the rapid development of high-throughput sequencing technology, an increasing number of OA-related datasets have been generated and utilized.14, 15, 16, 17, 18 Although some studies have focused on OA biomarkers, most have been based on single tissues or individual datasets.19 The occurrence and development of OA are closely related to interactions among cartilage, subchondral bone, and synovitis. Despite some controversy regarding the order of pathological events, it is undeniable that these components are all involved in disease progression,20, 21 which may contribute to the limited reliability of current research findings.22, 23, 24, 25 The application of machine learning (ML) in OA biomarker development has garnered growing research interest. For instance, Chen et al.25 applied synovial tissue microarray datasets and identified ZBTB16, TNFSF11, SCRG1, and KDELR3 as diagnostic biomarkers for OA. A study by Han et al.23 also reported that TLR7, CSF1R, APOE, C1QA, and CCL5 are key genes with high diagnostic value for OA after applying weighted gene co-expression network analysis (WGCNA) and the cytoHubba algorithm. Although these findings may contribute to a better understanding of OA and provide new insights into its diagnosis and treatment, the limited sample sizes and the small number of algorithms used may undermine the reliability and robustness of these studies to some extent.
Objectives
This study aimed to identify and validate reliable diagnostic biomarkers for OA using integrated bioinformatics and ML approaches to improve early diagnosis and inform therapeutic strategies
Materials and methods
Data collection
The datasets GSE51588, GSE12021, GSE55457, GSE56409, GSE114007, GSE168505, GSE169077, GSE55235, GSE129147, and GSE48556 were obtained from the Gene Expression Omnibus (GEO) database (https://www.ncbi.nlm.nih.gov/geo). GSE51588 is a whole-genome expression profile of subchondral bone. GSE12021, GSE55457, GSE56409, and GSE55235 contain data obtained from synovial samples of OA patients and normal controls. GSE114007, GSE168505, GSE169077, and GSE129147 are RNA sequencing datasets derived from joint cartilage tissues collected from both OA patients and healthy individuals, while GSE48556 consists of mononuclear cells isolated from the blood of OA patients and normal controls. All these datasets were derived from human samples.
Identification of differentially expressed genes (DEGs)
Identification of DEGs using the Robust Rank Aggregation method
The 7 raw datasets were processed using the limma package in Bioconductor, including normalization and log transformation. Subsequently, DEGs were analyzed using the limma package (https://bioconductor.org/packages/release/bioc/html/limma.html), and ranked lists of upregulated and downregulated DEGs were generated for each dataset based on fold-change values. Finally, we integrated the results of these 7 datasets using the R package “RobustRankAggreg” based on the Robust Rank Aggregation (RRA) method to identify the most significant DEGs. In the RRA analysis, genes with a log fold change (logFC) >1 and an adjusted p-value <0.05 were selected as significant DEGs.
Identification of DEGs using the Surrogate Variable Analysi) method
Before merging the 7 microarray datasets, we used the ComBat function in the Surrogate Variable Analysis (SVA) package to correct for batch effects, aiming to minimize experimental variance before subsequent analyses. Box plots, principal component analysis (PCA), and other methods were used to assess the data before and after correction (Supplementary Fig. 1). The final merged dataset consisted of 167 samples, including 66 normal control samples and 101 OA samples. In the SVA analysis, genes with a log fold change (logFC) >1 and an adjusted p-value <0.05 were selected as significant DEGs. Finally, the genes identified by both the RRA and SVA methods were considered key genes for OA.
Identification of gene clusters and construction of protein–protein interaction networks
Gene Ontology (GO) functional annotation, Kyoto Encyclopedia of Genes and Genomes (KEGG) analysis, and Disease Ontology (DO) enrichment analysis were performed using R packages (clusterProfiler: https://bioconductor.org/packages/release/bioc/html/clusterProfiler.html; DOSE: https://bioconductor.org/packages/release/bioc/html/DOSE.html; org.Hs.eg.db: https://bioconductor.org/packages/release/data/annotation/html/org.Hs.eg.db.html; enrichplot: https://bioconductor.org/packages/release/bioc/html/enrichplot.html).
An adjusted p-value <0.05 was considered statistically significant for enrichment.
The STRING database (https://string-db.org) was used to construct the protein–protein interaction (PPI) network, which was then imported into Cytoscape v. 3.9.1 software (https://cytoscape.org/index.html), to visualize the key nodes in the molecular interaction network. The cytoHubba algorithms were employed to analyze the PPI network. Only genes identified as hub genes by all cytoHubba algorithms (“MCC”, “DMNC”, “MNC”, “Degree”, “EPC”, “BottleNeck”, “EcCentricity”, “Closeness”, “Radiality”, “Betweenness”, “Stress”, and “ClusteringCoefficient”) were included in the final selection. The interacting genes and functions of these hub genes were predicted, and relevant PPI networks were generated using the GeneMANIA database (https://genemania.org). Enrichment analysis of the hub genes was further conducted using GO functional terms and KEGG pathway analysis, with p < 0.05 considered statistically significant.
Machine learning
We used the `train` function from the caret package to identify the best-performing model using various ML methods, including least absolute shrinkage and selection operator (LASSO), Support Vector Machine (SVM), Decision Tree (DT), Random Forest (RF), eXtreme Gradient Boosting (XGBoost), and Generalized Linear Model (GLM). LASSO regression is a linear regression technique that incorporates L1 regularization to constrain model complexity, thereby achieving feature selection and preventing overfitting.26 Support Vector Machine is a powerful supervised learning model that can be used for classification and regression tasks. It has shown wide applicability and superior performance in high-dimensional data, complex data structures, and small-sample learning.27 Decision Tree is a supervised learning algorithm that splits nodes by selecting the features that best partition the data.28 Random Forest is an ensemble learning method that improves model performance and stability by voting (classification) or averaging (regression) the results of multiple decision trees. It is particularly effective in identifying subtle patterns in complex datasets.29 XGBoost is a gradient boosting framework that uses tree-based models to provide efficient and flexible ML algorithms. It is widely recognized for its excellent performance and efficiency and is extensively used in ML competitions and real-world applications.30 Generalized Linear Model is an extension of linear models that can be applied to a wide range of data types, offering strong interpretability and broad applicability.
Through training and testing these models, we selected the 3 best-performing models to analyze the differentially expressed genes and identify the optimal feature genes. The resulting genes were intersected with the hub genes and used as diagnostic genes for the disease.
Validation of feature genes with receiver operating characteristic curve and construction of clinical diagnostic model
To validate the diagnostic importance of the candidate genes, we used the “rms” R package (https://hbiostat.org/
R/rms) to construct a nomogram and to predict and interpret the resulting model. Box plots and violin plots were used to visualize differential gene expression between the control and OA groups. We further evaluated the diagnostic value of the candidate genes through receiver operating characteristic (ROC) analysis, obtaining the area under the ROC curve (AUC) and the corresponding 95% confidence interval (95% CI). An AUC > 0.7 was considered indicative of good diagnostic performance.
Validation of feature genes using western blot and qPCR
Human SW1353 chondrocytes, commonly used for OA modeling,10, 31 were cultured in an incubator under standard conditions (37°C, 5% CO2) using specialized SW1353 culture medium (Dulbecco’s modified Eagle’s medium (DMEM); Pricella, Wuhan, China), with the medium changed every 2–3 days. When SW1353 cells reached 50% confluence, they were stimulated with 10 ng/mL interleukin (IL)-1β (PeproTech, Rocky Hill, USA) for 24 h to model OA.32, 33, 34
For IRS2 overexpression, the IRS2-overexpressing plasmid was obtained from HanHeng Biotechnology (Shanghai, China). Transfection was performed in 6-well plates using the plasmid and Lipofectamine 3000 (Thermo Fisher Scientific, Waltham, USA), following the manufacturer’s instructions. SW1353 cells were transfected at 70–90% confluence, incubated for 48 h, and then treated with 10 ng/mL IL-1β for an additional 24 h. Successful overexpression of IRS2 was confirmed before proceeding with subsequent experiments.
The treated chondrocytes were lysed in radioimmunoprecipitation assay (RIPA) buffer (Solarbio, Beijing, China) containing 1% protease and phosphatase inhibitors (GlpBio, Montclair, USA) for 30 min. The lysates were collected by thoroughly scraping the adherent cells and then incubated on a shaker at 4°C for 1 h before centrifugation to collect the supernatant for subsequent experiments. The protein concentration in the supernatant was measured using a bicinchoninic acid (BCA) assay kit (Solarbio) on a microplate reader (Thermo Fisher Scientific) at a wavelength of 562 nm.
Subsequently, equal amounts of sample protein and protein markers were separated by 10% sodium dodecyl sulfate–polyacrylamide gel electrophoresis (SDS-PAGE) and transferred to polyvinylidene difluoride (PVDF) membranes (MilliporeSigma, St. Louis, USA). After blocking with 5% bovine serum albumin (BSA; Servicebio, Wuhan, China) for 1 h, the membranes were incubated with primary antibodies overnight at 4°C. After washing 3 times with Tris-buffered saline with Tween (TBST), the membranes were incubated with secondary antibodies at room temperature for 2 h. Details of the primary and secondary antibodies are listed in Table 1. Protein bands were visualized using an enhanced chemiluminescence reagent (Yeasen, Shanghai, China) and imaged with a Bio-Rad scanner (Bio-Rad, Hercules, USA). GAPDH was used as the housekeeping gene. Band analysis was performed using ImageJ v. 1.8.0 (National Institutes of Health (NIH), Bethesda, USA).
Similarly, total RNA was extracted from the treated chondrocytes using TRIzol reagent (Takara, Shiga, Japan) and purified with an RNA extraction kit (TransGen, Beijing, China). The total RNA concentration of the samples was measured using a micro-UV spectrophotometer (Thermo Fisher Scientific). The RNA samples were then reverse transcribed into cDNA using a reverse transcription kit (TransGen). Finally, the target mRNA was amplified on a real-time quantitative polymerase chain reaction (qPCR) instrument (Bio-Rad). The final quantitative results were normalized to GAPDH and calculated using the 2−ΔΔCt method. The primer sequences for the target genes are shown in Table 2.
Animal experiments
All animal procedures were approved by the Institutional Animal Care and Use Committee (IACUC) of The First Affiliated Hospital of Nanchang University, China (approval No. CDYFY-IACUC-202505GR093). All experiments involving animals were conducted in strict accordance with the guidelines set forth by the IACUC and the Guide for the Care and Use of Laboratory Animals. Mice were maintained under specific pathogen-free (SPF) conditions in a 12 h light/dark cycle, with ad libitum access to food and water.
To investigate the differential expression of IRS2 in OA, a total of 12 ten-week-old male C57BL/6 mice were subjected to destabilization of the medial meniscus (DMM) surgery on the right knee.35 Briefly, 12 mice were used, with 6 mice per group (sham and OA). The OA model was established by performing DMM surgery on the right knee. Briefly, mice were anesthetized with sodium pentobarbital, and the DMM procedure involved transecting the medial meniscotibial ligament (MMTL) to destabilize the meniscus. Sham-operated mice underwent identical surgical exposure without MMTL transection. The DMM model is a validated and widely used method for inducing OA in mice. Mice were euthanized 8 weeks after surgery, and whole knee joints were harvested from both groups for subsequent histological and molecular analyses.
Immunohistochemistry
Bone tissues were fixed in formalin and decalcified in ethylenediaminetetraacetic acid (EDTA) solution for 1 month, with the solution refreshed every 3–7 days. After decalcification, tissues were dehydrated, embedded in paraffin, and sectioned at a thickness of 5 μm. Sections were deparaffinized in xylene, rehydrated through graded ethanol, and subjected to antigen retrieval by boiling in 0.01% sodium citrate buffer. Endogenous peroxidase activity was blocked using hydrogen peroxide, followed by blocking with 5% BSA for 1 h at room temperature.
Primary antibodies diluted in 5% BSA were incubated overnight at 4°C, including anti-IRS2, anti-COX2, and anti-type II collagen (all from Sanying, Wuhan, China; dilution 1:50). The next day, sections were incubated with a horseradish peroxidase (HRP)-conjugated goat anti-mouse/rabbit IgG secondary antibody (Golden Bridge Biotechnology, Beijing, China; 1:50 dilution), followed by 3,3′-diaminobenzidine (DAB) staining and hematoxylin counterstaining to visualize nuclei. Finally, slides were mounted with neutral resin and coverslipped. Images of the stained sections were captured using a digital imaging system (Shunyu Instruments, Zhejiang, China).
Statistical analyses
Data were analyzed using R 4.3.0 (R Foundation for Statistical Computing, Vienna, Austria), Cytoscape 3.9.1, Perl 5.32.1 (https://www.perl.org), and GraphPad Prism 9.7 (GraphPad Software, San Diego, USA). Continuous data were expressed as mean ± standard deviation (SD). For comparisons between 2 groups, if the continuous data followed a normal distribution and had equal variances, Student’s t-test was used. If the data did not follow a normal distribution, a nonparametric test (Mann–Whitney U test) was employed. All experiments were independently repeated 3 times, and p < 0.05 was considered statistically significant.
Results
Identification of DEGs
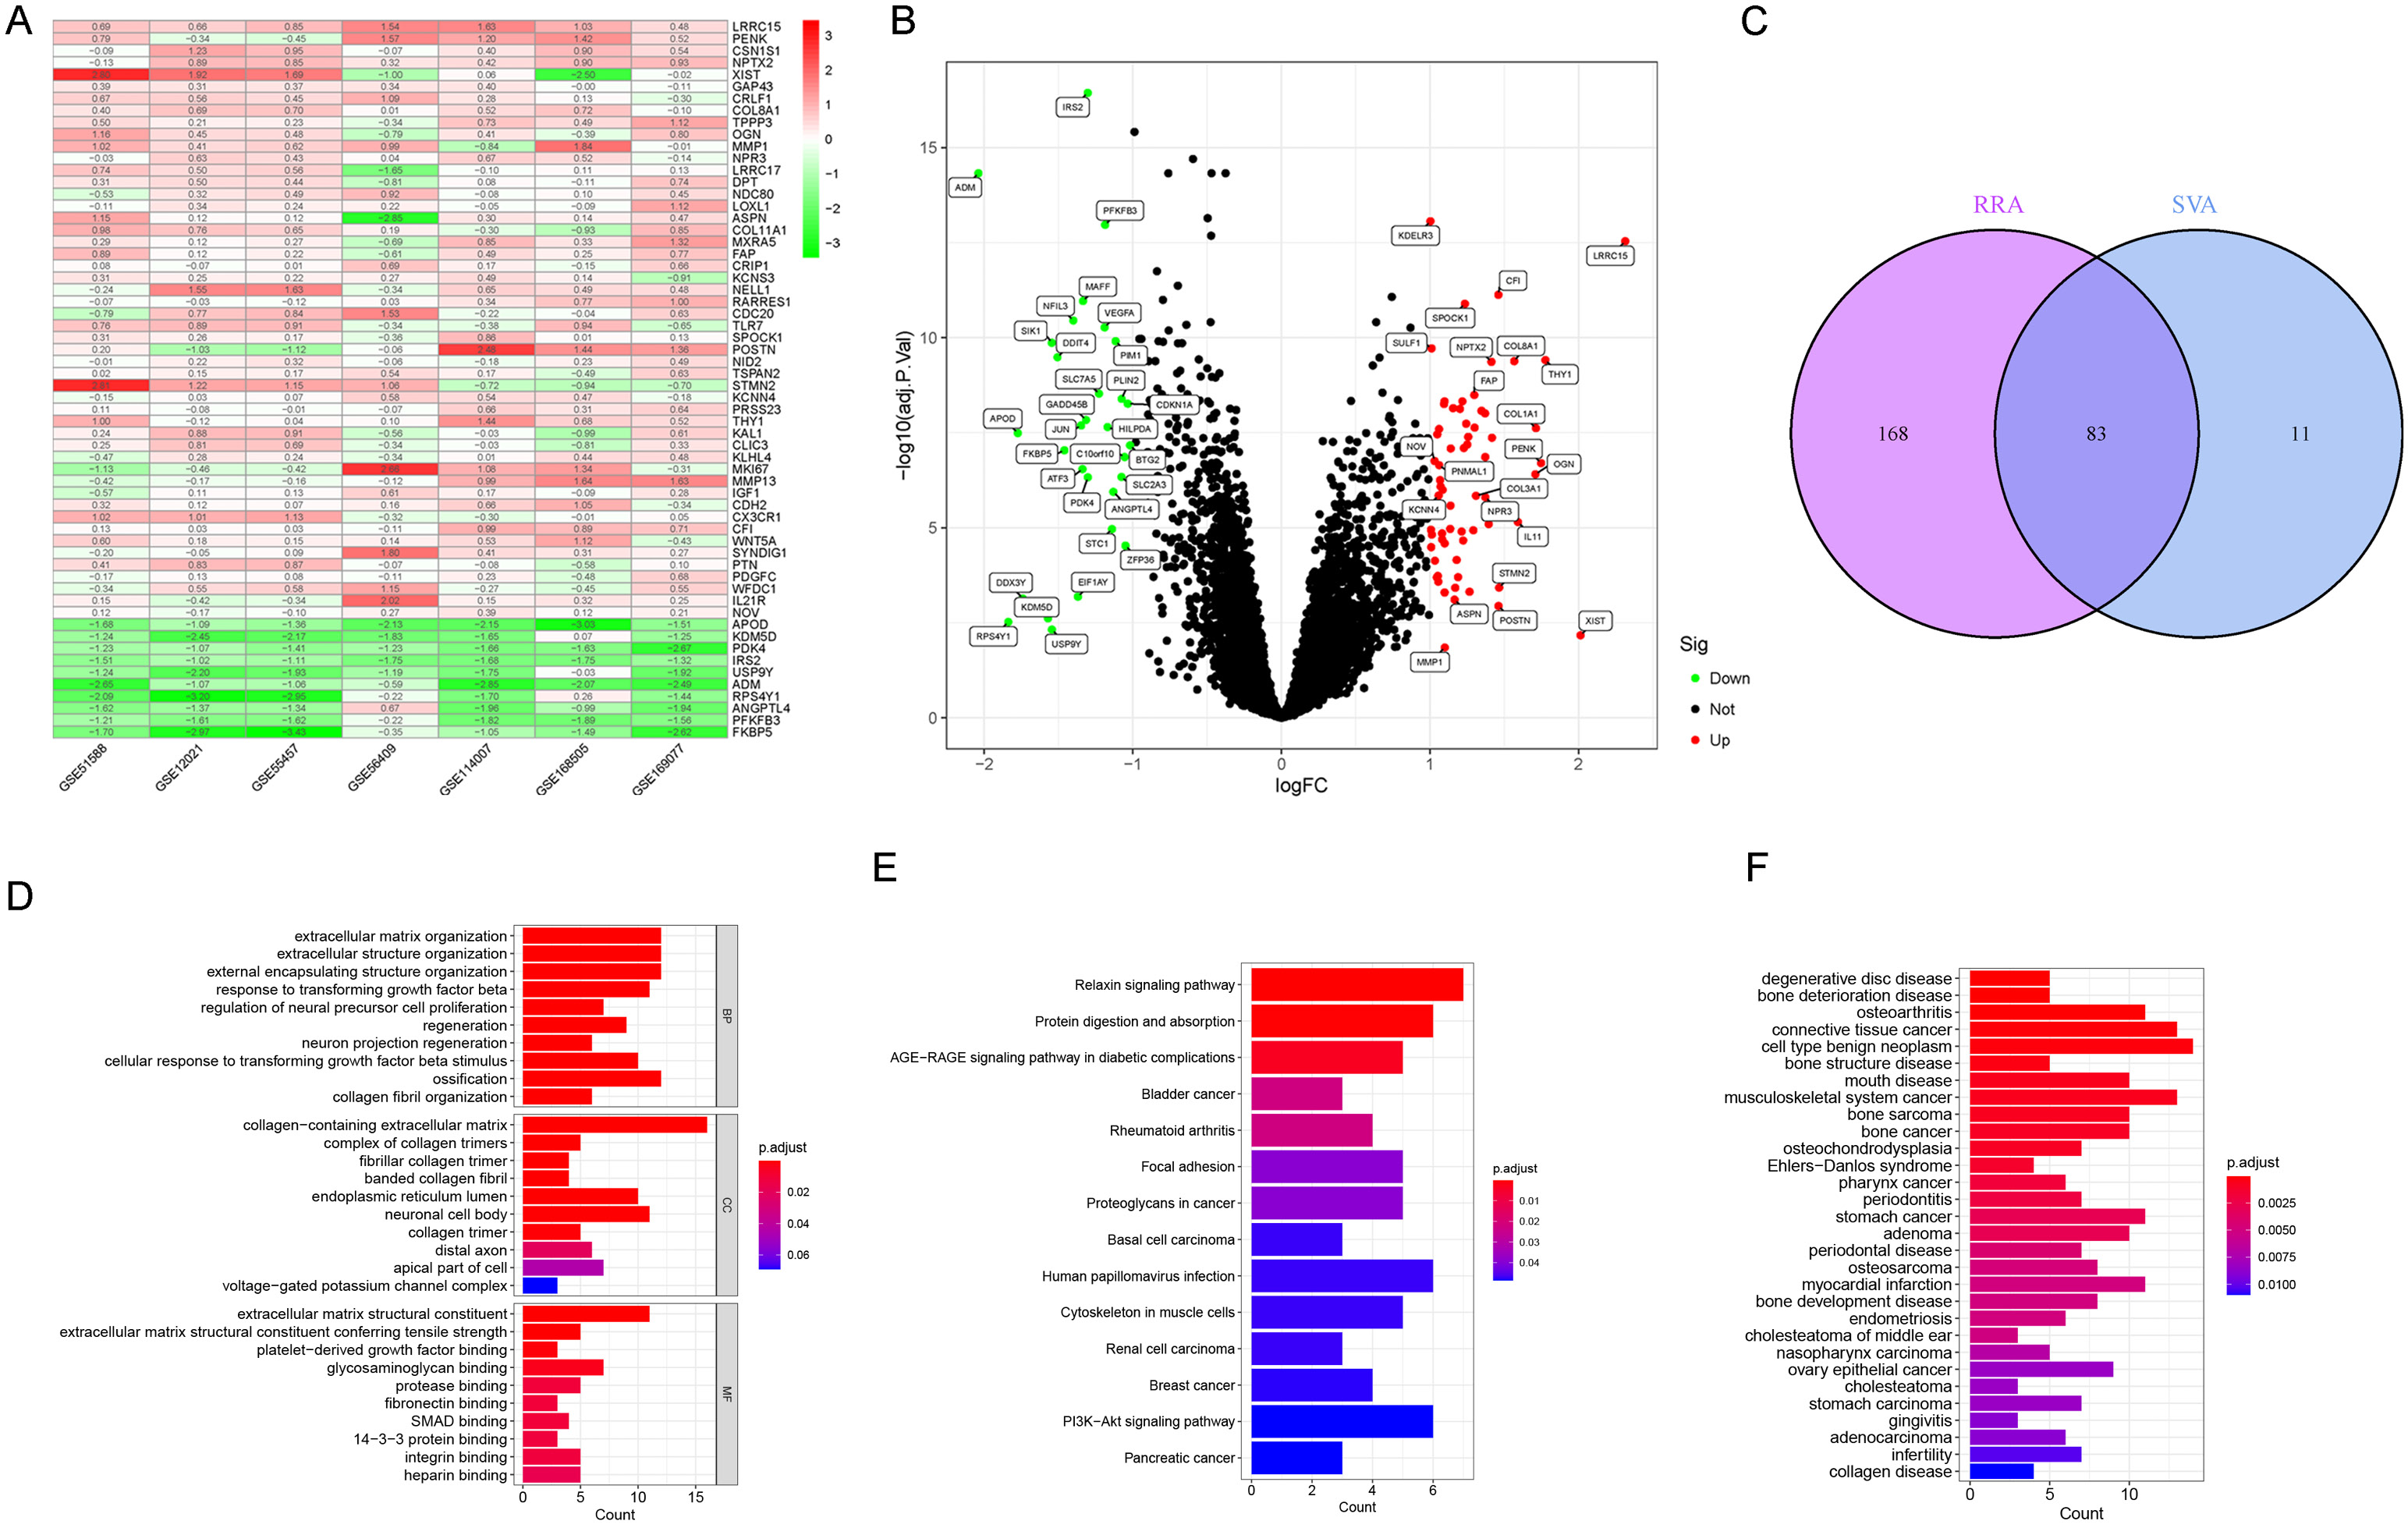
Table 3 summarizes the characteristics of the included datasets. Using the RRA method, we identified 202 upregulated and 49 downregulated DEGs (Figure 1A). A heatmap showing the top 50 upregulated and top 10 downregulated genes is presented in Supplementary Fig. 2A. Figure 1B shows the differential gene expression profile in the merged dataset, revealing 64 upregulated and 30 downregulated genes. By intersecting the RRA and SVA results, we identified 83 key DEGs associated with OA (Figure 1C).
Functional enrichment and pathway analysis of key genes
We performed GO, KEGG, and DO enrichment analyses to explore the biological roles of the key genes. The GO results showed that these genes are mainly involved in ECM and structural organization (BP), are localized to collagen-containing extracellular components (CC), and function as structural constituents of the ECM (MF) (Figure 1D, Supplementary Fig. 2B). KEGG analysis revealed enrichment in pathways such as relaxin signaling, protein digestion and absorption, advanced glycation end products–receptor for advanced glycation end products (AGE-RAGE) signaling in diabetic complications, and rheumatoid arthritis (Figure 1E, Supplementary Fig. 2C). DO analysis indicated associations with diseases including OA, degenerative disc disease, connective tissue cancer, and musculoskeletal system tumors (Figure 1F, Supplementary Fig. 2D).
Construction of PPI network for key genes
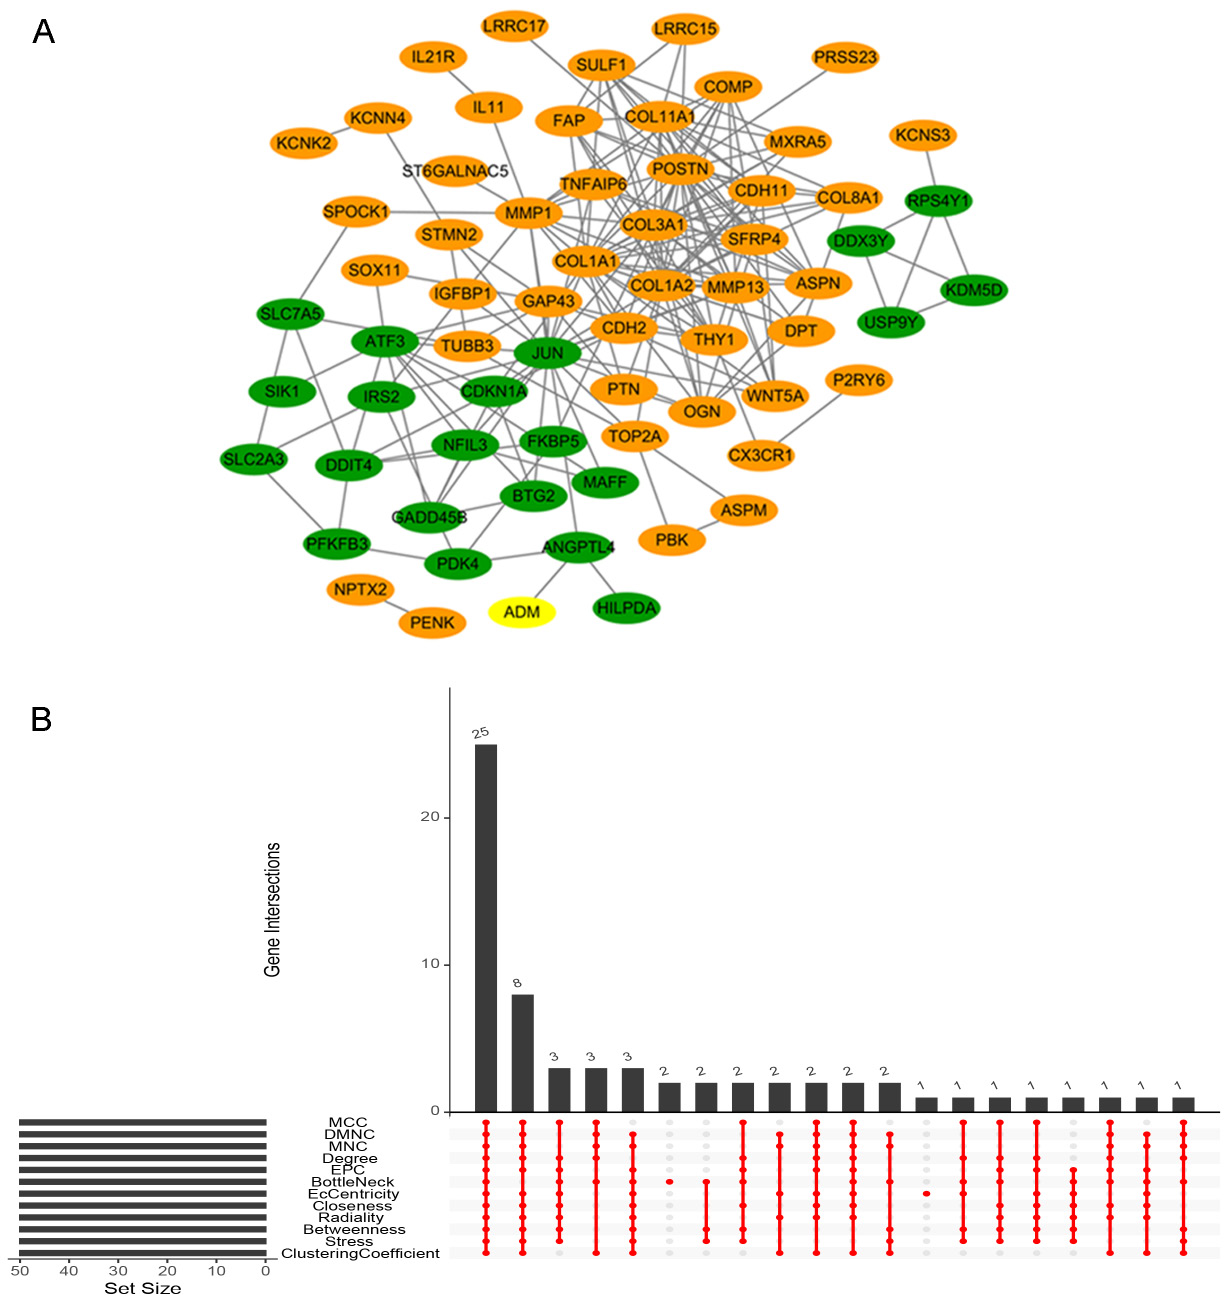
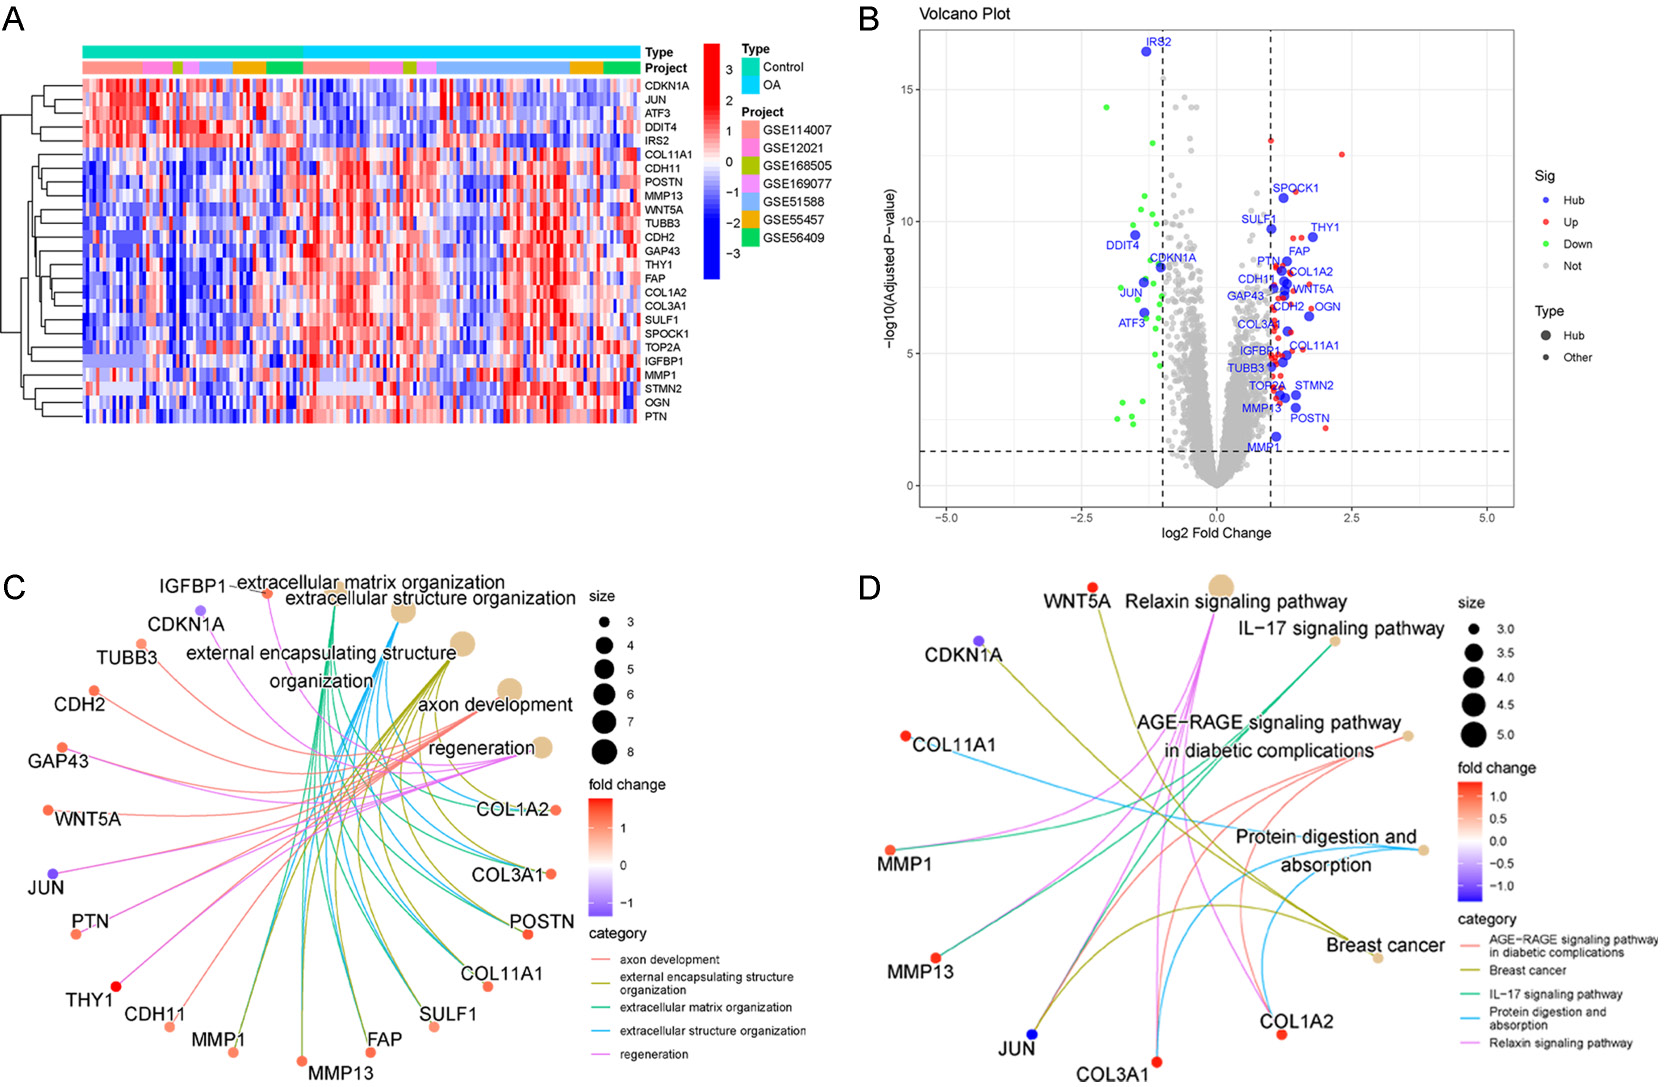
We used the key genes to construct a PPI network in STRING (minimum interaction score = 0.4, p < 0.001) to explore potential protein interactions. The resulting network was visualized using Cytoscape (Figure 2A). To identify hub genes, we applied all algorithms within the cytoHubba plugin, and only genes identified by all methods were retained, resulting in 25 hub genes (Figure 2B), including COL1A2, COL3A1, POSTN, WNT5A, and IRS2, among others. We also generated volcano plots and heatmaps of hub gene expression (Figure 3A,B).
Further enrichment analysis showed that the hub genes participate in biological processes such as ECM organization, structural organization, axon development, and regeneration. They are localized to collagen-containing ECM components, including the fibrillar collagen trimer and endoplasmic reticulum (ER) lumen. Molecular functions included ECM structural constituent activity, integrin binding, and growth factor binding (Figure 3C). KEGG analysis revealed enrichment in the relaxin, IL-17, AGE-RAGE, and PI3K-Akt signaling pathways, as well as protein digestion and absorption (Figure 3D).
Identifying diagnostic biomarkers through machine learning
To identify key diagnostic biomarkers for OA, we conducted a thorough feature selection process. Initially, we employed the `train` function from the caret package to identify the optimal ML algorithms. The dataset was divided into training and validation sets, with training set proportions of either 0.7 or 0.8. Among the 6 ML methods evaluated, XGBoost, SVM, and LASSO regression consistently ranked highly in terms of residuals and root mean square error (Supplementary Fig. 3A,B), with AUCs exceeding 0.9 (Supplementary Fig. 3C,D), indicating superior diagnostic performance and learning capability. Consequently, we selected XGBoost, SVM, and LASSO regression to screen for key diagnostic biomarkers for OA.
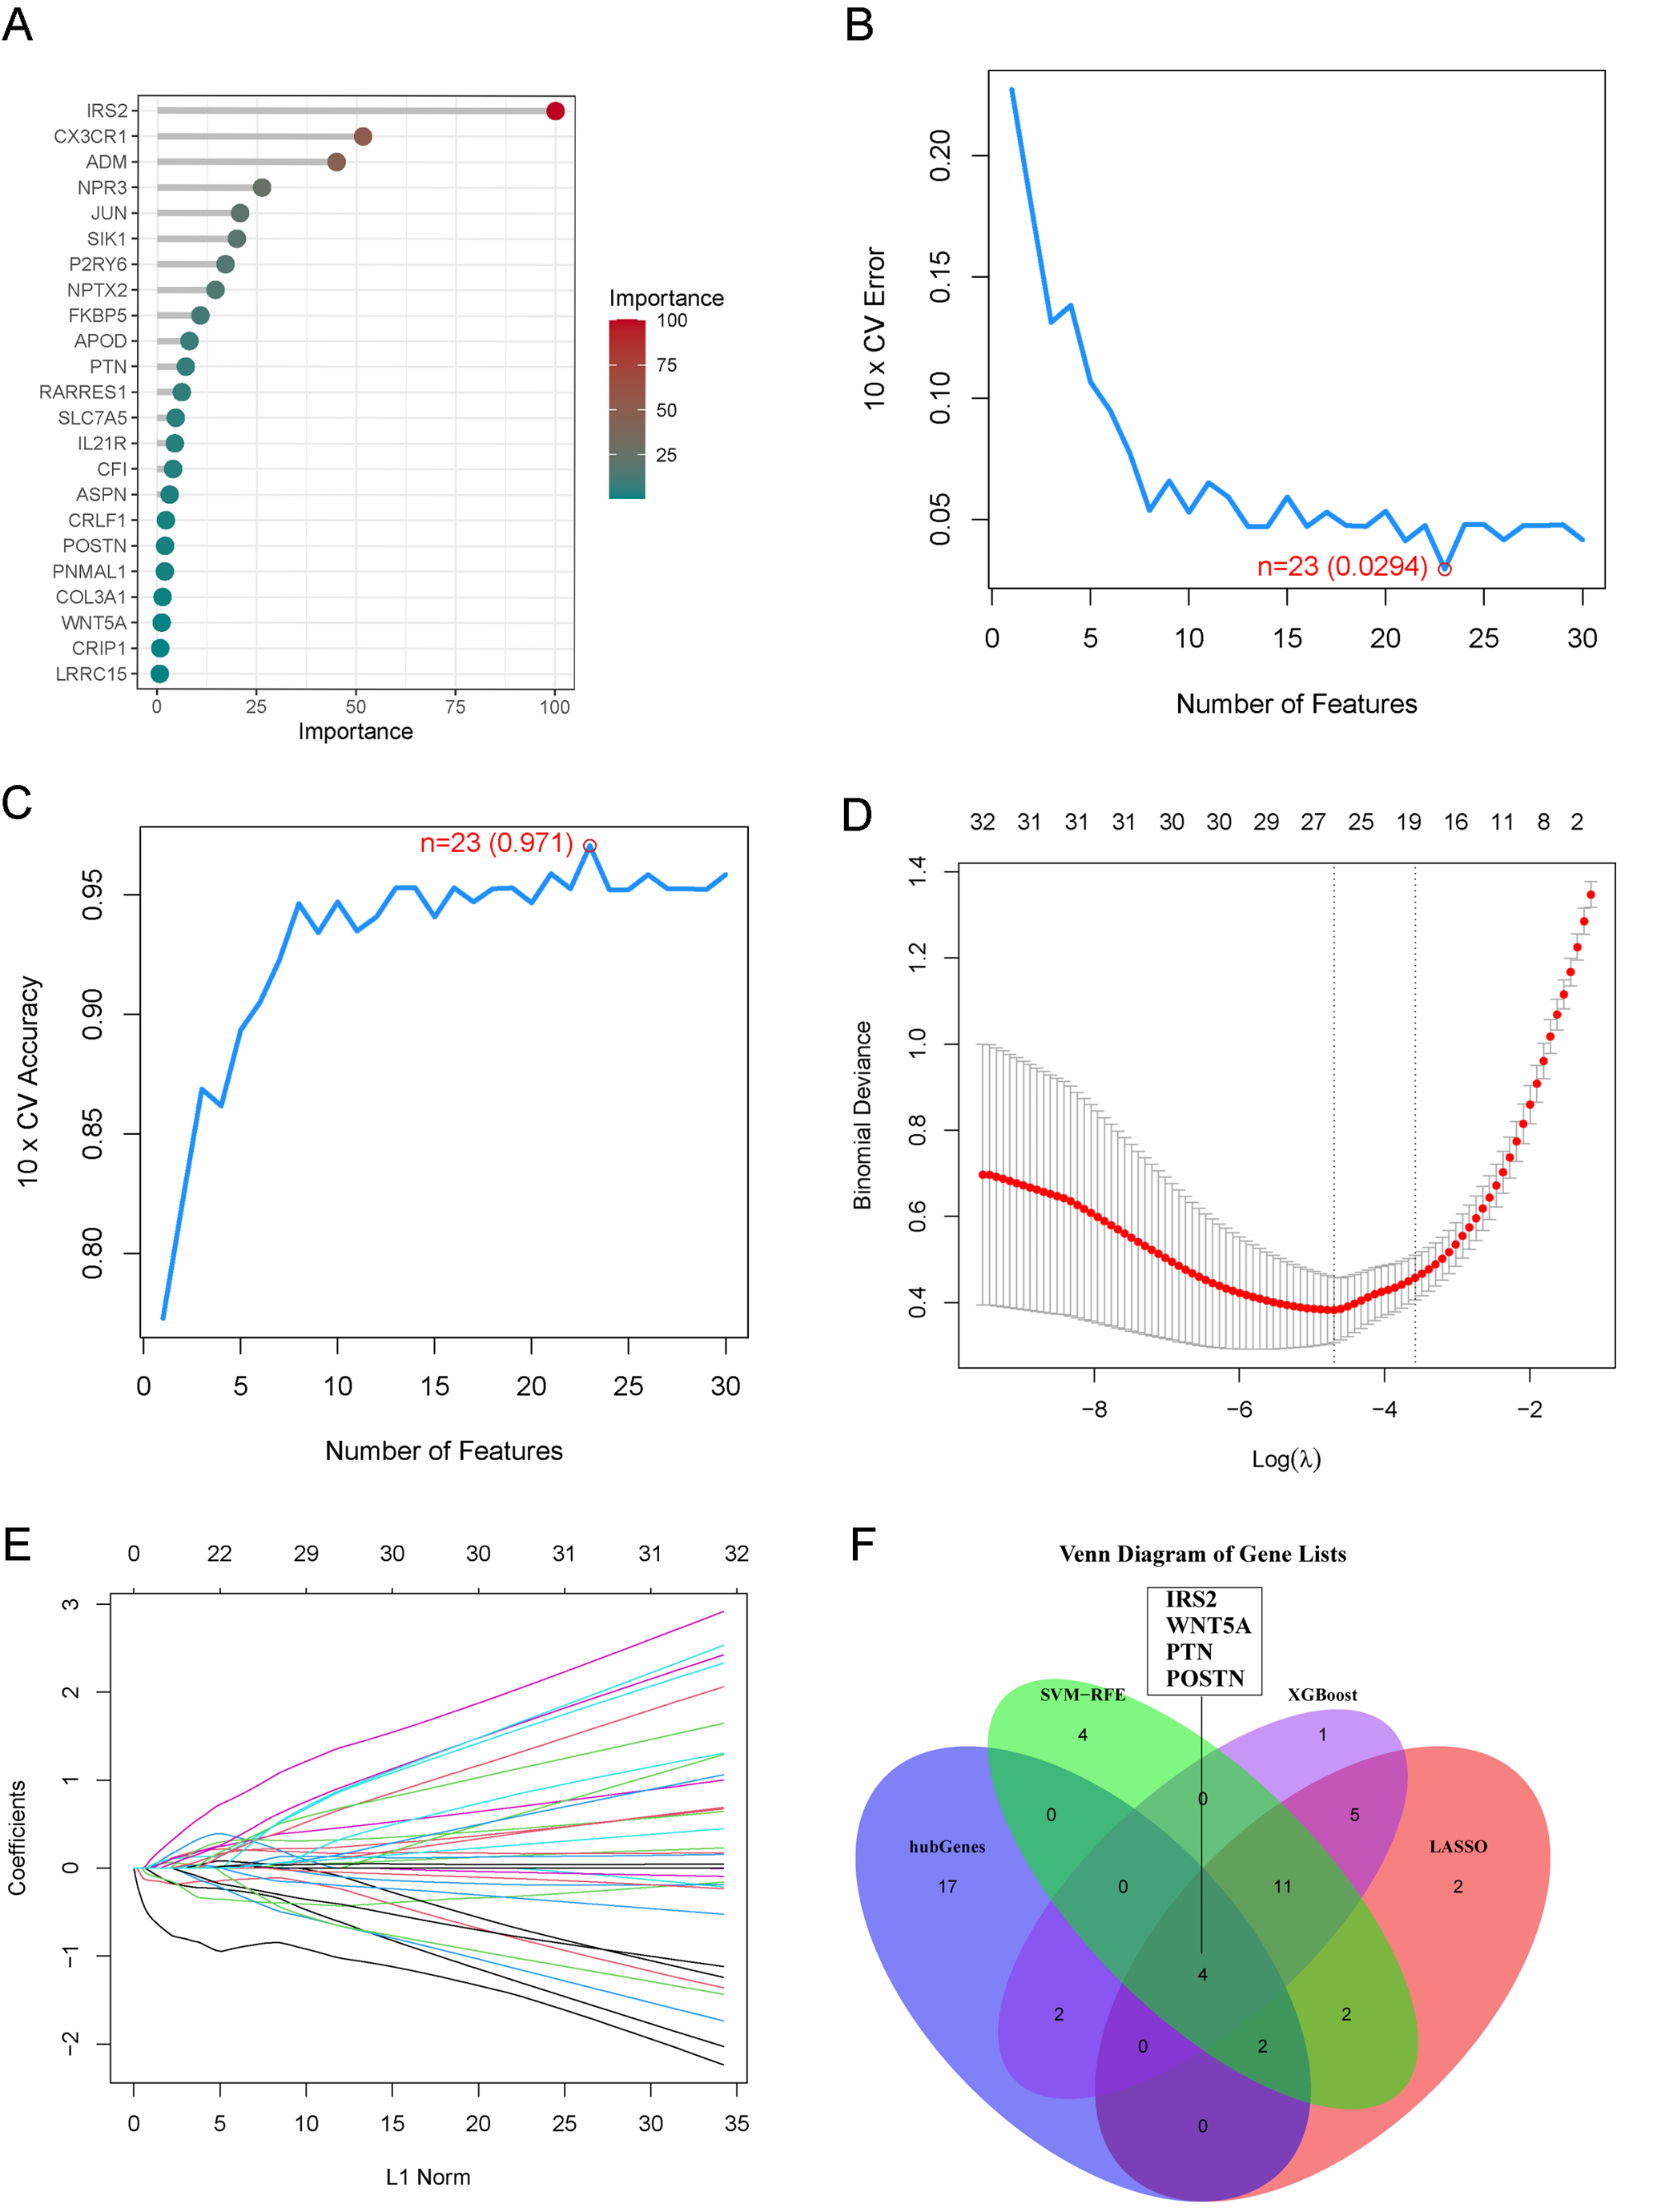
Using the XGBoost algorithm, we identified 23 candidate genes (Figure 4A). The SVM algorithm identified 23 key genes (Figure 4B,C), and LASSO regression selected 26 candidate genes (Figure 4D,E). By intersecting the feature genes identified by these 3 ML methods, we identified 15 candidate genes: IRS2, ADM, SIK1, PTN, CX3CR1, WNT5A, IL21R, APOD, CRLF1, FKBP5, PNMAL1, NPR3, RARRES1, ASPN, and POSTN. Further intersecting these candidate genes with the hub genes, we identified IRS2, PTN, POSTN, and WNT5A as diagnostic biomarkers for OA (Figure 4F).
The functional annotations, interaction partners, and network features of the final diagnostic biomarkers (IRS2, PTN, POSTN, and WNT5A) are summarized in Supplementary Table 1.
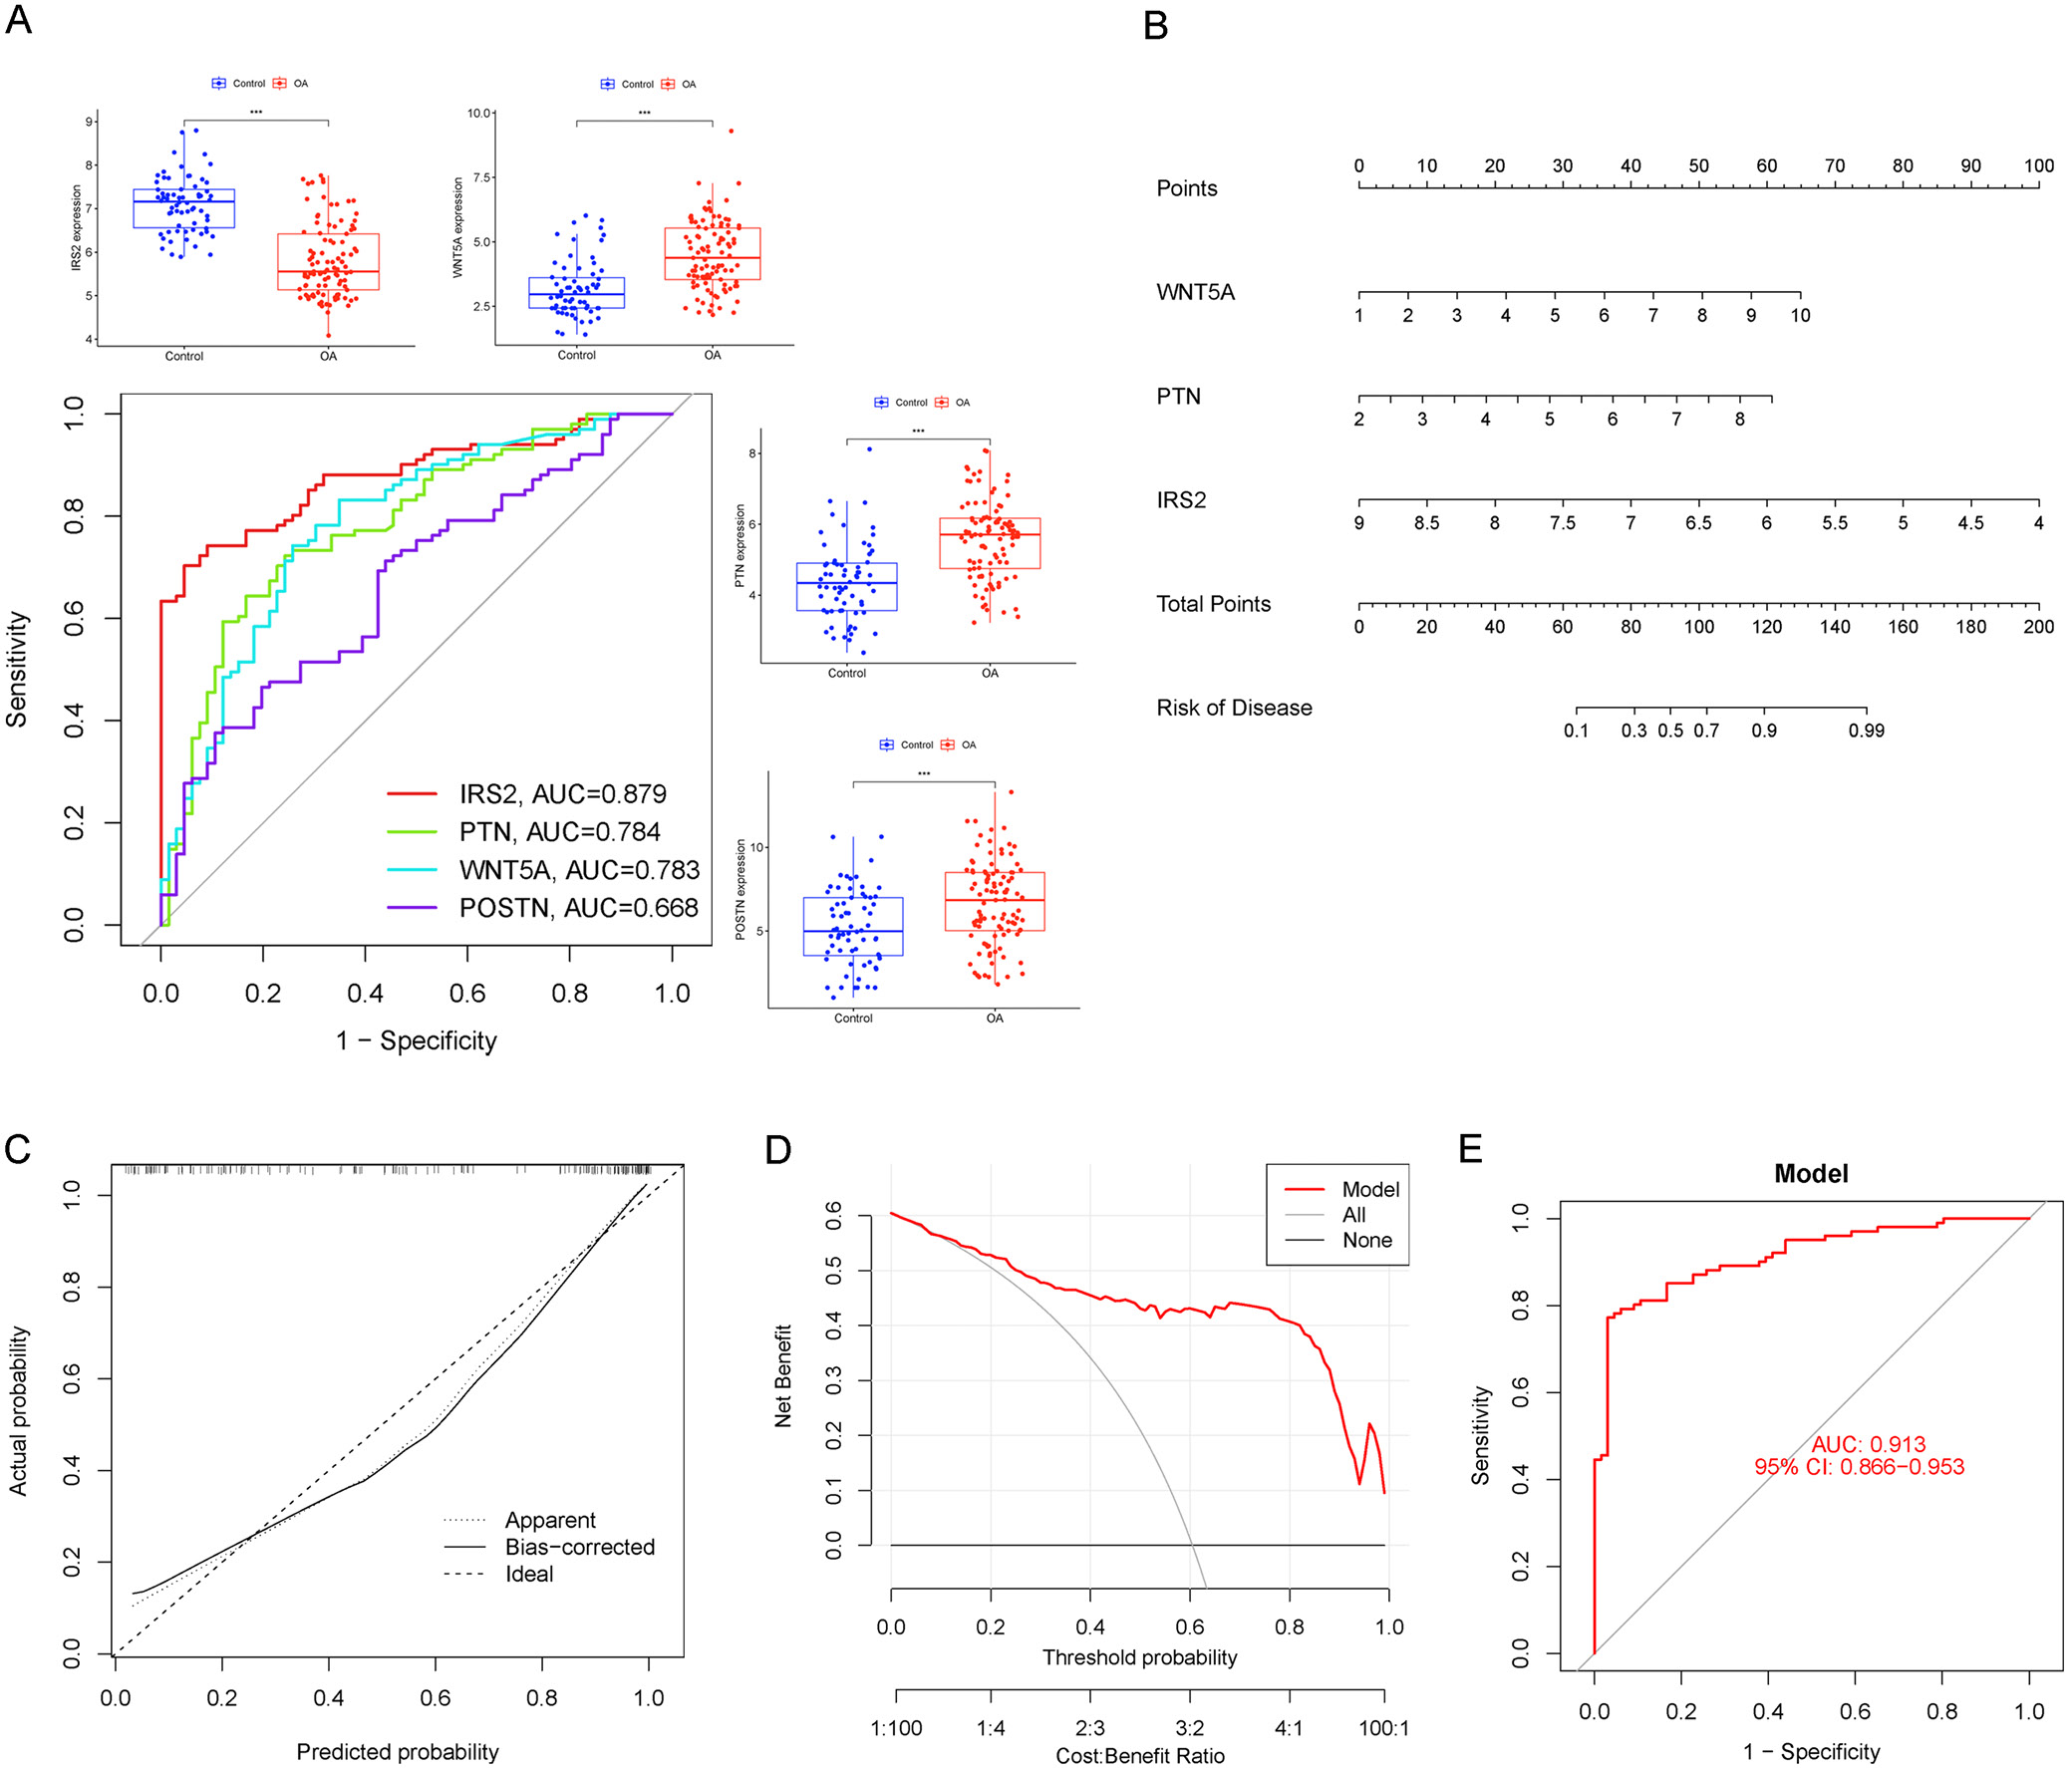
Next, we constructed box plots for these candidate genes, which demonstrated differential expression within the dataset. We used ROC curves to evaluate the specificity and sensitivity of these 4 features for distinguishing OA from normal tissues in the test set. The diagnostic values of the 4 genes were as follows: IRS2 (AUC = 0.879, 95% CI: 0.826–0.927), PTN (AUC = 0.784, 95% CI: 0.707–0.852), POSTN (AUC = 0.668, 95% CI: 0.583–0.748), and WNT5A (AUC = 0.783, 95% CI: 0.706–0.857) (Figure 5A). Since the AUC of POSTN in the test dataset was 0.668, which is below 0.7, we ultimately selected IRS2, PTN, and WNT5A as diagnostic biomarkers for OA. We then constructed a diagnostic nomogram based on the training dataset to develop a clinically applicable diagnostic model for OA (Figure 5B). The calibration curve (Figure 5C) and decision curve (Figure 5D) clearly demonstrated the model’s high predictive ability for OA (AUC = 0.913, 95% CI: 0.866–0.953; Figure 5E).
Validation of relevant screening genes
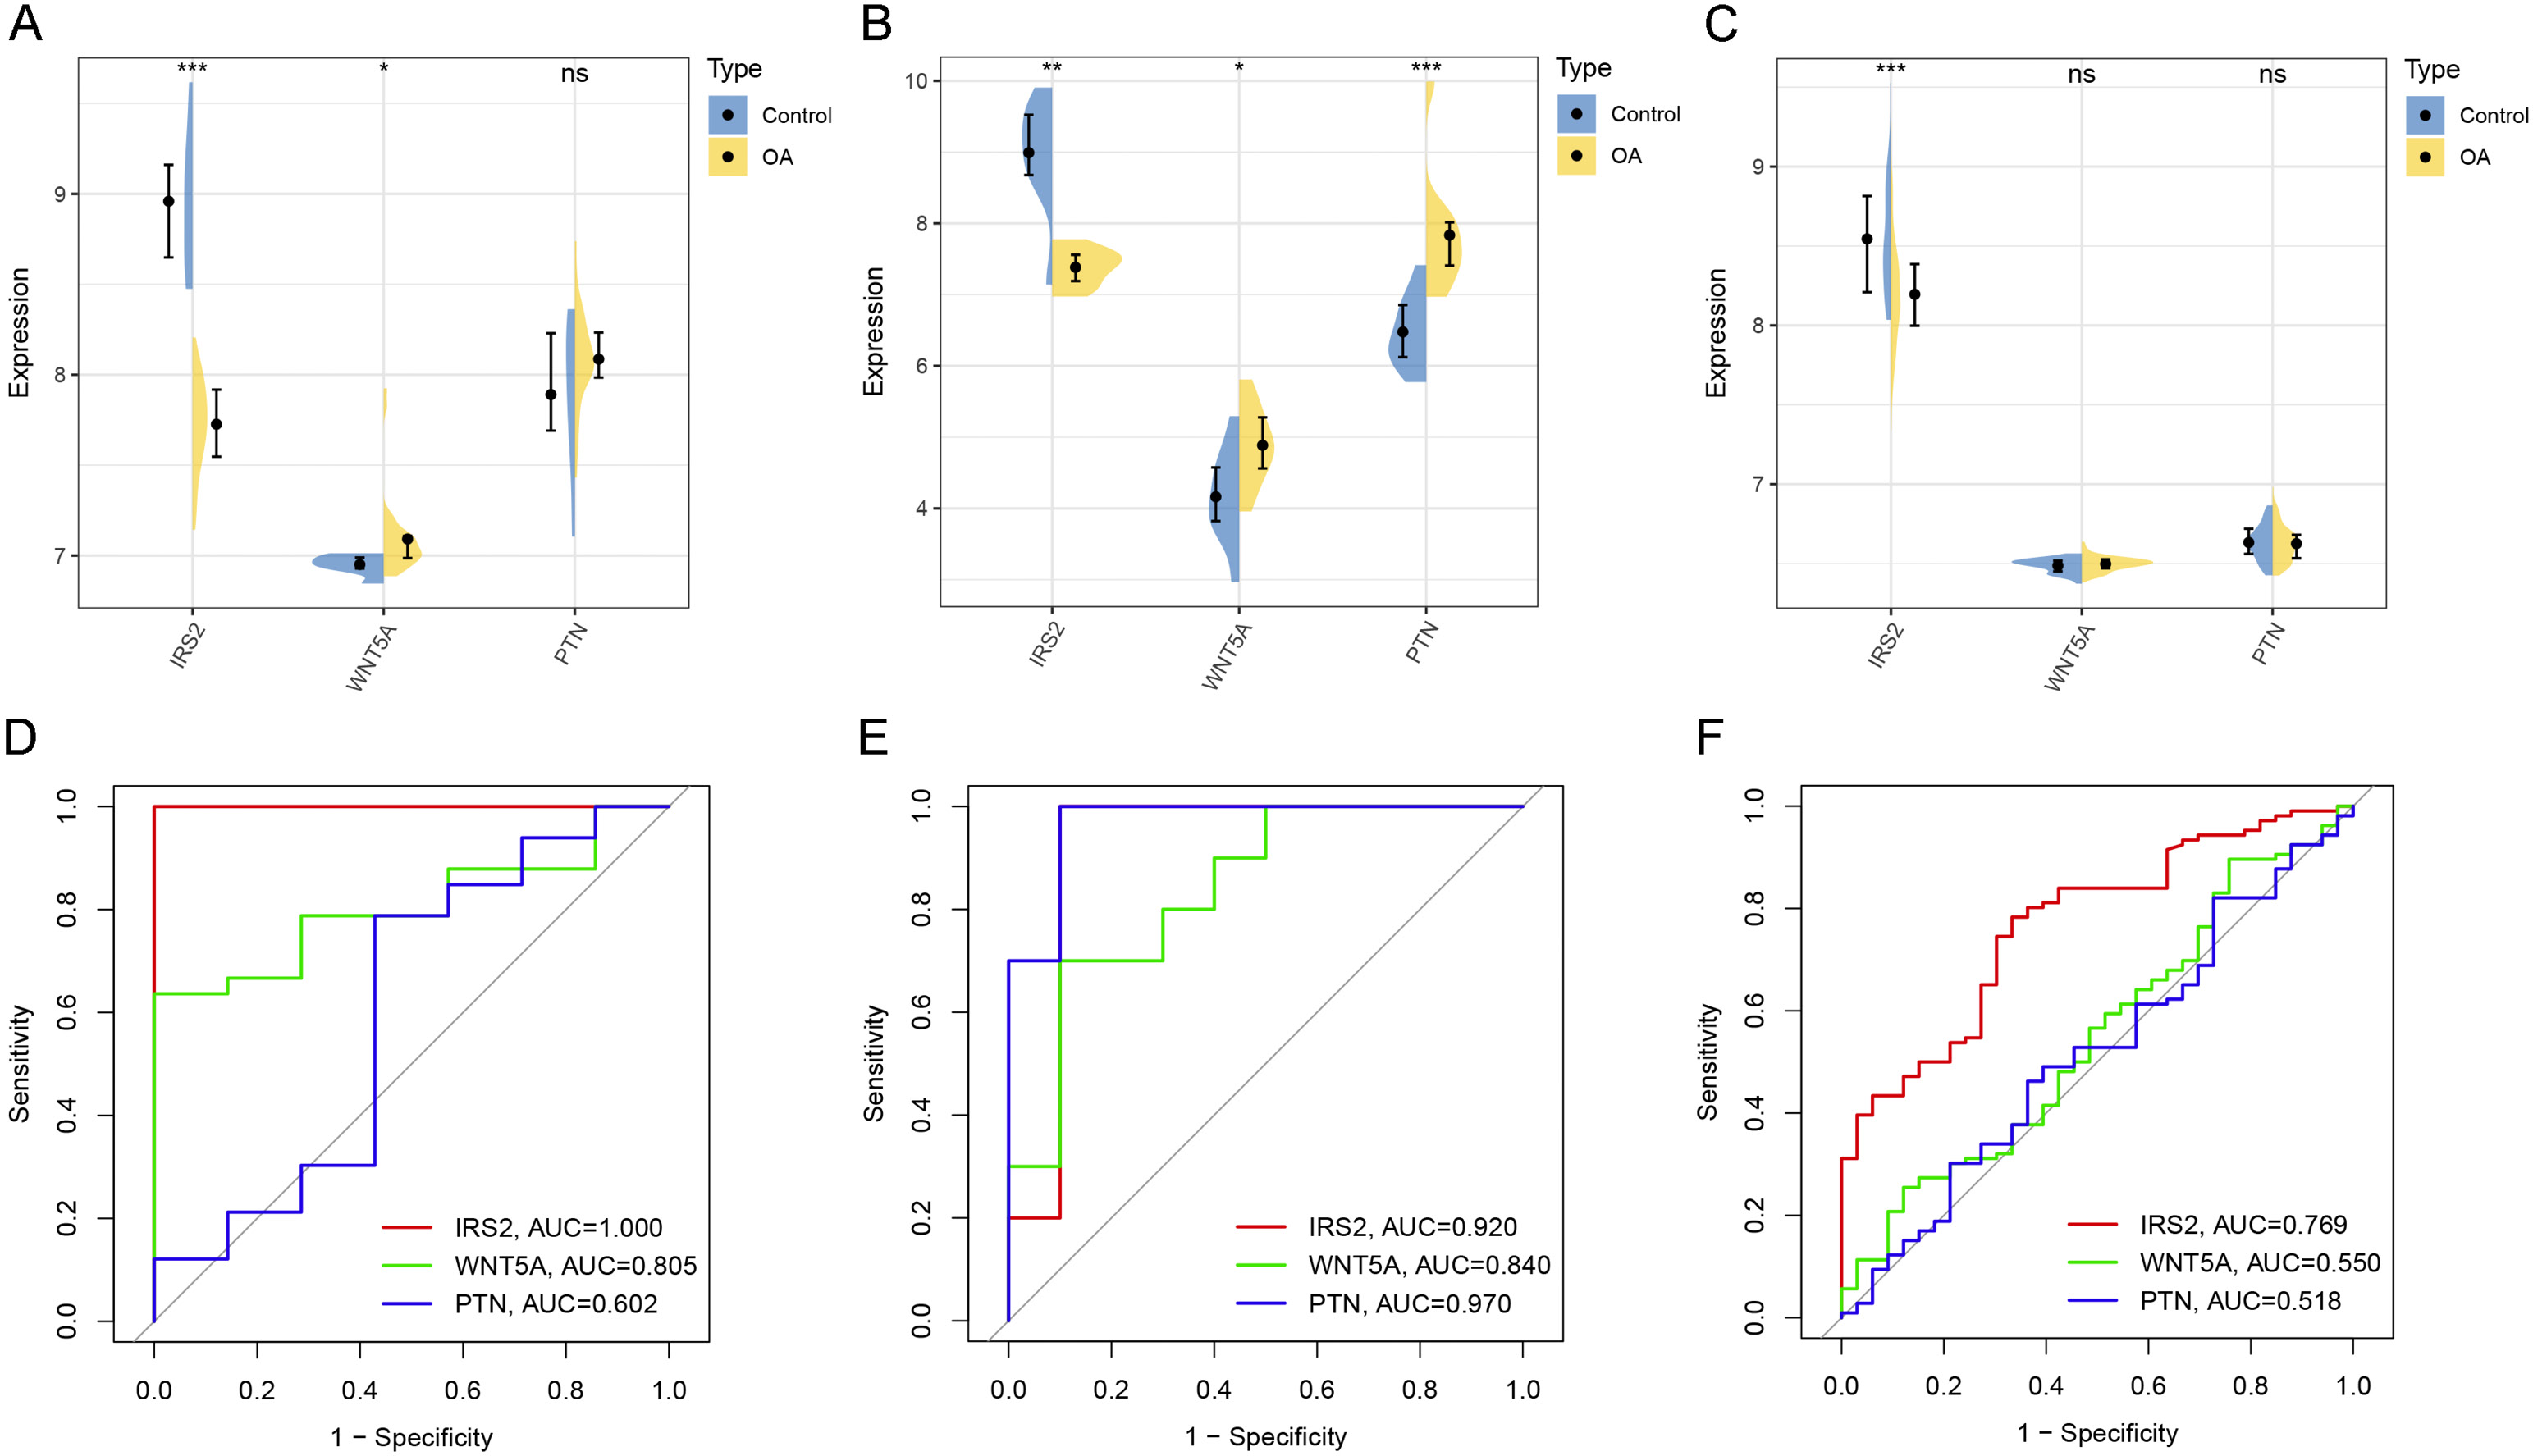
To better validate the clinical diagnostic capability of the candidate genes, we used the cartilage tissue dataset GSE129147, the synovial tissue dataset GSE55235, and the blood sample dataset GSE48556 from OA patients for validation, with sample sizes of 40, 20, and 139, respectively. We constructed violin plots for the candidate genes, which demonstrated differential expression across the datasets (Figure 6A–C). Additionally, we plotted ROC curves to evaluate the diagnostic value of each gene in different tissue samples (Figure 6D–F).
Among these genes, WNT5A had lower diagnostic efficiency in cartilage and blood samples, PTN had poor diagnostic efficiency in blood samples, and only IRS2 exhibited high differential expression (p < 0.01) in all sample types, together with good diagnostic performance, indicating high clinical value.
Experimental validation of IRS2 gene
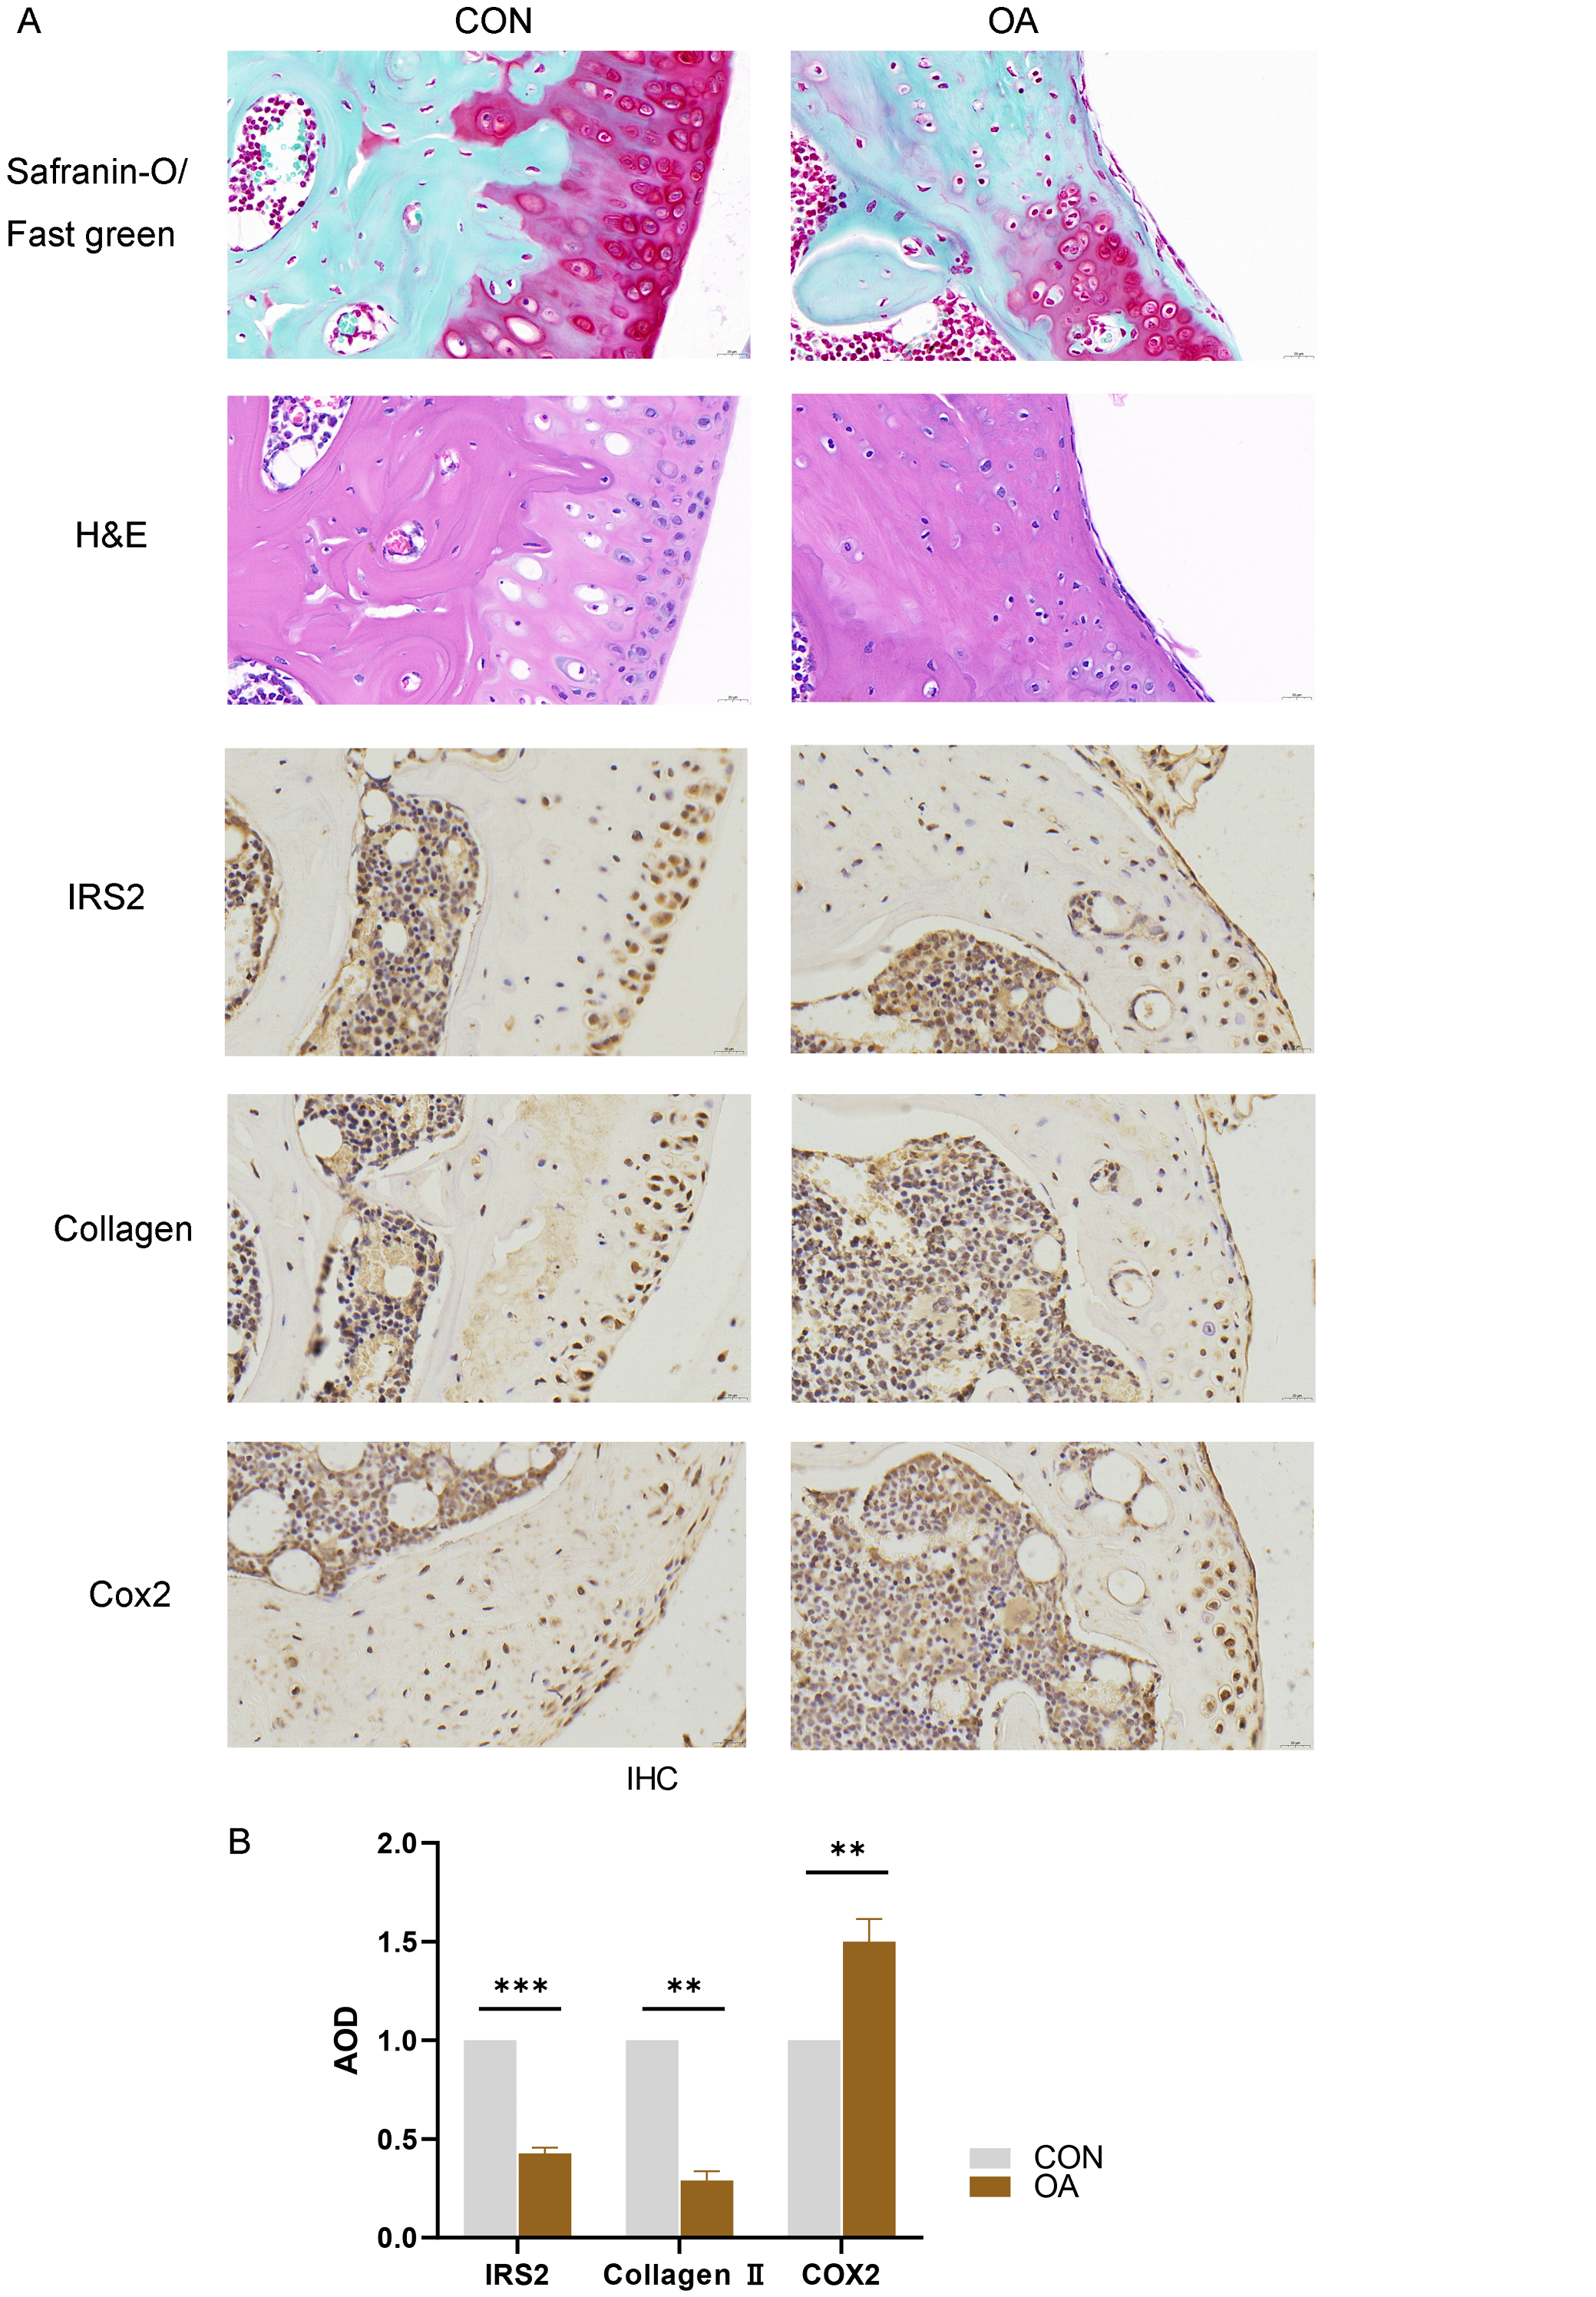
To validate the reliability and potential role of the candidate gene IRS2 in OA, we established a DMM-induced OA model in C57BL/6 mice. Successful model establishment was confirmed through Safranin O–Fast Green and hematoxylin and eosin (H&E) staining, as well as by assessing the expression levels of the OA-related markers COX2 and type II collagen. Immunohistochemical staining for IRS2 (Figure 7A,B) revealed a significant downregulation of IRS2 in OA tissues, consistent with our initial hypothesis.
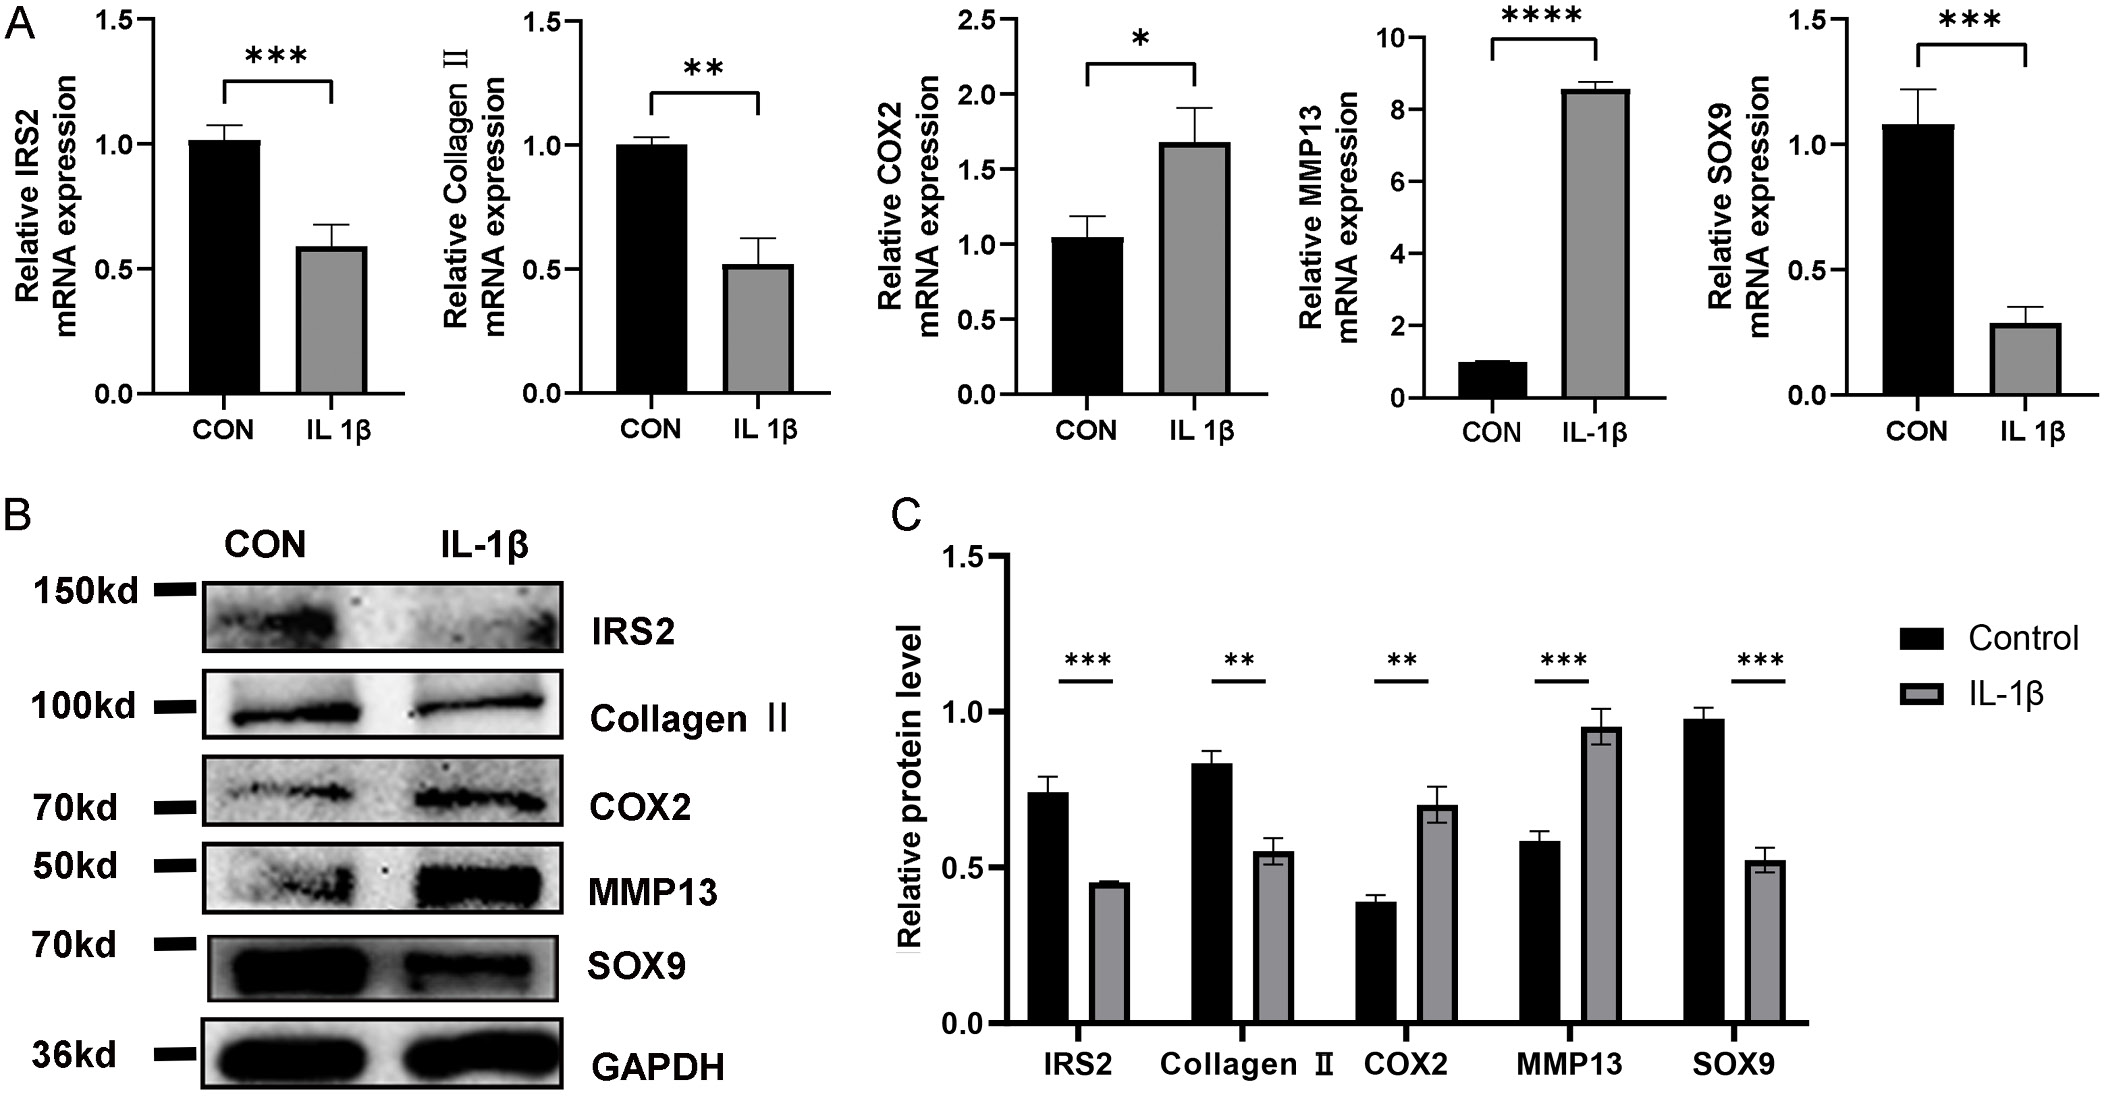
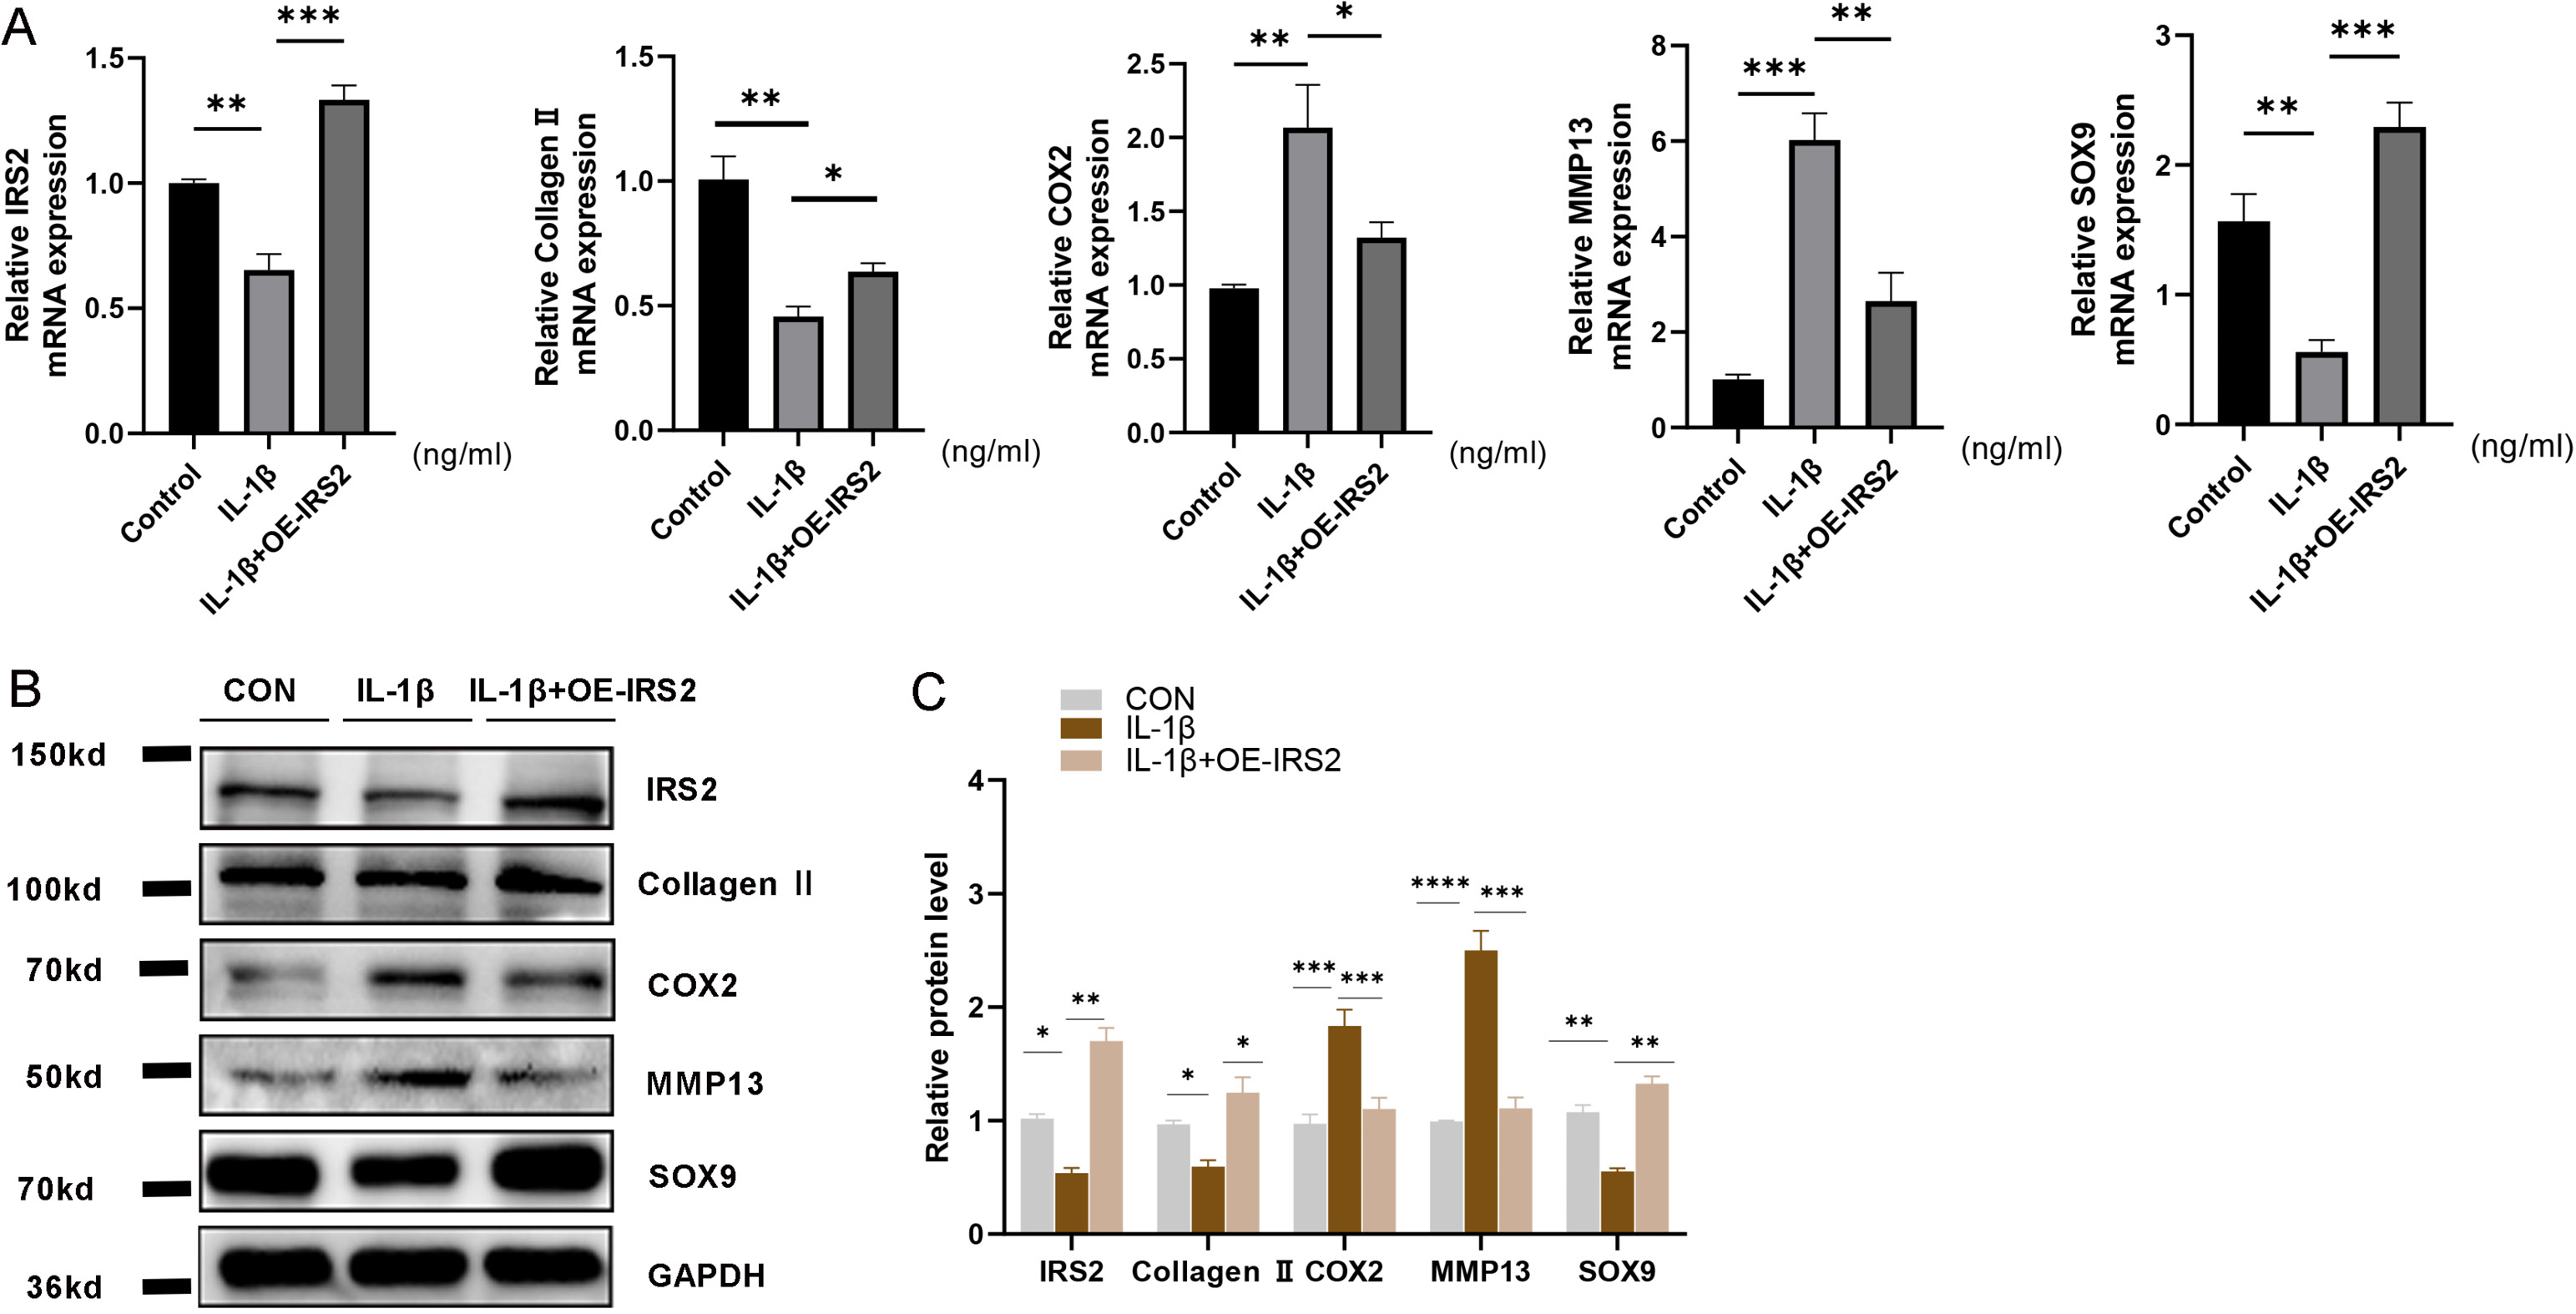
In vitro, we mimicked the OA pathological environment by stimulating the human chondrocyte cell line SW1353 with IL-1β and examined the protein and mRNA expression levels of IRS2 using western blotting (WB) and qPCR. Additionally, to ensure the fidelity of OA modeling, we assessed key phenotypic markers associated with OA. The results showed that, compared to the control group, COL2A1 and SOX9 levels were significantly decreased, whereas MMP13 and COX2 levels were markedly increased in the OA model group, consistent with the typical characteristics of OA. Importantly, IRS2 expression at both the protein and mRNA levels was significantly reduced in the OA group (Figure 8).
To further elucidate the role of IRS2 in OA, we constructed a plasmid-based IRS2 overexpression system in SW1353 cells and again measured IRS2 expression at both the protein and mRNA levels using WB and qPCR. Osteoarthritis-related phenotypic markers were reassessed to confirm the functional impact of IRS2 overexpression. The data demonstrated that IRS2 overexpression significantly restored the expression of COL2A1 and SOX9 while suppressing the upregulation of MMP13 and COX2. Compared to the OA group, the IRS2 overexpression group exhibited significantly increased protein and mRNA levels of IRS2, along with a marked recovery of OA-related phenotypes, with statistically significant differences (Figure 9).
Discussion
Based on the above integrative analysis, we further interpreted the biological significance and potential mechanisms underlying OA. In this study, we explored and validated OA-related biomarkers across multiple tissues using bioinformatics and ML algorithms, aiming to provide new insights into the mechanisms of OA from multiple perspectives. First, we identified 83 DEGs from multiple tissue datasets using the RRA and SVA methods. Functional enrichment, pathway analysis, and DO enrichment analysis of these DEGs revealed their involvement in ECM organization, extracellular structure organization, the relaxin signaling pathway, the PI3K-Akt signaling pathway, and diseases such as connective tissue cancer and musculoskeletal system cancer.
Next, we constructed a PPI network and identified hub genes from the DEGs. Our methods identified 25 hub genes associated with OA. Functional enrichment and pathway analysis of these hub genes revealed their involvement in ECM organization, extracellular structure organization, the relaxin signaling pathway, the IL-17 signaling pathway, the AGE-RAGE signaling pathway in diabetic complications, and the PI3K-Akt signaling pathway. These pathways and functions were highly consistent with those identified for the DEGs, demonstrating the representative value of the identified hub genes. Additionally, these pathways and enrichment results are consistent with previous studies.22, 36, 37, 38
To better identify OA-specific biomarkers, we employed ML algorithms for screening. Initially, we divided the dataset into training and test sets and evaluated the performance of 6 commonly used ML methods. We found that, regardless of the proportion of the training set, XGBoost, SVM, and LASSO regression demonstrated superior performance in identifying OA biomarkers and exhibited higher diagnostic accuracy, significantly outperforming the other ML methods. Consequently, we selected these 3 algorithms for screening OA-specific biomarkers and identified 15 candidates: IRS2, ADM, SIK1, PTN, CX3CR1, WNT5A, IL21R, APOD, CRLF1, FKBP5, PNMAL1, NPR3, RARRES1, ASPN, and POSTN. By intersecting these genes with the identified hub genes, we identified IRS2, WNT5A, PTN, and POSTN as diagnostic biomarkers for OA.
Although POSTN showed statistically significant differences in OA (p < 0.01), its ROC curve yielded an AUC below 0.7, indicating poor diagnostic performance. Thus, we constructed an OA risk prediction model based on the remaining 3 genes. The constructed and validated risk score nomogram was able to distinguish OA from normal tissues, with an AUC of 0.913, indicating high diagnostic accuracy. We validated these diagnostic genes using external datasets of OA cartilage, synovial, and blood samples. In the cartilage dataset, PTN did not show significant expression differences and had an AUC below 0.7. In the synovial tissue dataset, POSTN did not exhibit differential expression compared to the control group. However, in OA blood samples, IRS2 showed statistically significant expression differences and exhibited differential expression across all 3 tissue types (p < 0.01). Its AUC was consistently above 0.7, demonstrating good diagnostic performance. Thus, we have reason to believe that IRS2 may be involved in multiple aspects of OA progression, highlighting its potential as a promising diagnostic biomarker for OA.
Periostin (POSTN) is a 90 kDa matricellular protein discovered in 1993,39 involved in the pathogenesis of various diseases, including tumors, pulmonary fibrosis, and allergic diseases, with expression levels increasing as disease progresses in most cases.39, 40, 41 POSTN interacts with ECM proteins to regulate cell–matrix organization, leading to remodeling and fibrosis. The unique characteristics of POSTN can be attributed to highly complex signaling pathways that lead to increased POSTN production.39 In recent years, its association with orthopedic diseases has also become apparent.42 Numerous studies have confirmed elevated POSTN expression in OA cartilage,43, 44, 45, 46 although its expression in OA synovial tissue and peripheral blood remains controversial. For example, Tajika et al.47 reported high POSTN expression in OA synovial cells, while Attur et al.48 observed no significant difference in expression between OA and control samples. Similarly, Rousseau et al49 found serum POSTN to be associated with OA progression in women, but Sittisak Honsawek et al.50 and Tan et al.51 suggested that serum POSTN levels lack diagnostic value for OA. In our study, POSTN was consistently upregulated in OA cartilage samples but showed no significant changes in synovial or blood tissues. Although it was not ultimately selected as a diagnostic biomarker due to suboptimal performance (AUC < 0.7), its tissue-specific expression pattern may still reflect pathological remodeling in OA cartilage. These findings suggest that POSTN may play a role in disease progression, particularly in cartilage, and warrant further investigation in larger, well-characterized cohorts.
Pleiotrophin is a member of the midkine family,52 a secreted heparin-binding peptide expressed during development in mesodermal and neuroectodermal cells but rarely in adult tissues.53 Pufe et al.54 found that PTN is almost undetectable in normal cartilage and synovial cells but is highly expressed in OA, with significant expression in the early and middle stages of OA but not in the late stage. Furthermore, Pufe et al.55 suggested that PTN might participate in the early onset and development of OA by stimulating the activation of the activator protein-1 (AP-1) transcription factor and altering gene expression. In blood, studies by Fadda et al.56 showed no significant difference in average PTN levels between OA patients and healthy controls, suggesting that while PTN may play an important role in OA, its potential as a disease biomarker requires larger-scale investigation and further research.
In our study, as shown in Figure 6, PTN did not show statistically significant differences in the external cartilage tissue dataset, possibly because our cartilage tissue dataset represented late-stage OA. However, its high expression in the OA synovial tissue dataset is consistent with previous findings. Taken together, these results suggest that PTN may play a role in the diagnosis of early synovitis in OA.
WNT5A is a member of the Wnt protein family, which comprises a group of highly conserved signaling proteins that play crucial roles in embryonic development and various cellular processes, such as cell migration, polarity, and differentiation. WNT5A operates in the non-canonical Wnt signaling pathway, particularly influencing cell movement and polarity rather than directly affecting cell proliferation.57 The high expression of WNT5A in OA cartilage has been confirmed in numerous studies, and its mechanisms of action in OA have been widely explored.58, 59, 60, 61, 62 However, the role of WNT5A in OA synovium is less well understood. Lambert et al.63 found high expression of WNT5A in OA synovium, regulated via the Wnt signaling pathway. This finding aligns with our conclusions. However, the expression of WNT5A in OA blood remains unstudied, necessitating further investigation.
Insulin receptor substrate 2 (IRS2) is a crucial member of the insulin receptor substrate family, playing a key role in insulin signaling and metabolic regulation. It primarily mediates signaling downstream of insulin and other growth factor receptors.64 IRS2 is expressed in various cell types, including those in the liver, muscle, and adipose tissue, and is involved in multiple physiological processes.65 The absence of IRS2 can lead to insulin resistance, which in turn promotes the development of type 2 diabetes.66 Numerous studies have focused on the role of IRS2 in type 2 diabetes, obesity, and non-alcoholic fatty liver disease, exploring its molecular mechanisms.65, 66 Research has shown that the absence of IRS2 can have detrimental effects in various cell types and disease conditions.67 However, the role of IRS2 in OA remains underexplored. In our study, we used external datasets from cartilage, synovial tissue, and OA blood samples for validation and observed consistently low expression of IRS2 across these tissues and sample types. Given the lack of in vivo and in vitro studies investigating IRS2 in OA, we conducted further validation through in vitro experiments. Western blotting and qPCR analyses revealed a significant reduction in IRS2 expression in OA chondrocytes, consistent with the findings from the datasets and statistically significant (p < 0.001). This suggests that IRS2 may play a role in the pathogenesis of OA.
Currently, the precise pathways through which IRS2 contributes to the progression of OA remain unclear. However, existing research suggests that IRS2 may influence disease progression by regulating inflammatory and apoptotic pathways. For instance, a study by Mayumi et al.67 found that, under hypoxic conditions, high expression of IRS2 in macrophages contributes to anti-inflammatory effects in pulmonary vascular remodeling. Similarly, Baquedano et al.68 observed increased oxidative stress and apoptosis in the hypothalamus of diabetic male mice with IRS2 gene knockout. These studies indicate that IRS2 might affect the progression of OA by modulating inflammation and apoptosis. Additionally, research by Kaede et al.69 demonstrated that vitamin C enhances insulin-induced chondrocyte differentiation in ATDC5 cells by upregulating the expression of IRS2 and other insulin signaling molecules. This further supports the potential role of IRS2 in OA.
Future research should focus on elucidating the specific functions and regulatory mechanisms of IRS2 in OA and exploring its feasibility as a potential therapeutic target. Through further mechanistic studies and clinical validation, it is hoped that the role of IRS2 in the pathological process of OA will be elucidated, offering new insights and approaches for the diagnosis and treatment of OA.
Limitations of the study
This study has several limitations. First, it relies on publicly available GEO datasets, which, despite offering rich biological information, may vary in quality, consistency, and sequencing platforms – potentially affecting the reliability of the results despite batch effect correction (e.g., SVA). Second, although 3 diagnostic genes (IRS2, WNT5A, PTN) were identified and showed good performance in ROC analysis, their clinical utility requires further validation. Third, while multiple ML methods (XGBoost, LASSO, SVM) were applied, other models like deep learning were not explored, and model performance on external datasets needs further verification. Lastly, IRS2 expression was only validated in chondrocytes; its role in other OA-relevant tissues (e.g., synovium, subchondral bone, blood) remains to be clarified. Future studies should include broader datasets and deeper functional validation to strengthen the findings.
Conclusions
This study integrates bioinformatics analysis and ML algorithms to identify and validate 3 diagnostic biomarkers for OA: IRS2, WNT5A, and PTN. IRS2 demonstrated high and consistent diagnostic performance across multiple tissue types and external datasets, highlighting its potential as a robust biomarker. WNT5A exhibited good discriminatory ability, particularly in cartilage and synovial tissues. Although PTN showed moderate diagnostic performance overall, its expression patterns suggest potential relevance for early OA diagnosis and warrant further investigation.
Supplementary data
The supplementary materials are available at https://doi.org/10.5281/zenodo.17409505. The package contains the following files:
Supplementary Table 1. Final diagnostic biomarkers for OA and their functional annotations, interacting genes, and network characteristics.
Supplementary Fig. 1. Comprehensive visualization of batch-effect correction and sample grouping.
Supplementary Fig. 2. Identification and enrichment analysis of DEGs in osteoarthritis.
Supplementary Fig. 3. Machine-learning screening of OA feature genes.
Data Availability Statement
The data from the GEO dataset can be downloaded here: https://www.ncbi.nlm.nih.gov/geo
Consent for publication
Not applicable
Use of AI and AI-assisted technologies
Not applicable.
Preprint disclosure
This paper was previously made available as a preprint on Research Square at https://www.researchsquare.com/article/rs-4706641/v1.