Advances in Clinical and Experimental Medicine

Title abbreviation: Adv Clin Exp Med
5-Year IF – 2.0, IF – 1.9, JCI (2024) – 0.43
Scopus CiteScore – 4.3
Q1 in SJR 2024, SJR score – 0.598, H-index: 49 (SJR)
ICV – 161.00; MNiSW – 70 pts
Initial editorial assessment and first decision within 24 h

ISSN 1899–5276 (print), ISSN 2451-2680 (online)
Periodicity – monthly

Download original text (EN)

Advances in Clinical and Experimental Medicine

Ahead of print

doi: 10.17219/acem/208841

Publication type: review

Thematic category: Radiology; neuroscience; innovative technologies

Language: English

License: Creative Commons Attribution 3.0 Unported (CC BY 3.0)

Download citation:

  • BIBTEX (JabRef, Mendeley)
  • RIS (Papers, Reference Manager, RefWorks, Zotero)

Cite as:


Bolla SR, Almazan JU, Satbekov R., et al. Brain volumetric variability and artificial intelligence diagnosis: Importance of race/ethnicity-specific reference standards and social determinant adjustment. A scoping review [published online as ahead of print on March 30, 2026]. Adv Clin Exp Med. 2026. doi:10.17219/acem/208841

Brain volumetric variability and artificial intelligence diagnosis: Importance of race/ethnicity-specific reference standards and social determinant adjustment. A scoping review

Srinivasa Rao Bolla1,A,B,C,D,F, Joseph Uy Almazan2,A,C,E,F, Rauan Satbekov3,A,B,C,D,F, Syed Hani Abidi1,E,F, Dinara Jumadilova2,E,F, Kamila Mussabekova4,E,F, Surendra Maharjan5,E,F

1 Department of Biomedical Sciences, School of Medicine, Nazarbayev University, Astana, Kazakhstan

2 Department of Medicine, School of Medicine, Nazarbayev University, Astana, Kazakhstan

3 Department of Surgery, School of Medicine, Nazarbayev University, Astana, Kazakhstan

4 Consultation and Diagnostic Department, National Center of Neurosurgery, Astana, Kazakhstan

5 Department of Radiology, Weill Cornell Medical College, New York, USA

Graphical abstract


Graphical abstracts

Highlights


• Significant volumetric differences in cortical and subcortical brain structures are observed across ethnic populations.
• Aging, socioeconomic status (SES), and racialized social identity interact to influence brain anatomy, cognitive performance, and health outcomes.
• Population-sensitive neuroimaging templates incorporating race/ethnicity and SES can improve AI-based diagnostic accuracy for neurodegenerative diseases.
• Ethical AI development in neuroimaging requires bias mitigation, data privacy protection, and healthcare accountability.

Abstract

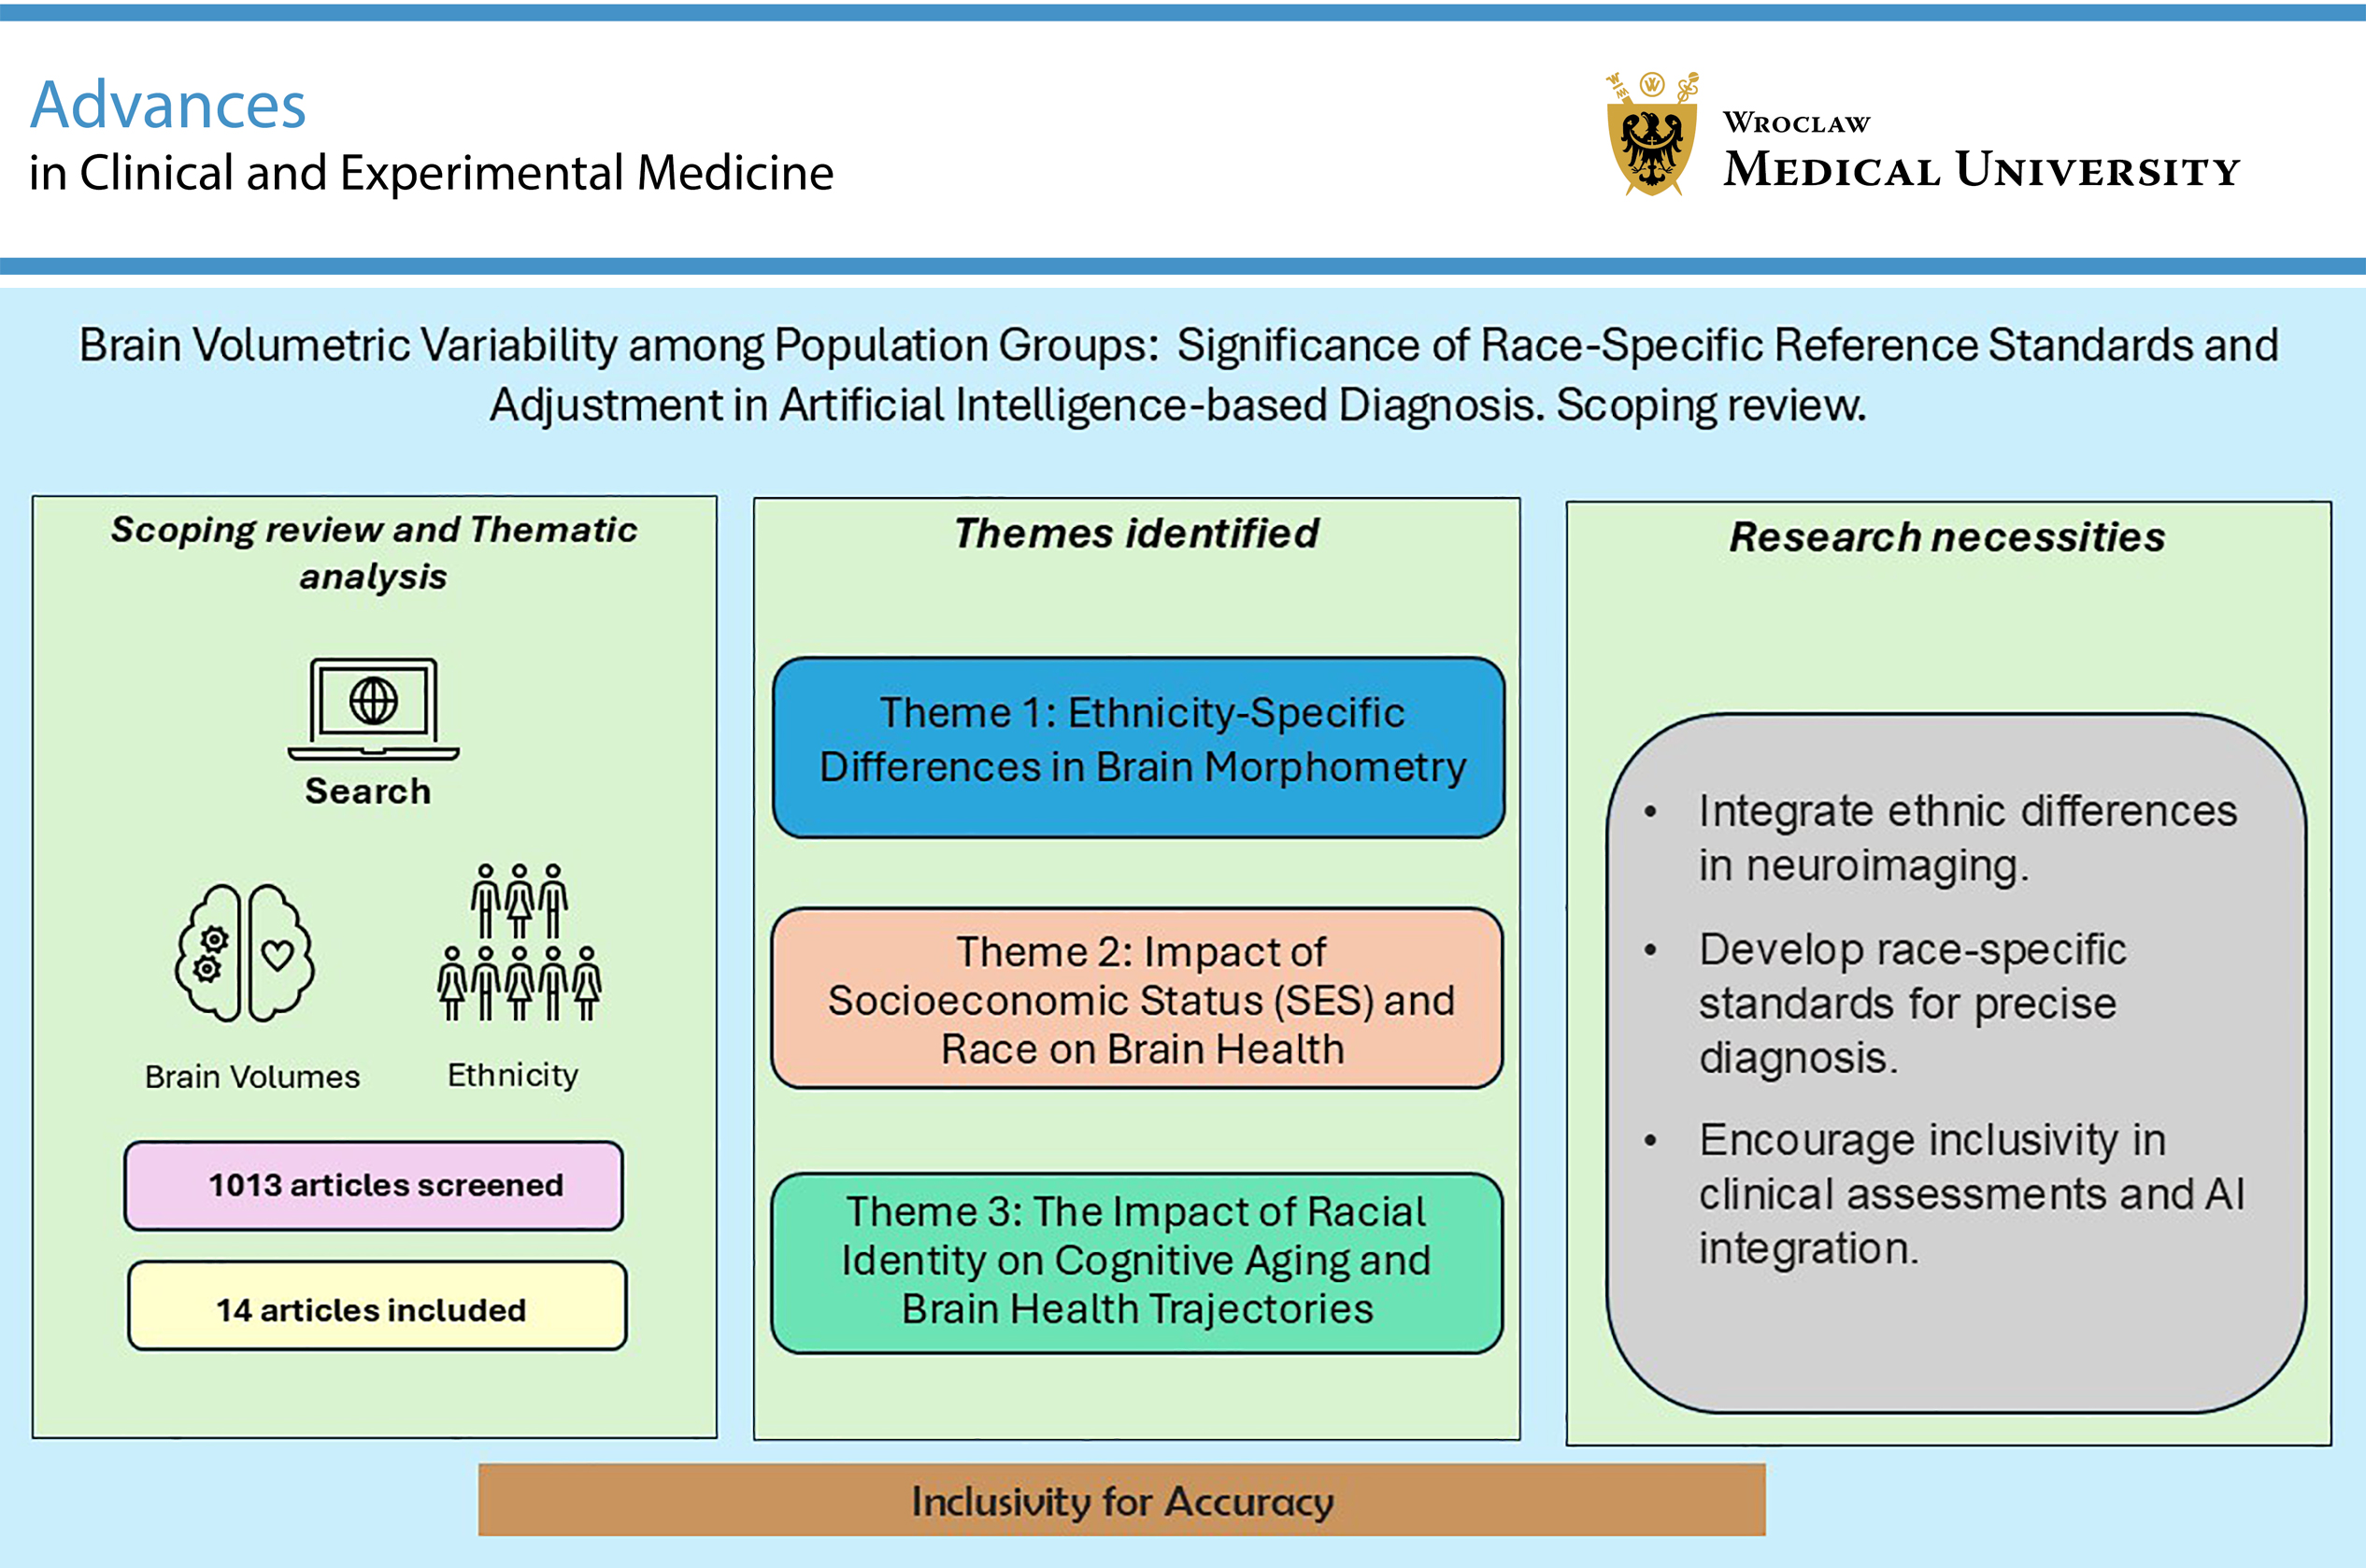
Neuroimaging techniques such as magnetic resonance imaging (MRI) are routinely used in diagnostic radiology to evaluate brain changes associated with neurological and psychiatric conditions. Evidence suggests that imaging biomarkers predict clinical outcomes with varying accuracy across ethnic groups. Underrepresentation of ethnic diversity in neuroimaging research may result in generalization bias, whereby findings derived from one population are inaccurately applied to others. A scoping review methodology was employed to systematically identify and analyze relevant literature. Searches were conducted across EBSCOhost (including CINAHL and Medline Complete), Elsevier (Scopus), Clarivate (Web of Science), and PubMed. Eligible studies examined ethnicity-related differences in subcortical brain volumes and cortical thickness in healthy adults using neuroimaging. The search yielded 1,013 records, which were screened according to predefined inclusion and exclusion criteria. Fourteen studies met the eligibility criteria and were included in the final analysis. The reviewed studies demonstrated significant variations in cortical thickness and subcortical volumes across diverse populations and socioeconomic groups, underscoring the need for population-sensitive reference standards in neuroimaging to minimize generalization bias. These findings highlight the importance of incorporating ethnic variability into neuroimaging research and developing population-sensitive frameworks for MRI-based diagnostic applications. Additionally, the review identifies key areas for improvement, including the integration of ethnic and socioeconomic diversity in artificial intelligence (AI)-driven neuroimaging models to enhance diagnostic precision and equity.

Key words: brain, magnetic resonance imaging, cortex, artificial intelligence, ethnicity

Introduction

Alzheimer’s and Parkinson’s diseases are among the most prevalent neurodegenerative disorders, significantly impacting global health. Over 57 million people were living with dementia worldwide in 2019.1 This number is projected to rise to more than 153 million by 2050 due to population aging. Neuroimaging techniques, particularly magnetic resonance imaging (MRI) and positron emission tomography (PET), are invaluable for diagnosis. The integration of artificial intelligence (AI) into imaging enhances segmentation, lesion detection, and volumetric analysis, thereby facilitating the identification of subtle structural changes and improving early diagnosis of neurodegenerative and psychiatric disorders.2

Beyond neuroimaging, AI applications in health sciences continue to expand. For example, Razdan et al.3 explored the role of AI in pediatric dentistry by analyzing dentists’ perceptions of its diagnostic capabilities. Furthermore, AI models have been developed to assess pediatric frailty syndrome in heart failure4 and pediatric-onset multiple sclerosis.5 The cortical and subcortical brain regions are involved in higher-order cognitive processes, including decision-making, language, complex motor control, emotion, motivation, and basic survival functions, and play a fundamental role in behavior. Specific cognitive domains are associated with distinct brain structures. Memory is linked to hippocampal and entorhinal cortex volumes; attention and processing speed are related to parietal lobe volumes and white matter integrity6; executive functions involve the prefrontal cortex and caudate7, 8; emotional processing and social cognition are associated with amygdala volume8; and global cognitive and social functioning have been linked to thalamic volume.9 Additionally, the prefrontal cortex (PFC) plays a key role in executive functioning, emotional regulation, and decision-making,10 while the pre-supplementary motor cortex and the right inferior frontal gyrus are implicated in reactive action control.11 These brain structures serve as important biomarkers of neurological disorders; their morphology aids diagnosis, monitoring of disease progression, and prognostication. Alterations in cortical thickness and regional brain volumes – including total brain volume, parietal and temporal gray matter, and the hippocampus – are well-established biomarkers of neurodegenerative diseases such as Alzheimer’s disease (AD) and related dementias,12, 13, 14 Parkinson’s disease (PD),15 Huntington’s disease,16 amyotrophic lateral sclerosis (ALS),17 and global cognitive decline.6 Cortical structural abnormalities are likewise observed in psychiatric disorders, including major depressive disorder,18, 19 schizophrenia,20 and bipolar disorder.10, 21, 22

Furthermore, volumetric measures of subcortical structures – including the thalamus, basal ganglia, hippocampus, amygdala, and nucleus accumbens – serve as key diagnostic biomarkers. Subcortical structural alterations have been documented in a range of neurological and psychiatric disorders, including AD,23 PD,24 schizophrenia, bipolar disorder, major depressive disorder, and autism spectrum disorder.25, 26, 27

Ethnic differences in brain volumes in both health and disease are well documented in the literature and have important implications for clinical practice and research. For example, studies comparing Caucasian and African American populations,28 as well as Korean and other East Asian cohorts,29, 30 have reported significant differences in cortical and subcortical volumes. In a multiethnic study, Black participants demonstrated larger total brain volumes, while both Black and Hispanic participants exhibited higher white matter volumes compared with other groups.31 Differences in pathological markers have also been observed. Black participants showed a greater burden of white matter hyperintensities (WMH), whereas Japanese individuals demonstrated less functional disability despite comparable levels of brain atrophy.31

Understanding differences in these brain biomarkers is crucial for accurate diagnosis, particularly in the context of AI-driven neuroimaging. Although genetic ancestry may contribute to intergroup variation in brain morphology,30 such differences are more consistently associated with social determinants of health, including income, education, access to healthcare, and chronic stress exposure.31, 32 Recognizing race as a sociopolitical construct rather than a purely biological determinant33, 34 helps prevent the perpetuation of biological essentialism within AI-based diagnostic frameworks.35, 36 A significant challenge arises from the fact that commercially available AI-enabled neuroimaging software is primarily trained on data derived from geographically limited populations, particularly in the USA, Europe, and China,37, 38, 39, 40 thereby introducing potential bias. Consequently, the development of inclusive AI models with broader population representation – integrating biological, social, and geographic determinants – is essential to enhance diagnostic equity and generalizability.

This review critically examines evidence from the literature on how racial, ethnic, and social determinants, conceptualized as sociopolitical and structural factors, influence brain volumetric variability. Throughout the review, racial and ethnic groupings are used within a socio-structural context rather than as biologically fixed categories. Moreover, we adopt the term “population-sensitive” to describe approaches that consider both biological variation (e.g., ancestry and sex) and socio-structural determinants (e.g., race, ethnicity, and socioeconomic status).

Although the cited literature variably uses the terms “race,” “ethnicity,” and related constructs, our use of the term “population-sensitive” aims to provide a more inclusive and precise framework that avoids reinforcing essentialist or reductive interpretations. While acknowledging the diagnostic benefits of race-aware AI models and population-specific templates, we also highlight the associated ethical risks, including racial essentialism and algorithmic bias. This review emphasizes the importance of evidence-based, bias-reducing strategies that prioritize diagnostic accuracy, equity, and scientific rigor.

Objectives

This scoping review explores differences in cortical and subcortical volumes among diverse populations and addresses the following research questions:

– What is known about cerebral cortical and subcortical volumetric differences across ethnic groups, and how do these differences affect AI-based neuroimaging tools?

– What is the role of specific cortical and subcortical brain structures in health and in neurological and psychiatric conditions?

– How do normative brain volumes across different population groups influence diagnostic accuracy, AI model generalization, and population-sensitive standards?

– What are the potential challenges, biases, and ethical considerations involved in incorporating ethnicity and socioeconomic status (SES) when developing population-sensitive norms and AI models in neuroimaging?

Concept

This scoping review, based on MRI studies, examines population-specific differences in brain volumetry among healthy adults and their implications for ensuring accurate diagnoses and equitable AI-driven assessments. As described earlier, the term “population-sensitive” is used to highlight a comprehensive approach that integrates biological variation (e.g., ancestry and sex) with socio-structural influences (e.g., race, ethnicity, and socioeconomic status). A population-sensitive perspective emphasizes diagnostic precision and equity while preventing the reinforcement of racial essentialism in AI development.

Context

Given the increasing integration of AI into diagnostic processes, population-level diversity in brain volumetry is a key factor in interpreting MRI scans, necessitating population-sensitive reference standards. This review identifies key themes and evaluates the feasibility of personalized diagnostic standards to enhance the accuracy and fairness of AI-based neuroimaging.

Materials and methods

This scoping review follows the framework proposed by Arksey and O’Malley41 and later refined by Levac et al.42 to systematically explore ethnic differences in brain volumetry among healthy adults using MRI data. Scoping reviews are useful for mapping key concepts in emerging fields, identifying research gaps, and guiding future investigations.43 Although scoping reviews do not require formal quality appraisal,44 this study enhances transparency and reliability by acknowledging the methodological limitations of the included studies and presenting a structured summary table.

Search strategy

Initially, we conducted a preliminary search across the EBSCOhost databases (including CINAHL (Cumulative Index to Nursing and Allied Health Literature) and MEDLINE Complete), Elsevier databases (Scopus), Clarivate databases (Web of Science), and PubMed, which yielded no published reviews on the specified topic. Subsequently, a 2nd search was performed across the same databases to identify relevant articles published between 2014 and 2024, in order to capture the most recent data and refine the search output. The search terms were (“brain anatomy” OR “brain size” OR “brain structure” OR “brain morphology” OR “brain volume” OR “brain volumetric” OR “brain morphometry”) AND (“race” OR “racial” OR “ethnicity” OR “ethnic” OR “racioethnic”).

To enhance clarity and provide specific support for the need for population-sensitive diagnostic standards, the search specifically focused on studies examining ethnic variability in brain morphology. We included studies comparing cortical and subcortical brain volumes across different racial and ethnic groups to ensure that our review captured the full scope of morphological differences relevant to neuroimaging practice.

This review included studies that analyzed brain volumes using MRI across different ethnic groups, as well as studies that compared brain volumes among different ethnicities. Only studies involving healthy adult populations were included. The search encompassed peer-reviewed studies published in English and other languages.

Studies were excluded if they: focused primarily on adolescent or pediatric populations; did not compare volumetric outcomes across racial or ethnic groups; used imaging modalities other than MRI; or lacked full-text availability.

Selection of studies

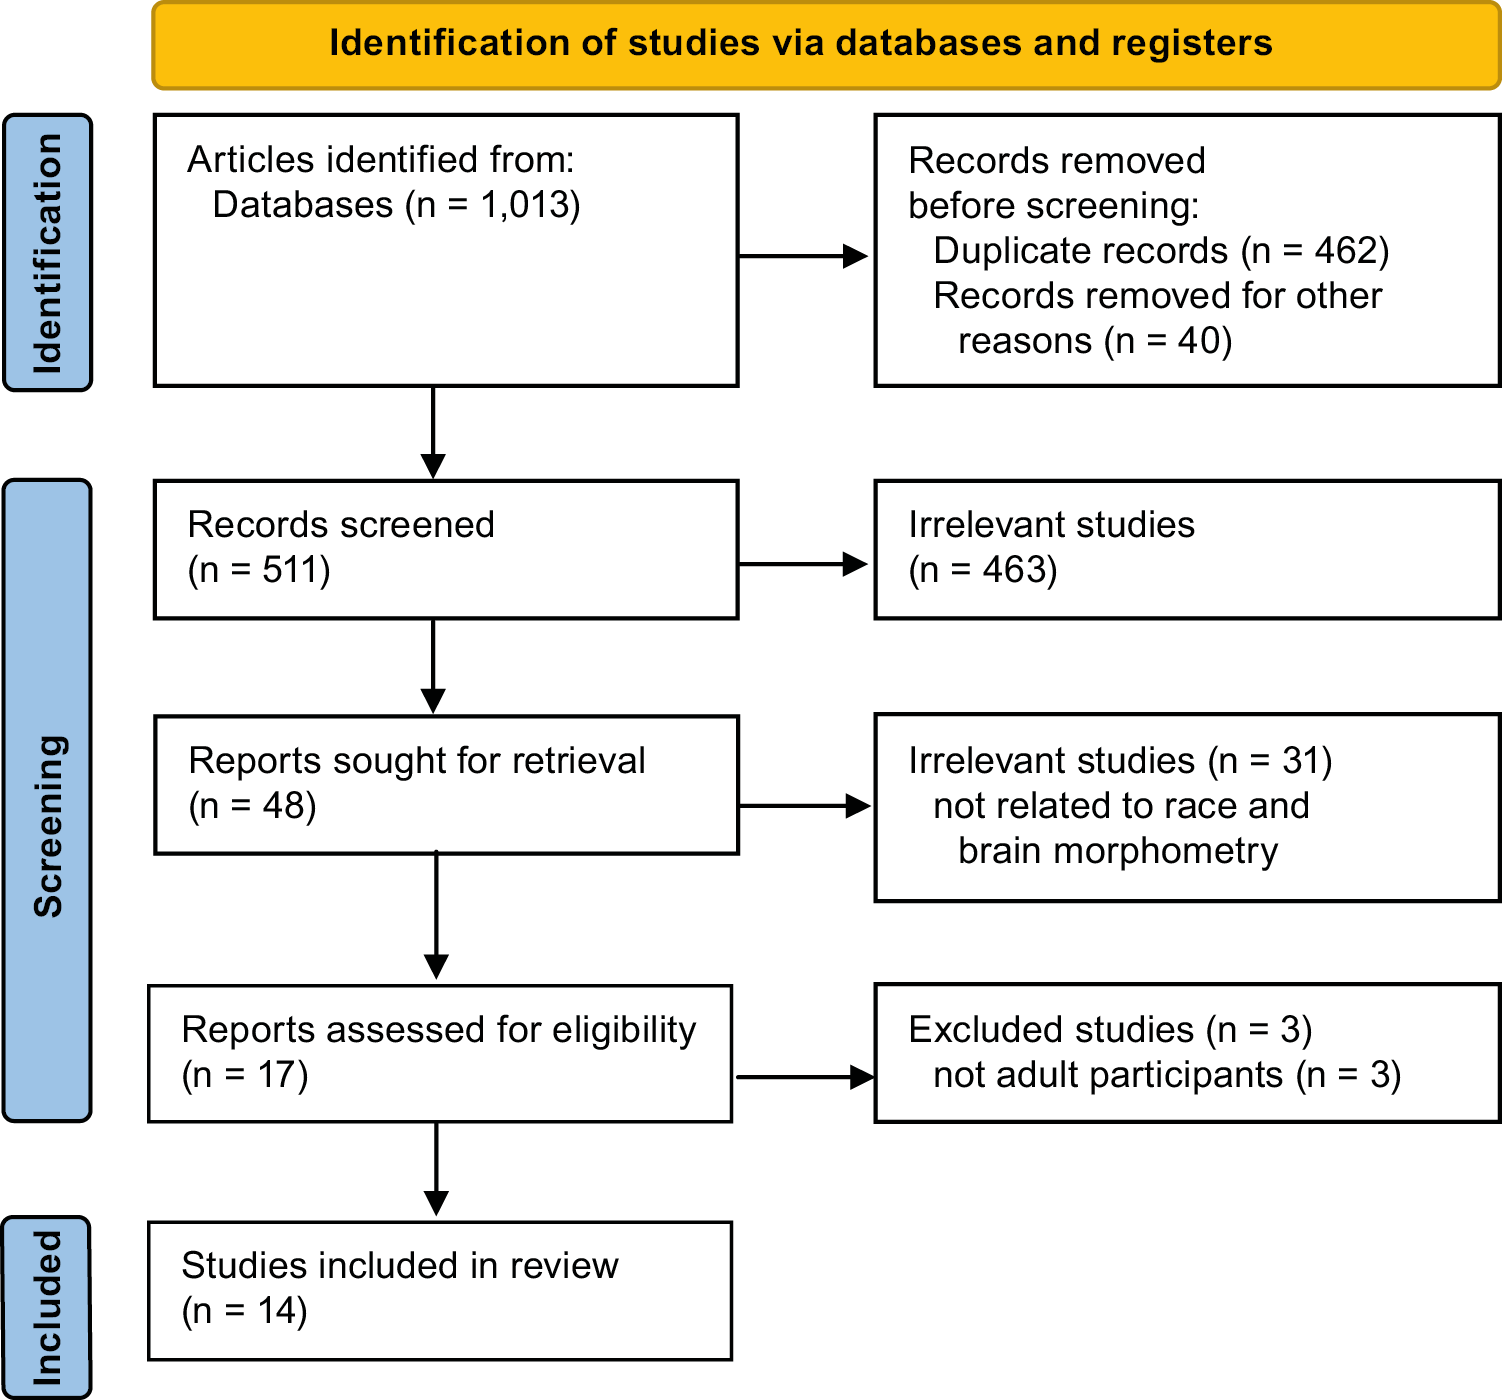
All citations retrieved through the database search were imported into the Zotero reference management software (https://www.zotero.org). Two independent reviewers (A.J. and S.R.) assessed the titles and abstracts to determine their relevance according to the inclusion criteria. Disagreements regarding study inclusion were resolved through discussion to ensure consistency in the selection process. Following the initial screening phase, full-text versions of the selected articles were reviewed, and the exclusion criteria were applied. Excluded studies were documented, with justifications provided for their removal. The final selection process followed the Preferred Reporting Items for Systematic Reviews and Meta-Analyses Extension for Scoping Reviews (PRISMA-ScR) flowchart (Figure 1). A standardized data extraction form was used to chart study design, population characteristics, MRI modalities, segmentation software, and key findings. Two reviewers (A.J. and S.R.) independently extracted the data, and discrepancies were resolved by consensus.

Study heterogeneity

Studies included in this review varied in MRI acquisition protocols, analytical approaches, and population demographics, which may introduce inconsistencies in the findings. To manage this heterogeneity, we: 1) identified common study designs (predominantly cross-sectional); 2) highlighted differences in MRI modalities and processing methods; and 3) evaluated key limitations, such as scanner variability, small sample sizes, and confounder adjustment (e.g., for age, sex, and SES).

Quality assessment and methodological limitations

Although a formal risk-of-bias assessment was not mandated, we conducted a structured methodological appraisal using the Joanna Briggs Institute (JBI) Checklist for Analytical Cross-Sectional and Cohort Studies.44 The identified limitations are summarized in Table 128, 29, 30, 45, 46, 47, 48, 49, 50, 51, 52, 53, 54, 55 and include: variability in MRI protocols; differences in volumetric measurement software; limited ethnic diversity and generalizability; and inconsistent adjustment for confounding variables. To complement Table 228, 29, 30, 45, 46, 47, 48, 49, 51, 52 and Table 350, 54, a domain-based summary of the potential risk of bias across the included studies is presented, based on the JBI critical appraisal tool for cross-sectional and cohort studies. Each study was evaluated across key domains, including clarity of inclusion criteria, validity of outcome measurement, and management of confounders. This visual overview provides a structured understanding of the distribution of bias risk across the evidence base.

Data analysis

Thematic analysis was performed following Braun and Clarke’s six-step framework.56 This process included familiarization with the findings, coding, and synthesis of themes related to racial differences in brain structure, diagnostic implications, and challenges associated with AI-based models. Given the high methodological heterogeneity, a meta-analysis was not feasible.57 Instead, a qualitative synthesis was conducted to explore nuanced patterns in population-specific volumetric variability.

Results

Search outcome

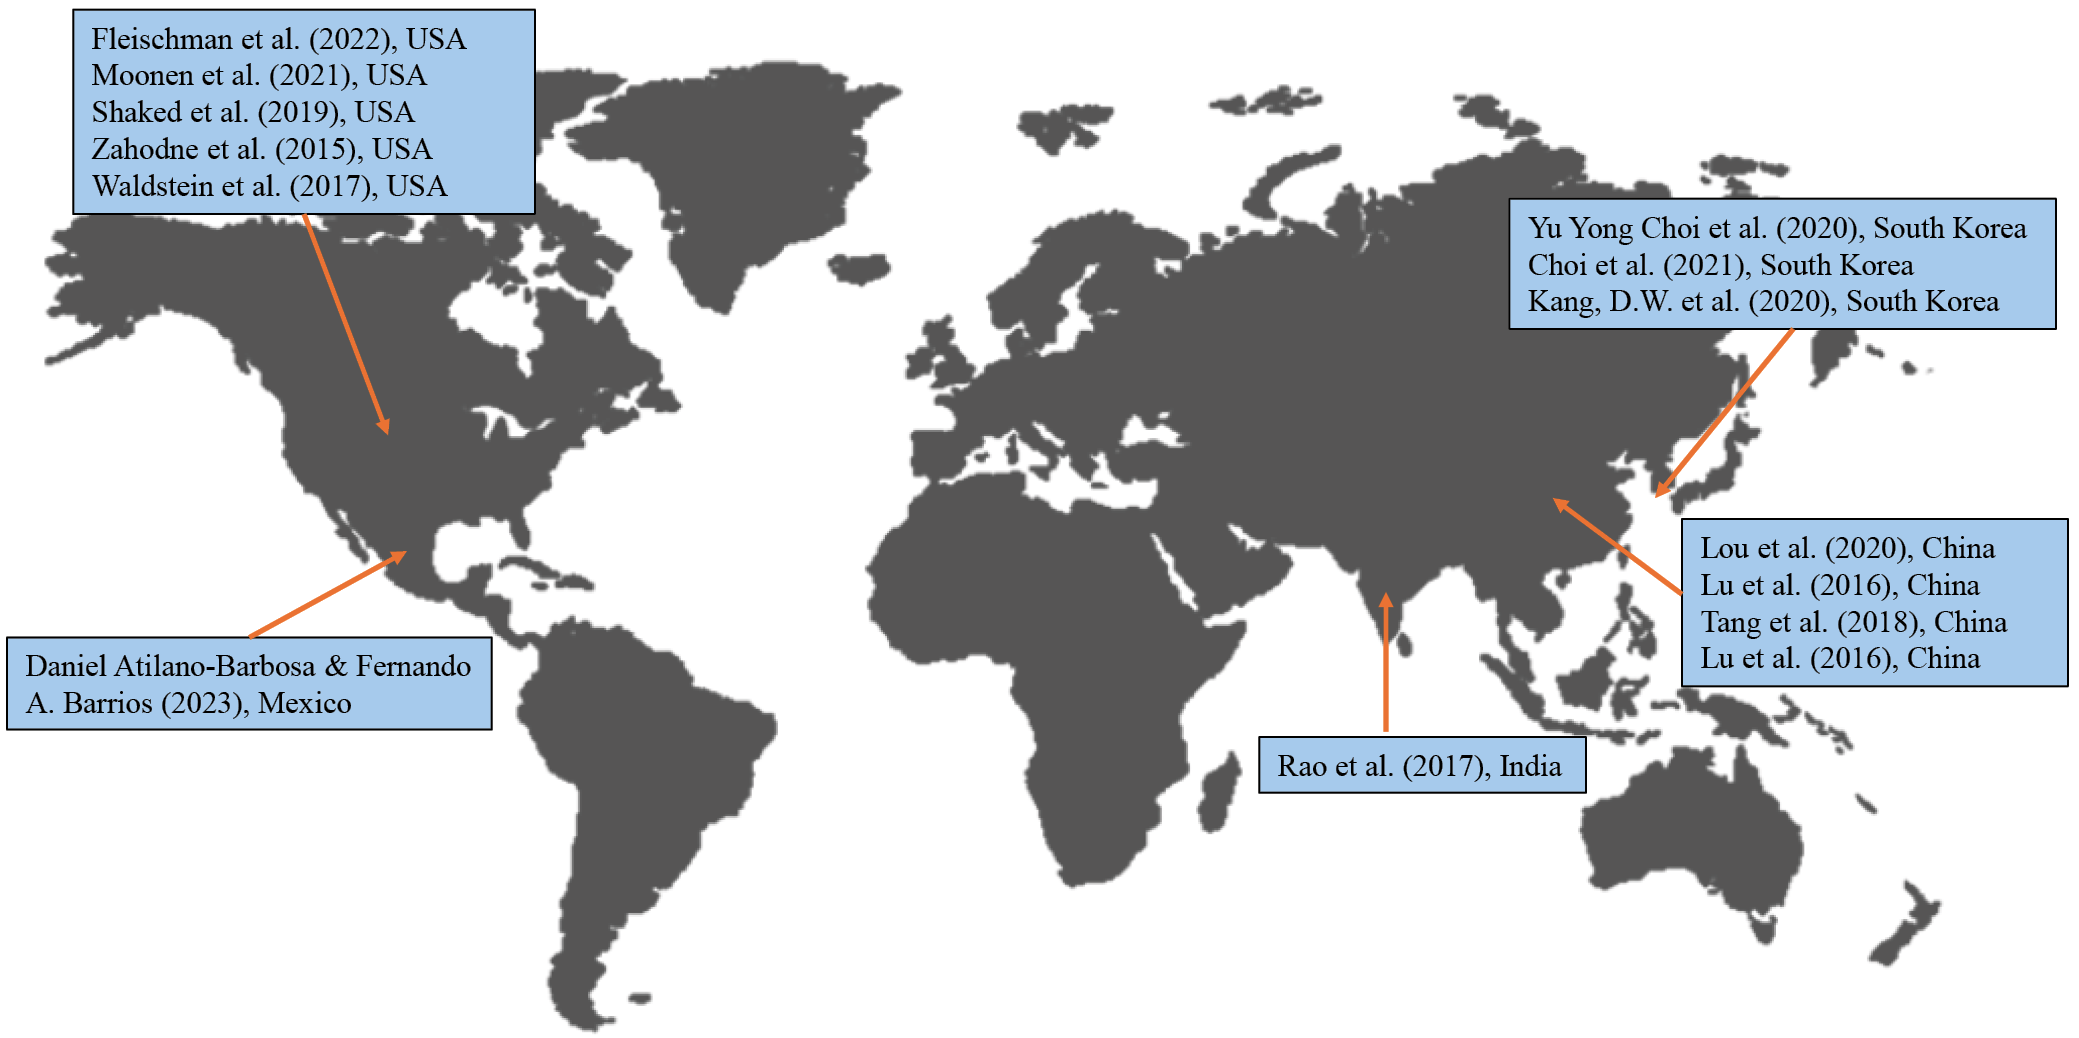
Initially, 1,013 research articles, including publications in English and other languages, were identified across 4 databases (EBSCOhost, Elsevier, Clarivate, and PubMed). During the identification stage, 462 duplicate records were removed, and an additional 40 articles were excluded due to lack of full-text availability. The remaining 511 articles were screened based on titles and abstracts, and 463 were excluded as they were not relevant to the review topic. The remaining 48 articles underwent full-text review, and 31 were excluded because they did not focus on racial differences in brain volumetric outcomes. Thus, the remaining 17 relevant articles were assessed against the exclusion criteria, and 3 were excluded because the primary study population consisted of adolescents. Consequently, this scoping review included 14 articles with comparative and cross-sectional observational study designs that provided evidence relevant to the research questions. The shortlisted studies were conducted in the USA, Mexico, South Korea, China, and India (Figure 2, Table 1).

Thematic analysis of the shortlisted studies

This scoping review synthesizes findings from 14 multinational studies published between 2014 and 2024, encompassing diverse populations, including Caucasian, East Asian, South Asian, Latinx, and African American cohorts. Specifically, findings from the shortlisted studies were categorized into 3 major themes: 1) race/ethnicity-specific differences in brain morphometry; 2) the impact of SES and race/ethnicity on brain health; and 3) the role of racial identity in cognitive aging and brain health trajectories. These themes collectively emphasize the interplay between genetic, environmental, and socioeconomic factors in shaping brain aging and disease susceptibility.

Theme 1: Race/ethnicity-specific differences in brain morphometry

Studies consistently reported structural differences across ethnic groups in cortical thickness, surface area, and subcortical volumes. The most frequently cited regions included the frontal, temporal, parietal, and occipital lobes, as well as subcortical structures such as the hippocampus and choroid plexus.28, 29, 30, 45, 46, 47, 48, 49, 50 For instance, Chinese participants generally exhibited larger temporal and cingulate cortices but smaller frontal and parietal regions compared with Caucasian participants.49 Similarly, significant morphometric differences were observed between Chinese and Indian groups, particularly in gray matter distribution within the frontal, temporal, and occipital lobes.47 Studies comparing East Asian groups (Koreans and Uyghurs) with White participants reported widespread differences in cortical thickness and surface area, especially in language-associated regions such as the frontoparietal operculum.29, 30, 46 In U.S.-based samples, African American participants exhibited distinct patterns of white matter and subcortical volume compared with White participants,28 with larger hippocampal volumes associated with better memory outcomes among non-Hispanic White individuals.50 These group-level differences in brain volume should be understood as arising from interacting factors such as ancestry, environmental exposures, education, and systemic inequalities, rather than as evidence of inherent biological distinctions. This perspective supports the view that population-level differences are shaped by environmental influences over time rather than by innate biological traits.

Theme 2: Impact of socioeconomic status and race/ethnicity on brain health

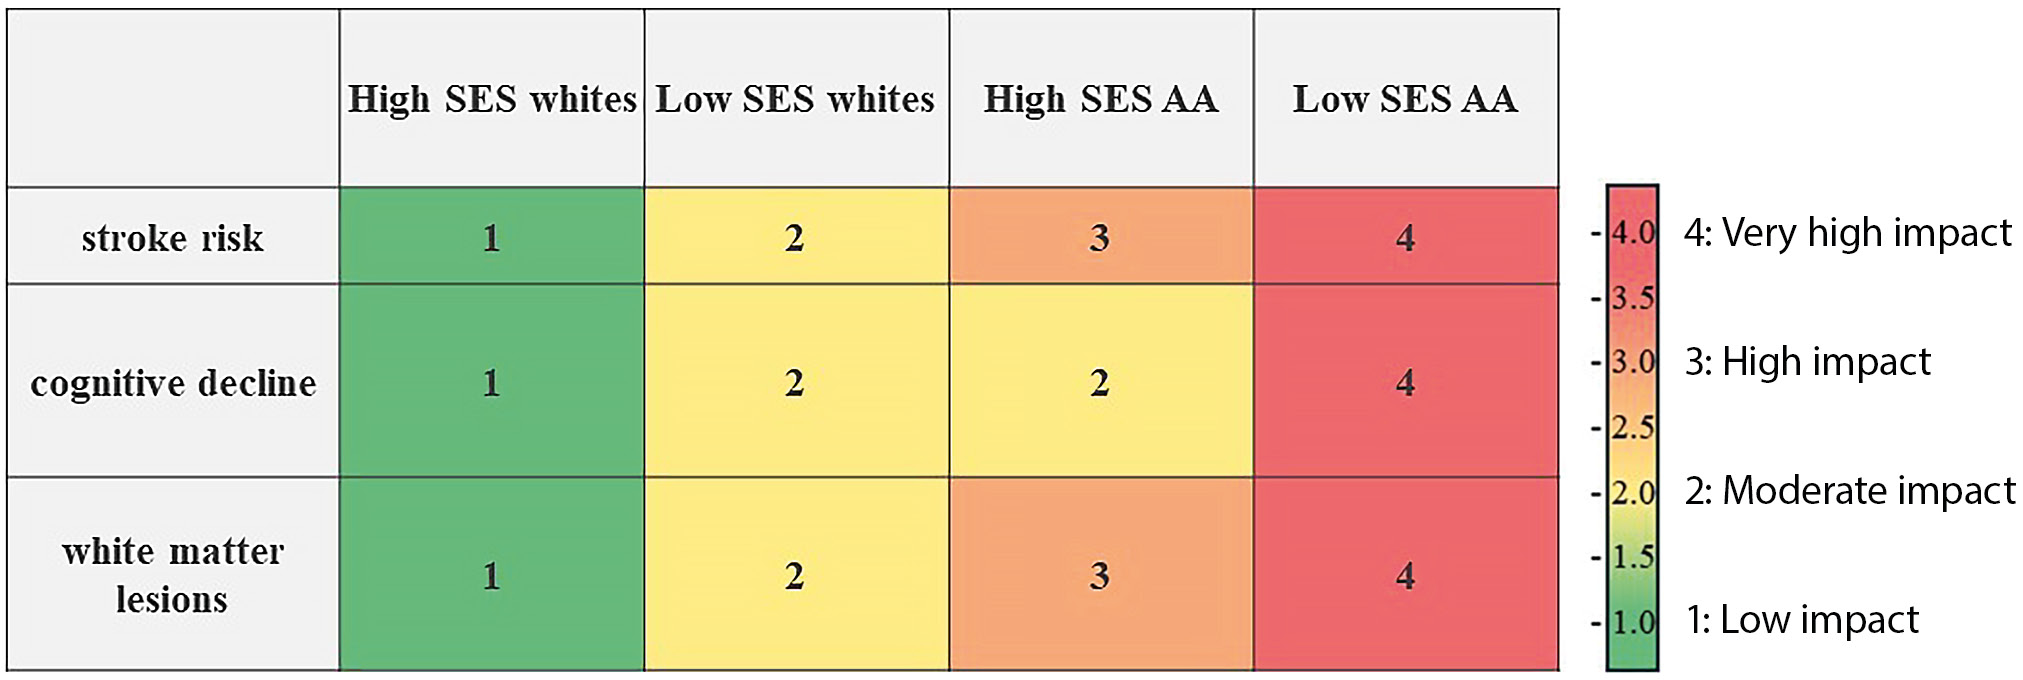
The interplay between race/ethnicity, SES, and brain health is a significant factor in understanding neurodevelopment and cognitive aging. Disparities in education, income, access to healthcare, and employment stability influence brain structure and function, with cumulative exposure to stressors exacerbating racial disparities in neurological health (Figure 3).51, 52 Waldstein et al.52 found that higher SES was associated with neuroprotection against cognitive decline and cerebrovascular damage, predominantly among White populations, whereas African American participants derived fewer protective benefits from SES advantages. This finding suggests that economic gains alone may not counteract the effects of chronic stressors that disproportionately affect racial minority groups. Zahodne et al.50 identified racial disparities in WMH, an MRI marker of cerebrovascular health. African American participants exhibited larger WMH volumes, which were strongly associated with poorer executive function, whereas this pattern was not observed in non-Hispanic White participants.50 Increased WMH burden was associated with lower psychomotor speed and poorer executive function, reflecting overall cognitive status and brain health.58 Fleischman et al.53 found that lower hippocampal volume was associated with episodic memory deficits in aging Black adults. Despite these well-documented disparities, current AI-driven diagnostic models in neuroimaging often fail to incorporate SES-related variables, potentially exacerbating healthcare inequities.

Theme 3: The impact of racial identity on cognitive aging and brain health trajectories

Racial identity influences not only baseline brain structure but also the trajectory of cortical atrophy during aging. Studies suggest that cortical thinning accelerates with age, typically worsening after 70 years of age,59 although these patterns vary significantly across racial and gender groups. Choi et al.29 observed that Caucasian women had steeper rates of cortical atrophy compared with Korean women, suggesting the influence of potential cultural or environmental protective factors. Moonen et al.54 reported faster gray matter decline in Black men than in White individuals or Black women, likely reflecting chronic stress exposure and systemic inequalities. These findings are supported by studies indicating that brain regions involved in language and cognition, such as the frontal and temporal lobes, are particularly susceptible to social determinants of health.60, 61

Discussion

This scoping review examines the need for population-sensitive neuroimaging standards by synthesizing evidence on differences in brain morphology and their implications for AI-based diagnostics, while critically addressing the concept of biological essentialism.

Influence of biological and SES factors and associated risk of bias

While biological distinctions in brain morphology may support the development of population-sensitive neuroimaging reference standards, these differences are shaped by evolutionary adaptations30, 62 and broader factors, such as SES and systemic discrimination, which accelerate brain aging in marginalized groups, as evidenced by accelerated gray matter decline among Black adults.34, 54 This suggests that the observed differences in brain morphology are more accurately attributed to socioeconomic and environmental determinants than to innate biological variation.34, 63 Similarly, African American participants demonstrate a stronger association between larger WMH volumes and poorer cognitive function compared with non-Hispanic White individuals.50 Documented evidence of ethnic disparities in biomarkers of AD and PD highlights the risk of misclassification if AI models are trained on homogeneous datasets, potentially leading to inaccurate diagnoses in diverse populations.29, 50

Advantages and limitations of population-sensitive templates

Developing population-sensitive MRI templates and normative brain volumes (NBVs) offers potential advantages for diagnostic accuracy. Studies by Choi et al.29, 55 demonstrated that population-specific templates significantly enhance diagnostic precision and reduce prediction errors in neurodegenerative disease models. For example, an MRI template developed for Indian individuals was tested on MRI scans from an Indian population, yielding better alignment compared with the standard MRI template based on a Caucasian population.48

In addition, Caucasian normative brain volume references were unable to accurately classify Korean patients with AD, as AD-vulnerable regions are larger in cognitively normal older Korean adults.29

Subsequent studies found that ethnicity-adjusted norms for brain volumes improved the diagnostic accuracy of AD.55 Nathoo et al.64 similarly highlighted substantial disparities in multiple sclerosis lesion burden and clinical outcomes, with poorer outcomes observed among African American and Latin American populations compared with non-Hispanic White individuals. The same study also reported increased lesion load and worse clinical outcomes among Latin American patients, further emphasizing health disparities across underrepresented populations. In contrast, Hedderich et al.65 found that normative brain volumes have a limited impact on diagnostic accuracy in neurodegenerative diseases. These variations underscore the need for population-sensitive neuroimaging models that account for biological and socioeconomic influences to improve diagnostic precision.

Integrating race/ethnicity and SES in AI models and their ethical considerations

Although integrating race and SES into AI models offers potential advantages, addressing issues of transparency and ethical governance is essential. Reinforcing racial essentialism and embedding bias in clinical AI systems – particularly through misinterpreting race as a biological determinant – may result in the reinforcement of racial stereotypes, breaches of privacy, and the exacerbation of healthcare inequities. It is crucial to distinguish biologically based variability from disparities arising from systemic inequities, such as structural racism, limited access to healthcare, and environmental exposures, in order to prevent the reinforcement of biological essentialism. Therefore, population-sensitive standards must be developed alongside appropriate safeguards, including the incorporation of socioeconomic variables, robust informed consent procedures, and continuous bias monitoring, to ensure equitable implementation in clinical practice. Given the critical role of SES in brain health, its integration as a core variable in neuroimaging datasets – using tools such as the HOUSES index, which measures individual socioeconomic status based on housing characteristics such as cost and crowding – is essential.66

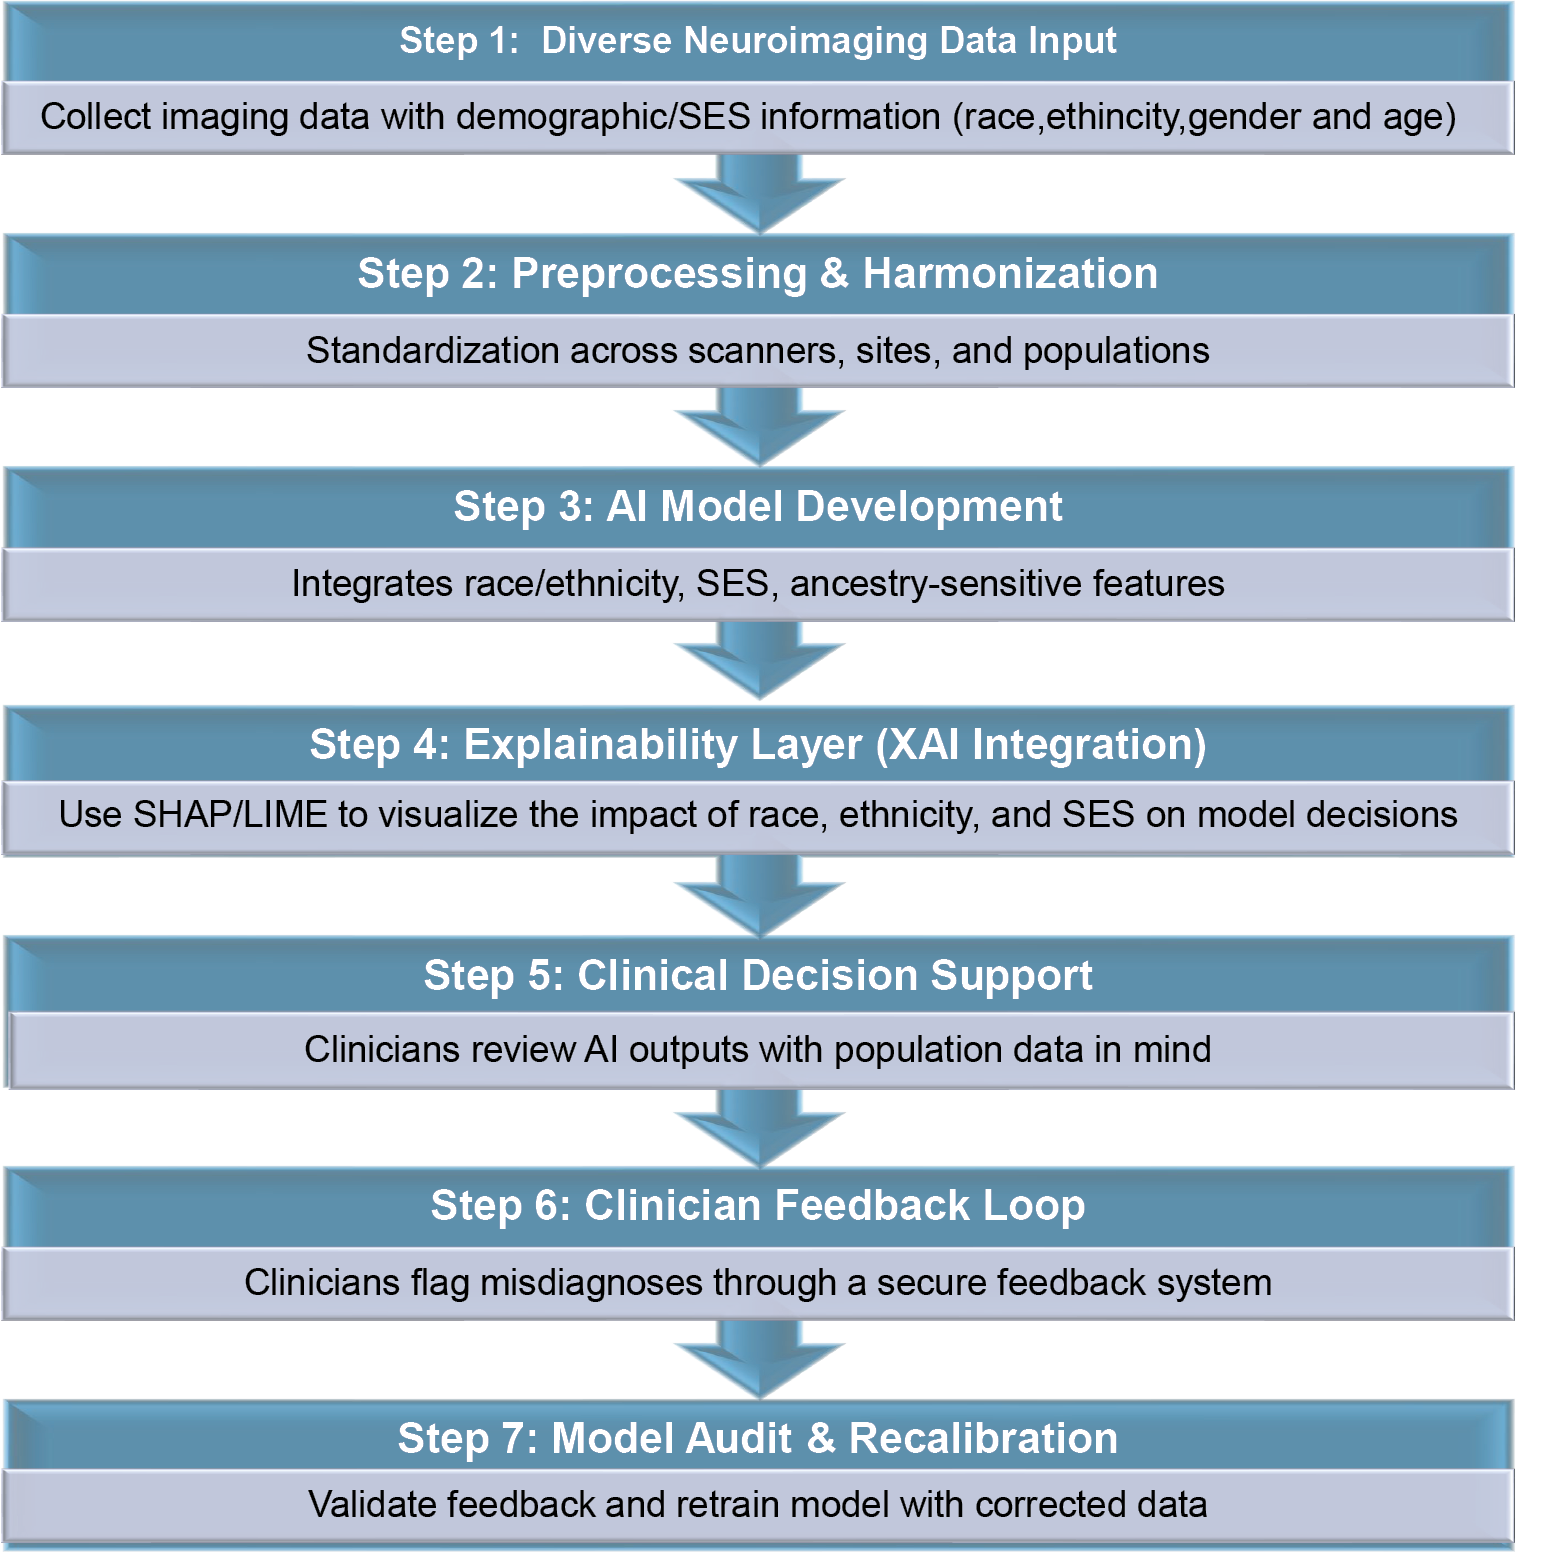
To mitigate these risks, researchers and clinicians must ensure transparency in data collection methodologies, obtain explicit informed consent from participants, and implement robust ethical oversight mechanisms. Providing clear information about the populations included and their demographic characteristics can help clinicians make better-informed decisions when using AI-based neuroimaging tools. Artificial intelligence-based diagnostic tools should serve as supportive aids rather than substitutes for clinical judgment, ensuring that radiologists and neurologists retain primary responsibility for interpreting neuroimaging results within the broader clinical context (Figure 4).

Artificial intelligence-based neuroimaging platforms should incorporate a structured clinician feedback loop to ensure continuous improvement and ethical oversight. Clinicians should be able to flag suspected diagnostic discrepancies through a secure, anonymized interface. Expert reviewers should then validate these flagged cases, and confirmed discrepancies should inform model retraining pipelines. This iterative process would enhance model calibration, facilitate bias detection, and promote accountability in the deployment of clinical AI systems. Developers can implement broader ethical safeguards by conducting subgroup-specific performance audits, applying bias quantification metrics, and validating models using diverse population datasets. Explainable AI (XAI) techniques, such as SHAP (Shapley Additive Explanations) and LIME (Local Interpretable Model-Agnostic Explanations), can help clarify model decision-making processes, thereby reducing the “black box” effect and highlighting the influence of input features such as SES and race/ethnicity. Consent frameworks should clearly define data provenance, usage parameters, and the implications of algorithmic outputs to ensure transparency and participant autonomy. Finally, clinicians must receive targeted training to interpret AI predictions in the context of population metadata and social determinants of health, reinforcing their essential role in context-aware, multidisciplinary diagnostic workflows.

Limitations of the study

This scoping review, by design, does not include a critical appraisal of bias or a meta-analysis, which would provide the statistical precision and pooled effect estimates typically reported in systematic reviews. Nevertheless, adherence to the PRISMA-ScR framework mitigated selection bias by ensuring a structured approach to study identification, screening, and inclusion.42 As noted in the “Study heterogeneity” section, methodological inconsistencies in MRI protocols, software, and adjustments for confounding variables pose challenges to generalizability. Furthermore, a substantial proportion of the included studies employed cross-sectional designs, limiting the ability to establish causal relationships or assess longitudinal changes. Variations in sample size (ranging from 30 to 2,537 participants) also constrain generalizability. The present review primarily emphasized structural and socio-structural dimensions without extensively addressing genetic predispositions or environmental exposures, including air pollution, nutrition, and early-life stress.

Conclusions

This scoping review synthesizes evidence of population-sensitive variability in regional brain morphology across racial, ethnic, and socioeconomic groups in both health and disease. These differences have important implications for the interpretation of neuroimaging findings and the development of AI-based diagnostic models. The review highlights persistent gaps in demographic diversity within current neuroimaging datasets, particularly in commercial and research-based AI tools. Addressing these gaps requires studies that incorporate larger, socio-demographically diverse populations and account for structural determinants of health. Developing population-sensitive neuroimaging templates is critical for improving diagnostic accuracy and advancing healthcare equity; however, this effort must also consider practical challenges, including data harmonization, potential misclassification, and ethical risks such as the inadvertent reinforcement of racial bias. To navigate these complexities, coordinated efforts at national and international levels are necessary, alongside the rigorous implementation of ethical safeguards. These should include transparency in data provenance, the inclusion of socioeconomic variables, and interpretability mechanisms within AI tools. Explainable AI techniques can be incorporated to visualize how input features – including race, ethnicity, and socioeconomic indicators – contribute to diagnostic predictions. These methods help quantify feature attribution, promote transparency in model behavior, and enable clinicians to assess whether outputs are influenced by spurious or biased correlations. The proposed implementation approaches are consistent with emerging recommendations to integrate structural and functional neuroimaging features into personalized, context-aware diagnostic frameworks.7, 65 Population-sensitive standards and inclusive models may help reduce bias, misclassification, and inequities in AI-driven neuroimaging. Interpretation of intergroup brain differences must remain grounded in a socio-structural framework to prevent the misrepresentation of race as a biological essence. Crucially, group-level morphological differences should be interpreted within the broader context of social determinants of health rather than as biologically inherent traits, in order to avoid reinforcing essentialist narratives.

Recommendations

To address the clinical, ethical, and research challenges identified in this review, the following strategies are recommended:

– Fostering international partnerships and data-sharing initiatives to create large, representative neuroimaging datasets that capture population diversity. These datasets could be stratified by race/ethnicity, age, and sex to improve diagnostic precision and minimize bias in AI applications.

– Incorporating validated socioeconomic indicators (e.g., HOUSES index, education, housing quality) and ensuring subgroup performance auditing during model development.

– Employing explainability (XAI) methods, such as SHAP and LIME, to enhance transparency in algorithmic decision-making.

– Integrating population-sensitive neuroanatomical features (e.g., ethnicity-adjusted volumetrics, SES-modulated patterns) into AI models while contextualizing them as proxies for lived structural and social experiences rather than fixed biological traits. This approach safeguards against the misinterpretation of race as a biological essence and aligns diagnostic models with equity-focused precision medicine.

– Employing federated learning approaches to preserve data privacy while improving inclusivity across geographic and demographic populations.39

– Implementing ethical AI toolkits to detect and address algorithmic bias at all stages of model deployment.

– Establishing a structured feedback mechanism through which clinicians can report AI-generated diagnostic discrepancies, allowing for systematic monitoring, auditing, and model retraining. This mechanism should include a secure, anonymized reporting interface and a validation pipeline for incorporating clinical corrections into future model updates.

– Developing future models that include metadata fields capturing key social determinants of health.

Use of AI and AI-assisted technologies

Not applicable.

Tables


Table 1. Summary of characteristics of the studies included in this review

Study

Authors (year), country

Study design

Population, context

Analysis

Limitations

Key findings

1

Atilano-Barbosa and Barrios (2023),28

Mexico

cross-sectional observational study

White (n = 338) or African American (n = 56) participants

Nonparametrical permutation analysis of covariance (ANCOVA).

- Unbalanced sample with overrepresentation of White participants.

- Confounding variables in the Human Connectome Project (HCP) dataset.

- Self-reported race without genetic ancestry data.

- Restricted statistical power due to imbalance.

- Morphological brain differences were observed between African American and White participants across white matter and forebrain, midbrain, and hindbrain regions.

2

Choi et al. (2021),29

South Korea

cross-sectional observational study

Korean (n = 1,686) and Caucasian (n = 851) participants

Regression analysis to predict brain volumes; logistic regression modeling for Alzheimer’s disease (AD) diagnosis using regional z-scores; propensity score matching for validation groups; and area under the curve (AUC) comparisons using bootstrap analysis.

- Use of multiple magnetic resonance imaging (MRI) scanners for the Caucasian sample, potentially increasing variance in image quality and measurements.

- Cross-sectional study design limiting assessment of individual-level longitudinal changes.

- Inherent limitations of longitudinal studies (e.g., small sample sizes, limited follow-up duration).

- Ethnicity was significantly associated with volumetric differences across all lobar and subcortical regions, except for the left pallidum and bilateral ventricles.

- Brain volume z-scores derived from a prediction model incorporating ethnicity as a predictor improved diagnostic accuracy for multi-ethnic patients with AD.

3

Kang et al. (2020),30

South Korea

cross-sectional observational study

East Asian (n = 171) and Caucasian (n = 178) participants

Descriptive statistics; group comparison tests (two-sample t-tests and χ2 tests); regression analysis (general linear model); vertex-wise statistical analysis; and correction for multiple comparisons.

- Scanner heterogeneity across centers, potentially reducing generalizability.

- Slight differences in voxel size between groups (0.9 mm vs 1.0–1.25 mm), potentially introducing measurement bias.

- Inference of functional implications (e.g., language or cognition) from structural data without direct functional assessment.

- East Asian sample limited to Korean participants, restricting generalizability to other East Asian populations (e.g., Chinese or Japanese).

- Statistically significant difference in Mini-Mental State Examination (MMSE) scores between groups despite both being cognitively normal (0.4-point difference).

- Differences in cortical anatomy between cognitively normal East Asian and Caucasian older adults were observed.

4

Lou et al. (2019),45

China

cross-sectional observational study

Chinese (n = 45) and Caucasian (n = 45) participants

Parametric tests (t-test, analysis of variance (ANOVA)), linear regression, correction for multiple comparisons, and Vertex-wise surface-based morphometric analyses.

- Sample restricted to right-handed male participants, precluding assessment of sex and handedness effects on brain asymmetry.

- Relatively small and demographically homogeneous sample, limiting generalizability.

- Absence of behavioral and functional magnetic resonance imaging (fMRI) data, limiting interpretation of structural asymmetries in relation to language and cognition.

- Interhemispheric differences were observed between Chinese and Caucasian participants.

- Chinese participants exhibited greater structural asymmetries in the frontal, temporal, occipital, and insular cortices compared with Caucasian participants.

- These structural differences may be associated with functional disparities between the 2 populations, with potential implications for language learning and visuospatial processing.

5

Lu et al. (2016),46

China

comparative cross-sectional study

Uyghurs (n = 15) and Han Chinese (n = 15) participants

Vertex-wise cortical surface group analysis using a 2-class general linear model (GLM), random effects analysis, and statistical parametric mapping, normality tests were performed, and double sample t-tests were used for group comparisons.

- Lack of population-specific cognitive and behavioral data for the Uyghur group, limiting correlation of MRI findings with cognitive or social behavioral differences.

- Hypothesized language-driven anatomical plasticity without functional imaging (e.g., fMRI) to verify causal associations.

- Sample restricted to young adults (~18 years), limiting lifespan generalizability and developmental interpretation.

- Small sample size (n = 15 per group), potentially reducing statistical power and stability of findings.

- Structural brain differences were observed between young Uyghur and Han Chinese participants, consistent with prior East–West comparisons.

6

Lu et al. (2017),47

China

cross-sectional observational study

Chinese (n = 36) and Indian (n = 32) participants

Student’s t-test, χ2 test, and Bonferroni correction.

- Restriction to region-of-interest (ROI)-based analysis.

- Small and demographically homogeneous sample size.

- Limited ethnic diversity and narrow age range.

- Population-related differences in brain morphometry were observed between Chinese and Indian undergraduate participants.

- Differences in gray matter volume, cortical thickness, and surface area were identified, with potential implications for cognitive function.

7

Rao et al. (2017),48

India

comparative cross-sectional study

Indian (n = 27), and Caucasian (n = 27) participants

χ2 test, unpaired and paired t-test, Bonferroni correction for multiple comparisons, Mann–Whitney U test.

- Small sample size (n = 27), potentially limiting representativeness of the diverse Indian population.

- Absence of manual editing and quantification of registration accuracy.

- Differences in MRI acquisition parameters between Indian scans (1.5T) and the IXI dataset (Caucasian participants), potentially introducing measurement variability.

- Use of 1.5T MRI scans for compatibility with existing Western templates, despite the higher resolution of 3T imaging.

- No collection of ancestral background data.

- Significant differences in brain volume were observed between Indian and Caucasian participants, necessitating an Indian-specific brain template. This underscores the importance of using population-specific templates for accurate analysis over the Montreal Neurological Institute template.

8

Tang et al. (2018),49

China

comparative cross-sectional study

Han Chinese (n = 45) and Caucasian (n = 45) participants

Surface-based morphometric analysis, voxel-based morphometry (VBM) analysis.

- Sample limited to 45 male participants per group (total n = 90), potentially restricting generalizability.

- Restriction to young male participants, limiting applicability to females and older populations.

- Use of structural MRI only, without additional modalities (e.g., diffusion MRI or fMRI).

- Absence of behavioral or cognitive measures to correlate with structural findings, limiting interpretation of functional significance.

- Structural differences observed between Chinese and Caucasian participants.

- Differences in cortical thickness, volume, and surface area.

9

Zahodne et al. (2015),50

USA

cross-sectional observational study

Non-Hispanic White (n = 185), African American (n = 230), and Hispanic (n = 223) participants

Descriptive statistics, group comparisons, regression analysis, and multiple-group regression analysis.

- Cross-sectional design precluding causal interpretation between brain structure and cognitive outcomes across racial/ethnic groups.

- Binary measurement of infarcts (present vs absent), potentially reducing sensitivity for detecting detailed associations with cognitive performance.

- Residual confounding due to longstanding differences in socioeconomic status, education, and life experiences across racial/ethnic and immigrant groups.

- Recruitment from a limited geographic area (~10 square miles in Northern Manhattan), potentially restricting generalizability and complete experiential matching across groups.

- MRI–cognition associations varied across racial/ethnic groups.

- Higher white matter hyperintensities (WMH) burden associated with poorer language and executive performance in African American participants.

- Weaker hippocampal volume–memory associations in Hispanic participants.

- Higher cognitive scores in non-Hispanic White participants.

- Group differences influenced by demographic and health factors.

10

Shaked et al. (2019),51

USA

cross-sectional observational study

African American (n = 83) and White (n = 117) participants

Regression analysis.

- Cross-sectional design precluding causal or temporal inference between sociodemographic factors and brain structure.

- Limited operationalization of socioeconomic status (SES) (poverty status and education only), without inclusion of occupation, wealth, childhood SES, or longitudinal changes.

- Restricted generalizability beyond African American and White participants, with potential underrepresentation of higher-SES individuals.

- Lack of correction for multiple comparisons, increasing the risk of type I error.

- Absence of direct lifespan stress measures despite a stress-theoretical framework.

- Incomplete MRI segmentation, excluding stress-relevant regions (e.g., hypothalamus and brainstem).

- No separate analysis of key prefrontal subregions (e.g., dorsomedial vs ventromedial Prefrontal cortex (PFC)) or the anterior cingulate cortex (ACC).

-ROI volumes not adjusted for total brain volume, potentially affecting volumetric comparisons.

- An interaction between SES and race was associated with differences in brain volume; high-SES White participants exhibited larger cortical volumes than African American participants and low-SES White participants.

- African American participants and low-SES individuals exhibited smaller volumes in stress-related subcortical regions.

11

Waldstein et al. (2017),52

USA

cross-sectional observational study

African American (n = 63) and White (n = 84) participants

Multiple regression analysis, t-tests, sensitivity analyses, and exploratory analyses.

- Restriction to African American and White participants, limiting generalizability to other racial/ethnic populations.

- Potential geographic specificity to an urban Baltimore cohort, limiting applicability to rural or other urban settings.

- Limited operationalization of SES (education and poverty status only), excluding occupational status, wealth, and detailed income measures.

- Sample size limiting detection of smaller group differences and multilevel interactions (e.g., age × sex).

- No correction for multiple comparisons due to exploratory design, increasing the risk of type I error.

- Low-SES African American participants exhibited a higher white matter lesion burden than low-SES White participants.

- Higher-SES White participants had greater brain volumes than lower-SES White and African American participants; no SES differences were observed among African American participants.

- The interaction between socioeconomic status and race suggested a complex relationship influencing brain health outcomes.

12

Fleischman et al. (2022),53 USA

observational study

Black participants (n = 376)

Linear-mixed effects models for cognitive change, voxel-wise linear regression for associations between deformations and cognition.

- Adjustment for cardiometabolic risk factors (e.g., hypertension, diabetes, smoking) without examination of race-relevant sociocultural moderators (e.g., educational quality, life-course experiences) influencing brain–cognition associations.

- Predominantly female, highly educated sample from the Chicagoland area, limiting generalizability to the broader U.S. population of older Black adults.

- Intrinsic correlations between global cognition and domain-specific abilities, limiting construct separation despite multiple assessments.

- Brain morphometry assessed only at baseline, with longitudinal cognitive follow-up but no evaluation of concurrent structural and cognitive change.

- Use of deformation-based morphometry (DBM) only, without complementary imaging modalities (e.g., diffusion MRI, quantitative susceptibility mapping (QSM), white matter hyperintensity burden, resting-state fMRI).

- Reduced brain tissue volume and increased cerebrospinal fluid (CSF) with age were associated with declines in global cognition, memory, and perceptual speed.

- Specific brain regions, including the entorhinal cortex and hippocampi, were associated with cognitive decline.

- Temporal lobe volumes were associated with episodic memory performance, whereas parietal lobe volumes were associated with perceptual speed.

13

Moonen et al. (2021),54

USA

observational study

Black (n = 183) and White (n = 295) participants

ANOVA χ2 tests, paired sample t-tests, multiple regression analysis.

- Selection bias due to inclusion of participants completing both MRI scans and 25- and 30-year CARDIA follow-ups; non-returning participants had poorer cardiovascular health (Life’s Simple 7 (CVH-LS7) scores).

- Reduced sample size due to attrition, limiting statistical power for subgroup and sex × race interaction analyses.

- Cardiovascular risk factors assessed at baseline only, without longitudinal tracking.

- Use of a composite CVH-LS7 score, potentially obscuring the impact of individual cardiovascular health metrics.

- Limited imaging frequency (2 MRI scans over 5 years), restricting detailed characterization of brain aging trajectories.

- Focus on macrostructural MRI measures without inclusion of more sensitive biomarkers of early brain pathology.

- Race- and sex-related differences were observed in baseline brain health measures.

- Men exhibited greater declines in total brain and gray matter volumes compared with women.

- Black participants exhibited significant differences in gray matter volume and cerebral blood flow compared with White participants.

14

Choi et al. (2024),55

South Korea

comparative observational study

Korean (n = 1,629) and Caucasian (n = 786) participants

Regression analysis and bootstrapping.

- Scanner heterogeneity across sites for the Caucasian sample, whereas the Korean sample was acquired using a single scanner, potentially introducing measurement error and reducing statistical precision in group comparisons.

- Cross-sectional study design, limiting assessment of individual brain aging trajectories.

- Scanner-related variability potentially attenuating observed ethnic differences in brain aging rates, particularly within the Caucasian sample.

- Ethnicity was associated with differences in brain volume, with Korean participants generally exhibiting larger cortical structures.

- Sex-related differences were observed, with certain brain structures differing in size between men and women.

- A steeper aging slope was observed in Caucasian women, particularly in cortical regions.

- apolipoprotein E (APOE) ε4 carrier status was associated with differential patterns of brain aging across ethnic groups.

Table 2. Joanna Briggs Institute (JBI) critical appraisal checklist for cross-sectional studies

Article (authors, year)

Q1

Q2

Q3

Q4

Q5

Q6

Q7

Q8

JBI score (yes/total)

Overall appraisal (%)

Atilano-Barbosa and Barrios,28 2023

1

1

0

1

1

1

1

1

7/8

87.5

Choi et al.,29 2021

1

1

0

1

1

1

1

1

7/8

87.5

Kang et al.,30 2020

1

1

0

1

1

1

1

1

7/8

87.5

Lou et al.,45 2020

1

1

0

1

1

1

1

1

7/8

87.5

Lu et al.,46 2016

1

1

0

1

1

1

1

1

7/8

87.5

Lu et al.,47 2017

1

1

0

1

1

1

1

1

7/8

87.5

Rao et al.,48 2017

1

1

0

1

1

1

1

1

7/8

87.5

Tang et al.,49 2018

1

1

0

1

1

1

1

1

7/8

87.5

Shaked et al.,51 2019

1

1

0

1

1

1

1

1

7/8

87.5

Waldstein et al.,52 2017

1

1

0

1

1

1

1

1

7/8

87.5

Table 3. Joanna Briggs Institute (JBI) critical appraisal checklist for cohort studies

Article (authors, year)

Q1

Q2

Q3

Q4

Q5

Q6

Q7

Q8

Q9

Q10

Q11

Overall score

Zahodne et al.,50 2015

1

1

1

1

1

1

1

1

1

1

1

11/11 (100%)

Moonen et al.,54 2022

1

1

1

1

1

1

1

1

1

1

1

11/11 (100%)

Figures


Fig. 1. Preferred Reporting Items for Systematic Reviews and Meta-Analyses Extension for Scoping Reviews (PRISMA-ScR) flowchart of the study selection process
Fig. 2. Global distribution of studies included in the review by country of origin
Fig. 3. Heatmap illustrating the interaction between socioeconomic status (SES), race, and brain health outcomes
High SES Whites: SES has a low impact on stroke risk, cognitive decline, and white matter lesions.
Low SES Whites: Moderate impact observed in all cognitive outcomes.
High SES African Americans: Moderate to high impact, indicating the importance of SES in this group.
Low SES African Americans: Very high impact on stroke risk, cognitive decline, and white matter lesions, underscoring severe effects of low SES.
Fig. 4. Future implications of the review findings
SES – socioeconomic status; AI – artifical intelligence.

References (66)

  1. Nichols E, Steinmetz JD, Vollset SE, et al. Estimation of the global prevalence of dementia in 2019 and forecasted prevalence in 2050: An analysis for the Global Burden of Disease Study 2019. Lancet Public Health. 2022;7(2):e105–e125. doi:10.1016/S2468-2667(21)00249-8
  2. Bajaj S, Khunte M, Moily NS, et al. Value proposition of FDA-approved artificial intelligence algorithms for neuroimaging. J Am Coll Radiol. 2023;20(12):1241–1249. doi:10.1016/j.jacr.2023.06.034
  3. Razdan P, Das A, Habiba S, Doley S, Tiwari DA, Hazari P. Knowledge, perception and attitude of dentists regarding the role of artificial intelligence in the field of pediatric dentistry: An online questionnaire study [published online as ahead of print on February 19, 2025]. Dent Med Probl. 2025. doi:10.17219/dmp/183901
  4. Szczepanowski R, Uchmanowicz I, Pasieczna AH, et al. Application of machine learning in predicting frailty syndrome in patients with heart failure. Adv Clin Exp Med. 2024;33(3):309–315. doi:10.17219/acem/184040
  5. Uysal HA, Poyraz T, Gulluoglu H, Idiman F, Idiman E. An artificial intelligence model for Lhermitte’s sign in patients with pediatric-onset multiple sclerosis: A follow-up study. Adv Clin Exp Med. 2025;34(2):165–177. doi:10.17219/acem/196466
  6. Armstrong NM, An Y, Shin JJ, et al. Associations between cognitive and brain volume changes in cognitively normal older adults. NeuroImage. 2020;223:117289. doi:10.1016/j.neuroimage.2020.117289
  7. Alkan E, Evans SLH. Relationships between cognitive performance, clinical insight and regional brain volumes in schizophrenia. Schizophrenia. 2022;8(1):33. doi:10.1038/s41537-022-00243-x
  8. Matías-Guiu JA, Cortés-Martínez A, Montero P, et al. Identification of cortical and subcortical correlates of cognitive performance in multiple sclerosis using voxel-based morphometry. Front Neurol. 2018;9:920. doi:10.3389/fneur.2018.00920
  9. Koshiyama D, Fukunaga M, Okada N, et al. Role of subcortical structures on cognitive and social function in schizophrenia. Sci Rep. 2018;8(1):1183. doi:10.1038/s41598-017-18950-2
  10. Battaglia S, Schmidt A, Hassel S, Tanaka M. Editorial: Case reports in neuroimaging and stimulation. Front Psychiatry. 2023;14:1264669. doi:10.3389/fpsyt.2023.1264669
  11. Battaglia S, Nazzi C, Di Fazio C, Borgomaneri S. The role of pre-supplementary motor cortex in action control with emotional stimuli: A repetitive transcranial magnetic stimulation study. Ann N Y Acad Sci. 2024;1536(1):151–166. doi:10.1111/nyas.15145
  12. Hartikainen P, Räsänen J, Julkunen V, et al. Cortical thickness in frontotemporal dementia, mild cognitive impairment, and Alzheimer’s disease. J Alzheimers Dis. 2012;30(4):857–874. doi:10.3233/JAD-2012-112060
  13. Lerch JP, Pruessner JC, Zijdenbos A, Hampel H, Teipel SJ, Evans AC. Focal decline of cortical thickness in Alzheimer’s disease identified by computational neuroanatomy. Cereb Cortex. 2005;15(7):995–1001. doi:10.1093/cercor/bhh200
  14. Querbes O, Aubry F, Pariente J, et al. Early diagnosis of Alzheimer’s disease using cortical thickness: Impact of cognitive reserve. Brain. 2009;132(8):2036–2047. doi:10.1093/brain/awp105
  15. Zarei M, Ibarretxe-Bilbao N, Compta Y, et al. Cortical thinning is associated with disease stages and dementia in Parkinson’s disease. J Neurol Neurosurg Psychiatry. 2013;84(8):875–882. doi:10.1136/jnnp-2012-304126
  16. Stoebner ZA, Hett K, Lyu I, et al. Comprehensive shape analysis of the cortex in Huntington’s disease. Hum Brain Mapp. 2023;44(4):1417–1431. doi:10.1002/hbm.26125
  17. Walhout R, Westeneng HJ, Verstraete E, et al. Cortical thickness in ALS: Towards a marker for upper motor neuron involvement. J Neurol Neurosurg Psychiatry. 2015;86(3):288–294. doi:10.1136/jnnp-2013-306839
  18. Li Q, Zhao Y, Chen Z, et al. Meta-analysis of cortical thickness abnormalities in medication-free patients with major depressive disorder. Neuropsychopharmacology. 2020;45(4):703–712. doi:10.1038/s41386-019-0563-9
  19. Suh JS, Minuzzi L, Raamana PR, et al. An investigation of cortical thickness and antidepressant response in major depressive disorder: A CAN-BIND study report. Neuroimage Clin. 2020;25:102178. doi:10.1016/j.nicl.2020.102178
  20. Zhao Y, Zhang Q, Shah C, et al. Cortical thickness abnormalities at different stages of the illness course in schizophrenia: A systematic review and meta-analysis. JAMA Psychiatry. 2022;79(6):560. doi:10.1001/jamapsychiatry.2022.0799
  21. Hanford LC, Nazarov A, Hall GB, Sassi RB. Cortical thickness in bipolar disorder: A systematic review. Bipolar Disord. 2016;18(1):4–18. doi:10.1111/bdi.12362
  22. Niu M, Wang Y, Jia Y, et al. Common and specific abnormalities in cortical thickness in patients with major depressive and bipolar disorders. EBioMedicine. 2017;16:162–171. doi:10.1016/j.ebiom.2017.01.010
  23. Shukla A, Tiwari R, Tiwari S. Analyzing subcortical structures in Alzheimer’s disease using ensemble learning. Biomed Signal Process Control. 2024;87:105407. doi:10.1016/j.bspc.2023.105407
  24. García-Marín LM, Reyes-Pérez P, Diaz-Torres S, et al. Shared molecular genetic factors influence subcortical brain morphometry and Parkinson’s disease risk. NPJ Parkinsons Dis. 2023;9(1):73. doi:10.1038/s41531-023-00515-y
  25. Okada N, Fukunaga M, Miura K, et al. Subcortical volumetric alterations in four major psychiatric disorders: A mega-analysis study of 5604 subjects and a volumetric data-driven approach for classification. Mol Psychiatry. 2023;28(12):5206–5216. doi:10.1038/s41380-023-02141-9
  26. Shi J, Guo H, Liu S, et al. Subcortical brain volumes relate to neurocognition in first-episode schizophrenia, bipolar disorder, major depression disorder, and healthy controls. Front Psychiatry. 2022;12:747386. doi:10.3389/fpsyt.2021.747386
  27. Tu PC, Chang WC, Chen MH, et al. Identifying common and distinct subcortical volumetric abnormalities in 3 major psychiatric disorders: A single-site analysis of 640 participants. J Psychiatry Neurosci. 2022;47(3):E230–E238. doi:10.1503/jpn.210154
  28. Atilano-Barbosa D, Barrios FA. Brain morphological variability between whites and African Americans: The importance of racial identity in brain imaging research. Front Integr Neurosci. 2023;17:1027382. doi:10.3389/fnint.2023.1027382
  29. Choi YY, Lee JJ, Choi KY, et al. Multi-racial normative data for lobar and subcortical brain volumes in old age: Korean and Caucasian norms may be incompatible with each other. Front Aging Neurosci. 2021;13:675016. doi:10.3389/fnagi.2021.675016
  30. Kang DW, Wang SM, Na HR, et al. Differences in cortical structure between cognitively normal East Asian and Caucasian older adults: A surface-based morphometry study. Sci Rep. 2020;10(1):20905. doi:10.1038/s41598-020-77848-8
  31. Austin TR, Nasrallah IM, Erus G, et al. Association of brain volumes and white matter injury with race, ethnicity, and cardiovascular risk factors: The multi-ethnic study of atherosclerosis. J Am Heart Assoc. 2022;11(7):e023159. doi:10.1161/JAHA.121.023159
  32. Peper JS, Brouwer RM, Boomsma DI, Kahn RS, Hulshoff Pol HE. Genetic influences on human brain structure: A review of brain imaging studies in twins. Hum Brain Mapp. 2007;28(6):464–473. doi:10.1002/hbm.20398
  33. Geronimus AT, Pearson JA, Linnenbringer E, et al. Race-ethnicity, poverty, urban stressors, and telomere length in a Detroit community-based sample. J Health Soc Behav. 2015;56(2):199–224. doi:10.1177/0022146515582100
  34. Turney IC, Lao PJ, Rentería MA, et al. Brain aging among racially and ethnically diverse middle-aged and older adults. JAMA Neurol. 2023;80(1):73. doi:10.1001/jamaneurol.2022.3919
  35. Hussain MA, Grant PE, Ou Y. Inferring neurocognition using artificial intelligence on brain MRIs. Front Neuroimaging. 2024;3:1455436. doi:10.3389/fnimg.2024.1455436
  36. Koçak B, Ponsiglione A, Stanzione A, et al. Bias in artificial intelligence for medical imaging: Fundamentals, detection, avoidance, mitigation, challenges, ethics, and prospects. Diagn Interv Radiol. 2024;31(2):75–88. doi:10.4274/dir.2024.242854
  37. Van Leeuwen KG, Schalekamp S, Rutten MJCM, Van Ginneken B, De Rooij M. Artificial intelligence in radiology: 100 commercially available products and their scientific evidence. Eur Radiol. 2021;31(6):3797–3804. doi:10.1007/s00330-021-07892-z
  38. Kocak B, Baessler B, Cuocolo R, Mercaldo N, Pinto Dos Santos D. Trends and statistics of artificial intelligence and radiomics research in radiology, nuclear medicine, and medical imaging: Bibliometric analysis. Eur Radiol. 2023;33(11):7542–7555. doi:10.1007/s00330-023-09772-0
  39. Ricard JA, Parker TC, Dhamala E, Kwasa J, Allsop A, Holmes AJ. Confronting racially exclusionary practices in the acquisition and analyses of neuroimaging data. Nat Neurosci. 2023;26(1):4–11. doi:10.1038/s41593-022-01218-y
  40. Zhang M, Wang Y, Lv M, et al. Trends and hotspots in global radiomics research: A bibliometric analysis. Technol Cancer Res Treat. 2024;23:15330338241235769. doi:10.1177/15330338241235769
  41. Arksey H, O’Malley L. Scoping studies: Towards a methodological framework. Int J Soc Res Methodol. 2005;8(1):19–32. doi:10.1080/1364557032000119616
  42. Levac D, Colquhoun H, O’Brien KK. Scoping studies: Advancing the methodology. Implement Sci. 2010;5(1):69. doi:10.1186/1748-5908-5-69
  43. Munn Z, Peters MDJ, Stern C, Tufanaru C, McArthur A, Aromataris E. Systematic review or scoping review? Guidance for authors when choosing between a systematic or scoping review approach. BMC Med Res Methodol. 2018;18(1):143. doi:10.1186/s12874-018-0611-x
  44. Moola S, Munn Z, Tufunaru C, et al. Systematic reviews of aetiology and risk. In: Aromataris E, Lockwood C, Porritt K, Pilla B, Jordan Z, eds. JBI Manual for Evidence Synthesis. Adelaide, Australia: Joanna Briggs Institute (JBI); 2024. doi:10.46658/JBIMES-24-06
  45. Lou Y, Zhao L, Yu S, et al. Brain asymmetry differences between Chinese and Caucasian populations: A surface-based morphometric comparison study. Brain Imaging Behav. 2020;14(6):2323–2332. doi:10.1007/s11682-019-00184-7
  46. Lu J, Jiang C, Wang J, Jia W. Comprehensive cortical thickness and surface area comparison between young Uyghur and Han Chinese cohorts. Magn Reson Imaging. 2016;34(8):1043–1049. doi:10.1016/j.mri.2016.03.018
  47. Lu J, Peng B, Saxena A, et al. Examining population differences in cerebral morphometry between Chinese and Indian undergraduate students. Neurosci Lett. 2017;636:290–297. doi:10.1016/j.neulet.2016.11.021
  48. Rao NP, Jeelani H, Achalia R, et al. Population differences in brain morphology: Need for population specific brain template. Psychiatry Res Neuroimaging. 2017;265:1–8. doi:10.1016/j.pscychresns.2017.03.018
  49. Tang Y, Zhao L, Lou Y, et al. Brain structure differences between Chinese and Caucasian cohorts: A comprehensive morphometry study. Hum Brain Mapp. 2018;39(5):2147–2155. doi:10.1002/hbm.23994
  50. Zahodne L, Manly J, Narkhede A, et al. Structural MRI predictors of late-life cognition differ across African Americans, Hispanics, and Whites. Curr Alzheimer Res. 2015;12(7):632–639. doi:10.2174/1567205012666150530203214
  51. Shaked D, Millman ZB, Moody DLB, et al. Sociodemographic disparities in corticolimbic structures. PLoS One. 2019;14(5):e0216338. doi:10.1371/journal.pone.0216338
  52. Waldstein SR, Dore GA, Davatzikos C, et al. Differential associations of socioeconomic status with global brain volumes and white matter lesions in African American and white adults: The HANDLS SCAN Study. Psychosom Med. 2017;79(3):327–335. doi:10.1097/PSY.0000000000000408
  53. Fleischman DA, Arfanakis K, Leurgans SE, et al. Associations of deformation-based brain morphometry with cognitive level and decline within older Blacks without dementia. Neurobiol Aging. 2022;111:35–43. doi:10.1016/j.neurobiolaging.2021.11.003
  54. Moonen JEF, Nasrallah IM, Detre JA, et al. Race, sex, and mid-life changes in brain health: Cardia MRI substudy. Alzheimers Dement. 2022;18(12):2428–2437. doi:10.1002/alz.12560
  55. Choi YY, Lee JJ, Te Nijenhuis J, et al. Multi-ethnic norms for volumes of subcortical and lobar brain structures measured by Neuro I: Ethnicity may improve the diagnosis of Alzheimer’s disease. J Alzheimers Dis. 2024;99(1):223–240. doi:10.3233/JAD-231182
  56. Braun V, Clarke V. Using thematic analysis in psychology. Qual Res Psychol. 2006;3(2):77–101. doi:10.1191/1478088706qp063oa
  57. Vaismoradi M, Turunen H, Bondas T. Content analysis and thematic analysis: Implications for conducting a qualitative descriptive study. Nurs Health Sci. 2013;15(3):398–405. doi:10.1111/nhs.12048
  58. for the ALFA Study; Brugulat-Serrat A, Salvadó G, Sudre CH, et al. Patterns of white matter hyperintensities associated with cognition in middle-aged cognitively healthy individuals. Brain Imaging Behav. 2020;14(5):2012–2023. doi:10.1007/s11682-019-00151-2
  59. Walhovd KB, Fjell AM, Giedd J, Dale AM, Brown TT. Through thick and thin: A need to reconcile contradictory results on trajectories in human cortical development. Cereb Cortex. 2016;27(2):1472–1481. doi:10.1093/cercor/bhv301
  60. Eckert MA, Vaden KI, Iuricich F; Dyslexia Data Consortium. Cortical asymmetries at different spatial hierarchies relate to phonological processing ability. PLoS Biol. 2022;20(4):e3001591. doi:10.1371/journal.pbio.3001591
  61. Novén M, Olsson H, Helms G, Horne M, Nilsson M, Roll M. Cortical and white matter correlates of language-learning aptitudes. Hum Brain Mapp. 2021;42(15):5037–5050. doi:10.1002/hbm.25598
  62. Kweon H, Aydogan G, Dagher A, et al. Human brain anatomy reflects separable genetic and environmental components of socioeconomic status. Sci Adv. 2022;8(20):eabm2923. doi:10.1126/sciadv.abm2923
  63. Gavett BE, Fletcher E, Harvey D, et al. Ethnoracial differences in brain structure change and cognitive change. Neuropsychology. 2018;32(5):529–540. doi:10.1037/neu0000452
  64. Nathoo N, Zeydan B, Neyal N, Chelf C, Okuda DT, Kantarci OH. Do magnetic resonance imaging features differ between persons with multiple sclerosis of various races and ethnicities? Front Neurol. 2023;14:1215774. doi:10.3389/fneur.2023.1215774
  65. Hedderich DM, Schmitz-Koep B, Schuberth M, et al. Impact of normative brain volume reports on the diagnosis of neurodegenerative dementia disorders in neuroradiology: A real-world, clinical practice study. Front Aging Neurosci. 2022;14:971863. doi:10.3389/fnagi.2022.971863
  66. Juhn YJ, Ryu E, Wi CI, et al. Assessing socioeconomic bias in machine learning algorithms in health care: A case study of the HOUSES index. J Am Med Inform Assoc. 2022;29(7):1142–1151. doi:10.1093/jamia/ocac052