Abstract
Background. Glaucoma is a chronic, progressive optic neuropathy that can lead to irreversible blindness if left untreated. It is the leading cause of irreversible blindness globally. Effective management relies heavily on the control of intraocular pressure (IOP), typically through lifelong pharmacological treatment, but adherence to therapy is often a challenge due to the asymptomatic nature of the disease.
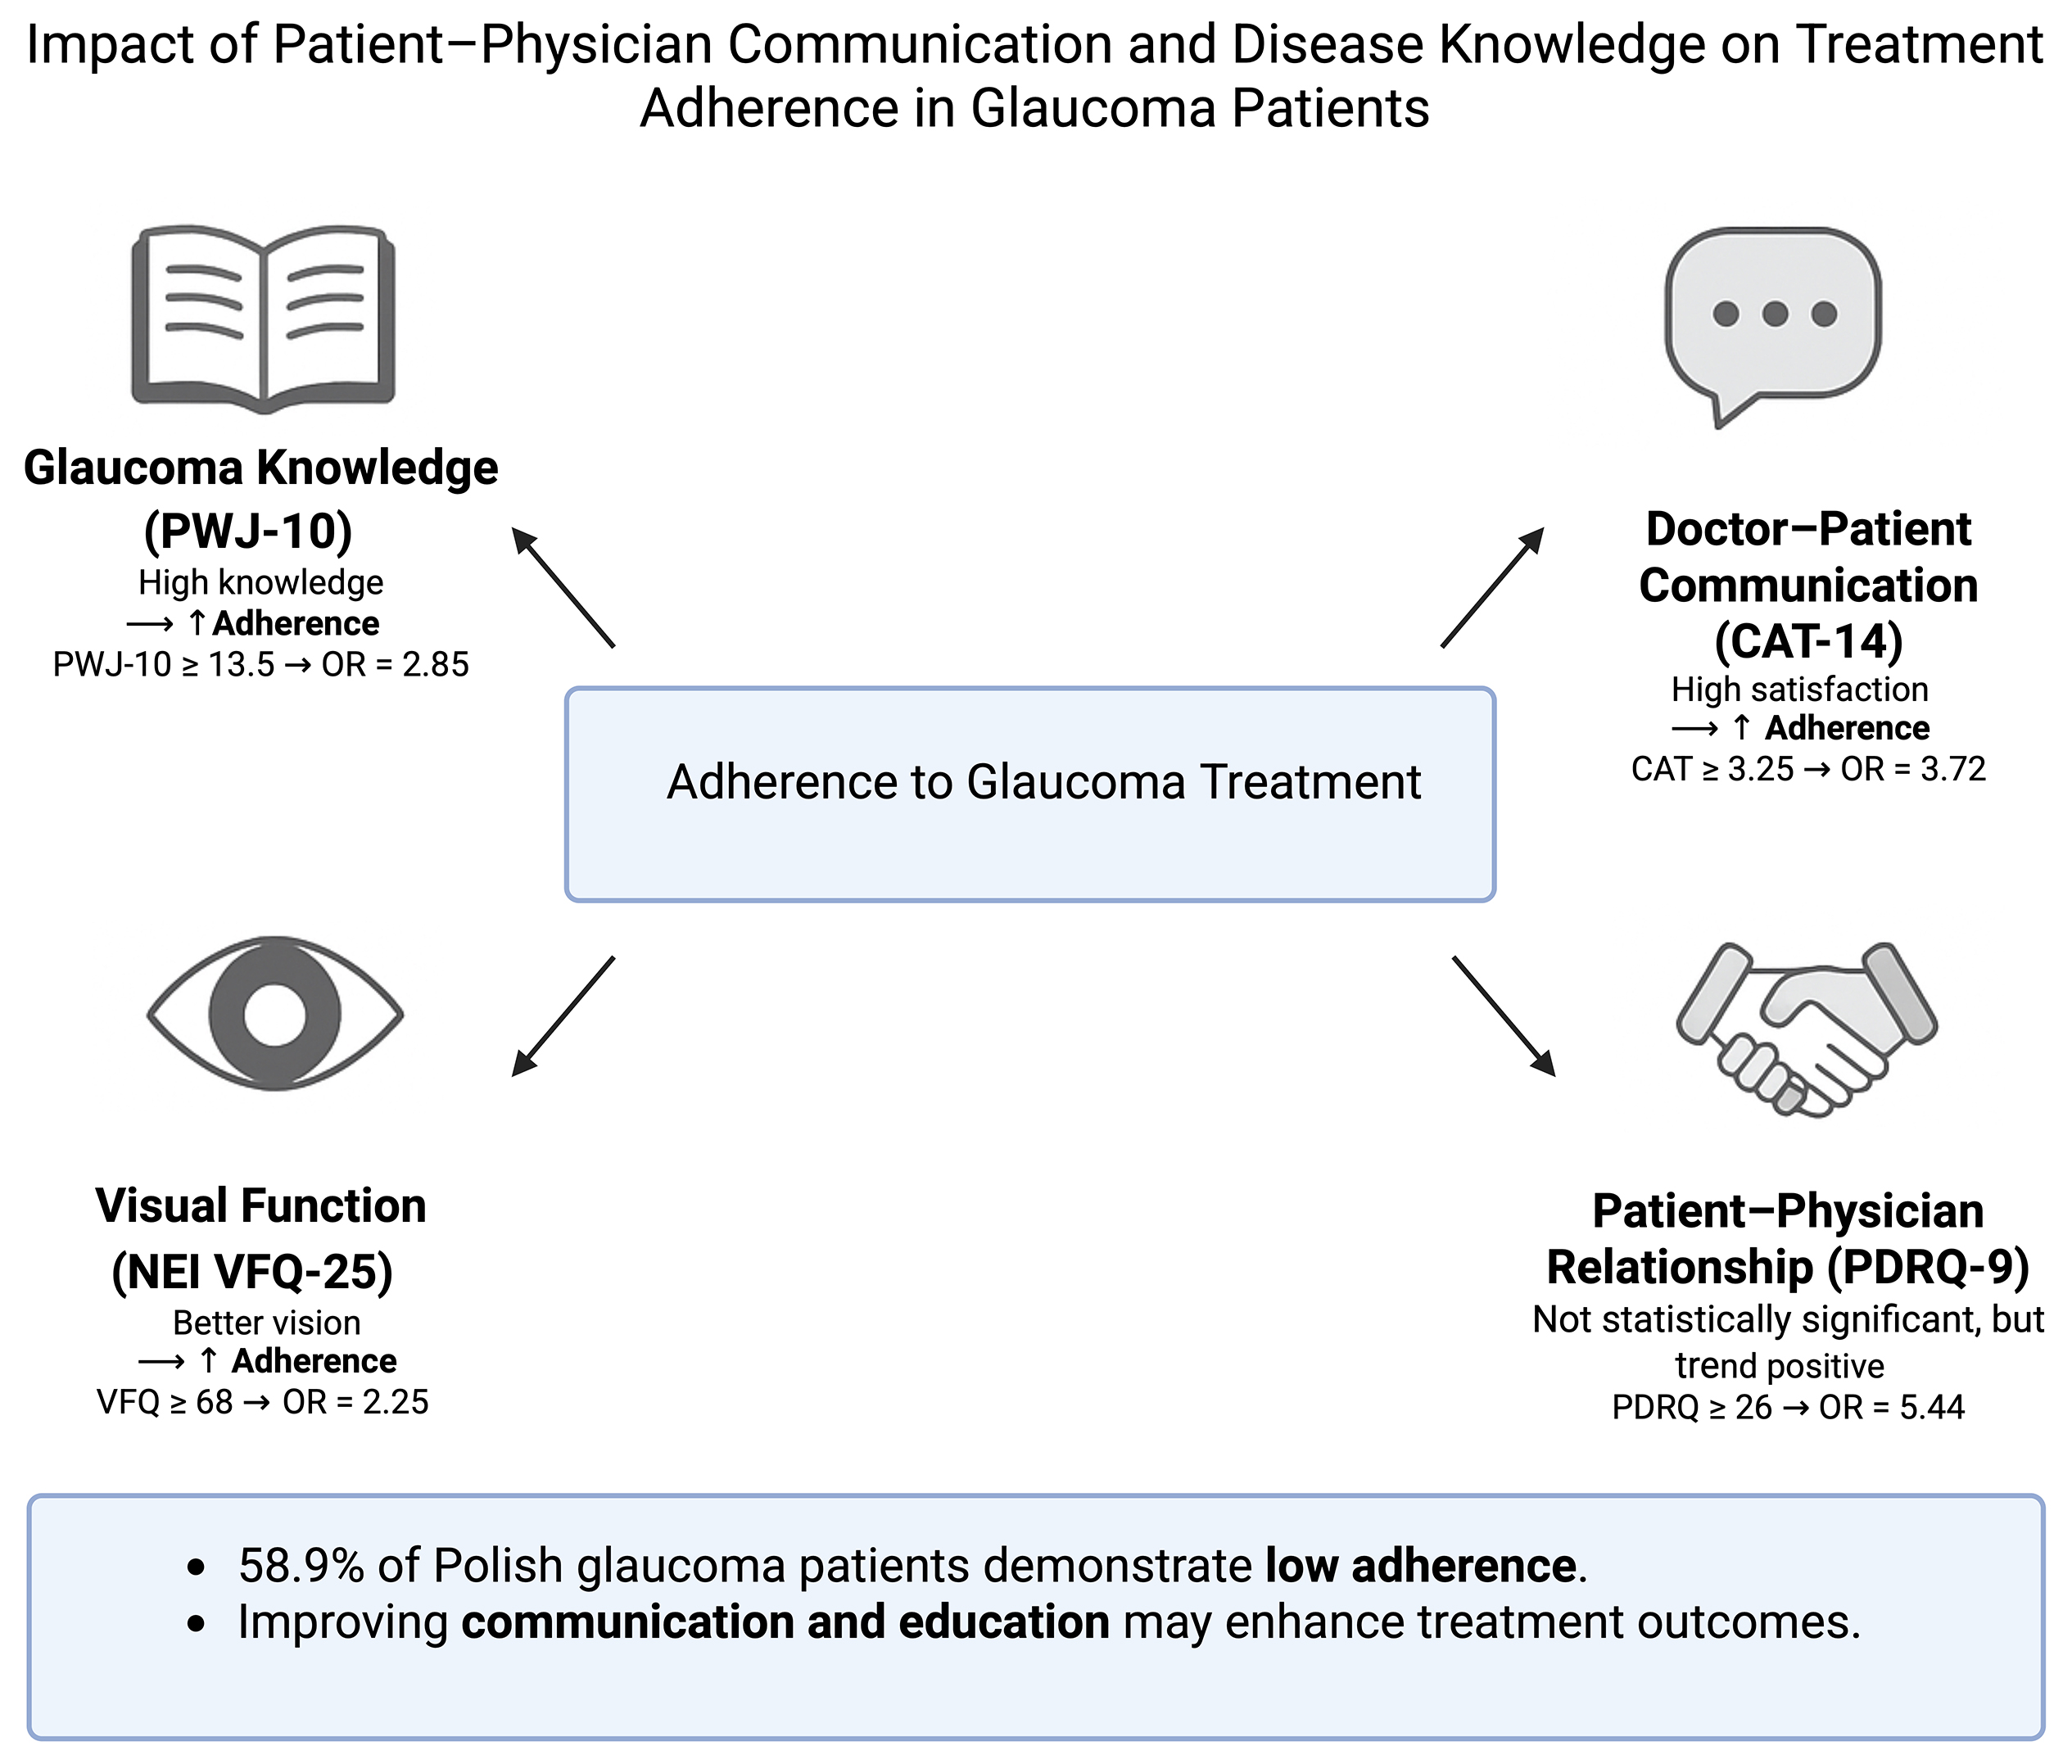
Objectives. The primary aim of this study was to evaluate the predictive influence of the doctor–patient relationship, the quality of communication between doctor and patient, patient knowledge about glaucoma, and quality of life when adhering to therapeutic recommendations among a group of Polish glaucoma patients.
Materials and methods. This study was conducted at the Ophthalmology Outpatient Clinic of the University Clinical Hospital in Wrocław, Poland. A total of 190 patients were enrolled, and adherence to treatment was assessed using the Adherence to Refills and Medications Scale (ARMS). Additional variables included patient–physician communication (CAT-14), relationship quality (PDRQ-9), visual function (NEI VFQ-25), and glaucoma knowledge (GKQ-10).
Results. The results indicated that 58.9% of patients showed low adherence to their prescribed treatment. Satisfaction with doctor–patient communication, higher levels of knowledge about glaucoma, and better visual function were significantly associated with better adherence. The quality of the patient–physician relationship, while not statistically significant, also showed potential positive effects on adherence.
Conclusions. Improving patient education and enhancing the quality of communication between healthcare providers and patients are critical to increasing adherence to glaucoma treatment. Importantly, the study provides a valuable evidence base for developing adherence-enhancing strategies within the Polish healthcare system. Given the scarcity of such data in Central and Eastern Europe, our results may also inform similar efforts in the region. Designing culturally sensitive and system-specific interventions, such as brief communication training for ophthalmologists or structured patient education programs, could help address persistent adherence challenges in chronic ophthalmic care.
Key words: glaucoma, communication, patient education, physician–patient relations, medication adherence
Background
Glaucoma is a chronic, progressive optic neuropathy characterized by damage to the optic nerve and the retinal nerve fiber layer, which may lead to irreversible blindness if left untreated.1 Globally, glaucoma is the leading cause of irreversible blindness, affecting more than 76 million individuals, with projections indicating that this number will increase to 112 million by 2040.2 It is particularly prevalent in older populations, non-White ethnicities, and individuals with a family history of the disease.1, 3
There are 2 main types of glaucoma: primary open-angle glaucoma (OAG) and angle-closure glaucoma (ACG). The former is the most common type and is often asymptomatic until significant vision loss occurs, with up to 50% of patients unaware of their condition.4 In contrast, the latter displays more acute symptoms, such as eye pain, nausea, and blurred vision. If left untreated, it can lead to rapid and irreversible vision loss.1
Given its progressive nature and the potential for irreversible vision loss, early diagnosis and intervention are critical for the management of glaucoma. Diagnostic methods include the measurement of intraocular pressure (IOP), visual field testing, and imaging techniques such as optical coherence tomography (OCT). Intraocular pressure remains the only modifiable risk factor for glaucoma, making its control the primary focus of treatment.1, 5, 6
Pharmacological treatment, particularly in the form of eye drops, plays a crucial role in slowing the progression of glaucoma. Medications such as prostaglandin analogues, β-blockers, and carbonic anhydrase inhibitors act to reduce the production or improve the outflow of aqueous humor, thereby lowering IOP. Patients require lifelong treatment and regular follow-up to ensure effective IOP control and to monitor disease progression. Failure to adhere to prescribed therapy can result in inadequate IOP control, which significantly increases the risk of disease progression and permanent visual impairment.1, 7, 8
Adherence to treatment is defined as the extent to which a patient’s behavior in taking medications corresponds to the prescribed treatment regimen.9 Several factors contribute to difficulties in maintaining adherence to glaucoma medications, particularly given the chronic and often asymptomatic nature of the disease. Without noticeable symptoms, patients may not fully recognize the severity of the condition or the importance of consistent medication use. This lack of symptomatic feedback can result in reduced adherence, as patients may mistakenly believe that the medication is unnecessary or provides no benefit.10, 11Adherence to treatment recommendations is a complex, multifaceted phenomenon. Various factors influencing adherence have been widely discussed in the literature.10, 11, 12 A common conclusion of many studies on adherence is the need for continued research and deeper analysis of the determinants of adherence.13
Adherence to treatment recommendations, particularly in chronic ophthalmic conditions such as glaucoma, dry eye disease (DED), and age-related macular degeneration (AMD), remains a global challenge. Numerous international studies have demonstrated that non-adherence significantly impairs treatment effectiveness and increases the risk of disease progression and vision loss. For example, in a large-scale Japanese study on DED, only 10.2% of patients used eye drops at the frequency recommended in the treatment guidelines, with most patients applying drops only when experiencing symptoms, highlighting a symptom-driven, inconsistent use pattern.14 In Brazil, electronic monitoring of glaucoma medication use demonstrated that 28% of patients were non-adherent, and this subgroup had significantly higher rates of disease progression and loss to follow-up rates.15 Likewise, an Irish study of patients with intermediate or advanced AMD found that 40% of patients eligible for AREDS2 nutritional supplementation were not using the recommended vitamins, often due to a lack of physician recommendation or concerns about cost.16
These findings highlight the multifactorial nature of adherence and the influence of both systemic and individual-level determinants, including treatment complexity, health literacy, symptom visibility, and healthcare-related communication. While some barriers are universal, others are shaped by local healthcare systems, cultural expectations, and patient–physician dynamics. In Poland, adherence in ophthalmology has received limited empirical attention, despite an aging population and a high prevalence of chronic eye diseases. Structural aspects of the Polish healthcare system, such as the organization of outpatient care, reimbursement policies, and variability in access to ophthalmologists, may pose distinct challenges to maintaining long-term adherence. Accordingly, investigating predictors of adherence in a Polish glaucoma cohort not only addresses a notable research gap but may also inform culturally and system-level tailored interventions.
Objectives
The aim of this study was to assess the predictive value of the doctor–patient relationship, the quality of patient–physician communication, patient knowledge about glaucoma, and quality of life in relation to adherence to the recommended treatment in a cohort of Polish patients receiving pharmacological treatment for glaucoma.
Materials and methods
The study was conducted between January and September 2019 at the Ophthalmology Outpatient Clinic, University Clinical Hospital, in Wrocław, Poland. A total of 190 patients who met the inclusion criteria were enrolled. Each participant received written information detailing the study’s purpose and procedures, and written informed consent was obtained prior to participation. The study was conducted during a single follow-up visit at the ophthalmology clinic. The research was approved by the Bioethics Committee of Wroclaw Medical University (approval No. KB 305/2018).
Inclusion criteria included a confirmed diagnosis of glaucoma at least 6 months earlier, current use of anti-glaucoma pharmacotherapy, being aged 18 or older, the ability to independently complete the study questionnaires, and a willingness to provide informed consent for participation.
Exclusion criteria comprised a cognitive impairment score of less than 24, which was defined as a Mini-Mental State Examination (MMSE), a lack of the manual dexterity required for the proper administration of anti-glaucoma medications (necessitating assistance from a third party), and the presence of significantly exacerbated chronic conditions.
The Adherence to Refills and Medications Scale (ARMS) is a 12-item questionnaire designed to assess adherence to pharmacological treatment in patients with chronic conditions. Responses are evaluated on a 4-point Likert scale, with options ranging from 1 (never) to 4 (most of the time). The total score ranges from 12, indicating optimal adherence, to 48, reflecting a complete lack of adherence to prescribed pharmacotherapy. This instrument, developed by Kripalani et al. in 2009, specifically targets the assessment of adherence to medication regimens for chronic diseases that require prolonged, often lifelong, treatment. The questionnaire prompts patients to evaluate not only their consistency in taking medications and their adherence to the prescribed dosage and timing, but also their fulfillment of prescriptions and ability to plan and maintain the necessary medication supplies to ensure uninterrupted therapy.17 The tool has been linguistically validated for use in Polish, with the adaptation conducted among a group of patients with hypertension.18 For the purposes of the study, an evaluation of the psychometric properties of the assessment tool was conducted. The findings confirmed the tool’s validity for use among patients with glaucoma (Cronbach’s α = 0.726, mean inter-item correlation r = 0.187). Patients were categorized into 2 groups based on their adherence levels to therapeutic recommendations: group I – low adherence (16–48 points) and group II – high adherence (12–15 points). This division was determined by the median ARMS score observed in the study group (Me = 16).
The Communication Assessment Tool (CAT-14) was employed to evaluate the quality of communication between patients and physicians. Developed by Makoul et al. in 2007, this instrument consists of 14 items, addressing both verbal and non-verbal communication, as well as the physician’s attentiveness, engagement, and empathy. Responses are measured using a 5-point Likert scale: 1 – inadequate, 2 – sufficient, 3 – good, 4 – very good, and 5 – excellent. To assess the physician’s interpersonal and communication skills, the average score across all 14 items and the percentage of responses rated as excellent are utilized. The total score ranges from 14 to 70 points, with higher scores indicating a better perceived quality of communication.19 The questionnaire has been culturally adapted for use in the Polish population.20
The Patient–Doctor Relationship Questionnaire (PDRQ-9) was used to assess the quality of the relationship between patients and their physicians. This instrument consists of nine items and was developed by Van der Feltz-Cornelis et al. in 2004. Responses are rated on a Likert scale, ranging from 1 (strongly disagree) to 5 (strongly agree). The total score ranges from 9, indicating the poorest possible relationship, to 45, representing an ideal relationship.21, 22, 23 As the PDRQ-9 had not undergone cultural adaptation for use in Poland, a validation of the tool was conducted specifically for glaucoma patients as part of this study, demonstrating strong psychometric properties (Cronbach’s α = 0.937, with an average inter-item correlation of r = 0.626).
The National Eye Institute Visual Function Questionnaire (NEI VFQ-25), published by Mangione et al. in 2001, was employed to evaluate the impact of visual impairment and related symptoms on general health domains such as emotional wellbeing, social functioning, and task-related visual capabilities in daily life. The questionnaire includes items that assess general health and vision status, difficulties with specific tasks, and limitations caused by visual problems. The survey consists of 3 sections, with respondents answering a total of 25 closed questions. The original numeric values from the survey were recoded so that higher scores indicate better functioning. Each item was then converted to a scale from 0 to 100, where 0 represents the lowest possible score and 100 the highest. The final score is calculated as the average of all subscale items completed by the respondent, with lower scores indicating a greater impact of visual impairment on quality of life.24, 25
The Glaucoma Knowledge Questionnaire (GKQ-10) is a custom-developed tool designed to assess patients’ knowledge of glaucoma. The reliability (internal consistency) of the questionnaire was evaluated as part of this study. The questionnaire consists of 10 items assessing sources of knowledge about the disease, its definition, the possibility of a complete cure, the consequences of untreated glaucoma, and the proper use of eye drops. The maximum possible score is 21, with a minimum of 0. The results of the GKQ-10 validation are presented in Table 1, with a Cronbach’s α = 0.734, indicating satisfactory reliability. The tool demonstrates adequate psychometric properties and is suitable for use among glaucoma patients. Sociodemographic and clinical data for the study population were collected through a custom questionnaire, hospital registry, and medical records.
The results of the survey analysis were subjected to statistical evaluation. The distribution of all quantitative parameters was tested for conformity with the normal distribution using the Kolmogorov–Smirnov and Shapiro–Wilk tests. For quantitative features, the following were calculated: the mean values (M), standard deviations (SD), medians (Me), lower (Q1) and upper quartiles (Q3), as well as extreme values: the minimum (Min) and maximum (Max). The significance of differences between average values for features with distributions that significantly deviated from normal or had heterogeneous variances between 2 groups was assessed using the Mann–Whitney U test. For nominal and ordinal qualitative variables, frequencies (n) and percentages (%) were calculated and presented in contingency tables (multidimensional). Hypotheses of no association between qualitative variables were tested using Pearson’s χ2 test or Fisher’s exact test. A correlation between variables was considered significant if the test result was p < 0.05. Receiver operating characteristic (ROC) curves and Youden’s index were used to determine the cutoff values for continuous and discrete variables. The diagnostic (classification) ability of the parameters that were analyzed was assessed using the area under the ROC curve (AUC). Additionally, sensitivity and specificity were estimated for dichotomous cutoff values. To assess the impact of quantitative variables on the likelihood of high adherence, the values of the univariate logistic regression coefficients (b) and their significance were estimated for each predictor. In all statistical tests, a significance level of p < 0.05 was considered statistically significant. The statistical analysis was conducted using Statistica v. 13.3 (TIBCO Software Inc., Tulsa, USA).
Results
Sociodemographic characteristics of the study population
A total of 190 individuals participated in the study, comprising 124 women (65.3%) and 66 men (34.7%), with an age range of 25–88 years (M = 69, SD = 11.2). The largest proportion of participants had completed secondary education (36.3%) or vocational training (32.1%), and the majority were retired at the time of data collection (77.9%). Most participants were in marital or domestic partnerships (65.8%), residing either with their partner (45.3%) or with other family members (44.2%). Additionally, 68.4% of the sample lived in urban areas. These sociodemographic data are summarized in Table 2.
Clinical characteristics of the study population
The majority of participants had been diagnosed with glaucoma at least 10 years earlier (44.7%). All individuals were undergoing pharmacological treatment, with a subset also receiving adjunctive therapies, including laser treatment (10.5%) or surgical intervention (12.1%). Most of the patients were using a single anti-glaucoma medication (62.1%), typically administered twice daily (69.5%). Seventy-five percent of the patients had other systemic comorbidities. The detailed results are presented in Table 3, Table 4.
Adherence to therapeutic recommendations among the glaucoma patients in the study
In the cohort of glaucoma patients examined, over half exhibited a low level of adherence to their prescribed treatment (58.9%). The mean adherence score, as assessed using the ARMS scale, was 16.3 ±2.7 points across the group (Table 5), highlighting a generally low adherence level within this population.
Assessment of therapeutic communication between patients and physicians, measured with the CAT-14 questionnaire, in the glaucoma patient group
An analysis of communication quality indicated a high level of patient satisfaction with their interactions with the physician. The mean score across the 14 items of the questionnaire was 3.30 ±0.69. However, only 3.7% of responses rated the communication as excellent, giving the maximum possible score of 70 points (5 points per item). These findings are presented in Table 6.
The CAT-14 questionnaire results revealed that the highest percentage of excellent ratings was observed for the following: question 12, which addressed the physician’s discussion of future steps and follow-up plans with the patient (10.0%); question 2, related to treating the patient with respect (9.5%); and question 7, concerning the provision of all the information that was expected (9.5%). The lowest percentage of excellent ratings was associated with questions about the physician’s interest in the patient’s opinion on their health (question 3), encouraging the patient to ask questions (question 10), and involving the patient in decision-making (question 11). The detailed results are presented in Table 7.
Assessment of the patient–physician relationship, measured with the PDRQ-9 questionnaire, in the glaucoma patient group
In the studied group of glaucoma patients, the mean score for the patient–physician relationship, as measured using the PDRQ-9 questionnaire, was 30.4 ±6.2, indicating a moderate overall rating of the relationship. The analysis revealed that the largest proportion of respondents rated their relationship with their ophthalmologist as poor (42.1%). These results are summarized in Table 8.
The evaluation of the patient–physician relationship using the PDRQ-9 questionnaire allowed the entire cohort to be divided into 3 subgroups based on the PDRQ-9 scores:
– Group I – poor rating (PDRQ-9 sten scores 1–4), n = 80 patients;
– Group II – average rating (PDRQ-9 sten scores 5 and 6), n = 65 patients;
– Group III – good rating (PDRQ-9 sten scores 7–10), n = 45 patients.
Assessment of quality of life, measured with the NEI VFQ-25 questionnaire, in the glaucoma patient group
In the studied group of glaucoma patients, the mean score for the impact of visual impairment and symptoms on quality of life, as measured using the NEI VFQ-25 questionnaire, was 73.5 ±16.9 points. This finding indicates a relatively high quality of life, with limited impact of visual symptoms on patients’ daily functioning. Only 2.1% of respondents reported a poor level of visual function, while 35.3% rated their visual function as average and 62.6% assessed it as good. The detailed results are summarized in Table 9.
The evaluation of visual function using the NEI VFQ-25 questionnaire allowed the cohort to be categorized into 3 subgroups based on NEI VFQ-25 scores:
– Group I – poor visual function (NEI VFQ 0–40 points), n = 4 patients;
– Group II – average visual function (NEI VFQ 40–70 points), n = 67 patients;
– Group III – good visual function (NEI VFQ 70–100 points), n = 119 patients.
Assessment of knowledge levels using the GKQ-10 questionnaire in the glaucoma patient group
The evaluation of glaucoma-related knowledge was performed using a custom-designed tool. The total knowledge score, with scores ranging from 0 to 21 points, was calculated based on responses to 10 questions. The raw scores were converted into sten scores (ranging from 1 to 10), and each participant was then classified into 1 of 3 categories based on their knowledge level: low, average, or high.
The findings demonstrate that a significant proportion of patients had either a high (34.7%) or an average (34.2%) level of knowledge about their condition. A smaller proportion of patients had a low level of glaucoma-related knowledge (31.1%). The raw scores, sten scores, and distribution of patients across knowledge categories are detailed in Table 10.
The assessment of knowledge, as measured using the GKQ-10 questionnaire, allowed the study cohort to be divided into 3 subgroups based on GKQ-10 results:
– Group I – low knowledge level (GKQ-10 sten scores 1–4), n = 59 patients;
– Group II – average knowledge level (GKQ-10 sten scores 5 and 6), n = 65 patients;
– Group III – high knowledge level (GKQ-10 sten scores 7–10), n = 66 patients.
The impact of patient satisfaction with therapeutic communication on adherence to therapeutic recommendations in glaucoma patients
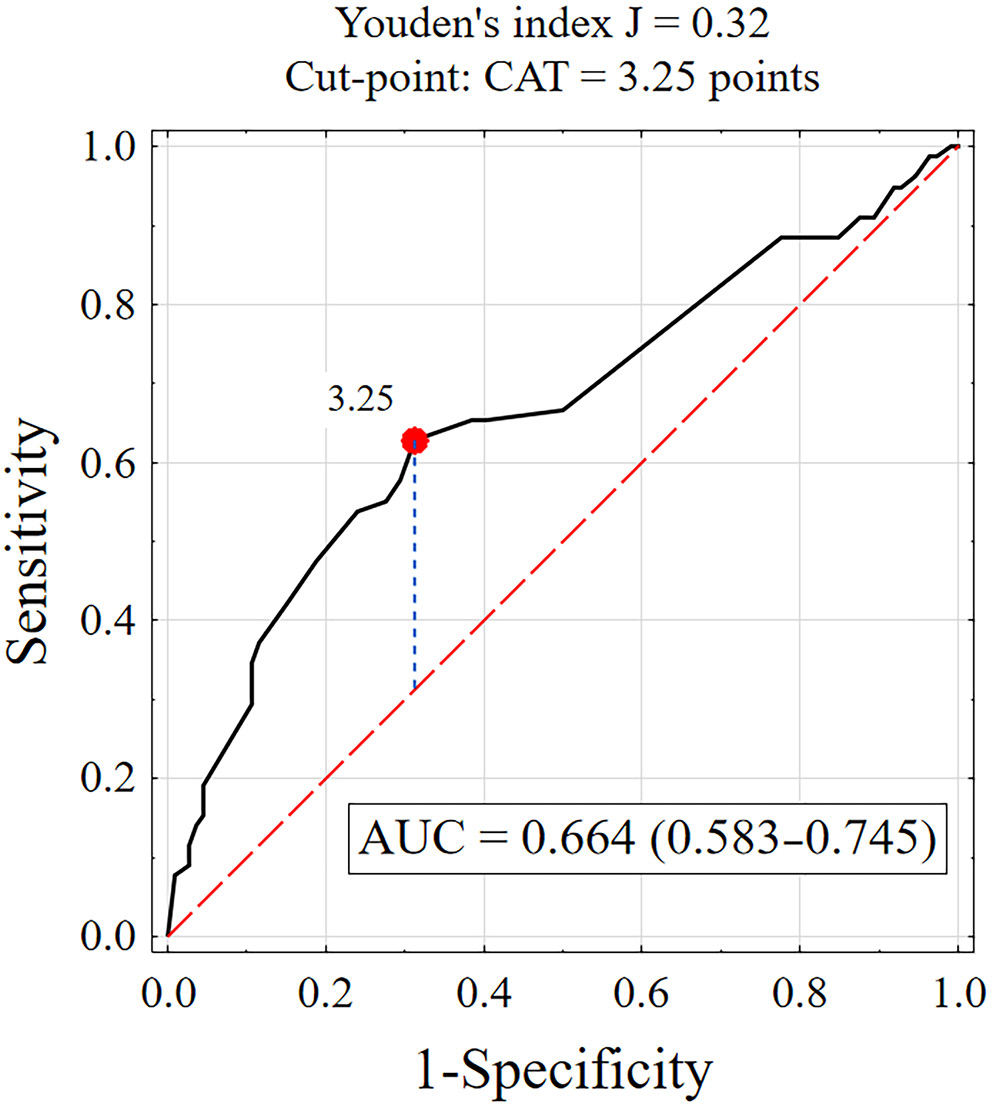
The association between the quality of communication between patients and their ophthalmologists, assessed using the CAT-14 questionnaire, and adherence to therapeutic recommendations, measured using the ARMS questionnaire, was statistically significant (p < 0.01). A weak but statistically significant negative correlation was observed between adherence to therapeutic recommendations (ARMS) and physician–patient communication (CAT), indicating that patients who rated communication with their physician more highly tended to adhere more closely to therapeutic guidelines.
Receiver operating characteristic curve analysis was used to determine the cutoff value for communication satisfaction (Figure 1). For CAT scores ≥3.25, test sensitivity was 62.8%, specificity was 68.8%, and the AUC was 0.664. The lower limit of the 95% confidence interval (95% CI) for the AUC was 0.583, exceeding the acceptable threshold of 0.5, which indicates that a communication satisfaction–based test may be useful in classifying patients as adherent or non-adherent to therapeutic recommendations.
Comparative analysis revealed that patients with high adherence (ARMS ≤ 15) reported higher communication satisfaction than those with low adherence (ARMS > 15), with mean scores of 3.53 ±0.75 vs 3.13 ±0.59. Among those with high adherence, 31.2% expressed greater satisfaction with communication (CAT ≥ 3.25 points), while 37.2% of those with low adherence reported lower satisfaction (CAT < 3.25 points). These findings indicate that satisfaction with physician communication, as measured using the CAT questionnaire, is a statistically significant factor influencing adherence to therapeutic recommendations (p < 0.001), particularly with CAT scores ≥ 3.25 (p < 0.001). The detailed results are shown in Supplementary Table 1.
Univariate logistic regression analysis indicated that both higher physician–patient communication scores (CAT-14) and a CAT-14 score ≥3.25 were significant positive predictors of high adherence to therapeutic recommendations. In patients with CAT-14 scores ≥3.25, the likelihood of high adherence was nearly 4 times higher than in patients with lower communication scores (odds ratio (OR) = 3.72). These findings are presented in Supplementary Table 2.
The impact of the patient–physician relationship on adherence to therapeutic recommendations in glaucoma patients
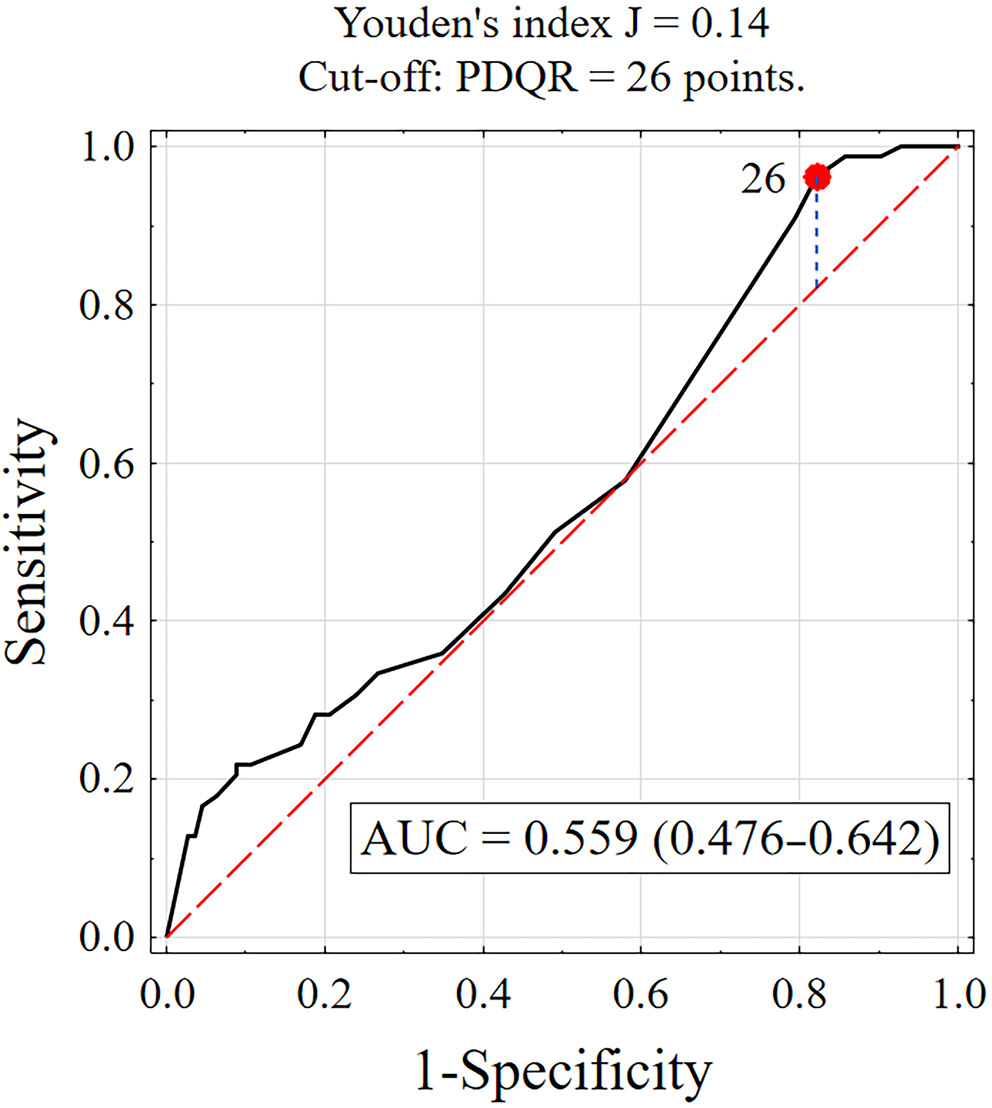
The association between the quality of the patient–ophthalmologist relationship, as assessed using the PDRQ-9 questionnaire, and adherence to therapeutic recommendations, measured with the ARMS questionnaire, was not statistically significant when raw scores were analyzed (p > 0.05).
The influence of the patient–physician relationship on adherence to therapeutic recommendations appears to be minimal. The lower limit of the 95% CI for the ROC curve was below 0.5 (AUC = 0.476), indicating weak discriminatory ability for classifying patients as adherent or non-adherent based on this criterion. The results are presented in Figure 2.
A comparative analysis showed that patients with high adherence (ARMS ≤ 15) reported better relationships with their physician compared to those with low adherence (ARMS > 15), with scores of 31.7 ±6.6 vs 29.5 ±5.8. Most patients with high adherence (96.2%) had a better patient–physician relationship (PDRQ-9 ≥ 26 points), while only 17.9% of those with low adherence had a poorer relationship with their physician (PDRQ-9 < 26 points). The analysis indicated that the patient–physician relationship, as measured by the PDRQ-9 questionnaire, is not a statistically significant predictor of adherence (p = 0.163). However, a relationship score of PDRQ-9 ≥ 26 points may be associated with adherence in this patient group (p < 0.003). The results are summarized in Supplementary Table 3.
Univariate logistic regression analysis showed that both a better patient–physician relationship, as measured using the PDRQ-9, and a PDRQ-9 score ≥ 26 are significant positive predictors of adherence to therapeutic recommendations. Among patients with a PDRQ-9 score ≥26, the likelihood of high adherence was more than 5 times higher than among those with lower scores (OR = 5.44). However, the 95% CI (1.56–19.0) was quite wide.
The impact of quality of life on adherence to therapeutic recommendations in glaucoma patients
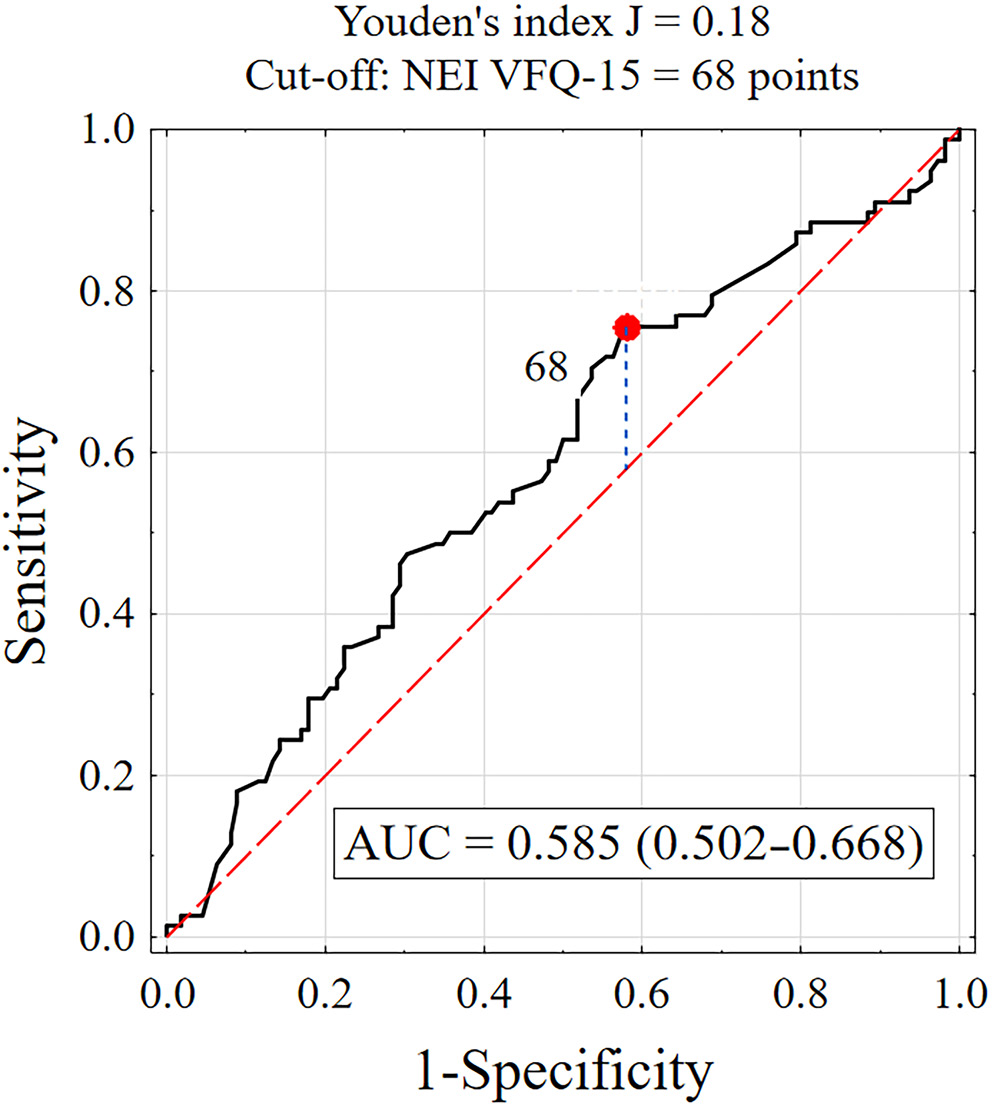
The association between visual function, as measured using the NEI VFQ-25 questionnaire, and adherence to therapeutic recommendations, measured with the ARMS questionnaire, was of limited significance for the raw data. The Spearman’s rank correlation coefficient (rho = −0.069) did not differ significantly from zero.
Receiver operating characteristic curve analysis was used to determine the cutoff value for visual function (Figure 3). For NEI VFQ scores ≥ 68, test sensitivity was 75.6% and specificity was 42.0%, with an AUC of 0.585. The lower limit of the 95% CI for the AUC was 0.502, which exceeded the accepted threshold of 0.5, suggesting that a visual function–based test may be useful in distinguishing between patients who adhere to therapeutic recommendations and those who do not.
Comparative analysis showed that patients with high adherence (ARMS ≤ 15) reported higher visual function scores than those with low adherence (ARMS > 15), with scores of 76.2 ±17.0 vs 71.7 ±16.7, respectively. The majority of patients with high adherence (71.8%) rated their visual function as good (NEI VFQ-25 ≥ 70 points), whereas less than half (42%) of patients with low adherence rated their visual function as average (NEI VFQ-25 40–70 points). Only 1.8% (n = 2) of patients with low adherence rated their visual function as poor (NEI VFQ-25 0–40 points). These findings indicate that visual function, as measured by the NEI VFQ-25, is a statistically significant factor influencing adherence to therapeutic recommendations (p = 0.048). Detailed results are summarized in Supplementary Table 5.
Univariate logistic regression analysis showed that a higher visual function score (NEI VFQ-25 ≥ 68 points) is a significant positive predictor of adherence to therapeutic recommendations (b = 0.81; p = 0.013). The results are summarized in Supplementary Table 4.
The impact of glaucoma knowledge on adherence to therapeutic recommendations in glaucoma patients
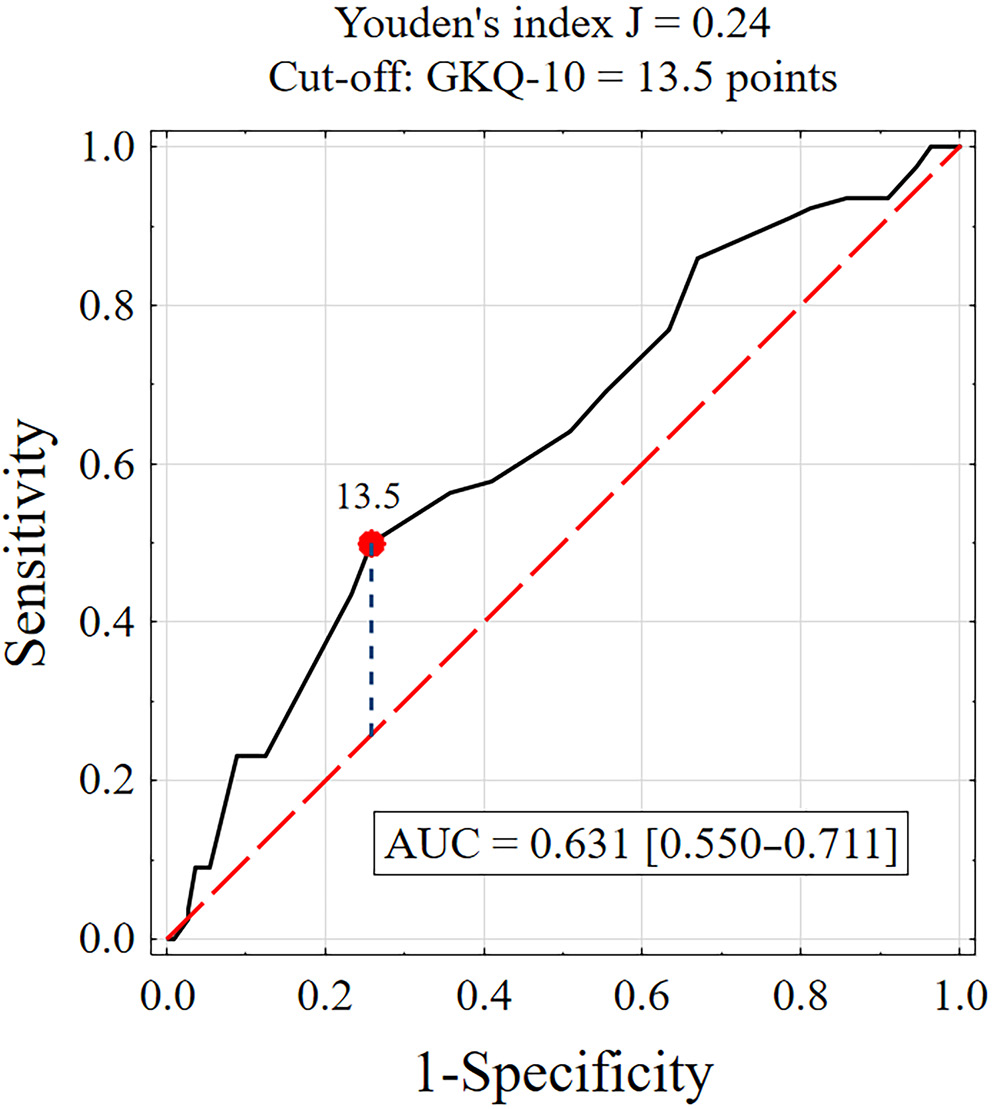
The relationship between glaucoma knowledge, assessed using the custom GKQ-10 scale, and adherence to therapeutic recommendations, measured with the ARMS questionnaire, was statistically significant (p < 0.05). A weak but statistically significant negative correlation was observed between adherence to therapeutic recommendations (ARMS) and glaucoma knowledge (GKQ-10). Patients with greater glaucoma knowledge demonstrated higher adherence to therapeutic recommendations. Specifically, an increase of 1 point on the GKQ-10 glaucoma knowledge scale was associated with an average reduction of 0.27 points in the ARMS adherence score.
Receiver operating characteristic curve analysis was used to establish the cutoff value for glaucoma knowledge (Figure 4). For GKQ-10 scores ≥ 13.5, test sensitivity was 48.7% and specificity was 75.0%, with an AUC of 0.631. The lower limit of the 95% CI for the AUC was 0.550, which exceeded the acceptable threshold of 0.5, indicating that a glaucoma knowledge–based test may be useful in classifying patients as adherent or non-adherent to therapeutic recommendations.
Comparative analysis showed that patients with higher adherence (ARMS ≤ 15) had greater glaucoma knowledge than those with lower adherence (ARMS > 15), with scores of 12.7 ±2.4 vs 11.5 ±2.6, respectively. Nearly half of patients with high adherence (48.7%) had a higher level of glaucoma knowledge (GKQ-10 ≥ 13.5), while the majority of patients with low adherence (75.0%) had lower levels of knowledge (GKQ-10 < 13.5). These findings indicate that glaucoma knowledge, as measured using the GKQ-10 questionnaire, is a statistically significant factor influencing adherence to therapeutic recommendations (p = 0.002). Furthermore, a GKQ-10 score ≥13.5 may be associated with adherence levels in this patient group (p = 0.002). The results are summarized in Supplementary Table 7.
Univariate logistic regression analysis showed that both higher levels of glaucoma knowledge, as measured using the GKQ-10 scale, and a cutoff value of GKQ-10 ≥ 13.5 are positive predictors of adherence to therapeutic recommendations. In patients with a GKQ-10 score of 13.5 or higher, the odds of high adherence were nearly 3 times higher than in those with lower knowledge (OR = 2.85). These findings are summarized in Supplementary Table 8.
Discussion
The study showed that more than half of the glaucoma patients (58.9%) exhibited low adherence to their prescribed therapy. This finding is consistent with previous reports in the literature. Systematic reviews indicate that medication non-adherence rates may reach up to 80%, although numerous studies report rates that are typically closer to 30%.26, 27 Schwartz and Quigley noted that while patients frequently self-report high adherence, objective measures such as pharmacy refill data or electronic monitoring often show much lower adherence levels. Adherence rates measured using electronic monitoring have been reported to be as low as 76%, depending on the method used.27 Such discrepancies between self-reported adherence and actual behavior highlight the challenge of accurately assessing and addressing non-adherence in glaucoma patients. Factors such as the chronic and often asymptomatic nature of glaucoma contribute to this suboptimal adherence, as patients may not recognize the importance of consistent medication use.
The side effects associated with topical glaucoma medications, such as ocular irritation, hyperemia, and discomfort, may also represent significant barriers to adherence. In the study by Movahedinejad et al., adverse effects of glaucoma medications were identified as a significant factor contributing to non-adherence.28 However, that study did not specify the exact nature of the side effects, but highlighted their significant role in adherence behaviors. Such adverse effects are particularly problematic for elderly patients, who may experience additional challenges with self-administering eye drops due to reduced manual dexterity or visual impairment. These issues may contribute to patients discontinuing or irregularly using their prescribed medication. In a cross-sectional survey, Newman-Casey et al. identified key barriers to adherence in glaucoma patients, including difficulties with eye drop administration and challenges related to medication scheduling. Difficulty administering eye drops was reported by 18% of participants who struggled with controlling the number of drops, 24% who had difficulty aiming, and others who experienced problems such as squeezing the bottle or holding it steady. Moreover, difficulties adhering to the prescribed medication schedule, often linked to forgetfulness, were associated with increased odds of non-adherence.29
The present study identified the quality of communication between patients and physicians as a key factor influencing adherence. Patients who reported higher satisfaction with communication, as measured with CAT-14 scores, demonstrated better adherence to their treatment regimen. Specifically, a CAT score ≥3.25 points was associated with a significantly higher likelihood of adherence. These findings underscore the importance of patient education about the disease and ensuring clear, empathetic communication between healthcare providers and patients.
Haskard Zolnierek and DiMatteo demonstrated in a meta-analysis that good physician–patient communication significantly enhances adherence, while poor communication increases the likelihood of non-adherence by 19%. Additionally, training physicians in communication skills can improve adherence by as much as 62%, underscoring that the quality of interaction is a modifiable factor that directly influences patient outcomes.30 In a more specific clinical context, Sleath et al. examined patients with glaucoma and found that communication about how to properly administer eye drops was crucial to adherence. Their study showed that patients who were educated about medication administration and had higher self-efficacy were more likely to adhere to their prescribed regimen. Importantly, the study also highlighted racial disparities, with African American patients showing lower adherence, suggesting a need for communication strategies tailored to individual patient populations.31 Carpenter et al. expanded on these findings by investigating how communication affects glaucoma patients’ self-efficacy, a key predictor of adherence. They found that provider education on glaucoma-related topics and discussions about patient views of the disease significantly improved patients’ confidence in self-administering their medications. However, they also observed that patients who asked more medication-related questions tended to have lower confidence in overcoming barriers to adherence. This finding suggests that patients who are more engaged may simultaneously feel less assured about managing their treatment, indicating the need for deeper, problem-solving conversations during clinical visits.32
Although the quality of the patient–physician relationship, as measured using the PDRQ-9 questionnaire, did not show a statistically significant overall association with adherence, a better relationship (PDRQ-9 score ≥26) may still be positively associated with adherence. This finding warrants a nuanced interpretation. One possible explanation lies in the characteristics of the instrument itself. Although the PDRQ-9 has demonstrated strong psychometric properties, it may not fully capture specific aspects of the physician–patient relationship that are most relevant in chronic ophthalmic conditions, particularly those that are largely asymptomatic, such as glaucoma. Elements such as shared decision-making, patient activation, or trust in treatment recommendations may be underrepresented.
Alternatively, this finding may reflect the characteristics of the study population. In our cohort, many patients had been living with glaucoma for many years and may have developed established routines or views regarding their treatment independently of their current relationship with their physician. Furthermore, given the relatively high overall satisfaction with communication observed in the CAT-14 scores, the variability in PDRQ-9 responses may have been insufficient to detect a statistically significant effect. Future studies may benefit from using complementary instruments or qualitative approaches to further explore how relational factors influence adherence behaviors in this clinical context.
Gómez and Aillach examined various dimensions influencing the patient–physician relationship, highlighting the role of verbal and non-verbal communication skills, including clinical empathy, in improving patient outcomes. The review emphasized that while physician empathy and communication skills are associated with patient satisfaction and some clinical markers, further research is required to confirm these findings across a broader range of clinical outcomes.33
In their study, Stryker et al. found that non-adherent patients were less likely to be satisfied with the amount of time the physician spent discussing their eye condition, compared to adherent patients.34 Patients emphasized the importance of physicians taking sufficient time to listen to their concerns and adequately address their questions. When patients felt that their doctors rushed through consultations or did not engage with their concerns, this created a barrier to adherence. A trusting relationship, built on empathy and respect, may help patients feel more confident in their treatment plan and more likely to adhere to prescribed regimens.35
The present study showed that patients with better visual function, as assessed using the NEI VFQ-25 questionnaire, were more likely to adhere to therapy. High adherence was associated with higher self-reported visual function (scores ≥68 points).
Jannuzzi et al. examined adherence to medication and its association with health-related quality of life (HRQoL) in elderly patients with diabetic retinopathy. In this cross-sectional study involving 100 elderly participants, the authors found that 58% adhered to at least 80% of their prescribed medication doses of antihypertensive and/or antidiabetic drugs. The Morisky Medication Adherence Scale indicated that one of the key factors contributing to non-adherence was discontinuation of medication after experiencing adverse drug effects. Additionally, the study also showed that patients with lower scores on the NEI VFQ-25, reflecting poorer vision-related quality of life, were more likely to be non-adherent.36
A statistically significant association was found between patients’ knowledge about glaucoma, as measured using the GKQ-10 scale, and their adherence to therapy. Patients with higher levels of disease-related knowledge were more likely to adhere to therapeutic recommendations. A GKQ-10 score ≥13.5 points was associated with better adherence.
Patients’ understanding and awareness of glaucoma are pivotal in shaping their adherence to therapy. Many glaucoma patients struggle to fully understand the progressive and asymptomatic nature of the disease, which often leads to underestimating its seriousness.11 In their study, Birhanie et al. reported that patients with good knowledge about glaucoma were 2.24 times more likely to adhere to their treatment compared with patients with inadequate knowledge.37
In a study by Hoevenaars et al., the relationship between glaucoma-related knowledge and treatment adherence was investigated. Contrary to expectations, the study found no significant correlation between overall levels of glaucoma-related knowledge and adherence. Only specific knowledge items, such as understanding that eye drops cannot repair damage caused by glaucoma, were positively associated with adherence. This suggests that educational interventions focused solely on increasing knowledge may not substantially improve adherence in glaucoma patients.10
Welge-Lussen et al. conducted a study evaluating adherence among glaucoma patients to topical eye drops using self-reported questionnaires. The authors found no significant association between adherence and demographic factors, clinical characteristics, or glaucoma-related knowledge. The most common reason for non-adherence was forgetfulness. The findings suggest that individualized strategies are required to improve adherence, as general educational interventions may be insufficient in this context.38
Inadequate knowledge and reliance on a single source of information may result in poor adherence, as patients may not appreciate the importance of consistent, lifelong management of the disease.
A strong association has been reported between poor health literacy and non-adherence to glaucoma therapy. Many patients lack a clear understanding of their disease and the importance of adhering to treatment, particularly as glaucoma is often asymptomatic in its early stages. This lack of awareness may lead to missed doses and infrequent refills. Educational interventions tailored to patients’ literacy levels – such as written instructions, educational videos, and personalized counseling – may significantly improve adherence. Patients who are educated about the proper administration of eye drops and the long-term consequences of non-adherence are more likely to adhere to their treatment regimens.39, 40
In a study by Paczkowska et al., patient knowledge about arterial hypertension was significantly associated with treatment adherence and improved clinical outcomes, including better blood pressure control and reduced hospitalization rates. The authors found that patients with higher levels of education and those treated in specialized clinics had higher levels of knowledge and adherence to their prescribed therapy.41
Karaeren et al. examined the impact of patient knowledge on medication adherence in hypertensive individuals. The study found that specific aspects of knowledge, such as understanding the cause of hypertension and target blood pressure levels, were significantly associated with improved adherence. In contrast, knowledge of medication side effects was associated with decreased adherence.42
Figueira et al. examined the impact of educational interventions on disease-related knowledge, medication adherence, and glycemic control in patients with type 2 diabetes mellitus. The study showed significant improvements in knowledge (p < 0.001), adherence to medication (p = 0.0318), and glycemic control (p = 0.0321), suggesting that targeted educational strategies may effectively enhance patient self-management.43
Physical limitations, such as arthritis or other mobility issues, may make it difficult for patients to self-administer eye drops properly.44 Additionally, complex treatment regimens that require multiple medications or frequent dosing can negatively affect adherence. Some patients report difficulty with eye drop bottle mechanisms or find it challenging to maintain a strict dosing schedule. However, the relationship between regimen complexity and adherence is not fully understood, as some studies have shown that patients receiving more complex regimens may adhere better, possibly because their disease is more advanced and because they receive increased counseling from healthcare providers.13
The findings of this study have important practical implications for ophthalmic care. Given the significant association between treatment adherence and both patient knowledge and the quality of physician–patient communication, there is a clear rationale for the implementation of targeted, low-cost interventions aimed at enhancing these aspects. Brief, structured educational sessions delivered during routine clinical visits may help patients better understand the chronic nature of glaucoma and the importance of consistent medication use, even in the absence of symptoms. Furthermore, communication skills training for ophthalmologists focused on empathetic engagement and effective information delivery may strengthen therapeutic relationships and positively influence adherence.
Such approaches are consistent with existing evidence from interventions in chronic disease management, including the Support, Educate, Empower (SEE) program developed by Newman-Casey et al., which has demonstrated improvements in adherence through personalized coaching and motivational interviewing.45 Similarly, a systematic review by Nieuwlaat et al. underscores that tailored, theory-informed interventions delivered by trained health professionals can be modestly effective in improving medication adherence.46 Future implementation of such strategies in glaucoma care may help mitigate disease progression and reduce the societal burden of vision loss.
Limitations
Several limitations should be considered when interpreting the results of this study. First, the cross-sectional design of the study does not allow determination of causal relationships between the examined variables and adherence to treatment. Second, the study was conducted in a single ophthalmology clinic in Poland, which may limit the generalizability of the findings to other populations or healthcare settings. Additionally, patient self-reporting of treatment adherence and the use of questionnaires to assess communication, relationship quality, and knowledge may introduce bias, such as social desirability or recall bias. Further longitudinal studies are necessary to confirm these findings and explore the long-term impact of the identified factors on adherence to glaucoma treatment.
Conclusions
Improving adherence to glaucoma medications requires addressing a range of factors, including demographic disparities, financial barriers, patient education, health beliefs, and the physical demands of treatment. Tailored interventions that focus on patient education, cost reduction strategies, and simplified treatment regimens are essential for enhancing adherence and improving long-term outcomes for patients with glaucoma.
This study demonstrated that adherence to glaucoma treatment is influenced by a range of factors, including patient knowledge about the disease, satisfaction with doctor–patient communication, and visual functioning. Patients who reported better communication and higher levels of knowledge about glaucoma were significantly more likely to adhere to their treatment regimens. Although the quality of the patient–physician relationship did not show a statistically significant effect on adherence, a positive relationship may still contribute to better adherence outcomes.
These findings highlight the need for targeted interventions that focus on improving patient education, addressing misconceptions about glaucoma, and fostering empathetic, clear communication between patients and healthcare providers. Educational efforts should emphasize the importance of lifelong treatment for glaucoma, even in the absence of symptoms, to prevent disease progression and irreversible vision loss.
Supplementary files
The supplementary materials are available at https://doi.org/10.5281/zenodo.15552922. The package includes the following files:
Supplementary Table 1. Assessment of patient–physician communication satisfaction (CAT-14) in groups with different levels of adherence to therapeutic recommendations.
Supplementary Table 2. Logistic regression results for adherence to therapeutic recommendations (ARMS ≤ 15 points) in patient groups with different levels of communication with ophthalmologists (CAT) and ORs with 95% CIs.
Supplementary Table 3. Assessment of the patient–physician relationship (PDRQ-9) in groups with different levels of adherence to therapeutic recommendations.
Supplementary Table 4. Logistic regression results for adherence to therapeutic recommendations (ARMS ≤ 15 points) in patient groups with different levels of communication with ophthalmologists (PDRQ-9) and ORs with 95% CIs.
Supplementary Table 5. Assessment of visual function in groups with different levels of adherence to therapeutic recommendations.
Supplementary Table 6. Logistic regression analysis of adherence to therapeutic recommendations (ARMS ≤ 15 points) in patient groups differing in visual function, including ORs and 95% CIs.
Supplementary Table 7. Assessment of glaucoma knowledge level (GKQ-10) in groups with different levels of adherence to therapeutic recommendations.
Supplementary Table 8. Logistic regression results for adherence to therapeutic recommendations (ARMS ≤ 15 points) in patient groups with differing levels of glaucoma knowledge, including ORs and 95% CIs.
Data Availability Statement
The datasets supporting the findings of the current study are openly available in Zenodo repository at https://doi.org/10.5281/zenodo.15552500.
Consent for publication
Not applicable.
Use of AI and AI-assisted technologies
Not applicable.