Abstract
Background. Gestational diabetes mellitus (GDM) is characterized by a higher degree of insulin resistance (IR) than in a normal pregnancy. Several surrogate measures have been proposed to assess insulin sensitivity, including glycated hemoglobin, the Homeostatic Model Assessment–Insulin Resistance (HOMA-IR), and the Quantitative Insulin Sensitivity Check Index (QUICKI).
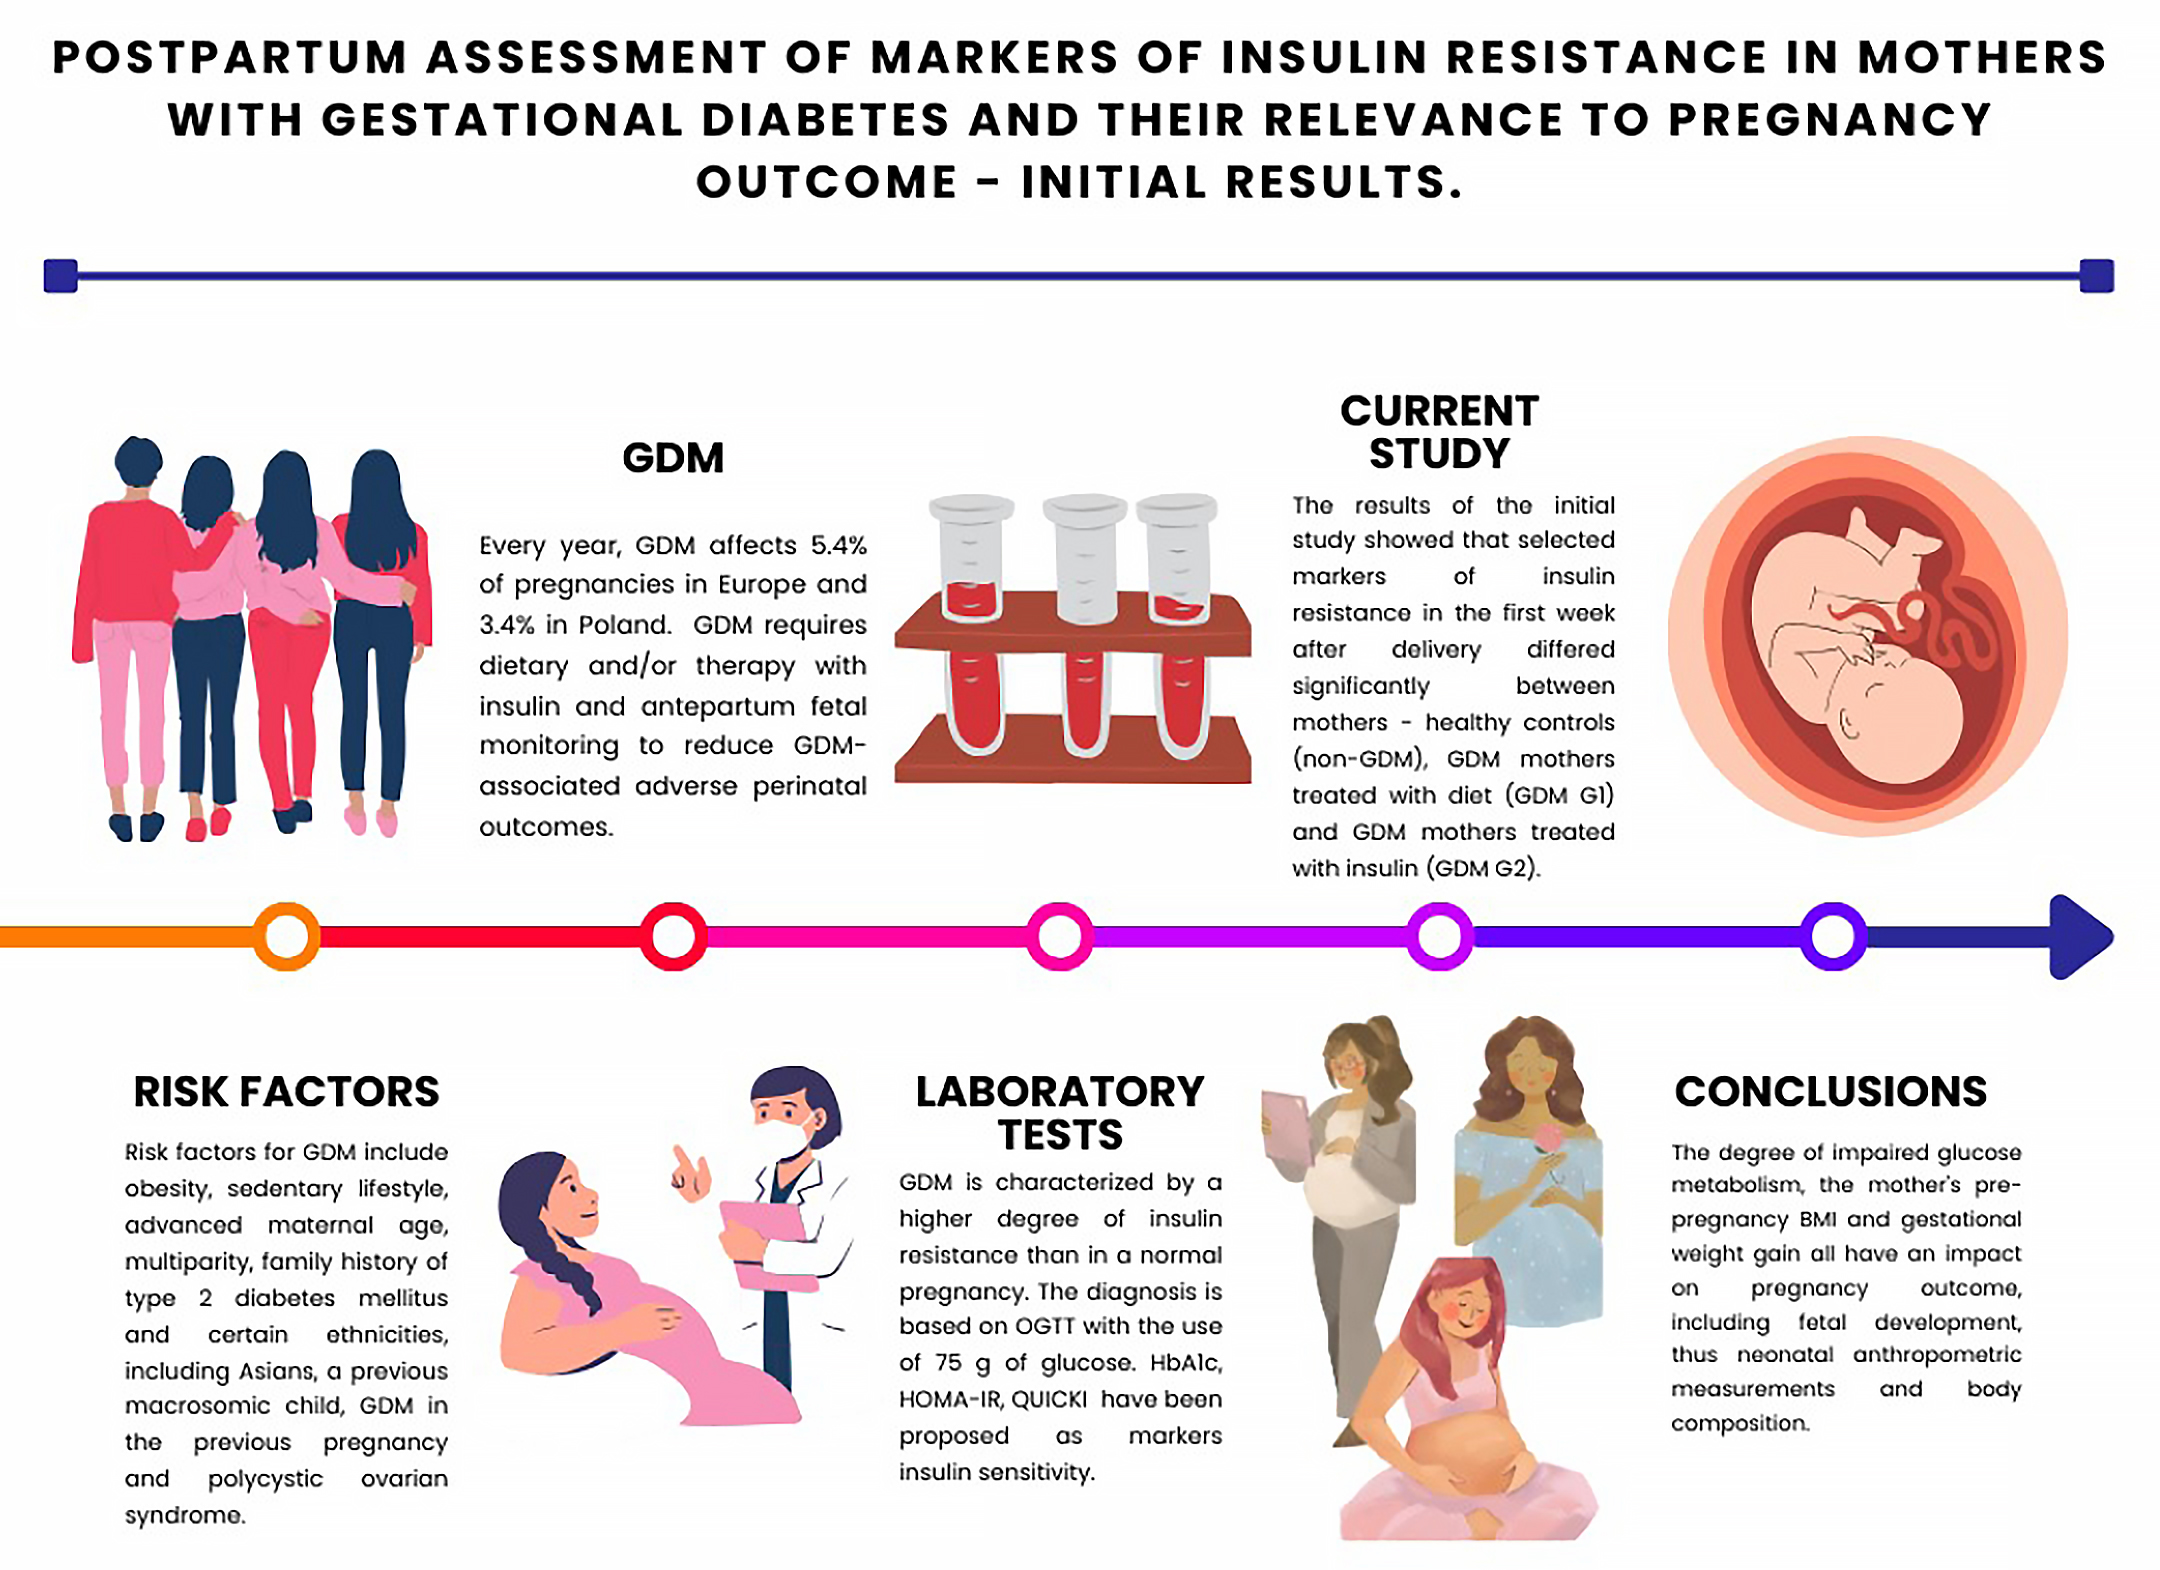
Objectives. The aim of the study was to determine whether markers of IR in the 1st week postpartum differ between mothers with GDM and healthy controls, and whether mothers with GDM treated with insulin have significantly different levels of IR markers compared with those treated with diet and physical activity. The association between IR markers, pregnancy outcomes, and maternal glucose profiles based on the oral glucose tolerance test (OGTT) was also investigated.
Materials and methods. Among the 70 participants, 50 mothers were diagnosed with GDM; 21 were treated with diet and physical activity (GDM G1), while 29 received insulin therapy (GDM G2). The remaining 20 participants constituted a control group with no history of glucose intolerance before or during pregnancy (non-GDM). A range of statistical methods (e.g., analysis of variance (ANOVA), Kruskal–Wallis test, χ2 test, regression analysis, and cluster analysis) were used to compare data between study groups, with a significance level of α = 0.05.
Results. The results showed that selected markers of IR in the 1st week after delivery differed significantly between mothers. Mothers with GDM exhibited considerably higher levels of HOMA-IR and HbA1c (p < 0.05), yet no substantially divergent QUICKI (p > 0.05) in the 1st week postpartum. Additionally, they demonstrated elevated glucose levels at 3 OGTT time points in comparison with non-GDM mothers. The GDM G2 group exhibited higher values than the GDM G1 group, except for the 1 h OGTT. Identification of maternal glucose phenotypes confirmed variability in the degree of glucose metabolism disorders among mothers.
Conclusions. Cluster analysis and glucose phenotype stratification in mothers with GDM help identify high-risk groups and support targeted counseling and monitoring to improve pregnancy outcomes.
Key words: insulin resistance, glycated hemoglobin, gestational diabetes, pregnancy outcomes
Background
Gestational diabetes mellitus (GDM) is a form of diabetes that manifests for the 1st time in a pregnant woman who was not previously diagnosed with diabetes. It can occur in any trimester of pregnancy. Nevertheless, its occurrence is more prevalent during the 2nd or 3rd trimester.1, 2 Gestational diabetes is not exclusively attributable to a paucity of insulin, but is also precipitated by insulin resistance (IR) or diminished insulin production by pancreatic beta cells. In pregnant women who demonstrate typical glucose metabolism, the compensatory mechanisms employed to address pregnancy-related insulin insensitivity and/or impaired β-cell function may be superseded by an adequate enhancement in insulin production. Whenever the above mechanism fails, GDM is likely to develop.3, 4, 5 Despite the absence of a definitive understanding of the underlying causes of GDM, the prevailing hypothesis suggests that the presence of other hormones produced during pregnancy, or cytokines, can result in a reduction in the effectiveness of insulin, causing glucose to build up in the blood and be transported to the growing fetus instead of being absorbed by the maternal cells. Therefore, the presence of physiological IR during pregnancy has been shown to be advantageous for fetal growth and effective delivery of nutrients. However, if the degree of IR exceeds that which is typically observed in a normal pregnancy, then there are numerous adverse effects on the mother and fetus.3, 4 The symptoms of GDM usually disappear after delivery. Every year, GDM affects 5.4% of pregnancies in Europe and 3.4% in Poland.5, 6
The Polish Society of Gynecologists and Obstetricians6 adopted a set of diagnostic criteria for GDM, as outlined by the World Health Organization (WHO)7 and the American Diabetes Association (ADA).8 It is recommended that all pregnant women undergo measurement of fasting plasma glucose in the 1st trimester of pregnancy. The diagnosis is made on the basis of an oral glucose tolerance test (OGTT), with the administration of 75 g of glucose, and it is essential that only 1 of the following criteria is met: 1) fasting blood glucose of 92–125 mg/dL (5.6–6.9 mmol/L), 2) glycemia in 1-h OGTT ≥180 mg/dL (≥10.0 mmol/L), 3) blood glucose level in 2-h OGTT 153–199 mg/dL (8.5–11.1 mmol/L). Pregnant women without diagnosed pre-pregnancy diabetes should be screened for GDM at 24–28 weeks of gestation. If a pregnant woman is at higher risk of GDM (overweight or obesity, family history of diabetes, previous delivery of a macrosomic infant or an infant weighing more than 4,000 g, age over 25 years, race: African American, American Indian, Asian American, Hispanic or Latino, or Pacific Islander), screening should be done in the 1st trimester or immediately if her fasting glucose level is above the limits. It is recommended that women diagnosed with GDM be further evaluated for persistent diabetes between 6 and 12 weeks following childbirth.6, 7, 8
Special consideration should be given to overt diabetes first diagnosed in pregnancy. Overt diabetes meets the diagnostic criteria and the blood glucose cutoff values for diabetes in adults who are not pregnant. The International Association of Diabetes and Pregnancy Study Groups (IADPSG) has established a set of guidelines for the diagnosis of pre-pregnancy diabetes. These include the assessment of fasting plasma glucose concentration, 2-h plasma glucose during an OGTT with 75 g of glucose, and the percentage of hemoglobin A1c (HbA1c) ≥6.5% (48 mmol/mol). However, in the 2nd and 3rd trimesters of pregnancy, HbA1c may not be a useful test for the diagnosis of diabetes. Criteria for the diagnosis of diabetes in pregnancy are as follows: 1) 2 fasting plasma glucose values ≥126 mg/dL (7.0 mmol/L); 2) 2-h post-OGTT plasma glucose ≥200 mg/dL (11.1 mmol/L); 3) persistent glycemia ≥200 mg/dL (≥11.1 mmol/L) and associated hyperglycemic symptoms. Meeting one of these criteria is sufficient to establish a diagnosis. In addition, it is important to note that diagnostic criteria for diabetes based on blood glucose 1 h post-OGTT have not been established, and this value should not be used to diagnose diabetes in pregnancy.2, 7, 8
It is usually possible to manage and prevent the complications of GDM. However, the most common are hypertension in pregnancy, fetal macrosomia, increased risk of cesarean section, neonatal prematurity, respiratory distress, and hypoglycemia. Moreover, both the mother and the infant exhibit an augmented susceptibility to the development of type 2 diabetes in the future.9, 10, 11, 12, 13 Therefore, the objective of GDM treatment is to maintain blood glucose concentrations within the normal range. The objective can be accomplished through a combination of dietary modifications, physical activity, daily self-assessment of blood glucose levels, and insulin administration.6, 7, 8, 10, 12
Objectives
The objective of this preliminary study was to investigate whether there are any differences in the levels of IR markers in the 1st 7 days after delivery between GDM mothers and healthy (non-GDM) controls. Furthermore, it was investigated whether GDM mothers receiving insulin treatment (GDM G2 group) exhibit significantly different levels of IR indicators compared to those managed with diet and physical activity (GDM G1 group). The association of IR markers with pregnancy outcomes was also investigated. In addition, it was also assessed whether the clusters obtained differ in basic parameters of neonatal body composition (birth weight, PI – ponderal index, TBW% – percentage of total body water, FBM – fat body mass, FBM% – percentage of fat body mass, and E/I ratio – extracellular/intracellular water ratio).
The secondary objective of the study was to identify subgroups of patients with GDM who were at a heightened risk of complications. This identification was based on a combination of both insulin-based and non-insulin-based markers and predictors.
The ultimate objective was to enhance individualized medical approaches by enabling early risk stratification and tailored interventions.
Materials and methods
Study design
The study was conceptualized as a prospective observational case-control study. Initiated in 2020, the study was suspended due to low enrolment during the COVID-19 pandemic. It was subsequently restarted in 2023. As demonstrated in the present article, the initial results of the indicators of IR were measured in a sample of 70 recruited mothers.
Inclusion and exclusion criteria
The following criteria were utilized to determine inclusion in the study groups: maternal age ranging from 18 to 45 years; delivery at or after 35 + 0/7 weeks of gestation by vaginal or caesarean route; singleton pregnancy; a newborn demonstrating a good postnatal condition, as evaluated by an Apgar score ≥7 points; and breastfeeding characterized by exclusivity or predominance. The recruitment process was initiated within the initial 7 postnatal days. Maternal consent for the assessment of IR markers was required. The exclusion criteria encompassed the following: any maternal or neonatal clinical condition that had an adverse effect on neonatal nutritional status, such as fetal growth retardation (FGR), absence of medical supervision during pregnancy, maternal use of alcohol or other psychoactive substances, nicotinism in pregnancy, uncontrolled maternal asthma, and the presence of congenital metabolic disease in the mother or neonate.
Study groups
In the present study, a total of 70 participants were included in the analysis, of whom 50 had a diagnosis of GDM. Of these, 21 were managed with a combination of diet and physical activity (GDM G1), while 29 received insulin therapy (GDM G2). The remaining 20 participants (non-GDM) were assigned to a control group. Prior to or during pregnancy, these individuals had no documented medical diagnosis of glucose intolerance. Additionally, their OGTT results in the current pregnancy were within normal limits. The enrollment took place among mothers hospitalized postpartum in the Second Department of Gynecology and Obstetrics, University Hospital in Wrocław (Poland), whose infants were hospitalized after birth in the Department of Neonatology of the University Hospital in Wrocław, Poland. Each mother was screened for GDM according to the recommendations of the Polish Society of Gynecologists and Obstetricians.6
Data collection
A retrospective analysis of maternal body weight during pregnancy was conducted using medical records. The categorization of gestational weight gain was determined in accordance with the guidelines published in the Committee Opinion of the American College of Obstetricians and Gynecologists, which were endorsed by the Polish Society of Gynecologists and Obstetricians.6, 14 The establishment of body mass index (BMI) ranges for underweight, normal weight, overweight, and obese women was based on maternal pre-pregnancy BMI.
The description of maternal weight gain in this study was as follows: below recommendations, within recommendations, or above recommendations. The collection of clinical data on the course of pregnancy, maternal antenatal history, labor, and puerperium was based on maternal medical records and personal interviews. The clinical data pertaining to the newborns were extracted from their medical records. The measurement of maternal and neonatal postpartum body weights was conducted using electronic medical scales, RADWAG type WPT 6/15D (RADWAG, Radom, Poland), to the nearest 10 g for neonates, and WPT 100/2000 (RADWAG), to the nearest 100 g for mothers.
Indicators of insulin resistance
To address the specific objectives of the project, insulin-based indicators of IR were employed. Peripheral venous blood for laboratory tests was taken from the mothers in the early morning after overnight fasting using the BD Vacutainer blood collecting system (Becton Dickinson, Franklin Lakes, USA). Fasting glucose [mg/dL], insulin [μU/mL] levels, and glycated hemoglobin (HbA1c; in %) were measured in the hospital laboratory using Abbott analyzers (Abbott Laboratories, Chicago, USA). The following methods were used for the laboratory testing: the enzymatic method for the determination of glucose levels and immunoassays to measure insulin levels and HbA1c. The ensuing findings were employed to calculate 2 key indices: the Homeostatic Model Assessment–Insulin Resistance (HOMA-IR) and the Quantitative Insulin Sensitivity Check Index (QUICKI). The HOMA-IR was determined using the following formula: (fasting insulin [μIU/mL] × fasting glucose [mg/dL])/405. The QUICKI, on the other hand, was calculated as the inverse of the sum of the logarithms of fasting insulin and fasting glucose, expressed as: 1/(log(fasting insulin μIU/mL) + log(fasting glucose mg/dL)). The cutoff values for the diagnosis of IR were >2.0 for HOMA-IR and <0.34 for QUICKI. The target level of HbA1c was ≤6.1%.15, 16
Glucose phenotypes
In their analysis, Yeung et al. examined both maternal and neonatal outcomes, with the maternal glucose phenotypes being identified from the results of a 50 g glucose challenge test (GCT) and a 75 g OGTT. They identified 7 glucose profiles that differed in the risk of perinatal complications.17 The above method was used, differentiating mothers based on 75 g OGTT results only. The combinations of normal or elevated values of fasting glucose level (FGL), 1 h post-OGTT glucose (1-h POGL), and 2 h post-OGTT glucose (2-h POGL) were set, resulting in the identification of 8 phenotypes.
Neonatal body composition
A non-invasive method of bioimpedance analysis (BIA) was used to assess neonatal body composition, a process that involves the identification of distinct body compartments based on the electrical properties of human tissue. The analyses were conducted using the Body Composition Monitor (BCM; Fresenius Medical Care, Bad Homburg vor der Höhe, Germany) and specially designed disposable electrodes (BCM-FMC, <25 kg). The analysis was conducted at 50 frequencies ranging from 5 to 1,000 kHz, with an amplitude of 0.8 mA.18 It should be noted that the measurements were performed by the same investigator, designated as K.K., in strict accordance with the manufacturer’s instructions. The measurements were performed during the 1st week following birth, coinciding with the analysis of the mother’s blood. For a comprehensive exposition of the methodology employed, the reader is referred to a separate manuscript which has been published independently.19
Microsoft Excel for Microsoft 365 (Microsoft, Redmond, USA), Statistica v. 13.3 (StatSoft, Inc., Tulsa, USA), and R v. 3.6.2 (R Foundation for Statistical Computing, Vienna, Austria)20, 21 were used for the statistical analysis.
Statistical analyses
The statistical analysis was conducted with a significance level set at α = 0.05. A p-value less than 0.05 was considered statistically significant. The data were expressed as the mean and standard deviation (SD), median and interquartile range (IQR), or number of cases (n) and percentage, as appropriate. One-way analysis of variance (ANOVA), the Kruskal–Wallis test, or the χ2 test was used to compare the data between the study groups, depending on the type of data and its distribution. The Shapiro–Wilk test was employed to ascertain the normality of the data set. Levene’s test was conducted to evaluate the homogeneity of variances across variables. Supplementary Table 1 presents the results of the aforementioned tests.
The impact of specific maternal characteristics on postpartum indicators of IR was evaluated with the use of univariate regression (generalized linear model). Subsequently, cluster analysis was conducted using the Marczewski–Steinhaus (M–S) taxonomic approach, and a dendrogram was constructed.22 The impact of the resulting clusters was ultimately determined through the implementation of 2 analytical methods: a one-way ANOVA and the Kruskal–Wallis test. To ensure the reliability of the established taxonomic approach, the expectation–maximization (E–M) algorithm was employed for validation.23
A dendrogram is a chart that graphically represents the results of a cluster analysis. Clusters are groups of patients or data with maximal within-group similarities and maximal between-group differences in the investigated variables. The construction of a dendrogram facilitates the visualization of the formation of clusters at each stage and the assessment of the degree of similarity (or distance) among the clusters. According to Marczewski and Steinhaus, the distance is equal to the differences between patients in the variables studied. Once the distance between variables is defined, linkage methods are used to link sufficiently similar clusters.22, 23 The E–M algorithm is a maximum likelihood estimation method for latent variable models that is considered to have a high degree of reliability and complexity.23
Ethics
The study was conducted in compliance with the Helsinki Declaration and received approval from the Bioethics Committee of the Medical University of Wroclaw, Poland. The protocol (code KB 950/2022) was authorized on December 21, 2022, as a continuation of KB 407/2020 from June 23, 2020, KB 35/2020 from January 16, 2020, and 773/2019 from November 25, 2019. The mothers who participated in the study groups were given the opportunity to provide their written informed consent. The current study has been duly registered in the ClinicalTrials.gov registry and was assigned the number NCT04937348.
Results
General description of the study group
The mean maternal age was 32.7 (SD = 4.5) years. The median gravidity was 2.0 (IQR = 1.0), and parity was also 2.0 (IQR = 1.0). A review of the obstetric records of the participating mothers resulted in the following findings: 6 (8.6%) had been diagnosed with GDM in a previous pregnancy, 7 (10%) delivered a macrosomic infant (>90th percentile for birth weight for gestational age), and 6 (8.6%) had newborns weighing more than 4 kg. These characteristics were not statistically different between the study groups (p > 0.05). Pregestational diabetes or IR had not been previously diagnosed in any of these mothers.
Based on the medical history and outcomes of previous pregnancies, the following results were obtained. Most of the newborns were girls (60%), and the most common method of delivery was cesarean section (over 70%). The median number of weeks of gestation at birth was 39 (IQR = 2.0). Mean neonatal anthropometric measurements at birth were as follows: birth weight 3.5 (SD = 0.5) kg, length 53.2 (SD = 2.8) cm, and head circumference 34.7 (SD = 1.5) cm. The median percentile for birth weight was 66.0 (IQR = 44.0).
Considering classification by neonatal weight for gestational age, 80% (n = 56) of newborns were eutrophic (AGA – appropriate for gestational age), 4.3% (n = 3) were hypotrophic (SGA – small for gestational age), and 15.7% (n = 11) were macrosomic (LGA – large for gestational age). Six newborns (8.6%) developed respiratory distress after birth, including 4 born to GDM G2 mothers. These results were not statistically different between the analyzed groups (p > 0.05). Significant differences were observed in the incidence of congenital malformations in newborns; all 4 cases occurred in the GDM G1 group (χ2(2, n = 70) = 9.899, p = 0.006; V = 0.376). In some of these newborns, more than one defect was identified. Among these newborns, 3 had hydronephrosis, 1 had a ventricular septal defect (VSD), 1 had an atrial septal defect type II (ASD II), 1 had a persistent left superior vena cava (LVCS), and 1 had a cleft soft palate.
Newborns of GDM mothers were mostly fed predominantly with breast milk and occasionally supplemented with formula (13 (61.9%) in the GDM G1 group and 19 (65.5%) in the GDM G2 group), whereas newborns of non-GDM mothers were mainly exclusively breastfed (15 (75%)). These results were statistically significant (χ2 (2, n = 70) = 8.784, p = 0.012; V = 0.354). Maternal morbidity was similar between the studied groups (p > 0.05), including the incidence of hypertension, hypothyroidism, nicotine use before pregnancy, nausea and vomiting in the 1st trimester, and rates of vaginal or urinary tract infections.
The detailed results of the aforementioned characteristics with comparisons between the study groups are shown in Table 1.
Maternal nutritional status, glucose screening tests, and markers of insulin resistance
The mothers differed significantly between the study groups in terms of pre-gestational BMI (H(2, n = 70) = 8.537, p = 0.014) and classification of nutritional status according to pre-gestational BMI (χ2(4, n = 70) = 15.424, p = 0.004; V = 0.332). The highest pre-gestational BMI was found in the GDM G2 group, with a median of 28.0 (IQR = 6.8) kg/m2. In this group, the highest percentage of mothers were overweight or obese compared with the other study groups. However, the highest weight gain during pregnancy was observed in non-GDM mothers, with a mean of 16.2 (SD = 5.4) kg (F(2, 67) = 12.923, p < 0.001 for the study groups), which corresponded to the highest incidence (13 (65%)) of gestational weight gain above obstetrical recommendations (χ2(4, n = 70) = 10.454, p = 0.033; V = 0.273).
In the 1st trimester of pregnancy, the median fasting glucose level was 89.0 mg/dL (IQR = 14.2) across all study groups. Subsequent analysis revealed no statistically significant differences between the study groups with respect to this parameter. However, statistically significant differences (p < 0.05) were identified among the study groups with regard to OGTT results. The highest fasting glucose level observed during the 2nd or 3rd trimester (median 95.0 (IQR = 10.0) mg/dL) and the 1 h post-OGTT glucose level (median 182.0 (IQR = 46.0) mg/dL) were found in the GDM G2 group, whereas the highest median 2 h post-OGTT glucose level (median 138.0 (IQR = 53.0) mg/dL) was found in the GDM G1 group.
Regarding abnormal glucose screening results, elevated levels of the following parameters were observed: 1st-trimester fasting glucose (92–125 mg/dL) in 19 (27.1%) mothers, 2nd/3rd-trimester fasting glucose (92–125 mg/dL) in 30 (42.9%), 1 h post-OGTT glucose (≥180 mg/dL) in 25 (35.1%), and 2 h post-OGTT glucose (153–199 mg/dL) in 25 (35.1%) (Table 1). A comparison of the results obtained from the study groups revealed a significant difference in the levels of IR markers in the week following childbirth, including HbA1c (H(2, n = 70) = 9.372, p = 0.009) and HOMA-IR (H(2, n = 70) = 6.177, p = 0.046), with the highest values observed in the GDM G2 group. QUICKI values were similar (p > 0.05) between the study groups, with a median of 0.41 (IQR = 0.13) for all participants. An elevated HbA1c level (≥6.1%) was found in 2 (2.9%) participants. Elevated HOMA-IR (>2.0) and decreased QUICKI (<0.34) were found in 9 (12.9%) and 9 (12.9%) participants, respectively (Table 1).
There were 6 GDM mothers who had been diagnosed with GDM in a previous pregnancy. Compared with mothers diagnosed with GDM for the 1st time, these mothers had similar levels of HbA1c (H (1, n = 21) = 0.510, p = 0.475 for GDM G1 and H (1, n = 29) = 0.033, p = 0.856 for GDM G2), HOMA-IR (H (1, n = 21) = 0.010, p = 0.920 for GDM G1 and H(1, n = 29) = 0.621, p = 0.432 for GDM G2), and QUICKI (H (1, n = 21) = 0.064, p = 0.800 for GDM G1 and H (1, n = 29) = 0.743, p = 0.389 for GDM G2). There was no history of GDM in previous pregnancies among mothers in the non-GDM group.
Maternal factors and results of IR markers
The role of maternal characteristics in determining levels of IR indicators during the initial week postpartum was assessed using univariate regression, specifically a generalized linear model. In the analysis, the following factors were taken into account: study group (indicative of the extent of glucose intolerance), maternal chronological age, parity (number of times a woman has given birth), gravidity (total number of pregnancies regardless of duration and outcome), pre-pregnancy BMI, nutritional status based on pre-pregnancy BMI classification, maximum BMI in pregnancy, increase in body weight during pregnancy, classification of weight gain based on obstetric recommendations, body weight and BMI at recruitment after delivery, and medical interview data on hypertension, hypothyroidism, nicotinism, and results of glucose sensitivity screening tests conducted during pregnancy. The following factors were identified as the strongest determinants of IR markers during the initial postpartum period, as determined by the Akaike Information Criterion (AIC) values: allocation to a specific study group, maternal BMI before pregnancy, and maternal weight gain during pregnancy. A comprehensive overview of the outcomes is provided in Supplementary Table 2.
Cluster analysis
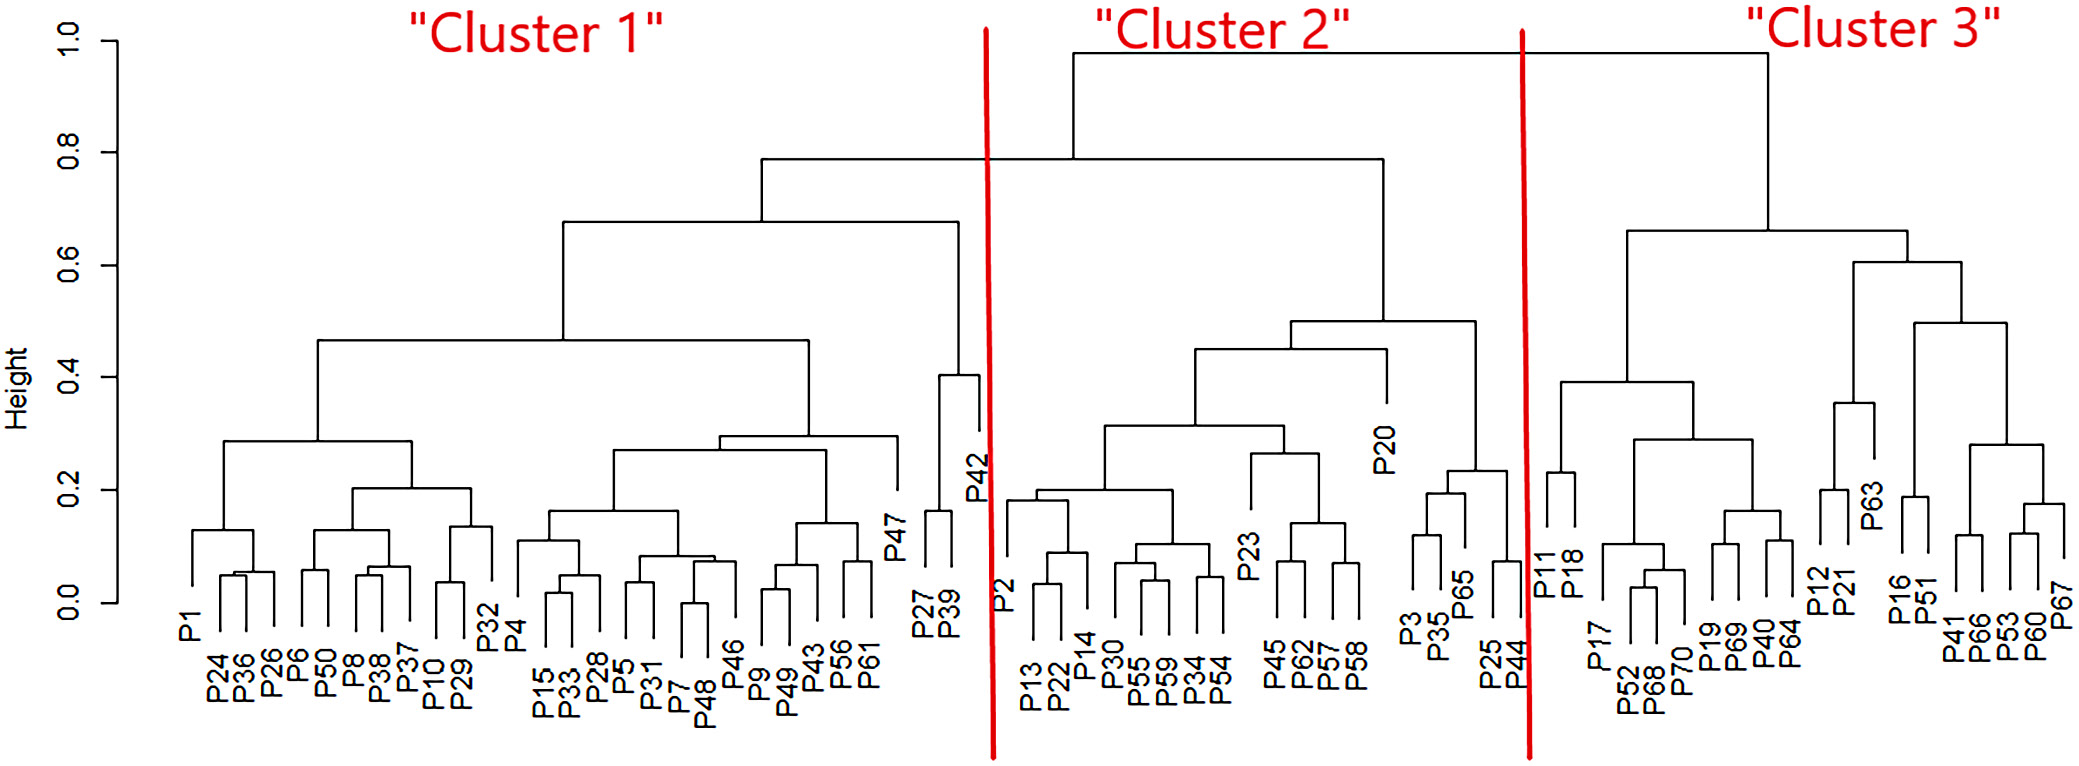
A classification tree for the patients was constructed based on the identified factors, including allocation to a specific study group, maternal pre-pregnancy BMI, and maternal gestational weight gain (Figure 1).
The dendrogram shows 3 distinct patient types, the characteristics of which are presented in Table 2. The average M–S distance between pairs of compared sets (clusters vs original study groups) was approx. 0.027.
‘Cluster 1’ included GDM-affected mothers (n = 29 GDM G2 and n = 1 GDM G1), with the highest mean preconceptional BMI (mean 28.8 kg/m2, SD = 0.9, corresponding to a median of 28.1 kg/m2, IQR = 9.6) and the lowest gestational weight gain (mean 5.4 kg, SD = 9.0) ‘Cluster 2’ included the remaining GDM G1 mothers, with a mean BMI before pregnancy of 24.1 kg/m2 (SD = 1.1) corresponding to median 23.2 kg/m2 (IQR = 3.1) and a mean weight gain during pregnancy of 10.6 kg (SD = 1.1). ‘Cluster 3’ comprised healthy mothers (non-GDM), with a mean BMI before pregnancy of 24.1 kg/m2 (SD = 1.1), corresponding to median 22.96 kg/m2 (IQR = 2.83) and the highest gestational weight gain (mean 16.2 kg, SD = 1.1) (Table 2).
As the cluster classification closely corresponded to the classification of mothers by study group, the results of the comparison of selected characteristics were similar. Mothers in the clusters differed significantly according to the classification of nutritional status based on pre-gestational BMI (χ2 (4, n = 70) = 17.194, p = 0.002; V = 0.350), gestational weight gain according to obstetrical recommendations (χ2(4, n = 70) = 10.599, p = 0.031; V = 0.275), and the method of infant feeding (χ2 (2, n = 70) = 8.934, p = 0.011; V = 0.357). The statistical significance of the comparison of characteristics across the research groups was identical to that observed in the cluster comparison. The results of the comparison between clusters are summarized in Table 3.
When maternal IR markers were compared between clusters, a significant difference was observed in the Kruskal–Wallis test for HbA1c and HOMA-IR (H(2, n = 70) = 11.222, p = 0.004 and H(2, n = 70) = 6.950, p = 0.031, respectively). With respect to neonatal nutritional status and body composition, the clusters did not differ (p > 0.05). In multiple comparisons between clusters, no differences were observed in newborns’ body composition or anthropometric assessment (p > 0.05). When maternal IR markers in the 1st week postpartum were considered, ‘Cluster 1’ differed from ‘Cluster 2’ and from ‘Cluster 3’ in terms of HbA1c (p < 0.05) (Table 4).
Neonatal body composition in clusters
Clustered analysis did not reveal any significant differences regarding neonatal birth weight and body composition. Results of one-way ANOVA were as follows: F (2, 67) = 2.666, p = 0.077 for birth weight, F (2, 67) = 1.963, p = 0.148 for ponderal index, F (2, 67) = 3.014, p = 0.056 for FBM, F (2, 67) = 2.099, p = 0.131 for FBM%, and F (2, 67) = 1.11, p = 0.336 for TBW%. Kruskal–Wallis ANOVA was H (2, n = 70) = 1.285, p = 0.526 for E/I. Results in ‘Cluster 1’ were: mean birth weight 3.42 kg (SD 0.59), mean ponderal index 2.16 kg/m2 (SD = 0.27), mean FBM 0.27 kg (SD = 0.09), mean FBM% 0.08 (SD = 0.02), mean TBW% 0.81 (SD 0.05), and median E/I 0.50 (IQR = 0.12). Results in ‘Cluster 2’ were: mean birth weight 3.34 kg (SD = 0.43), mean ponderal index 2.09 kg/m2 (SD = 0.25), mean FBM 0.24 kg (SD = 0.09), mean FBM% 0.08 (SD = 0.02), mean TBW% 0.82 (SD = 0.07), and median E/I 0.44 (IQR = 0.08). Results in ‘Cluster 3’ were: mean birth weight 3.65 kg (SD = 0.40), mean ponderal index 2.24 kg/m2 (SD = 0.28), mean FBM 0.31 kg (SD = 0.10), mean FBM% 0.09 (SD = 0.02), mean TBW% 0.80 (SD = 0.07), and median E/I 0.50 (IQR = 0.09).
Glucose phenotypes
Eight maternal glucose phenotypes were identified by analyzing OGTT at 3 time points: 1) normal OGTT; 2) elevated FGL + normal 1-h POGL + normal 2-h POGL; 3) normal FGL + elevated 1-h POGL + normal 2-h POGL; 4) normal FGL + normal 1-h POGL + elevated 2-h POGL; 5) elevated FGL + elevated 1-h POGL + elevated 2-h POGL; 6) elevated FGL + elevated 1-h POGL + normal 2-h POGL; 7) elevated FGL + normal 1-h POGL + elevated 2-h POGL; and 8) normal FGL + elevated 1-h POGL + elevated 2-h POGL. Normal OGTT profile included only non-GDM mothers, whereas both GDM G1 and GDM G2 mothers were present in the other 7 profiles in varying proportions (p < 0.05). The glucose phenotypes differed significantly in terms of maternal classification by pregestational BMI (p = 0.014) and gestational weight gain in relation to BMI before conception (p = 0.018). Mothers who had abnormal glucose levels at 3 time points of OGTT were found with the highest incidence of BMI > 25 kg/m2, including the highest percentage of obesity and excessive gestational weight gain among assigned mothers. These mothers were also found to have the highest incidence of elevated HbA1c (≥6.1%) in the 1st week postpartum, hypothyroidism, urinary tract infections (UTI) during pregnancy, nicotine use before the pregnancy, as well as the highest incidence of delivering LGA newborns. However, these results were not statistically significant (p > 0.05). The other significant differences (p < 0.05) included the incidence of respiratory distress after birth in newborns (with the highest percentage of cases in elevated FGL + normal 1-h POGL + elevated 2-h POGL profile) and method of feeding a neonate (with the highest percentage of sporadic formula use in normal FGL + elevated 1-h POGL + normal 2-h POGL and elevated FGL + elevated 1-h POGL + normal 2-h POGL profiles). The detailed results are presented in Table 5.
Discussion
The average number of births per year in the authors’ unit is 2,000. Of these, newborns with a gestational age greater than 35 +0/7 weeks account for approx. 1,700 (85%). Accordingly, 50 GDM mothers in the current study represent 2.9% of all women who gave birth in the authors’ unit. This result is similar to the reported GDM prevalence of 3.4% among pregnant women in Poland.
The most effective way to manage GDM and reduce the risk of complications is early detection and appropriate treatment. Diet, physical activity, and insulin therapy are the available therapeutic options. Reviews on the optimal management of GDM state that if diet and physical activity alone are ineffective in achieving glycemic control within 2 weeks, insulin should be administered in conjunction with dietary modifications and physical activity.24 Accordingly, the type of therapeutic interventions necessary to achieve normal glucose levels corresponds to the extent of gestational glucose metabolism disorders and, consequently, IR.24, 25 Insulin resistance combined with impaired insulin secretion is the primary underlying cause of GDM. It is difficult to determine the degree of IR and insulin secretion in women with newly diagnosed GDM. Predicting insulin requirements during pregnancy is even more problematic because IR increases gradually over the course of pregnancy due to hormonal changes. The process of developing IR in pregnancy occurs in all pregnant women. Available studies have shown a decrease in insulin sensitivity of almost 60% during a normal pregnancy. However, GDM is more likely to develop in women with additional risk factors (genetic, environmental, etc.). Gestational diabetes mellitus is considered a temporary condition and is usually resolved postpartum, within 6–12 weeks of the puerperium.26, 27
The authors, as members of the neonatal team, were the 1st to have the opportunity to recruit the mothers and assess the course of the pregnancies in the postpartum period. The evaluation included the effectiveness of glucose control, the results of laboratory tests, and a medical interview regarding maternal comorbidities. However, no results for IR indicators at various stages of pregnancy were available. We therefore assumed that GDM mothers treated with insulin would have a higher degree of glucose intolerance compared with those treated with diet and physical activity alone. We also aimed to compare whether these 2 groups differed in IR marker levels during the 1st week after childbirth, when other analyses were planned.
This assumption is consistent with the results of our study. Mothers with GDM were found to have higher levels of HOMA-IR, QUICKI, and HbA1c in the 1st week postpartum, as well as higher glucose levels at 3 time points of the OGTT than non-GDM mothers. In addition, the GDM G2 group (treated with insulin therapy) had higher values than the GDM G1 group (dietary changes and physical activity only), except for the 1 h OGTT. As only one of 3 criteria needs to be met for a diagnosis of GDM, the GDM-affected study groups differed in the incidence of abnormal glucose screening at 3 time points of the OGTT. The highest incidence of abnormal glucose levels at each time point was found in the GDM G2 group. The same observation applies to 1st-trimester fasting glucose levels. However, the incidence of selected complications did not differ between the study groups.
The results regarding breastfeeding rates warrant particular attention. The results documented an unexpectedly limited prevalence of exclusive breastfeeding among mothers with GDM, particularly among those classified as GDM G2. Women affected by GDM exhibited less favorable breastfeeding outcomes compared to those without GDM, despite comparable rates of breastfeeding initiation. According to the available literature, there appears to be a heightened propensity for delayed onset of lactogenesis II in this population.26 This is further compounded by the fact that women with GDM report greater difficulty in producing sufficient milk compared with women without diabetes. Consequently, infants of mothers with GDM are introduced to human milk substitutes (e.g., formula) at an earlier age than infants of women without a history of diabetes. The use of formula is also associated with earlier cessation of breastfeeding.27, 28, 29, 30, 31
The trend toward formula-supplemented feeding among GDM mothers is clinically significant: formula feeding in GDM-exposed infants is linked to a higher risk of obesity during early childhood, whereas exclusive breastfeeding offers protective effects.28, 31 This highlights an actionable intervention – supporting and encouraging breastfeeding in GDM contexts may help mitigate metabolic risks in offspring.
Several surrogate measures have been introduced to evaluate insulin sensitivity, including HOMA-IR and QUICKI. These measures, along with HbA1c, have also been considered biomarkers capable of predicting adverse pregnancy outcomes in women with GDM.25, 32 However, the threshold of HOMA-IR for the assessment of IR has not been universally agreed upon. This is due to various factors correlated with HOMA-IR, including age, sex, ethnicity, and body weight. HOMA-IR demonstrates a robust correlation with BMI, as evidenced by substantial differences in HOMA-IR between individuals with normal weight and those categorized as obese.32
The present study demonstrated that HOMA-IR exhibited an upward trend in conjunction with elevated pre-pregnancy BMI, with the highest levels observed in the GDM G2 group. In contrast, HOMA-IR > 2.0 and QUICKI < 0.34 are most often considered indicative of IR.15, 16 These levels were found in 9 (12.9%) mothers in the 1st week postpartum, with a predominance among insulin-treated GDM mothers. The authors suggest that a higher degree of glucose intolerance during pregnancy requiring insulin administration may contribute to the development of persistent IR in the early postpartum period.
Based on international studies, 3rd-trimester HbA1c levels have been identified as a determinant of LGA in pregnancies affected by GDM.33 However, early control of GDM (before 34 weeks) was found to result in an 18% lower rate of LGA infants compared with late control of GDM (after 34 weeks).34 In the present study, all patients diagnosed with GDM were provided with dietary and lifestyle recommendations, as well as self-monitoring of blood glucose levels. In addition, stricter weight gain targets during pregnancy were imposed on participants with elevated BMI values before pregnancy.
In a large proportion of mothers, weight gain during pregnancy was classified as above recommendations, with the highest incidence observed in the non-GDM group. Therefore, it was not possible to determine whether the nonsignificant difference in the incidence of LGA between women with higher BMI and a higher prevalence of overweight and obesity (GDM G2) was attributable to lifestyle treatment or to stricter weight gain targets. On the other hand, non-GDM mothers who did not receive lifestyle intervention during pregnancy had the highest gestational weight gain, which did not result in an increased incidence of LGA. Similar results were reported by Sun et al.35 The aforementioned study also emphasized the importance of maintaining pre-pregnancy BMI within the optimal range and preventing excessive weight gain to reduce excessive IR in the 2nd trimester.
Despite evidence indicating the potential of HbA1c as a biomarker for predicting adverse outcomes in pregnant women with GDM, it is important to consider maternal age, pre-pregnancy BMI, and gestational weight gain when assessing the relationship between HbA1c and adverse perinatal outcomes.26 Maternal age, BMI, and excessive weight gain prior to 24 weeks’ gestation have been recognized as contributing factors to the development of GDM and IR. A comprehensive analysis of the Taiwanese population revealed an elevated risk of IR in individuals with high BMI values. Consistent with the findings of Sun et al., increased pre-pregnancy BMI and weight gain prior to the diagnosis of GDM were strongly associated with an increased risk of impaired glucose tolerance in the 2nd trimester.35 A total of 293 women with a history of GDM or a pre-pregnancy BMI greater than 30 kg/m2 were enrolled in the RADIEL trial and subsequently divided into 2 groups. Patients in the intervention group received early individualized counseling on diet, physical activity, and weight control prior to 20 weeks’ gestation. The incidence of GDM in this group was significantly lower than in the control group.36
Therefore, our results confirm that appropriate antenatal care, health education, and rigorous counseling are effective in preventing, or at least reducing, the risk of complications in women with GDM and their newborns.
The implementation of cluster analysis in the present study enabled a distinct categorization of patients based not only on allocation to the study groups but also on pregestational BMI and gestational weight gain. These factors are recognized as key determinants of IR and adverse pregnancy outcomes. The mean M–S distance between the clusters and the original groups was 0.027, indicating a high degree of agreement between the 2 categorizations. The observed discrepancies were confined to a single case, which was classified differently by the clustering algorithm than in the original grouping. An analysis of the patient’s characteristics suggests that the patient’s profile may have been at the threshold between groups, thereby explaining the assignment to a different cluster. This finding may indicate that the clustering captured important differences in the data that were not fully reflected in the initial classification. Consequently, this approach may represent a valuable addition to, or potential refinement of, the original diagnostic grouping.
Given the observed similarity in neonatal birth weight, mean birth weight, and birth weight percentile across both study groups and clusters, the findings related to neonatal body composition were likewise consistent across these groups. This finding supports the effectiveness of glycemic and weight control measures in mitigating macrosomia.
Identification of maternal glucose phenotypes confirmed that the degree of glucose metabolism disorders varied among mothers. This variation may have been influenced by other factors affecting overall maternal health (e.g., hypothyroidism, obesity, and nicotine dependence) as well as the course of pregnancy (e.g., gestational weight gain and urinary tract infection). As a result, pregnancy outcomes may also have been affected, including neonatal LGA or respiratory distress, success of exclusive breastfeeding, and selected IR marker levels in the early postpartum period.
Furthermore, this analysis suggests a potential relationship between 2 factors –maternal pre-pregnancy BMI and excessive gestational weight gain – on the one hand, and adverse pregnancy outcomes, on the other. However, the small number of mothers within each glucose phenotype limits the ability to draw definitive conclusions regarding associations between specific glucose phenotypes and selected pregnancy complications. It is also inappropriate to generalize these results to the Polish population.
Nevertheless, the application of cluster analysis and glucose phenotype stratification in mothers with GDM facilitates the identification of high-risk groups, thereby enabling targeted counseling and monitoring aimed at preventing future metabolic disorders.
The findings of the present study did not demonstrate a significant difference in IR marker outcomes between mothers with newly diagnosed GDM and those with a history of GDM. However, short-term studies have shown that IR remains higher in women with a history of GDM.37, 38 This inconsistency may be attributable to the small number of mothers with previous GDM included in our study.
By identifying high-risk groups using these markers, healthcare providers may implement personalized monitoring and intervention strategies to improve maternal and fetal outcomes by addressing subgroup-specific risk profiles.
The classification of GDM patients at high risk of complications depends on understanding the sociodemographic and health factors that inform these risk assessments. A recent Polish study found that non-insulin-based indices of IR – the triglyceride and glucose (TyG) index and the metabolic score for insulin resistance (METS-IR) – were significantly associated with older age, smoking, and elevated systolic blood pressure, indicating coexisting cardiometabolic risks. Furthermore, an elevated TyG index was associated with higher BMI and alcohol consumption. Conversely, lower educational attainment was associated with higher METS-IR scores.
In patients with GDM, who already experience increased IR, these findings underscore the importance of incorporating sociodemographic metrics (e.g., age, education level, smoking, alcohol consumption) and key health indicators (e.g., BMI and blood pressure) into risk-stratification models.39 This multidimensional approach may help guide early interventions, personalized monitoring, and tailored support strategies aimed at mitigating both metabolic and obstetric complications.
The concept of individualized medicine has been proposed as a catalyst for advancements in healthcare, with the capacity to enhance the effectiveness, efficiency, and patient-centeredness of healthcare services. By focusing on the unique characteristics of each patient, this approach aims to improve outcomes and reduce unnecessary treatments. A substantial body of clinical research has demonstrated that the personalization of nutritional plans to meet the needs of individual patients – taking into account factors such as body weight, metabolic status, energy demands, and meal timing (a concept referred to as “chrononutrition”) – can lead to meaningful improvements in patient outcomes. Additionally, reduced gestational weight gain has been shown to be associated with favorable pregnancy outcomes.40, 41
Limitations of the study
The primary limitation of this study is the limited sample size. While the preliminary results provide a general overview of the issue addressed, these findings require verification through additional research involving a larger cohort. Moreover, the reproducibility of these results cannot be assured. One of the key concerns relates to the potential inaccuracy of assumptions based on the available data.
A further limitation is the absence of IR marker assessments during pregnancy, which limits the ability to compare results across different stages and precludes conclusions regarding potential changes in IR over subsequent weeks. An exception is HbA1c, as the average lifespan of erythrocytes is 60–90 days. Consequently, HbA1c levels provide insight into estimated glucose concentrations during the final 2–3 months of pregnancy.
Conclusions
Markers of IR, such as HbA1c and HOMA-IR, in the 1st week after delivery varied significantly between mothers with GDM and healthy controls, with the highest incidence of abnormal results observed among insulin-treated GDM mothers. The degree of impaired glucose metabolism, along with maternal preconceptional BMI and gestational weight change, had a significant influence on pregnancy outcomes. These variables appear to be closely associated with the maternal glucose profile, thereby influencing maternal OGTT results at various time points during pregnancy.
With respect to most pregnancy outcomes, including anthropometric measurements of newborns and the composition of their body compartments, no substantial differences were observed between the study groups. However, an inverse relationship was identified between the severity of glucose tolerance impairment and maternal weight accumulation during gestation.
Conversely, in mothers with impaired glucose metabolism during pregnancy, abnormal body weight or excessive weight gain may lead to a higher incidence of LGA in newborns. Adequate glycemic control and effective treatment, regardless of the type of intervention, are important factors influencing pregnancy outcomes. Both cluster analysis and stratification of glucose phenotypes among mothers with GDM are valuable methods for identifying distinct patient groups based on a combination of risk factors. These approaches may be helpful in identifying patients at high risk of adverse pregnancy outcomes, as well as mothers and newborns who require careful counseling and monitoring to prevent future metabolic disorders..
The concept of individualized medicine in GDM adopts a multifaceted approach, encompassing personalized nutrition, physical activity regimens, pharmacological therapy selection, digital guidance, and genetic and metabolic profiling. This integrated strategy aims to provide earlier, more effective, and more patient-centered care, thereby enhancing outcomes for both the mother and child.
In summary, the findings of the present study support the view that GDM is not merely a condition confined to pregnancy but rather part of a broader continuum of maternal–fetal metabolic health. These findings support the importance of early intervention, personalized care guided by BMI and glucose profiles, and the promotion of breastfeeding to enhance both immediate and long-term health outcomes for mothers and their children.
Supplementary data
The supplementary materials are available at https://doi.org/10.5281/zenodo.15862275. The package contains the following files:
Supplementary Table 1. Results of the Shapiro–Wilk test for normality and Levene’s test for homogeneity of variances across selected characteristics and pregnancy outcomes in clusters and groups.
Supplementary Table 2. Results of regression analysis (generalized linear model).
Data Availability Statement
The participants in this study did not provide written consent for their data to be shared publicly; therefore, due to the sensitive nature of the research, the supporting data are not available.
Consent for publication
Not applicable.
Use of AI and AI-assisted technology
Not applicable.