


Abstract
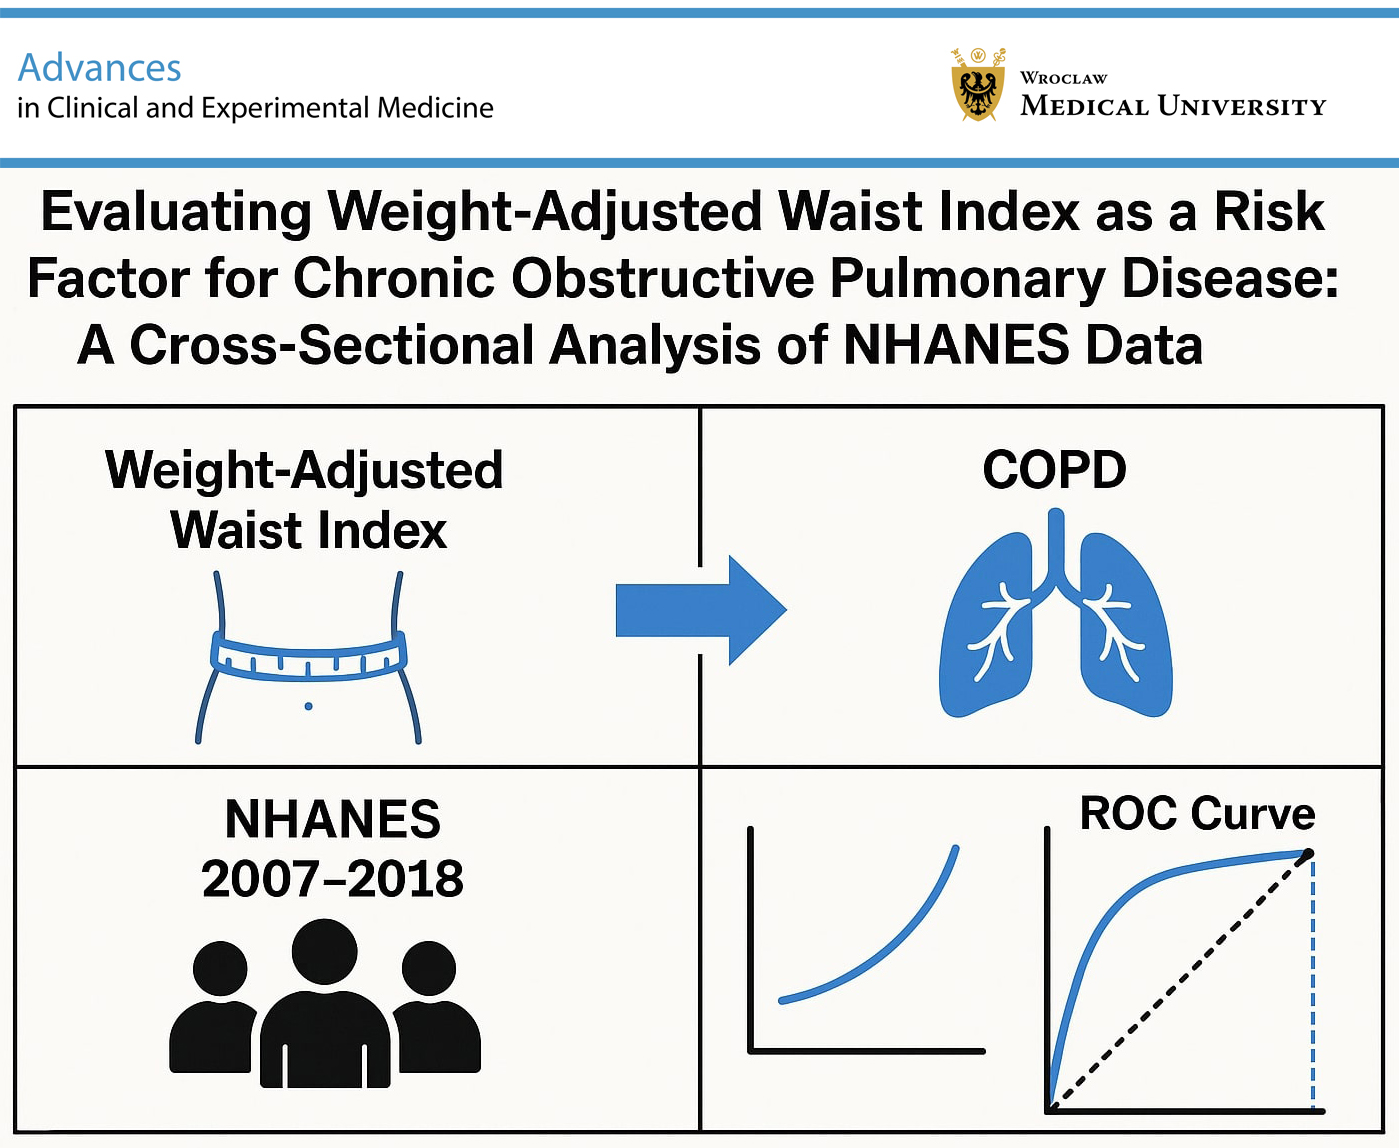
Background. The weight-adjusted waist index (WWI) shows a significant positive association with chronic obstructive pulmonary disease (COPD) risk, suggesting a potential role in risk stratification and early detection.
Objectives. This study examined the relationship between WWI and COPD, with a focus on its clinical implications for COPD risk assessment and management.
Materials and methods. Data from the U.S. National Health and Nutrition Examination Survey (NHANES) 2007–2018 were used. We included individuals aged 40 years and older. Weighted logistic regression was used to examine the association between WWI and COPD. Subgroup analyses and interaction tests were performed to assess consistency across demographic and lifestyle factors. A nonlinear regression model was used to evaluate the relationship between WWI and COPD, while receiver operating characteristic (ROC) curve analysis was used to assess the ability of WWI to identify individuals at risk.
Results. Among 14,144 participants, WWI was higher in the COPD group than in the control group (p < 0.001). In fully adjusted models, WWI was positively associated with COPD (odds ratio (OR) = 1.50, 95% confidence interval (95% CI): 1.34–1.68). In stratified analyses, participants in the highest WWI quartile had a greater risk of COPD than those in the lowest quartile (OR = 2.13, 95% CI: 1.62–2.80). Subgroup analyses showed a consistent positive association between WWI and COPD across sex, age, and smoking status. The nonlinear model indicated that the risk of COPD increased significantly beyond a certain WWI value. The ROC curve analysis confirmed the utility of WWI as a predictor (area under the curve (AUC) = 0.625, 95% CI: 0.609–0.642). These findings highlight the need to incorporate WWI into routine COPD risk assessment.
Conclusions. This study found a significant and nonlinear positive association between WWI, a marker of central obesity, and COPD risk. Weight-adjusted waist index may be an independent predictor of COPD risk and provide insight into the contribution of obesity to the disease. Given the increasing burden of COPD, integrating WWI into clinical practice could enhance preventive efforts and personalized interventions.
Key words: central obesity, chronic obstructive pulmonary disease (COPD), weight-adjusted waist index (WWI)
Background
Chronic obstructive pulmonary disease (COPD) is a long-term lung condition in which airflow is limited. It is preventable and treatable, but the global prevalence of COPD continues to rise.1, 2 Smoking is one of the major contributors to COPD, but other environmental and occupational exposures, such as air pollution and workplace hazards, are also factors in COPD development.3 Therefore, modifiable risk factors and implement preventive measures need to be identified in order to reduce COPD risk.
Recent studies show that underweight individuals and those with central obesity have been linked to COPD and other chronic inflammatory airway diseases.4, 5 However, conventional obesity measures, such as body mass index (BMI) and waist circumference (WC), have their own limitations in fat distribution assessment.6, 7 Body mass index does not differentiate between fat and muscle mass,8, 9 while WC alone does not account for differences in body size and proportions.10 As a result, these measures may not fully capture the role of body composition in COPD development.
To address this limitation, the weight-adjusted waist index (WWI) was introduced as an alternative metric. It is calculated by dividing waist circumference by the square root of body weight (WC/√weight).6 This provides a better representation of abdominal fat relative to overall body size. Unlike BMI and WC, WWI is more closely linked to visceral fat accumulation, which is known to contribute to systemic inflammation and metabolic dysfunction.11, 12 Prior studies have shown that WWI is a strong predictor of cardiovascular disease (CVD), hypertension, and diabetes – conditions that share inflammatory pathways with COPD.13, 14 However, its relationship with COPD remains largely unexplored.
Given that central obesity is associated with chronic inflammation and impaired lung function, WWI may serve as a better indicator of COPD risk than traditional obesity metrics. Yet, there is still limited research on how WWI specifically influences COPD susceptibility and progression.
Objectives
This study seeks to address the existing gap in research and assess WWI’s potential as a predictive marker for COPD risk. The WWI fills a gap in current obesity-related COPD research by offering a more accurate measure of central adiposity, which traditional metrics, such as BMI and WC, may not fully capture.
Materials and methods
Study design and setting
Data source
The data used in this study were obtained from the National Health and Nutrition Examination Survey (NHANES) – a large cross-sectional survey conducted from 2007 to 2018 to measure the health and nutrition status of the American population. It uses a complex, multistage probability sample to ensure that the sample is representative of the civilian, noninstitutionalized population. The National Center for Health Statistics (NCHS) Ethics Review Board has approved all procedures in NHANES. In addition, all participants provided written informed consent. For this analysis, no ethics approval was required due to the public availability of the data. The data collection process involved household interviews, physical examinations, and laboratory tests conducted in mobile examination centers.
Study population
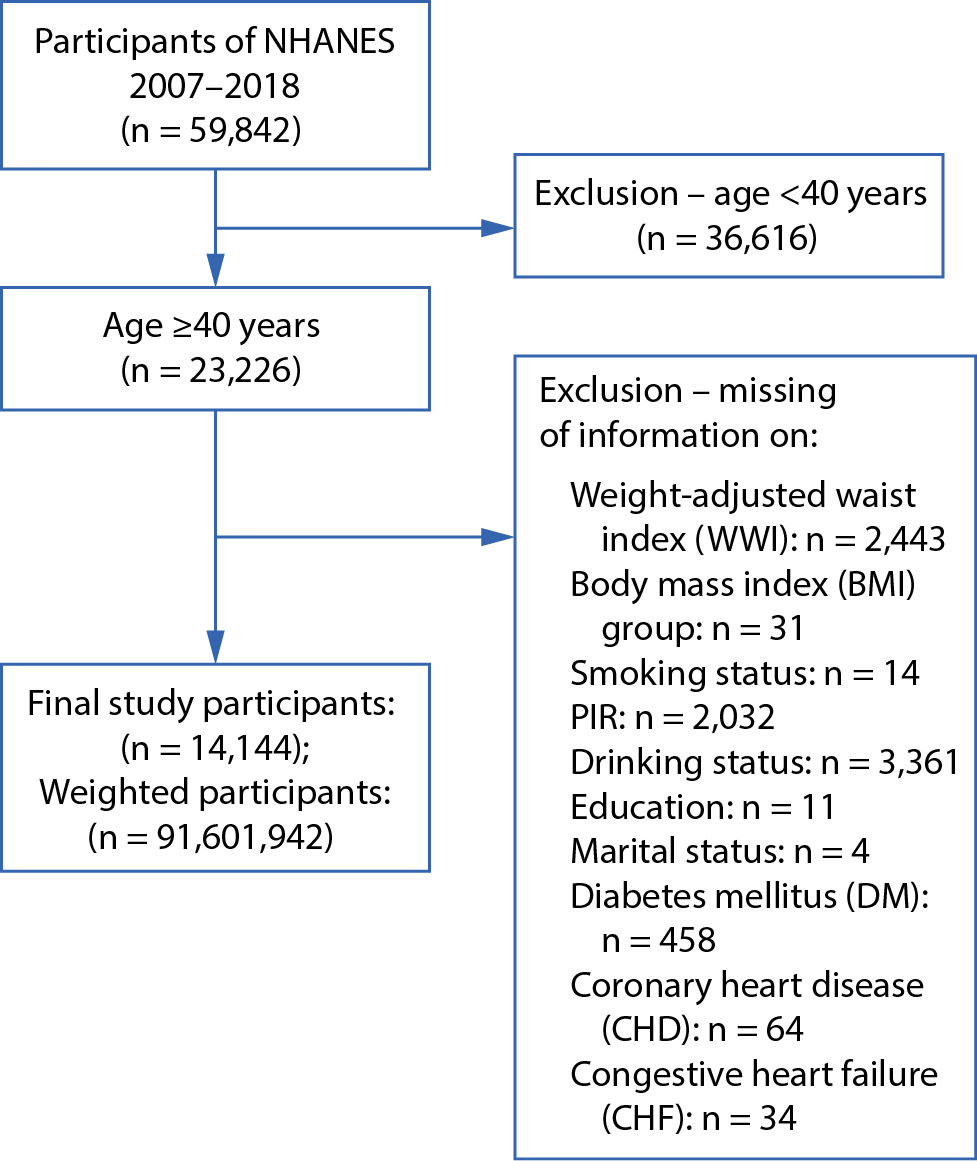
The study began with 59,842 participants from NHANES. After excluding those under 40 years of age and those with incomplete data, 14,144 participants remained for analysis (Figure 1). The diagnosis of COPD was determined based on participants’ affirmative responses to either of the following questions: “Has a doctor ever told you that you have emphysema?” or “Has a doctor ever told you that you have chronic bronchitis?”.
Weight-adjusted waist index
The WWI is an indicator of central obesity that accounts for both waist circumference and body weight, offering a refined measure of obesity status. Waist circumference was measured in centimeters and weight in kilograms, both recorded by trained health technicians at the mobile examination centers. Weight-adjusted waist index was calculated by dividing waist circumference by the square root of body weight. Only normally distributed WWI data were presented as the mean and standard deviation (SD), while non-normally distributed data were reported using the median and the 1st and 3rd quartiles (Q1 and Q3).
Covariates
Potential confounders were selected based on prior literature and biological plausibility. Several demographic, lifestyle, and health-related variables were included as covariates based on their potential to confound the relationship between WWI and COPD. These variables included:
– Demographic characteristics: age (40–60 years, >60 years), sex (male, female), race/ethnicity (Mexican American, other race), marital status (married, unmarried), and education level (high school or less, more than high school).
– Socioeconomic status: family poverty-to-income ratio (categorized as <1.3, 1.3–3.5, and ≥3.5).
– Lifestyle factors: smoking status (never, former, current) and alcohol consumption (drinker, non-drinker).
Health status: BMI (grouped as <18.5, 18.5–25, 25–30, and ≥30 kg/m2) and comorbidities, including congestive heart failure (CHF), coronary heart disease (CHD), and diabetes. Covariates were adjusted in all analyses to ensure that observed associations between WWI and COPD were independent of other risk factors. Multivariate models were adjusted for key covariates, including age, sex, race/ethnicity, BMI, smoking status (never, former, current), and comorbid conditions (hypertension, diabetes, and CVD). Results for the fully adjusted model (Model 4) are presented in Table 1, demonstrating a persistent association between higher WWI and increased COPD risk.
Statistical analyses
The analysis adhered to NHANES guidelines, utilizing appropriate sample weights to account for the complex survey design, including stratification and clustering. Weighted logistic regression was used after checking all model assumptions, ensuring that parametric tests were applied when assumptions were met to achieve better statistical power. Continuous variables were summarized using means (SD) for normally distributed data and medians (Q1, Q3) for non-normally distributed data, while categorical variables were presented as absolute numbers and percentages. Differences between groups were assessed using the Wilcoxon rank-sum test for continuous variables and the χ2 test for categorical variables.
This study aims to explore the association between different levels of WWI, categorized into quartile groups (Q1–Q4), and clinical outcomes. The use of quartile-based grouping is a common and natural stratification method in observational studies,15 rather than an experimental randomized allocation. Its primary value lies in uncovering heterogeneity across segments of a continuous variable rather than evaluating intervention effects; thus, randomization is not a prerequisite. We employed rigorous statistical methods, including nonparametric tests such as the Kruskal–Wallis H test, which do not rely on the assumption of normality and are robust for naturally grouped data. If parametric tests were to be used, we would ensure homogeneity of variance beforehand to maintain scientific validity. According to authoritative international guidelines (e.g., Statistical Methods in Medical Research16), grouping based on variable distribution characteristics – such as quartiles – is considered a valid exploratory approach in observational studies, particularly when examining nonlinear relationships or heterogeneity.17 This method is widely used in clinical risk stratification, such as BMI categories or blood pressure classifications.18 While we acknowledge that randomized grouping is essential for causal inference, this study is observational in nature, aiming to describe associations rather than establish causality. The rationale for grouping is clearly stated, potential confounders (e.g., age and sex) are controlled, and the analysis focuses on between-group differences rather than the inference of intervention effects. We believe that the use of quartile-based grouping aligns well with the observational design of this study, that the statistical methods are rigorous, and that the interpretation of results is appropriately cautious.
The reference values for categorical variables in subgroup and regression analyses were selected based on clinical relevance and existing literature.19, 20 For continuous variables divided into quartiles, Q1 (the lowest quartile) was set as the reference category. This choice enables consistent interpretation and is commonly used in epidemiological studies to highlight risk gradients.
We conducted tests for normality (Supplementary Table 1) and homogeneity of variance (Supplementary Table 2) and ultimately adopted nonparametric tests. Weighted logistic regression was used to estimate odds ratios (ORs) and 95% confidence intervals (95% CIs) for the association between WWI and COPD. Detailed information on how data were weighted in the regression models has been included. All covariates were adjusted based on the following factors: demographic factors, socioeconomic indicators, lifestyle behaviors, and comorbidities.
Subgroup analysis was conducted with a clear justification based on previous research. Subgroup analyses were conducted to explore potential effect modification by age (<60 vs ≥60 years), sex (male vs female), and smoking status (never, former, current). Interaction terms were introduced in the regression models to test for heterogeneity across subgroups. To ensure consistency, we recalculated the reference category for each subgroup separately rather than assuming a single reference across all groups. Reference values for each subgroup were based on the category with the lowest observed risk and were verified for clinical interpretability and comparability across models.19, 20 Interaction terms were used to test statistical significance across population subgroups. Reference values were standardized to ensure consistency across groups.
A restricted cubic spline model was used to examine potential nonlinear relationships between WWI and COPD risk. Multivariate logistic regression was used to obtain trend results. To account for the complex sampling design of NHANES and ensure nationally representative estimates, we applied survey weights provided by NHANES. The weighting procedure included adjustments for oversampling, non-response, and post-stratification. The final survey weights were incorporated into the multivariate logistic regression models using the ‘svy’ package in R (R Foundation for Statistical Computing, Vienna, Austria), ensuring valid population-level inferences. Each participant’s weight was used to compute weighted prevalence estimates and associations between WWI and COPD.
To evaluate the dose–response relationship between WWI and COPD risk, we categorized WWI into quartiles and introduced the quartile variable as an ordinal predictor in the logistic regression models. To assess trends across quartiles, the median value of each quartile was assigned to participants in that quartile and modeled as a continuous variable in the logistic regression model, following the approach described in statistical epidemiology literature.21 This method is commonly used to test for linear trends in categorical exposures and is distinct from interpreting the p-value as a strict trend test.
Finally, the area under the ROC curve (AUC) with 95% CI was reported to assess WWI’s discriminative ability. The optimal WWI threshold for COPD risk prediction was determined by maximizing the sum of sensitivity and specificity. This approach ensures a balance between true positive and false positive rates, thereby enhancing clinical applicability. A two-tailed p < 0.05 was considered statistically significant for all analyses.
Results
Figure 1 shows the inclusion criteria and selection process for this study. In total, 14,144 participants were included in the analysis, representing a weighted population of 91,601,942 individuals. Among them, 1,204 (8.5%) had COPD and 12,940 (91.5%) were controls. Table 2 presents the baseline characteristics of the study population stratified by quartiles of WWI. Significant differences were observed across all quartiles for demographic, lifestyle, and clinical variables (p < 0.001 for all). Participants in the highest WWI quartile (WW4) were older, with 68% aged 60 years or older, compared with 28% in the lowest quartile (WW1). The proportion of female participants increased with WWI, reaching 66% in WW4 compared with 42% in WW1. Racial distribution also varied significantly, with a higher proportion of Mexican Americans in the upper WWI quartiles.
Higher WWI was associated with increased obesity prevalence, with 63% of participants in WW4 classified as obese (BMI ≥ 30 kg/m2), whereas only 16% were obese in WW1. In contrast, the proportion of individuals with a normal BMI decreased across WWI quartiles (44% in WW1 vs 9.5% in WW4). Education level also differed, with a lower proportion of participants in WW4 having attained education beyond high school (40%) compared with WW1 (61%).
Smoking status and alcohol consumption exhibited notable trends; the prevalence of current smokers decreased with increasing WWI (23% in WW1 vs 16% in WW4), while former smoking status was more common in higher WWI quartiles. Similarly, alcohol consumption declined with increasing WWI, with 30% of WW1 participants identified as drinkers compared with only 14% in WW4.
Clinical characteristics also showed significant variation. The prevalence of diabetes increased across WWI quartiles, from 7.2% in WW1 to 31% in WW4. The prevalence of CHD and CHF was substantially higher in the upper WWI quartiles, with CHD affecting 8.7% and CHF affecting 7.5% of individuals in WW4, compared with 2.7% and 1.6% in WW1, respectively.
Table 1 presents findings on the association between WWI and COPD risk. When analyzed as a continuous variable, WWI was consistently linked to an elevated risk of COPD. In Model 1, which adjusted only for BMI, the OR for WWI was 1.99 (95% CI: 1.79–2.21). This relationship remained robust even in the fully adjusted Model 4, which produced an OR of 1.50 (95% CI: 1.34–1.68). Analysis by quartile further reinforced this association; participants in the highest quartile (Q4) of WWI exhibited a significantly greater risk of COPD compared with those in the lowest quartile (Q1), with an OR of 2.13 (95% CI: 1.62–2.80). The association persisted across intermediate quartiles, although its strength diminished with adjustment. The p-values for trend across all models were less than 0.001, affirming a strong relationship between WWI and COPD risk.
Subgroup analyses by sex, age, and smoking status (Table 3) demonstrated a consistent positive association between WWI and COPD risk across all categories. However, effect sizes varied among subgroups. For instance, the association was relatively weaker in women and non-smokers, with a noticeable reduction in effect strength as model adjustments increased.
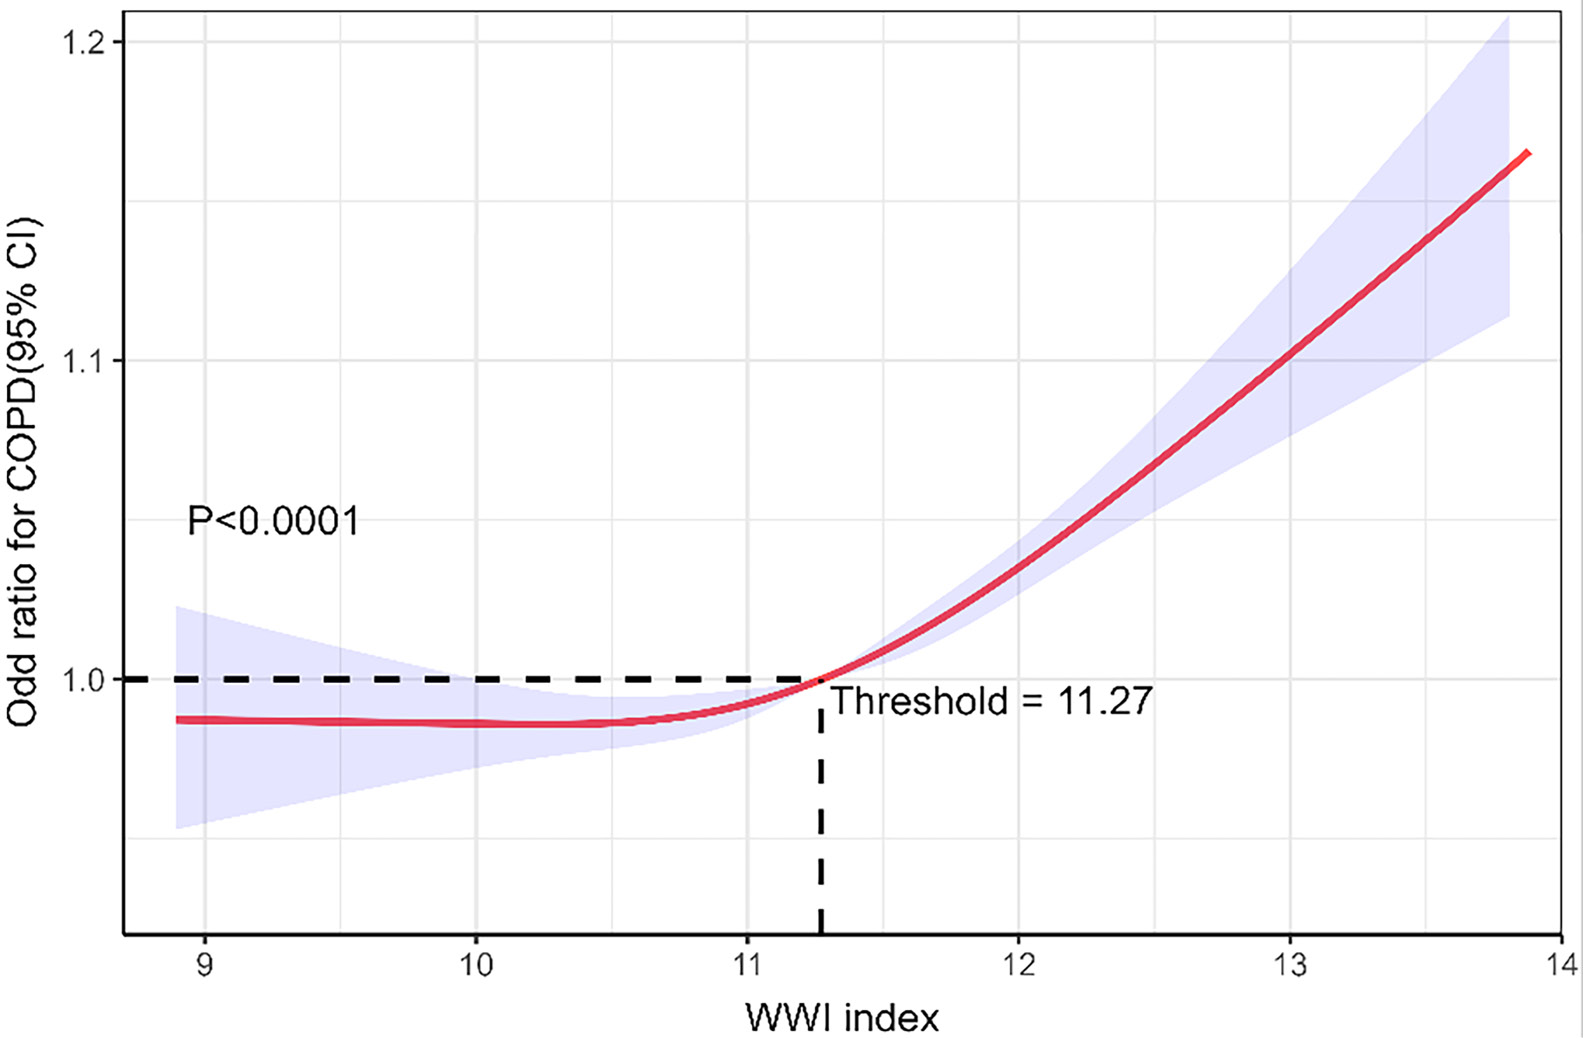
To further investigate the relationship between WWI and COPD risk, a restricted cubic spline regression analysis was conducted (Figure 2). This analysis revealed a significant nonlinear association (p < 0.05 for nonlinearity). The inflection point occurred at a WWI value of 11.27, corresponding to a risk ratio (RR) of 1. Below this threshold, changes in WWI had minimal impact on COPD risk. However, WWI values exceeding 11.27 were associated with a marked increase in risk. To improve readability, Figure 2 has been annotated to highlight this threshold and key turning points.
The predictive performance of WWI for COPD risk was evaluated using ROC curve analysis (Figure 3). The AUC was 0.625 (95% CI: 0.609–0.642, p < 0.01), indicating modest predictive capability. The optimal threshold for WWI was identified as 11.49, yielding a sensitivity of 0.568 and a specificity of 0.630. While WWI alone may not serve as a definitive diagnostic tool, its predictive value suggests that it could enhance risk stratification when combined with other clinical factors.
Discussion
This study explored the association between WWI and the risk of COPD in a nationally representative sample. The findings demonstrated a clear positive relationship between WWI and COPD risk, with this association remaining consistent across various demographic and lifestyle subgroups. These results suggest that elevated WWI is an independent risk factor for COPD, and that central obesity should be targeted in prevention and management strategies.
Body fat distribution has been recognized as an important factor in COPD risk. Unlike BMI or WC, WWI accounts for central obesity and minimizes the confounding effect of overall body weight.22 This unique feature allows WWI to provide a more precise measurement of central fat accumulation. Previous studies have shown the value of WWI in predicting various health outcomes. For example, a study in South Korea found WWI to be a better predictor of cardiovascular and metabolic diseases and mortality than BMI, WC, and waist-to-height ratio.23 Another study showed a strong positive association between WWI and asthma prevalence and asthma onset.6 Higher WWI was also associated with all-cause and cause-specific mortality, including respiratory mortality, among adults with asthma.24 Building on this evidence, our study is the first to specifically investigate the relationship between WWI and COPD risk, further solidifying the potential of WWI as a sensitive and independent marker of disease susceptibility.
Mechanistically, the observed association between WWI and COPD may be explained by several biological processes. Central obesity, as measured with WWI, is characterized by excess fat accumulation in the abdominal region.25 This type of adiposity contributes to systemic inflammation by releasing pro-inflammatory cytokines, such as tumor necrosis factor alpha (TNF-α) and interleukin-6 (IL-6), which are known to promote airway inflammation and lung function decline.26, 27, 28 Chronic low-grade inflammation driven by central obesity is involved in the pathogenesis of COPD.29, 30, 31 Adipose tissue is a source of reactive oxygen species (ROS), which exacerbate oxidative stress, impair the body’s antioxidant defense mechanisms, and increase COPD risk.32, 33 Excess abdominal fat can also exert pressure on the diaphragm and chest wall, restricting respiratory movement and reducing lung capacity and pulmonary function. This mechanical limitation, combined with reduced respiratory muscle strength, can worsen dyspnea and other respiratory symptoms in individuals with central obesity.34 Metabolic abnormalities in central obesity, such as insulin resistance and dyslipidemia, can also indirectly contribute to COPD progression by altering the pulmonary microenvironment and immune function.33, 35
Although BMI was included as a covariate in our analysis, it is closely correlated with both WWI and COPD risk. This correlation could have led to an underestimation of the true association between WWI and COPD risk. Future research should explore models excluding BMI to assess whether the strength of the association changes, providing additional clarity on the role of WWI as an independent predictor.
Additionally, our study accounted for certain comorbidities, including CHF, CHD, and diabetes. However, other conditions, such as gastrointestinal diseases, renal diseases, and dyslipidemia, may also affect the relationship between WWI and COPD.36, 37, 38 Further studies including these additional comorbidities could provide a more comprehensive understanding of the observed association.
Our results also show a dose–response relationship between WWI and COPD risk, with a significant increase in risk beyond a certain WWI threshold. This pattern was observed across all subgroups stratified by sex, age, and smoking status, suggesting that WWI is a robust predictor. These findings suggest that interventions aimed at reducing central obesity, such as targeted dietary and physical activity interventions, may have a substantial impact on reducing COPD risk. By reducing visceral fat accumulation, these interventions may not only improve respiratory health but also metabolic and cardiovascular health.
A key strength of this study is the use of NHANES data, which ensures a diverse and nationally representative sample, thereby enhancing the generalizability of our findings. The comprehensive adjustment for confounders makes the results more robust. The study also highlights the importance of considering body fat distribution, rather than just overall obesity, in disease prevention and management.
The findings of this study align with previous research that emphasizes the role of central obesity in COPD risk, suggesting that central fat distribution, as captured with WWI, may be a more precise indicator of COPD risk than other obesity metrics, such as BMI or WC.39 However, WWI’s predictive ability, as reflected by the modest AUC of 0.625, suggests that it may not be sufficiently robust to act as a standalone risk assessment tool. This modest predictive capability should be explicitly acknowledged, and future research should consider combining WWI with other biomarkers or clinical measures to enhance its utility in clinical practice.39 Compared with other studies that used WC or BMI as markers, WWI demonstrated a similar but slightly improved ability to predict COPD risk. Despite this, the relatively modest predictive capability warrants consideration of combining WWI with other biomarkers or clinical measures to enhance its utility in clinical practice.
Limitations of the study
However, this study is not without limitations. As a cross-sectional study, it cannot establish causality between WWI and COPD risk. Although many confounders were adjusted for, there may still be residual confounding, as unmeasured factors such as genetic predisposition and environmental exposures may influence the observed association. Self-reported COPD diagnosis introduces the potential for misclassification bias. The generalizability of the results may be limited by the racial and geographic characteristics of the NHANES dataset, which primarily represents the U.S. population. Although WWI appears promising as a risk assessment tool, more research is needed to refine its specificity and sensitivity for COPD and other health outcomes. Prospective cohort studies and interventional trials are needed to determine optimal WWI cutoff values and to evaluate whether targeted interventions based on WWI can effectively reduce COPD risk and improve disease outcomes.
Conclusions
Weight-adjusted waist index was positively associated with COPD risk. As a measure of central obesity, WWI provides more detailed information on fat distribution and may serve as an independent predictor of COPD. These results suggest that WWI could be included in routine clinical assessments to help identify individuals at risk of COPD and to inform targeted weight management programs aimed at reducing central obesity. Such programs should support individuals in reducing central obesity through healthier lifestyle choices, such as improved diet and increased physical activity. These changes could lower the risk of COPD and improve lung health.
Public health campaigns should raise awareness of how central obesity affects breathing. This approach could encourage early prevention. Clinicians can use WWI to identify individuals who may be at higher risk, allowing for personalized advice and interventions to reduce COPD risk.
To make WWI more useful in preventing and managing COPD, more research is needed. Scientists should identify the optimal WWI threshold for risk identification and examine how interventions targeting central obesity affect COPD progression. In addition, further studies are required to determine whether combining WWI with lung function tests and other health markers can improve early detection. These findings could inform better health policies and treatments, leading to more effective care for at-risk individuals.
Supplementary data
The supplementary materials are available at https://doi.org/10.5281/zenodo.15468164. The package contains the following files:
Supplementary Table 1. Results of normality test (Shapiro–Wilk test) for WW1–WW4.
Supplementary Table 2. Results of homogeneity of variance test (Levene’s test, center = median).
Data Availability Statement
The datasets supporting the findings of the current study are openly available in Zenodo at https://doi.org/10.5281/zenodo.15252338.
Consent for publication
Not applicable.
Use of AI and AI-assisted technologies
Not applicable.
.jpg)