Abstract
Background. Percutaneous renal biopsy (PRB) is the gold standard for diagnosing nephropathies but, despite being generally safe, it carries the risk of hemorrhagic complications, particularly perirenal hematomas (PHs). Ultrasound, although commonly used, tends to underestimate hematoma volumes, whereas computed tomography (CT) accurately measures volumes but poses radiation concerns and often requires contrast media. Magnetic resonance imaging (MRI), free of these risks, offers high tissue resolution but remains underutilized for PH evaluation post-PRB.
Objectives. To evaluate the utility of MRI-based segmentation techniques for accurately quantifying PH volumes after PRB, as a complementary imaging modality to ultrasound and CT.
Materials and methods. We retrospectively analyzed MRI data from 85 patients who underwent PRB between July 2020 and May 2024. MRI-derived PH volumes were measured using manual segmentation. Clinical data were extracted from patient records, and the results were compared with data from a previous CT-based study.
Results. Perirenal hematoma was detected in 63 patients (74.1%) with a median volume of 26.2 mL (interquartile range (IQR): 7.2–59.3 mL), slightly smaller than CT-derived volumes (median: 38 mL, IQR: 18–85 mL). Using Spearman’s rank correlation coefficient (rs), we found that serum creatinine (Cr; rs = 0.299, p = 0.039) and systolic blood pressure (SBP; rs = 0.333, p = 0.017) correlated positively with PH volume, while hemoglobin levels showed a negative correlation (rs = −0.322, p = 0.021). Hemodialysis was associated with larger PHs (odds ratio (OR) = 4.59, 95% confidence interval (95% CI): 1.20–17.58, p = 0.026); however, this finding is based on a model with modest predictive performance and requires further validation.
Conclusions. Although its routine use may be limited, MRI could serve as a complementary tool for the detailed evaluation of PHs, offering a radiation-free and contrast media-free alternative to CT in clinical scenarios where immediate decision-making is not critical.
Key words: image segmentation, perirenal hematoma, kidney magnetic resonance imaging, percutaneous renal biopsy, post-biopsy bleeding complications
Background
Percutaneous renal biopsy (PRB) is recognized as the gold standard for diagnosing a wide range of renal diseases and is generally considered a safe procedure.1, 2, 3, 4 However, it is not without risks, including complications such as macrohematuria, perirenal hematoma (PH), infection, the formation of arteriovenous fistulas, and, in rare cases, severe outcomes such as nephrectomy, the need for blood transfusions or interventional procedures, or even death.4, 5, 6
Hemorrhagic complications are the most common adverse events following PRB, PHs being the most frequently reported.4, 6, 7 The reported incidence of PH varies widely,5 ranging from as low as 1.7%8 to 11% in a large meta-analysis by Poggio et al.,6 and up to 86.1% in studies that employed systematic imaging with more liberal diagnostic criteria.5, 7, 9 Most studies rely on ultrasound imaging, but there is significant heterogeneity in criteria for defining and measuring PH size in ultrasound-based research, typically measured as a PH thickness.3, 6, 10 This variability, combined with the limitations of ultrasound in assessing the size of irregularly shaped PHs – which it often struggles to measure accurately6, 11, 12 – may contribute to the underdiagnosis of PHs.4, 12
Having researched the literature, we identified very few studies using computed tomography (CT).11, 13, 14, 15, 16 Four earlier attempts, particularly in the 1980s, reported higher detection rates of PHs, with some studies noting incidences as high as 90.9%.13, 14, 15, 16 The most recent study by Chikamatsu et al.11 quantified PH volume using contrast-enhanced CT and correlated it with clinical factors. Some authors argue that patients undergoing PRB should be monitored clinically rather than subjected to systematic imaging for PH, as such screening may overestimate its incidence.2, 3, 5 This perspective likely explains the limited use of cross-sectional imaging modalities in post-PRB PH monitoring.
Given the above, the role of magnetic resonance imaging (MRI) in assessing post-PRB complications remains underexplored. With its high soft-tissue contrast,12, 17 MRI has the potential to effectively evaluate PHs without the need for contrast media. However, its clinical use has been limited by availability and scan time.12, 17, 18, 19 We found no studies in the available literature specifically examining the use of MRI for the evaluation of PHs after PRB.
Objectives
Consequently, this study aimed to investigate the utility of MRI for detecting post-PRB PHs. By integrating image segmentation techniques to quantify PH volume, we sought to provide precise and comprehensive insights into post-PRB PHs. We also aimed to assess the potential of MRI for these indications in comparison with CT.
Materials and methods
This retrospective study was conducted according to the guidelines of the Declaration of Helsinki and was approved by the Bioethical Committee of the Medical University of Lodz, Poland (approval No. RNN/174/24/KE issued on July 9, 2024).
Patient selection
All patients in this study were hospitalized in Norbert Barlicki Memorial Teaching Hospital No. 1, Medical University of Lodz, with PRBs and imaging performed in the Radiology Department. While most had native kidneys, 10 were renal transplant recipients.
Patients were eligible for inclusion if they were hospitalized in our institution, underwent PRB and had a kidney MRI performed within 36–48 h following the PRB, as, according to many authors, most PRB complications occur within the first 24 h.3, 4, 8, 11, 20, 21, 22, 23 However, a too short observation period might lead to complications being overlooked.4, 23 Exclusion criteria included lack of informed consent, incomplete documentation, unavailable or poor-quality images, MRI performed outside the study protocol (i.e., not on the day following PRB), and known preexisting perirenal fluid collections. Based on these criteria, 85 subjects were enrolled.
Renal biopsy
The PRBs were performed as a routine method for diagnosing nephropathy. Prior to the PRB assessment of vital signs, a set of laboratory tests, including coagulation parameters, was performed. Antiplatelet agents (aspirin) and direct oral anticoagulants were discontinued 5 days prior to PRB, and low-molecular-weight heparin was stopped 24 h before the procedure, in accordance with our institutional practice. Patients undergoing hemodialysis (HD) received dialysis 1 day before PRB, with heparin used during the session. In cases of thrombocytopenia, fresh frozen plasma was administered prior to the procedure. Written informed consent was obtained from all participants, who were fully informed about the procedure and cooperated satisfactorily.
Between July 2020 and May 2024, a radiologist with over 10 years of experience in ultrasound and ultrasound-guided PRB performed all PRBs under ultrasound guidance (GE Logiq 7 system; GE Healthcare, Milwaukee, USA; convex 4C probe; standard biopsy attachment). A Bard Magnum biopsy device (Bard, Covington, USA) equipped with a 16-gauge cutting needle was used for every case.
The goal was to obtain 3 tissue samples from each patient, requiring 4 needle passes in most cases. If the samples were deemed insufficient based on the immediate assessment by the performing radiologist, a 4th puncture was carried out. Importantly, no cases involved more than 4 needle passes in our practice.
Following the PRB, manual compression was applied, and patients were instructed to maintain 24 h of bed rest, including the first 4 h in the prone position. Clinical monitoring was conducted according to standard post-PRB care practices. Laboratory tests were conducted later the same day in the afternoon and were repeated 24 h after the PRB.
MRI images acquisition and analysis
Magnetic resonance imaging was performed within 36–48 h following the PRB using a 3T scanner (Siemens Magnetom Vida; Siemens AG, Munich, Germany) equipped with an 18-channel body coil. The protocol included unenhanced sequences such as T2-weighted Half-Fourier Acquisition Single-shot Turbo spin Echo imaging with fat saturation (T2W HASTE FS) and T1-weighted (T1W) Dixon imaging (in-phase, out-of-phase, fat-only, and water-only images).
The MRI image analyses were conducted retrospectively to quantify the PH volume. Manual segmentation was performed using the Exhibeon3 DICOM viewer (Pixel Technology, Łódź, Poland), with the two-dimensional smart brush tool applied to T1W Dixon water-only images in the coronal plane. These images were chosen for their superior ability to delineate fat tissue and blood products. Fluid collections not consistent with blood were excluded.
All segmentations, as well as their assessment and classification, were independently performed by 2 radiologists based on morphological characteristics and signal intensities consistent with the expected appearance of blood products in acute or early subacute stages on different MRI sequences.12, 19 In cases of disagreement, a 3rd experienced radiologist reviewed the images to ensure consensus. Representative examples are shown in Figure 1 and Figure 2.
Clinical data
Clinical data, laboratory test results from the day before and the day after the PRB, as well as histological diagnoses, were retrieved from patient records. The estimated glomerular filtration rate (eGFR) was calculated using the Chronic Kidney Disease Epidemiology Collaboration (CKD-EPI) formula.24 Nadler’s formula25 was used to calculate estimated circulating blood volume (ECBV):
ECBV = [mL] = 366.9 × height [m]3 + 32.19 × weight [kg] + 604.1 for males
and
ECBV = [mL] =356.1 × height [m]3 + 33.08 × weight [kg] + 183.3 for females.
Comparison to CT
To enhance our analysis and provide a comparative perspective, the data from Chikamatsu et al.11 was used for evaluating CT against MRI in this context. This allowed for a comparison of the 2 imaging modalities in assessing post-PRB complications, particularly the quantification of PHs volumes. Comprehensive literature research revealed no other contemporary studies analyzing CT as a method for quantification of post-PRB PHs.
Statistical analyses
After analyzing the baseline characteristics, the study cohort was divided into 2 subgroups: patients with PHs and those without. These groups were compared; however, only the subgroup with PHs was included in the subsequent statistical analyses. The 3rd tertile of PH volume – representing large bleeding volumes – was determined according to the methodology described by Chikamatsu et al.,11 and this definition of “large PH” was used in the further evaluation.
The Shapiro–Wilk test was used to assess the normality of data distribution. Normally distributed data were presented as mean ± standard deviation (SD), while nonparametric data were reported as median and quartile range (IQR). Comparisons between groups were performed using the two-tailed Student’s t-test for parametric data and the Mann–Whitney U test for nonparametric data. Due to the small sample sizes in most subgroups, Fisher’s exact test was employed to compare categorical variables. Kruskal–Wallis test was used to compare PH volumes in mL across different histologic types of renal diseases.
Pearson’s and Spearman’s correlation coefficients (r and rs, respectively) were calculated for normally and non-normally distributed data.
Multivariate logistic regression analysis was conducted to evaluate predictors associated with PH volume, specifically aiming to identify factors contributing to large PHs, defined as values in the upper tertile. The model included both continuous and categorical predictors. Continuous variables were standardized prior to model fitting. Assumptions of logistic regression were assessed: linearity between continuous predictors and the logit was tested using the Box–Tidwell test, and appropriate transformations were applied when this assumption was violated. Multicollinearity was evaluated using variance inflation factors (VIF) and tolerance values. Influential observations were identified by examining Cook’s distances; cases exceeding the 4/n (with the sample size of 4) threshold were considered highly influential.
Statistical significance was set at p < 0.05, and missing data were handled by omission. All statistical analyses were performed using IBM SPSS v. 27 (IBM Corp., Armonk, USA).
Results
The study cohort comprised 85 white adult subjects (47 males (55.3%) and 38 females (44.7%); median age 57 years; IQR: 42–64; minimum 19; maximum 82). Of these, 75 had native kidneys and 10 had renal transplants. Magnetic resonance imaging detected PH in 63 (74.1%; 56 natives, 7 transplants) and no PH in 22 (25.9%) subjects. Characteristics of the study cohort against the CT data11 are presented in Table 1. Comparison between subgroups with and without PH is shown in Table 2.
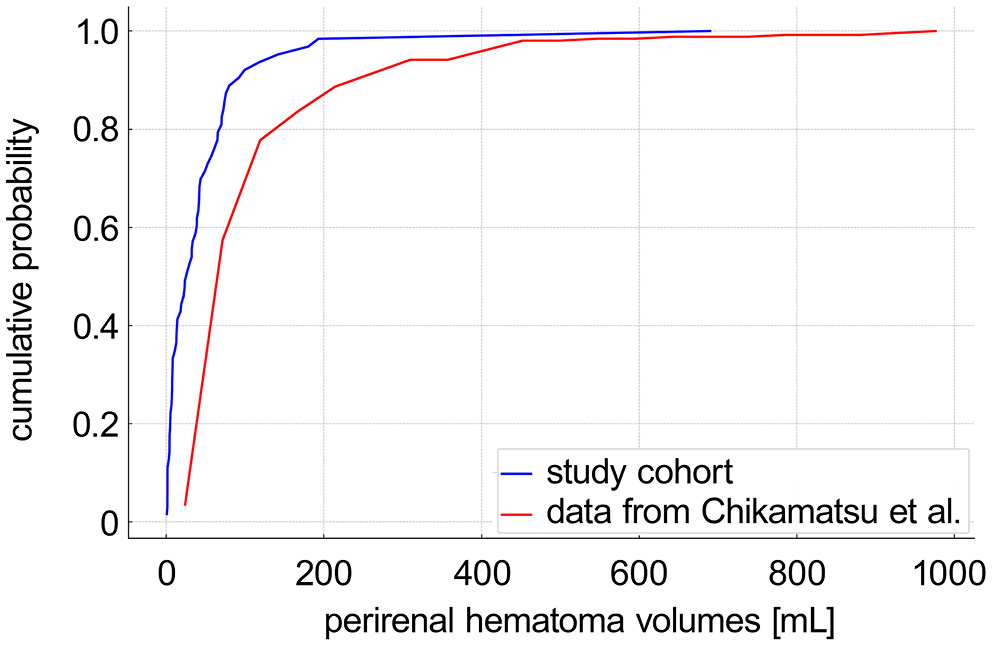
The median PH volume was 26.2 mL (IQR: 7.2–59.3), n = 5 (8%) exceeded 100 mL; outliers reached 690 mL, and the smallest observed PH was 0.7 mL. Figure 3 and Figure 4 depict the PH volume distribution (non-normal, p < 0.001).
Spearman correlation coefficients are presented in Table 3, indicating that the predictors with significant positive correlations were the pre-PRB serum creatinine level (Cr; rs = 0.299, p = 0.039) and systolic blood pressure (SBP) (rs = 0.333, p = 0.017). The only predictor with a significant negative correlation was pre-PRB hemoglobin (Hb) level (rs = −0.322, p = 0.021)
Volumes >41.8 mL (n = 21) constituted the 3rd tertile, whereas others (n = 42) were in the first 2 tertiles. Table 4 summarizes the bleeding complications observed in both the study cohort and the CT data.11 Table 5 compares 3rd tertiles from this study and from Chikamatsu et al.11
No significant differences were observed across histological types with respect to the presence (H (11, 85) = 7.43, p = 0.764) or volume in mL (H (10, 63) = 13.50, p = 0.262) of PH.
Due to the nonlinear relationship between eGFR and the logit (Supplementary Table 1), eGFR was modeled as a second-order polynomial (eGFR and eGFR2); alternative transformations (e.g., logarithmic, square root) were tested, but the quadratic model provided the best fit. No issues with multicollinearity were observed, as confirmed by VIF and tolerance values in Supplementary Table 2. A small number of influential cases with Cook’s distance values exceeding the 4/n threshold (where n denotes the sample size) were identified and temporarily excluded from analysis; however, their removal did not significantly alter the model estimates, and they were therefore retained in the final models (Supplementary Table 3).
Due to the limited size of the study cohort, we opted for 2-variable models. Estimated glomerular filtration rate was included as a core variable in all models due to its established clinical relevance as a marker of renal function.24 The only multivariate logistic regression model to identify a statistically significant predictor of large PH included both eGFR and HD, with HD emerging as significant (odds ratio (OR) = 4.59, 95% confidence interval (95% CI): 1.20–17.58, p = 0.026). The model yielded an area under the receiver operating characteristic (ROC) curve (AUC) of 0.634 and a Nagelkerke pseudo-R2 of 0.155. Further model details are provided in Table 6. Five additional 2-variable models, each including eGFR and 1 other predictor (age, sex, SBP, anticoagulation status, or more than 3 needle passes), are presented in Supplementary Tables 4–8; none of them showed statistically significant associations.
Major clinical complications were limited to red blood cell transfusions, which occurred in 3 patients (3.5%) within the 1st 24 h after PRB: 2 patients (3.2%) in the subgroup with PH and 1 patient (0.5%) in the subgroup without PH. We also observed gross hematuria in 12 subjects. No other major complications were noted. Outlier cases generally showed markedly elevated Cr and reduced eGFR. The largest PH (690 mL) was observed in a 70-year-old male with membranous nephropathy and kidney failure (Cr 5.1 mg/dL, eGFR 12 mL/min/1.73 m2, pre-PRB Hb 8.5 g/dL decreasing to 7.3 g/dL). No additional risk factors were identified in this case, which was managed with red blood cell transfusion. However, another subject transfused within 24 h had a comparatively small PH volume of 18 mL.
Discussion
Our study revealed a PH prevalence of 74.1%, aligning with findings from the past CT-based studies13, 14, 15, 16 and exceeding the rates reported in ultrasound-based studies, such as the 11% observed in a large meta-analysis by Poggio et al.6 Remarkably, we found no significant differences in demographic or clinical data between subjects with and without PH. We hypothesize that this may stem from the superior sensitivity of MRI in detecting very small PHs (e.g., 0.7 mL).
Our findings showed notable similarities to those of Chikamatsu et al.,11 particularly regarding PH volumes, though our results indicated slightly smaller values. Specifically, the median PH volume in our study was 26.2 mL (IQR: 7.2–59.3), compared to 38 mL (IQR: 18–85) in their analysis. It is plausible that the slightly smaller PH volumes observed in our study may be attributed not only to different imaging modality of PH detection, but also to the absence of cases involving more than 4 punctures, a factor identified by Chikamatsu et al. as a significant predictor of larger PH volumes.11 Notably, our cohort included only subjects with 3 or 4 punctures, and none exceeding 4. Consequently, our multivariate logistic regression analysis found no significant association between needle passes and PH volume (p = 0.161), which is consistent with those of some other studies.5, 20, 26, 27 Additionally, we observed less pronounced changes in Hb levels following PRB (0.05 ±0.9 vs 0.4 ±0.9) and fewer complications, including lower blood transfusion rates and no need for interventions. These smaller changes in Hb levels may partly reflect the ECBV in our cohort, potentially linked to demographic differences between the study populations.
We demonstrated a positive correlation between Cr and PH (rs = 0.299, p = 0.039), consistent with findings reported by other authors.2, 5, 23, 28, 29 A positive correlation was also observed between SBP and PH (rs = 0.333, p = 0.017), also in line with prior literature.26, 28, 29 Conversely, a significant negative correlation was found between Hb and PH (rs = −0.322, p = 0.021). This observation is supported by the findings of both Lim et al. and Palsson et al., who independently identified low Hb levels prior to PRB as a significant predictor of major bleeding complications and the need for transfusion following renal biopsy.30, 31
Furthermore, our analysis underscored that HD treatment may be associated with an elevated risk of larger PH volume (OR = 4.59, 95% CI: 1.20–17.58, p = 0.026). However, the relatively small number of HD patients (n = 18) may have limited both the precision of the estimate and the overall discriminatory ability of the model, which demonstrated a modest AUC of 0.634 and very low explanatory power, as indicated by a Nagelkerke pseudo-R2 of 0.155. This value of the Nagelkerke pseudo-R2 indicates that the model explained approx. 15.5% of the variance in PH volume, suggesting that additional relevant variables likely contribute to the outcome and were not captured in the current analysis. Nevertheless, the observed association aligns with the general understanding of impaired renal function as a predictor of post-PRB bleeding complications,5, 6, 9, 28 yet studies explicitly examining the direct link between HD and PH risk remain limited. For instance, Simard-Meilleur et al. also identified HD as a significant risk factor of PH, while, similarly to our findings, they did not find eGFR to be an independent predictor.20 In our study, a potential contributing factor in this context may be the use of heparin during the HD session performed 1 day prior to the PRB. Altogether, these findings highlight the need for further research to clarify the role of HD in post-PRB hemorrhagic risk, particularly in larger patient cohorts to improve the robustness and generalizability of the findings.
Similar to CT-based study,11 we observed no significant differences in hemorrhage volumes across histologic types. This finding contrasts with some reports,26, 27 yet aligns with others,31 reflecting the variability present in the literature. Several demographic and clinical predictors have been proposed by different authors, including age – either younger1, 27, 32 or older2, 5 – and female gender.27, 32 However, the significance of these factors has varied across studies, likely due to differences in methodology, patient populations and clinical settings. In our analysis, none of these variables reached statistical significance.
Despite its advantages, MRI has several limitations as an imaging modality. It is not only less widely available than CT,19, 33 but its use is also restricted in patients with certain metallic implants or devices, such as pacemakers.12 Additionally, MRI requires significantly more time for image acquisition.12, 17, 18, 19 In our study, the average MRI scan duration was approx. 19 min – much longer than a CT scan, which takes only seconds for a single phase.12 While CT in the context of acute renal hemorrhage should be multiphasic,12, 34 it is still much faster than MRI, which is also more prone to motion artifacts due to the extended acquisition time. In cases of active bleeding MRI can delay patient management,12 which is critical when urgent interventional treatment may be required.34 Another significant limitation of MRI in this context is the variable appearance of blood products depending on their age, potentially leading to ambiguous findings,12, 19 which require time and expertise to interpret accurately.
Many authors2, 3, 5, 6 emphasize that patients post-PRB should be primarily monitored through clinical observation, including vital signs, presence of hematuria and laboratory parameters such as Hb levels. Although clinical observation remains the cornerstone of post-PRB monitoring, several studies have demonstrated that it may fail to detect subclinical PHs, which can be identified only through imaging.16, 21, 23 The stability of the hemodynamic status of the patient is a key determinant in selecting the appropriate imaging modality and further management.12, 35 Ultrasound should serve as the first-line imaging modality for the rapid initial detection of potential hemorrhage,34 although it has limited sensitivity for identifying hemorrhage in the retroperitoneal space.12, 34 If active bleeding is suspected, contrast-enhanced CT should be employed as the imaging modality of choice12 to confirm the diagnosis and guide further interventional planning.12, 34
From this perspective, although its routine use may be limited,34 MRI may serve as a valuable complementary tool for comprehensive assessment in appropriate clinical scenarios. Magnetic resonance imaging may be better suited for detailed evaluation in subacute circumstances, particularly when prior imaging yields inconclusive results,12, 19 for distinguishing between acute and chronic blood deposits12, 19 or for detection of potential underlying hemorrhage causes such as neoplasms.12 In contrast, CT remains the preferred modality when rapid decision-making is essential.12, 34, 35 Based on these considerations, a stepwise diagnostic strategy can be proposed that prioritizes modality selection according to clinical urgency, stability and information yield. As outlined in Table 7, this practical algorithm begins with clinical observation, followed by ultrasound as the first-line imaging tool. Computed tomography is employed when active bleeding is suspected and rapid interventional planning is required. Magnetic resonance imaging is reserved for stable patients requiring detailed characterization of PHs or when other modalities provide inconclusive results, particularly where avoiding contrast media or radiation is preferred.
Limitations
Several limitations of our study should be noted. It was conducted retrospectively, and the cohort was relatively small and heterogeneous, encompassing both native kidneys and renal grafts. Importantly, there was no direct comparison of imaging methods; instead, our findings were compared to literature data from the only similar study,11 which inherently limits the generalizability of our conclusions. This comparison is further complicated by cohort heterogeneity and demographic differences, affecting generalizability. The limited existing literature on cross-sectional imaging for the detection of PHs after PRB underscores the exploratory nature of our research, which we consider a pilot study. Additionally, interobserver variability in manual segmentation was not formally assessed, though all segmentations were reviewed and agreed upon by experienced radiologists to ensure reliability.
Conclusions
Our study highlights the potential of MRI in the assessment of PHs following PRB, offering precise volume quantification comparable to CT while avoiding the risks of ionizing radiation and contrast media. Although its routine use may be limited, MRI can serve as a complementary tool for detailed evaluation of PHs in clinical scenarios when immediate decision-making is not critical.
Supplementary data
The supplementary materials are available at https://doi.org/10.5281/zenodo.15600431. The package contains the following files:
Supplementary Table 1. Assessment of linearity of continuous predictors with the logit using the Box–Tidwell test.
Supplementary Table 2. Assessment of multicollinearity using tolerance and VIF in logistic regression models.
Supplementary Table 3 Assessment of influential observations in logistic regression models using Cook’s distance.
Supplementary Table 4. Multivariate logistic regression model including eGFR and age as predictors of large post-biopsy PHs.
Supplementary Table 5. Multivariate logistic regression model including eGFR and gender as predictors of large post-biopsy PHs.
Supplementary Table 6. Multivariate logistic regression model including eGFR and SBP as predictors of large post-biopsy PHs.
Supplementary Table 7. Multivariate logistic regression model including eGFR and anticoagulation as predictors of large post-biopsy OHs.
Supplementary Table 8. Multivariate logistic regression model including eGFR and number of needle passes as predictors of large post-biopsy PHs.
Data Availability Statement
The participants of this study did not give written consent for their data to be shared publicly, so due to the sensitive nature of the research, the supporting data are not available.
Consent for publication
Not applicable.
Use of AI and AI-assisted technology
Not applicable.
.jpg)
.jpg)
.jpg)