Abstract
Background. Regulatory T (Treg) cells and plasmacytoid dendritic cells (pDCs) are involved in the pathogenesis of drug rash with eosinophilia and systemic symptoms/drug-induced hypersensitivity syndrome (DRESS/DIHS).
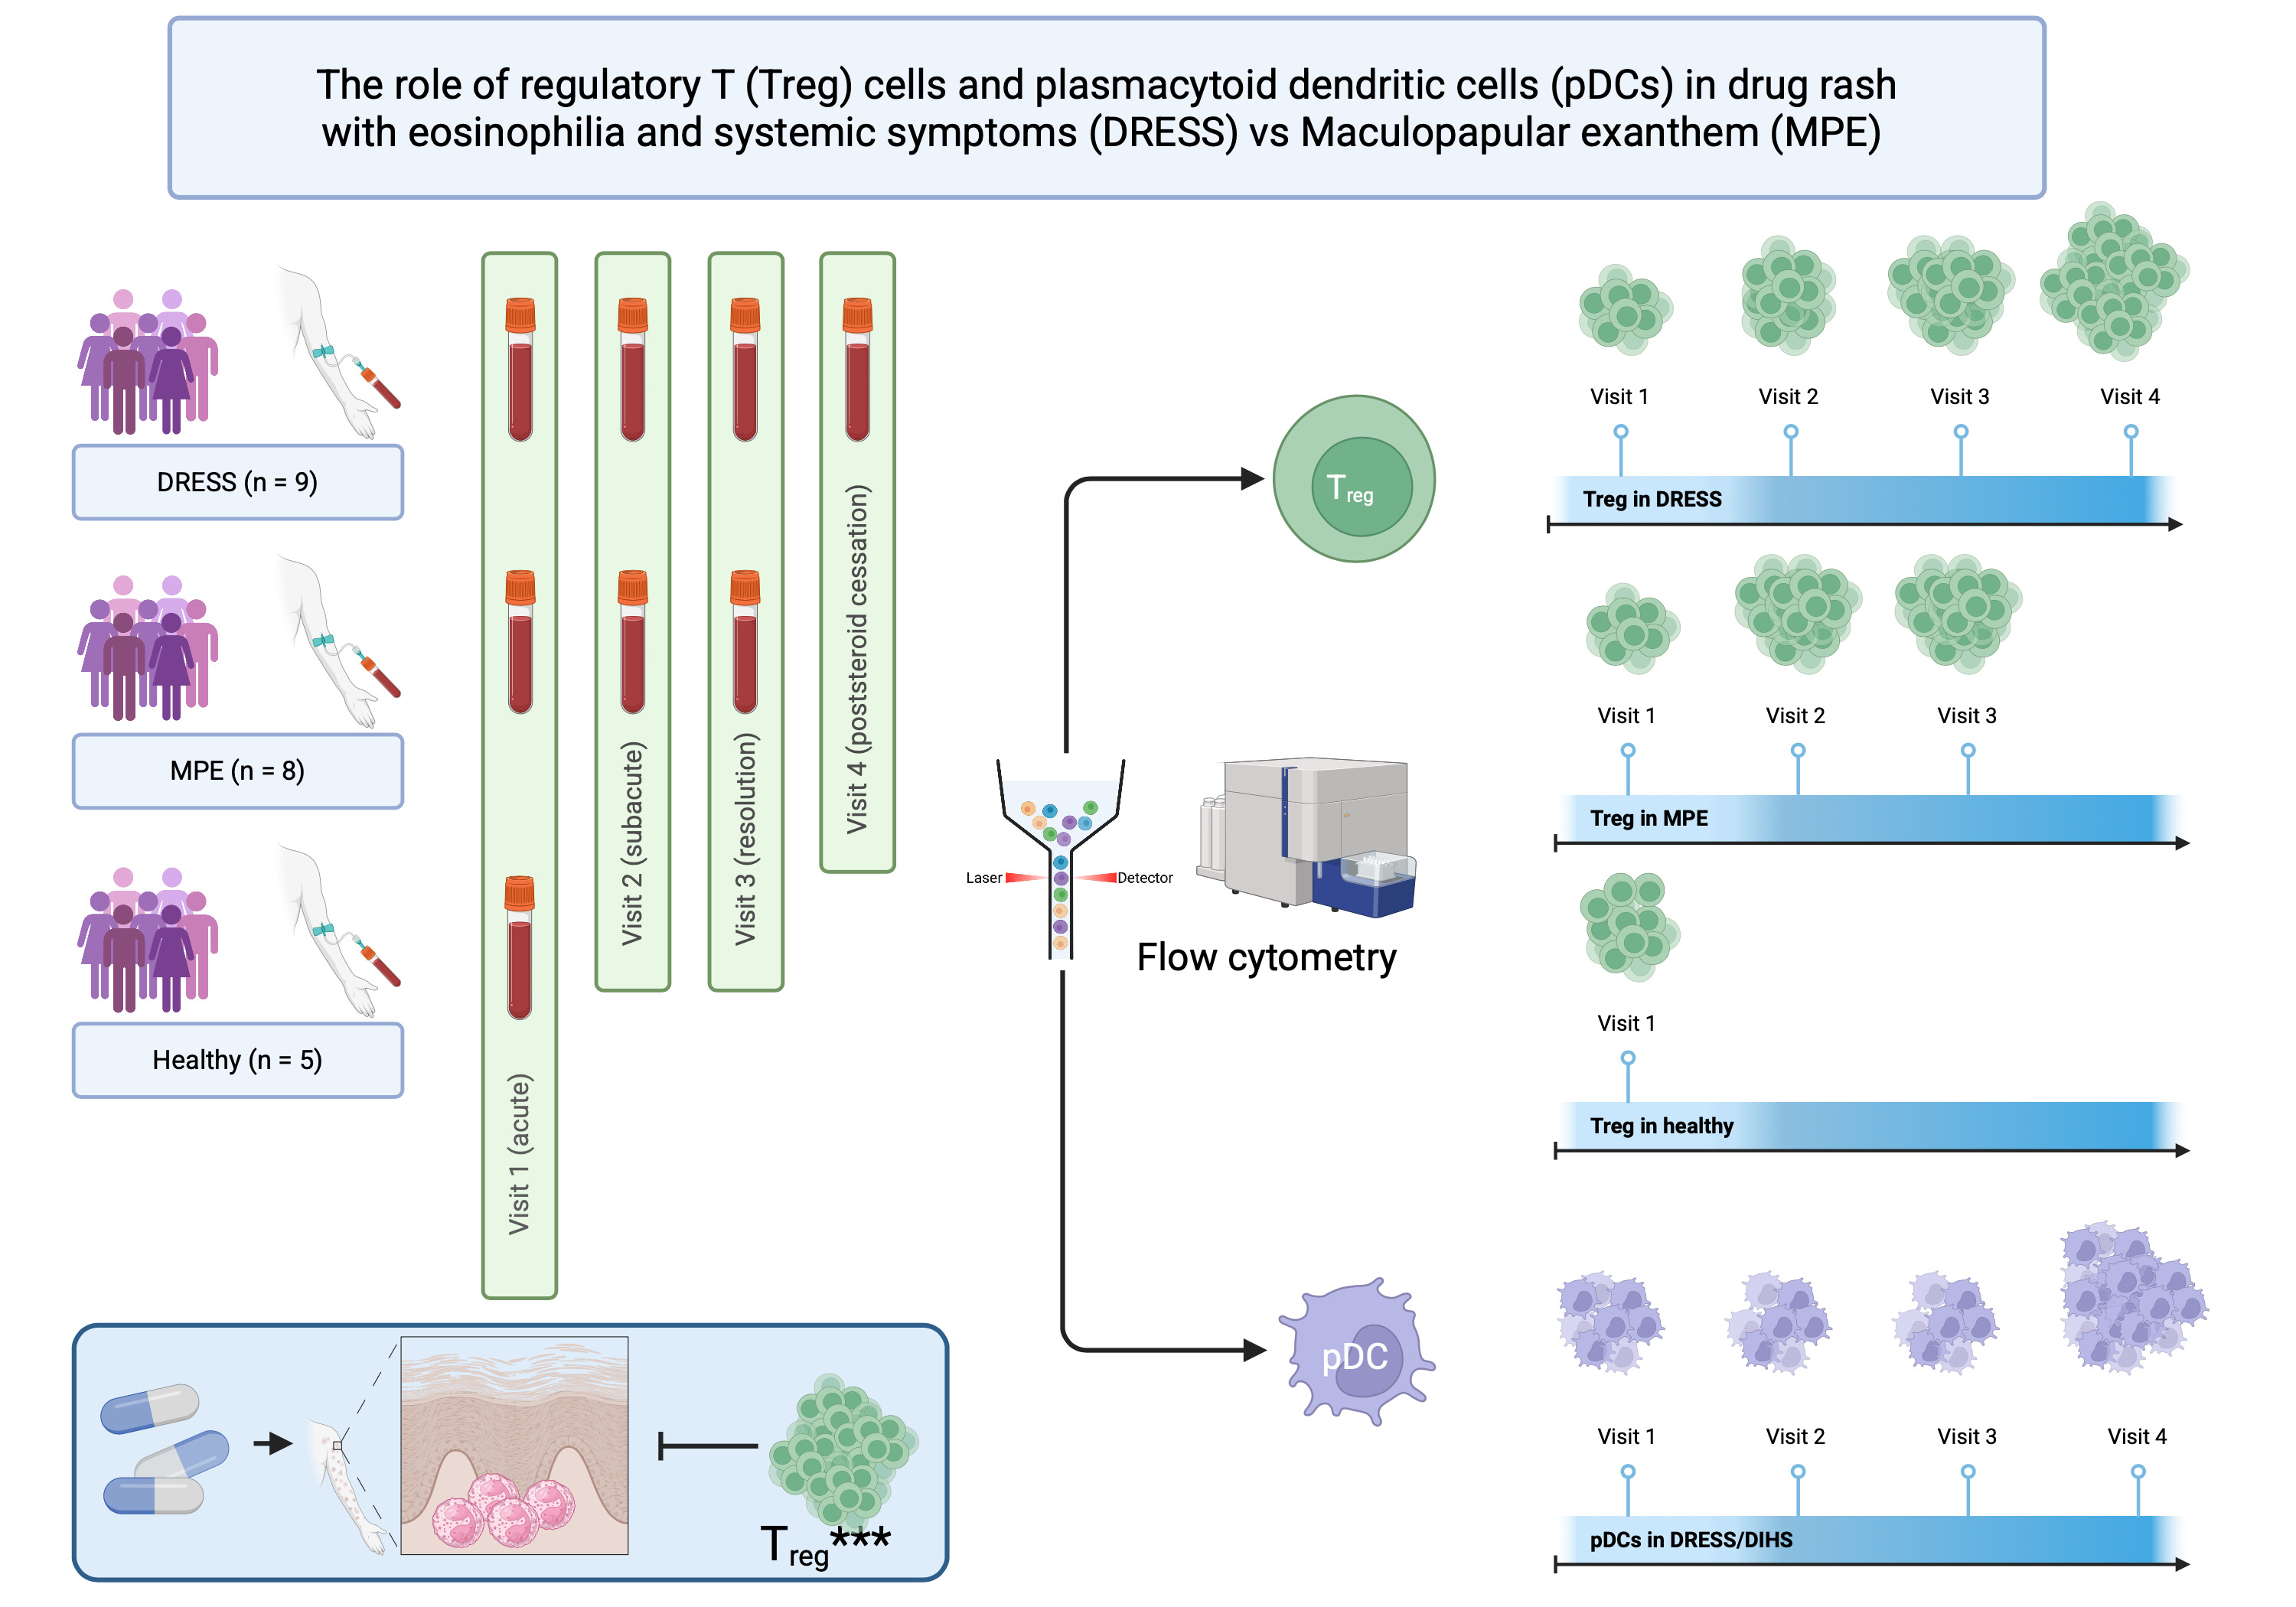
Objectives. To compare circulating Treg cells and pDCs at different stages among patients with DRESS/DIHS, patients with maculopapular drug eruption (MPE), and healthy subjects, and to assess circulating Treg cells and pDCs at post-steroid cessation in DRESS/DIHS.
Materials and methods. This was a cross-sectional study that enrolled adult patients diagnosed with DRESS/DIHS and MPE. Blood samples were obtained from the patients at the initial presentation (acute phase), 1 week later (subacute phase), during the 3rd week (resolution phase), and post-steroid cessation for DRESS/DIHS. Healthy subjects’ blood samples were also taken. Peripheral blood mononuclear cells were isolated for flow cytometry analysis.
Results. A total of 22 patients participated in this study: patients with DRESS/DIHS (n = 9), patients with MPE (n = 8), and healthy subjects (n = 5). During the acute stage of DRESS/DIHS and MPE, the mean percentage of Treg cells and pDCs significantly decreased compared to healthy subjects. However, Treg cells showed a progressive increase towards the resolution phase in both conditions, while pDCs continued to decrease towards the resolution phase. Following steroid discontinuation in DRESS/DIHS, both Treg cells and pDCs showed a progressive increase in number.
Conclusions. Treg cells and pDCs play a role in DRESS/DIHS and MPE pathogenesis, evidenced by the fluctuation in their percentages at each stage of both conditions. However, increased circulating Treg cells may crucially mitigate inflammation in both conditions.
Key words: regulatory T cells, plasmacytoid dendritic cells, drug-induced hypersensitivity syndrome, drug rash with eosinophilia and systemic symptoms, maculopapular drug eruption
Background
Drug rash with eosinophilia and systemic symptoms/drug-induced hypersensitivity syndrome (DRESS/DIHS) is a severe, delayed-type hypersensitivity reaction. It is characterized by high fever, widespread skin eruptions that are typically morbilliform but may also be pleomorphic, lymphadenopathy, hematologic abnormalities such as atypical lymphocytosis in the early stage and eosinophilia in the later stage, and multiorgan involvement, with liver enzyme elevation being the most common manifestation. Delayed diagnosis can result in significant morbidity and a mortality rate of up to 7%. The diagnosis of DRESS is established using the European RegiSCAR scoring system, which includes 7 clinical features. A score greater than 5 indicates a definite diagnosis of DRESS.1 The pathogenesis of DRESS is complex and not fully understood. However, several mechanisms have been proposed, including genetic predisposition associated with specific human leukocyte antigen alleles that affect drug metabolism, reactivation of human herpesviruses (HHVs) – particularly HHV-6, cytomegalovirus, and Epstein–Barr virus (EBV) – and dysregulation of the immune response mediated by T cells, all of which are thought to play central roles in the development of DRESS/DIHS.2
Regulatory T (Treg) cells and plasmacytoid dendritic cells (pDCs) have been reported to play a role in the pathogenesis of DRESS/DIHS. Treg cells are essential for regulating and suppressing immune responses to self-antigens, promoting peripheral tolerance, preventing autoimmunity, and limiting chronic inflammatory diseases.3, 4 A previous study showed that Treg cells expand during the acute stage of DRESS/DIHS but decrease in both number and function during the resolution phase.5 These findings suggest a prolonged onset of clinical features, HHV reactivation and the potential development of autoimmunity following recovery from DRESS/DIHS. In contrast, pDCs play a crucial role in antiviral immunity and are also involved in the development of autoimmune and inflammatory diseases.6 Previous studies demonstrated that the number of circulating pDCs decreases around the time of viral reactivation in DRESS/DIHS compared with other drug eruptions.7, 8 These findings further support the role of viral reactivation in the pathogenesis of DRESS/DIHS.
Objectives
There are limited studies investigating circulating Treg cells and pDCs in DRESS/DIHS at different time points. This study aimed to identify alterations in circulating Treg cells and pDCs at different disease stages in patients with DRESS/DIHS, patients with maculopapular drug eruption (MPE), and healthy subjects, as well as to assess circulating Treg cells and pDCs after steroid cessation in DRESS/DIHS.
Materials and methods
Study design
This was a cross-sectional study conducted from October 2019 to December 2022 at Khon Kaen University’s Srinagarind Hospital in Thailand.
Participants
Adult patients aged 18 years or older diagnosed with DRESS/DIHS and/or MPE were recruited. Patients who had received systemic steroids or immunosuppressive drugs before enrollment were excluded. DRESS/DIHS was defined according to the diagnostic criteria established by the European Registry of Severe Cutaneous Adverse Reactions (RegiSCAR) group, including fever >38.5°C, lymphadenopathy, skin rash suggestive of DRESS/DIHS, eosinophilia or atypical lymphocytosis, internal organ involvement, disease duration >15 days, and exclusion of other potential causes.2 Maculopapular drug eruption, also referred to as exanthematous drug eruption, was defined as widespread erythematous macules and papules symmetrically distributed over the trunk and extremities, without systemic symptoms or internal organ involvement.
Variables
Demographic data and baseline characteristics, including age, sex, disease onset and duration, RegiSCAR score, and culprit medication, were recorded. Medical comorbidities were also documented and classified as immune abnormalities (such as HIV infection, adult-onset immunodeficiency, and autoimmune diseases) or non-immune abnormalities. Blood samples were obtained at different stages: at the initial presentation (acute phase or visit 1), 1 week later (subacute phase or visit 2), during the 3rd week (resolution phase or visit 3), and after discontinuation of systemic steroids in patients with DRESS/DIHS (visit 4). Blood samples were also collected from 5 healthy subjects as normal controls. Patients with DRESS/DIHS received prednisolone at a dose of 0.5–1 mg/kg/day after the first blood sample was obtained. Patients with MPE were treated with topical corticosteroids and antihistamines. The percentages of Treg cells and pDCs were evaluated by flow cytometry using a BD FACSCanto™ II flow cytometer (BD Biosciences, Franklin Lakes, USA).
Peripheral blood mononuclear cells isolation
A total of 6 mL of venous whole blood was collected from each participant by venipuncture and placed into sodium heparin tubes (cat. No. 367874; BD Biosciences). The whole blood was then diluted with ×1 phosphate-buffered saline (PBS) at a 1:1 ratio. Following dilution, peripheral blood mononuclear cells were isolated using Ficoll–Paque PLUS (density = 1.077 g/mL; cat. No. 71-7167-00 AG; GE Healthcare, Chicago, USA) at a 4:3 ratio and centrifuged at 400 × g for 40 min at 20°C without braking. Subsequently, peripheral blood mononuclear cells (PBMCs) were collected into a new sterile 15 mL centrifuge tube using a sterile plastic dropper. The isolated PBMCs were gently washed twice with 7 mL of 1× PBS and centrifuged for 10 min at 22°C at 500 × g and 260 × g (for platelet removal), respectively. The supernatant was discarded, and the PBMCs were then resuspended in 1 mL of freezing medium consisting of 90% fetal bovine serum (FBS) and 10% dimethyl sulfoxide (DMSO; cat. No. A3672; PanReac AppliChem, Chicago, USA). Cryopreserved cells from all subjects were stored at −80°C until use.
Cell surface markers and intracellular cytokine staining
Isolated PBMCs were gently thawed at 37°C and then stimulated with 100 ng/mL phorbol 12-myristate 13-acetate (PMA; cat. No. P1585; Sigma-Aldrich, Burlington, USA) and 1 µg/mL ionomycin calcium salt (cat. No. I-0634; Sigma-Aldrich). Simultaneously, the cells were incubated with 3 µg/mL brefeldin A (eBioscience, San Diego, USA) at 37°C for 2 h. Subsequently, the cells were washed with R10 medium (RPMI 1640 supplemented with 10% FBS; cat. No. 31800105; Gibco, Waltham, USA) and centrifuged at 400 × g for 10 min. The stimulated PBMCs were then stained with multicolor fluorochrome-conjugated monoclonal antibodies: anti-human CD45 phycoerythrin-cyanine 7 (PE-Cy7; HI30; eBioscience), anti-human CD3 allophycocyanin-eFluor® 780 (APC-eFluor® 780; OKT3; eBioscience), anti-human CD4 eFluor® 450 (RPA-T4; eBioscience), and anti-human CD123 phycoerythrin (PE; 6H6; Abcam, Cambridge, UK). Incubation was carried out for 15 min on ice in the dark. Intracellular staining was performed sequentially after surface staining. Cells were fixed with 4% formaldehyde and permeabilized using fixation and permeabilization buffer (cat. No. 130-090-47; Miltenyi Biotec, Bergisch Gladbach, Germany) for 10 min on ice in the dark. Subsequently, the cells were stained with anti-human FoxP3 peridinin–chlorophyll–cyanine 5.5 (PerCP-Cy5.5; PCH101; eBioscience) for 30 min, followed by washing with staining buffer (×1 PBS containing 2% FBS). Finally, the samples were analyzed using a BD FACSCanto™ II flow cytometer (BD Biosciences). The analysis was performed at the Department of Microbiology, Faculty of Medicine, Khon Kaen University, Thailand.
Gating strategy
Lymphocytes were identified using forward scatter (FSC) and side scatter (SSC). Subsequently, singlet cells were identified based on forward scatter area (FSC-A) and forward scatter height (FSC-H). CD45+ expression was then gated on singlet lymphocytes. Treg cells were identified based on the expression of CD3+ and CD4+, together with intracellular FoxP3. Plasmacytoid dendritic cells were gated as CD3–CD123+ cells.
Statistical analyses
With respect to baseline characteristics, numerical variables were presented as medians with the 1st and 3rd quartiles (Q1–Q3) and the minimum–maximum range, as the number of subjects in each group was fewer than 10. Comparisons of numerical variables between 2 groups were performed using the Mann–Whitney U test, whereas differences among three groups were assessed using the Kruskal–Wallis test. Categorical variables were reported as numbers (percentages). The Fisher–Freeman–Halton test was used to assess differences in proportions among 2 or 3 groups.
For the percentages of Treg cells and pDCs, a generalized estimating equation (GEE) model with the following parameters was applied: 1) family, Gaussian; 2) link function, identity; and 3) correlation structure, exchangeable. This model was used to compare the 3 study populations (DRESS/DIHS, MPE and healthy subjects) across 4 visits (visits 1–4). In addition, a subgroup analysis according to immune status was performed for patients with DRESS/DIHS and MPE. The mean (standard deviation (SD)) percentages of Treg cells and pDCs were reported because these variables followed a normal distribution and were analyzed using a GEE model. The regression coefficient, its 95% confidence interval (95% CI), z-value, and p-value for the percentages of Treg cells and pDCs were also reported. Model adequacy was assessed by examining residual plots across the 3 study groups to evaluate the presence of systematic bias, heteroscedasticity or outliers. Statistical analyses were performed using Stata v. 18.0 (StataCorp, College Station, USA). A p < 0.05 was considered statistically significant.
Results
Baseline characteristics of the patients and healthy subjects
A total of 22 participants were included in this study: patients with DRESS/DIHS (n = 9), patients with MPE (n = 8) and healthy subjects (n = 5). The baseline characteristics of the participants are presented in Table 1. The DRESS/DIHS group differed significantly from the MPE group in terms of disease onset duration. Among the participants, 4 patients with DRESS/DIHS and 5 patients with MPE had immune abnormalities.
The percentage of Treg cells in DRESS/DIHS, with MPE and healthy subjects at different time points
The mean percentages of Treg cells in patients with DRESS/DIHS, with MPE and healthy subjects at different time points are presented in Table 2.
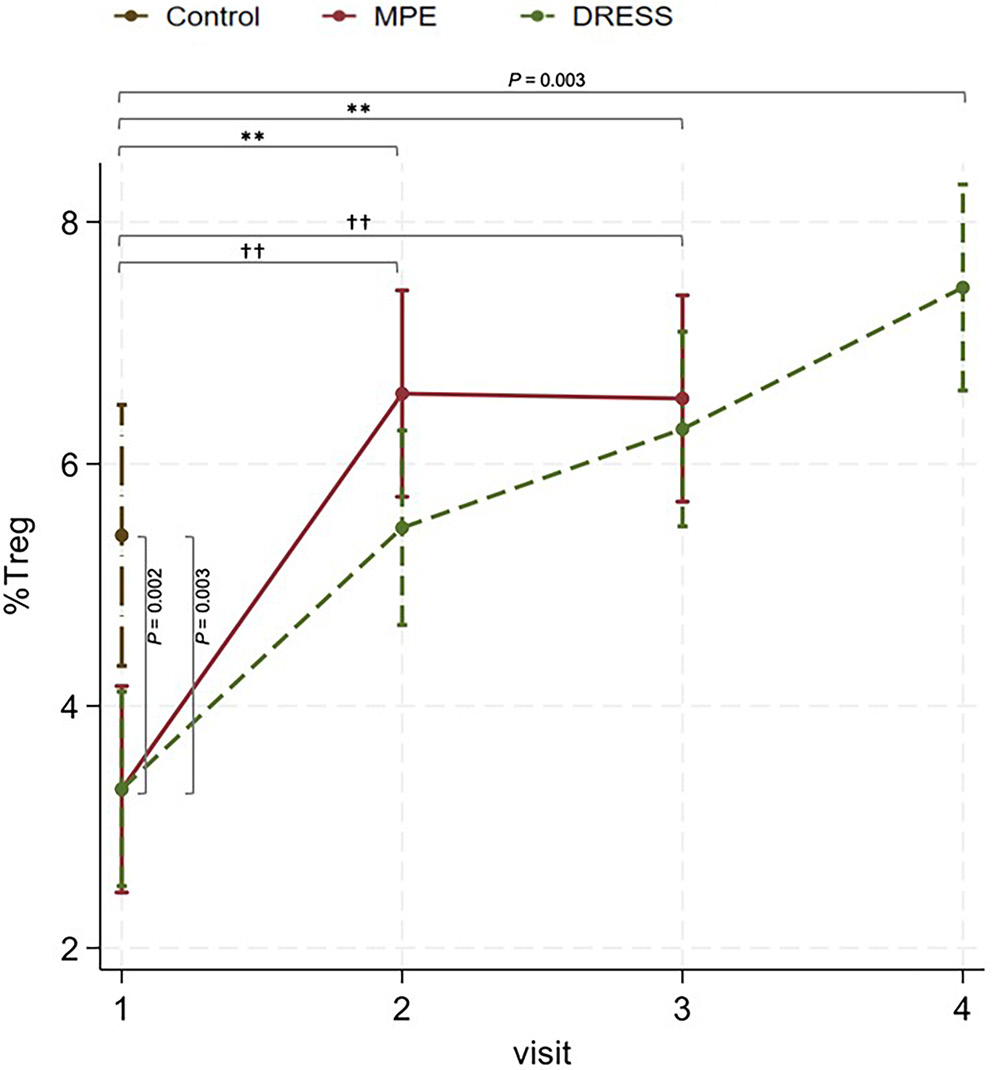
In the acute stage (visit 1), the mean percentage of Treg cells was significantly lower in DRESS/DIHS compared to healthy subjects (β = −2.10, 95% CI: −3.44 to −0.75, z = −3.05, p = 0.002) and also significantly lower in MPE compared to healthy subjects (β = −2.10, 95% CI: −3.47 to −0.72, z = −2.99, p = 0.003), as shown in Figure 1 and Table 3.
In the subacute phase (visit 2), the mean percentage of Treg cells significantly increased in DRESS/DIHS compared to the acute stage (β = 2.16, 95% CI: 0.97–3.35, z = 3.56, p < 0.001) and significantly increased in MPE compared to the acute stage (β = 3.27, 95% CI: 2.01–4.53, z = 5.09, p < 0.001).
In the resolution phase (visit 3), the mean percentage of Treg cells showed a tendency to increase in the resolution phase compared to the subacute phase in DRESS/DIHS (β = 0.82, 95% CI: −0.37 to 2.00, z = 1.35, p = 0.178). No significant difference between the subacute and the resolution phases in MPE was observed (β = −0.04, 95% CI: −1.30 to 1.22; z = −0.06, p = 0.949).
In the post-steroid cessation period in DRESS/DIHS (visit 4), the mean percentage of Treg cells showed a further increase compared to the resolution phase (β = 1.17, 95% CI: −0.05 to 2.39, z = 1.88, p = 0.060). The mean percentage of Treg cells was significantly higher after steroid discontinuation compared with healthy controls (β = 2.05, 95% CI: 0.67 to 3.42, z = 2.92, p = 0.003). No significant differences were detected between the DRESS/DIHS and MPE groups during the acute phase (β = 0.003, 95% CI: −1.17 to 1.18, z = 0.01, p = 0.996), subacute phase (β = −1.11, 95% CI: −2.28 to 0.06, z = −1.85, p = 0.064), or resolution phase (β = −0.25, 95% CI: −1.42 to 0.92, z = −0.42, p = 0.673).
The percentage of Treg cells in DRESS/DIHS and MPE with and without immune abnormalities
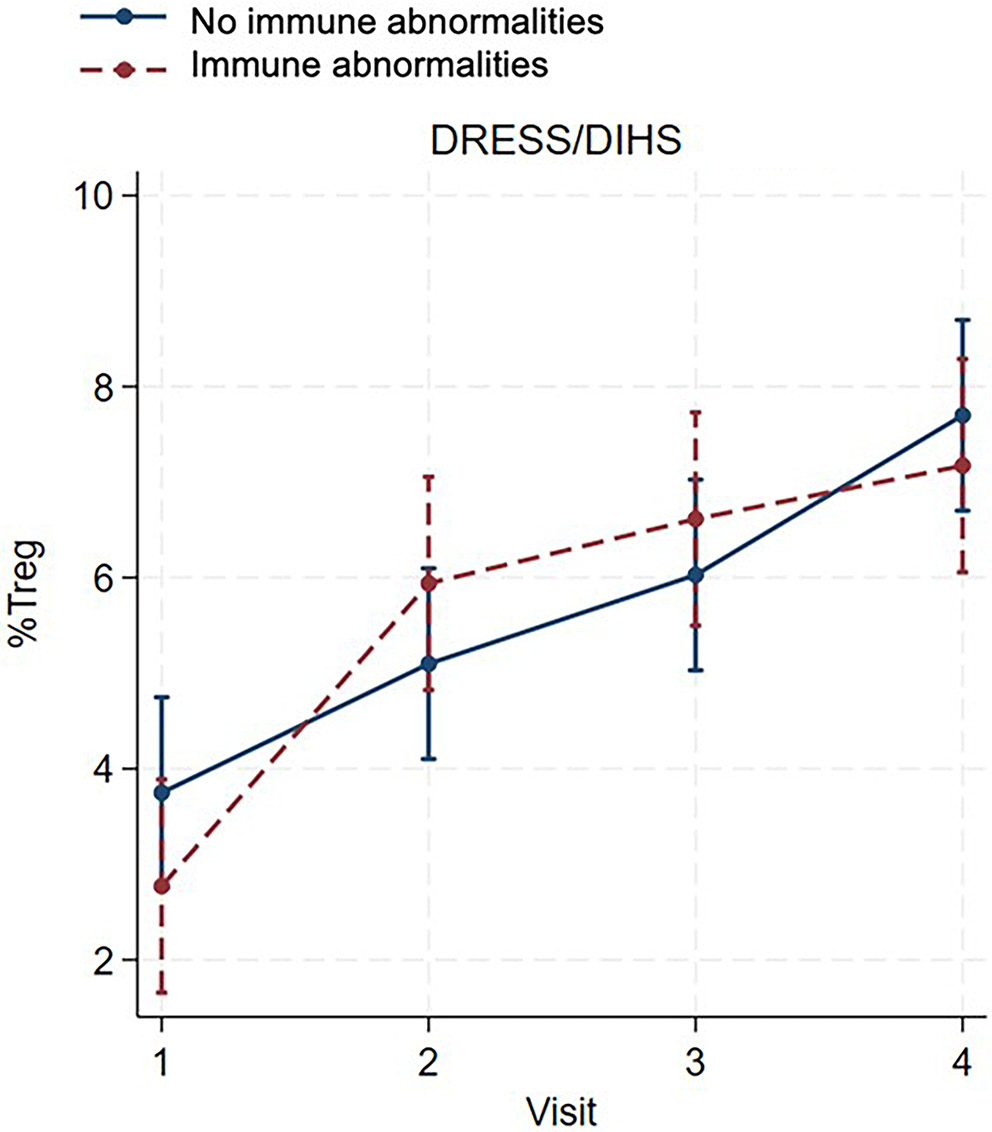
In patients with DRESS/DIHS, a consistent increase in the percentage of Treg cells was observed from visit 1 to visit 4 in both patients with and without immune abnormalities, as shown in Figure 2 and Table 4. No significant differences were observed between patients with and without immune abnormalities at any visit (visit 1: β = −0.98, 95% CI: −2.48 to 0.52, z = −1.28, p = 0.200; visit 2: β = 0.84, 95% CI: −0.66 to 2.34, z = 1.10, p = 0.271; visit 3: β = 0.59, 95% CI: −0.91 to 2.08, z = 0.77, p = 0.444; visit 4: β = −0.53, 95% CI: −2.02 to 0.97, z = −0.69, p = 0.491), as shown in Table 5.
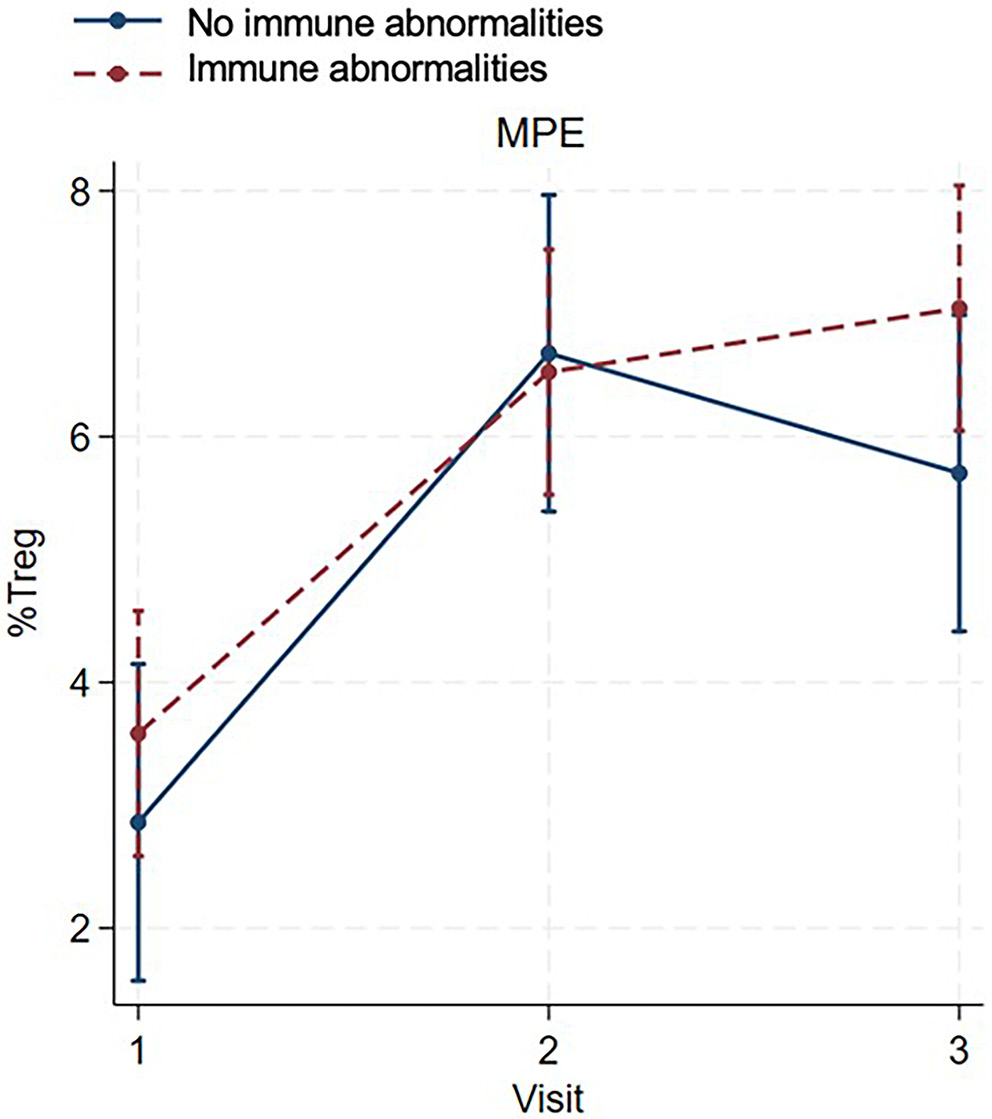
In patients with MPE, the percentage of Treg cells increased from the acute to the subacute phase in both patients with and without immune abnormalities (Figure 3, Table 4). During the resolution phase, the percentage of Treg cells increased in patients with immune abnormalities but decreased in those without immune abnormalities; however, this difference did not reach statistical significance (β = 1.34, 95% CI: −0.29 to 2.97, z = 1.61, p = 0.106; Figure 3, Table 5).
The percentage of pDCs in DRESS/DIHS, MPE, and healthy subjects at different time points
The mean percentages of pDCs in patients with DRESS/DIHS, with MPE, and in healthy subjects at different time points are shown in Table 2.
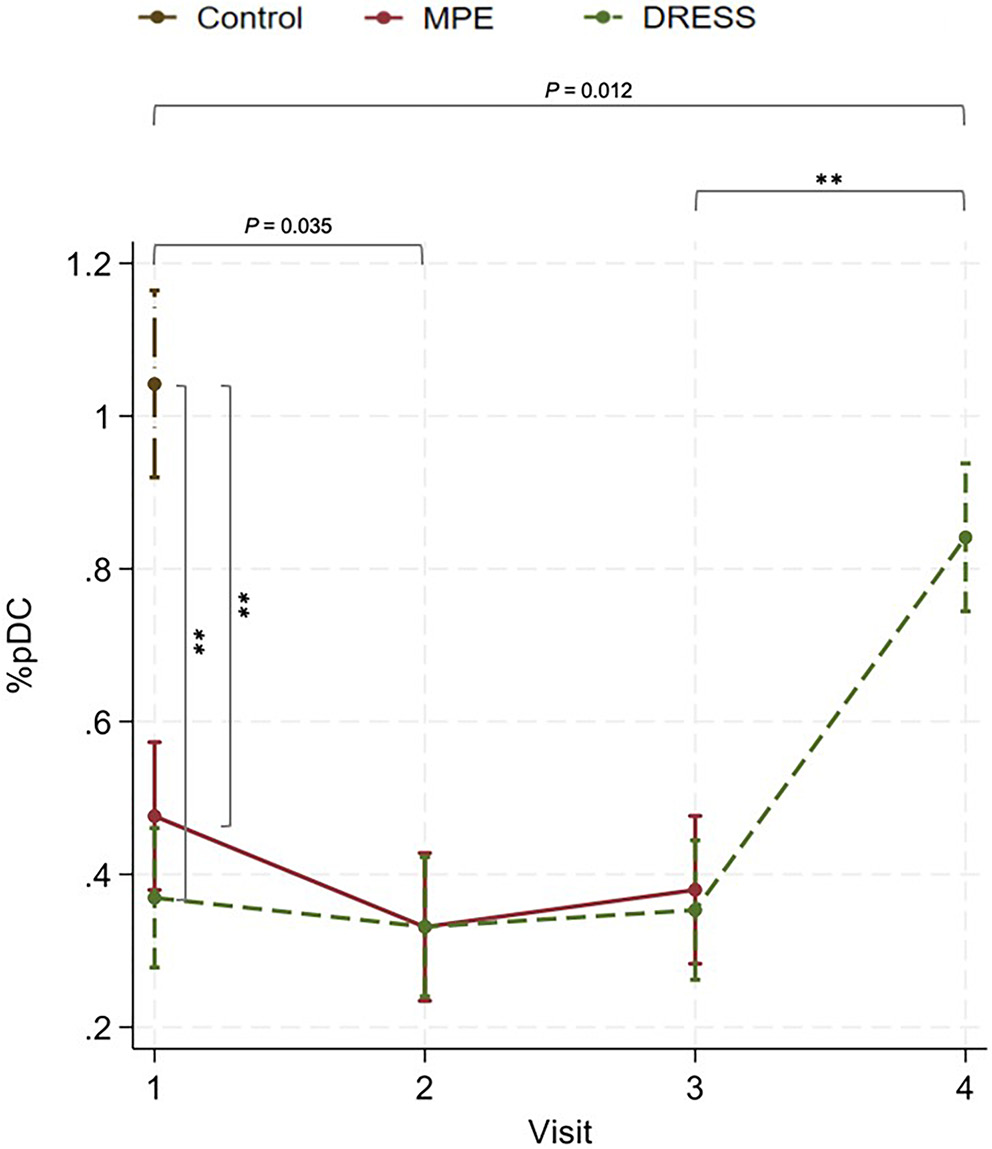
In the acute stage, the mean percentage of pDCs was significantly lower in patients with DRESS/DIHS than in healthy subjects (β = −0.67, 95% CI: −0.83 to −0.52, z = −8.64, p < 0.001) and was also significantly lower in patients with MPE than in healthy subjects (β = −0.66, 95% CI: −0.72 to −0.41, z = −7.11, p < 0.001), as shown in Figure 4 and Table 6.
In the subacute phase, the mean percentage of pDCs was significantly lower than in the acute stage in patients with MPE (β = −0.15, 95% CI: −0.28 to −0.01, z = −2.11, p = 0.035), as shown in Table 6. However, no significant difference was detected in the DRESS/DIHS group (β = −0.04, 95% CI: −0.16 to 0.09, z = −0.58, p = 0.559).
In the resolution phase, the mean percentage of pDCs showed a tendency to increase compared with the subacute phase in both DRESS/DIHS and MPE (β = 0.02, 95% CI: −0.11 to 0.15, z = 0.33, p = 0.738 and β = 0.05, 95% CI: −0.09 to 0.18, z = 0.71, p = 0.480, respectively; Table 6).
In the post-steroid cessation period in DRESS/DIHS, the mean percentage of pDCs was significantly higher after discontinuation of systemic steroids compared with the resolution phase (β = 0.49, 95% CI: 0.36 to 0.62, z = 7.30, p < 0.001). However, the mean percentage of pDCs remained significantly lower after discontinuation of systemic steroids compared with healthy controls (β = −0.20, 95% CI: −0.36 to −0.04, z = −2.52, p = 0.012). No significant differences in the percentages of pDCs between the DRESS/DIHS and MPE groups were detected in the acute (β = −0.11, 95% CI: −0.24 to 0.03, z = −1.58, p = 0.115), subacute (β = −0.0003, 95% CI: −0.13 to 0.13, z = 0.00, p = 0.996), or resolution phases (β = −0.03, 95% CI: −0.16 to 0.11, z = −0.39, p = 0.696).
The percentage of pDCs in DRESS/DIHS and MPE with and without immune abnormalities
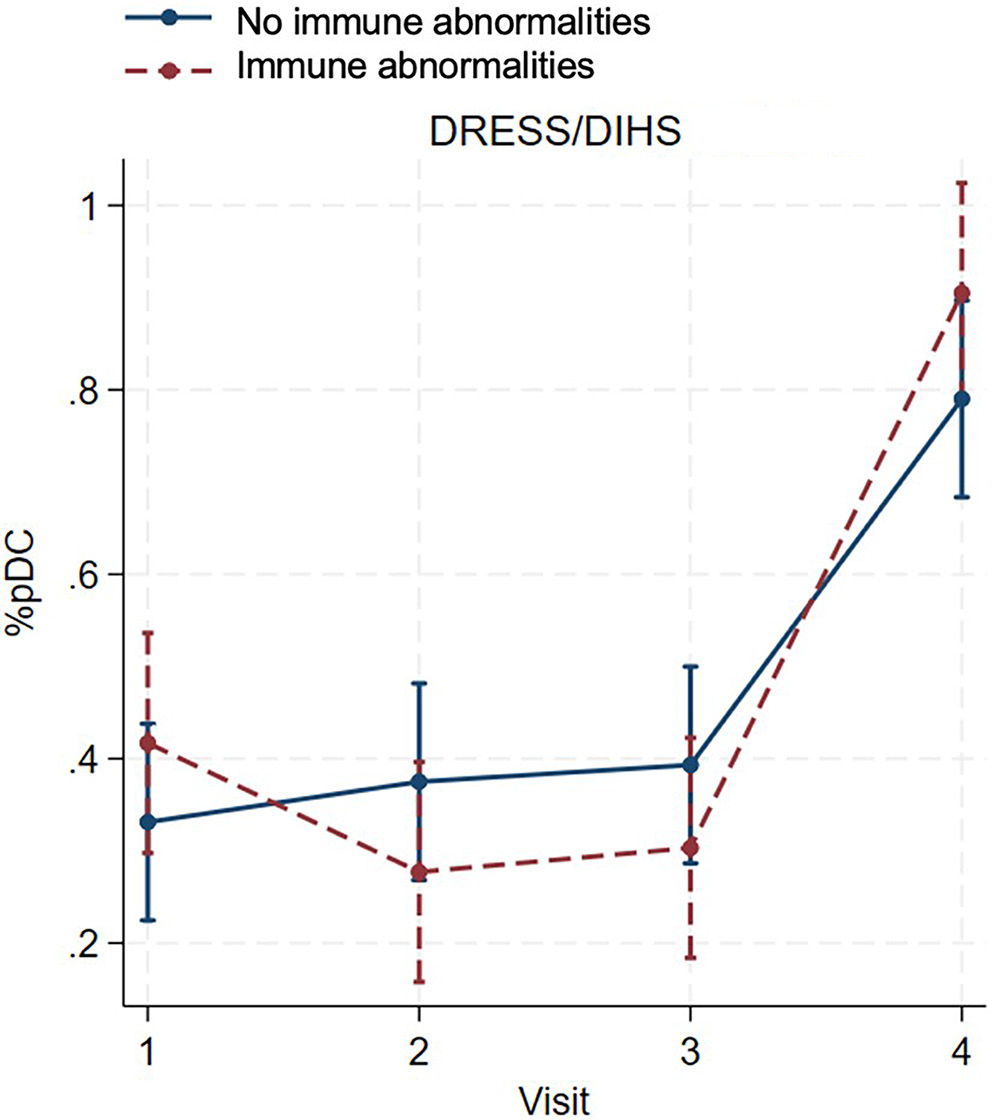
In patients with DRESS/DIHS, the percentage of pDCs decreased in those with immune abnormalities during the subacute to resolution phase, while the percentage of pDCs tended to increase in patients without immune abnormalities. The percentage of pDCs increased significantly after systemic steroids cessation in both groups compared to the resolution phase (β = 0.60, 95% CI: 0.44 to 0.76, z = 7.34, p < 0.001 for immune abnormalities; β = 0.40, 95% CI: 0.25 to 0.54, z = 5.41, p < 0.001 for without immune abnormalities; Figure 5, Table 4). No significant differences were detected between the 2 groups at any visit (visit 1: β = 0.09, 95% CI: −0.07 to 0.25, z = 1.05, p = 0.293; visit 2: β = −0.10, 95% CI: −0.26 to 0.06, z = −1.20, p = 0.231; visit 3: β = −0.09, 95% CI: −0.25 to 0.07, z = −1.10, p = 0.271; visit 4: β = 0.11, 95% CI: −0.05 to 0.27, z = 1.41, p = 0.160), as shown in Table 7.
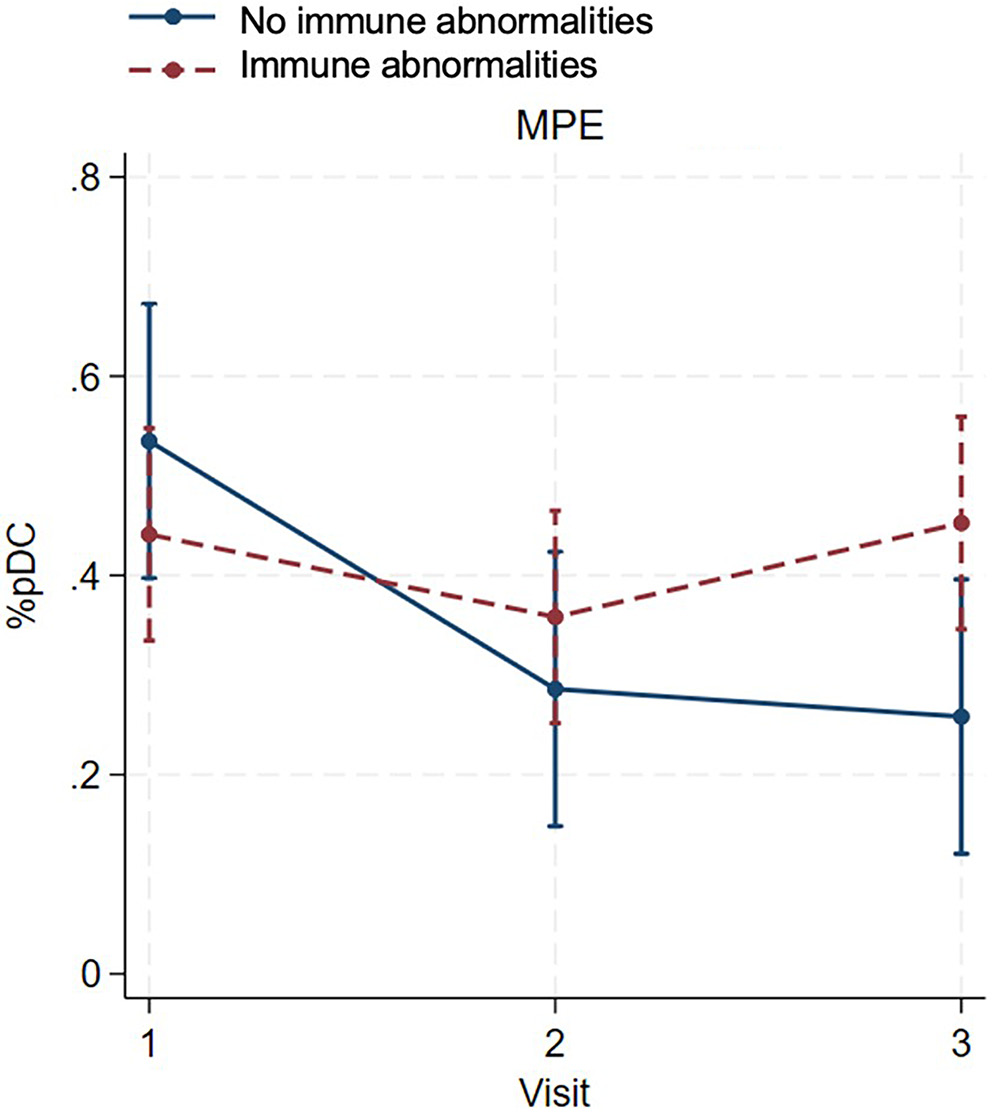
In patients with MPE, the percentage of pDCs decreased in both groups during the subacute phase. During the resolution phase, the percentage of pDCs increased in patients with immune abnormalities but decreased in those without immune abnormalities. At the final visit, the percentage of pDCs was significantly higher in patients with immune abnormalities than in patients without immune abnormalities (β = 0.19, 95% CI: 0.05 to 0.37, z = 2.19, p = 0.029; Figure 6, Table 7).
To assess model adequacy, residuals for Treg cells and pDCs from the GEE model were plotted against the control, MPE and DRESS/DIHS groups (Supplementary Fig. 1–4). Across all 3 groups, the residuals were approximately centered around 0, with no evidence of systematic bias. The spread of residuals was relatively consistent across groups, although a few outliers were observed.
Discussion
The pathogenesis of DRESS/DIHS remains complex and incompletely understood. Dysregulation of the immune response, particularly T cell-mediated immunity, plays a crucial role in the onset and progression of the disease. This study demonstrated a significant reduction in the mean percentages of Treg cells and pDCs during the acute stage of both DRESS/DIHS and MPE compared with healthy subjects. However, Treg cells showed a progressive increase toward the resolution phase in both conditions, whereas pDCs continued to decrease toward the resolution phase. After discontinuation of systemic steroids in DRESS/DIHS, both Treg cells and pDCs demonstrated a progressive increase. Nevertheless, Treg cell levels were significantly higher than those in the control group, while pDC levels remained significantly lower than those in the control group. No significant differences were observed in Treg cells or pDCs between patients with and without immune abnormalities in both DRESS/DIHS and MPE, except for pDCs during the resolution phase in MPE. These findings enhance our understanding of the immunological alterations associated with DRESS/DIHS, highlighting the dynamic changes in Treg cells and pDCs across different stages of the disease and its treatment.
Treg cells play a crucial role in maintaining immunological tolerance to both self and foreign antigens, preventing autoimmunity and controlling inflammation.3, 4 In a previous study, significantly increased frequencies of Treg cells were observed during the acute stage of DRESS/DIHS compared with healthy controls and the resolution phase; however, this pattern was not observed in toxic epidermal necrolysis (TEN) or MPE.5 In contrast, our study revealed a significant reduction in the number of Treg cells during the acute stage of both DRESS/DIHS and MPE compared with healthy subjects and the resolution phase. Moreover, no significant differences in Treg cell numbers were observed between patients with DRESS/DIHS or MPE who had immune abnormalities and those without. This discrepancy may be attributable to differences in the ethnic backgrounds of the study populations, which could influence immune response development. During acute inflammation, various soluble mediators, such as cytokines, acute-phase proteins, and chemokines, are released, promoting the migration of inflammatory cells to the site of inflammation.9 Previous studies have shown that Treg cells are significantly more abundant in the skin lesions of patients with DRESS/DIHS compared with those with TEN, graft-versus-host disease, and MPE.5, 10 Another recent study demonstrated that Treg cells become highly migratory during the first 3 days of skin inflammation, leading to increased Treg abundance in the dermis. Subsequently, Treg levels return to baseline by day 6.11 This migratory behavior may account for the reduced number of circulating Treg cells observed during the acute phase of DRESS/DIHS and MPE, as these cells are recruited to suppress cutaneous inflammation. Our study demonstrated a progressive increase in circulating Treg cells during the subacute phase (approx. 1 week after the acute stage) in both DRESS/DIHS and MPE, which aligns with the reported timeframe of normalized Treg migratory behavior. Furthermore, circulating Treg cell levels continued to rise during the resolution phase and following discontinuation of systemic corticosteroids in patients with DRESS/DIHS. Glucocorticoids exert complex effects on T cells, both promoting and suppressing T-cell-mediated immunity depending on the immunological context.12 Previous reports have shown that glucocorticoids can induce the expansion of Treg cells in autoimmune conditions, including systemic lupus erythematosus, immune thrombocytopenic purpura, and asthma, as well as in healthy individuals receiving long-term dexamethasone treatment.13 This suggests that the expansion of Treg cells in the post-acute stage of DRESS/DIHS may result from the resolution of inflammation, glucocorticoid therapy, or a combination of both. The expansion of Treg cells likely plays a pivotal role in limiting disease progression and severity, while also preventing the subsequent development of autoimmunity.
Plasmacytoid dendritic cells represent a distinct subset of dendritic cells that specialize in the production and secretion of large amounts of type I interferons (IFNs). They play a crucial role in antiviral immunity and also contribute to the development of autoimmune and inflammatory diseases. The association between DRESS/DIHS and HHV-6 reactivation suggests the potential involvement of pDCs in the pathogenesis of this condition. A previous study reported a significant decrease in circulating pDCs around 3–4 weeks after the onset of DRESS/DIHS, with frequencies lower than those in patients with MPE and healthy subjects.8 Another study found decreased frequencies of circulating pDCs during the initial 1–2 weeks of disease onset in DRESS/DIHS compared to MPE patients.7 Our results were consistent with these findings, demonstrating a significant reduction in the mean percentage of pDCs from the acute stage through the resolution phase (3 weeks after the initial presentation) in patients with DRESS/DIHS compared with healthy controls. This reduction in pDCs during the acute stage may be attributable to their migration and infiltration into skin lesions, a phenomenon observed in inflammatory skin diseases such as cutaneous lupus erythematosus and psoriasis.14 Additionally, a previous study reported higher pDC detection in the dermis of patients with DRESS/DIHS compared with those with MPE and healthy subjects.8 Unlike Treg cells, our study did not identify significant differences in the percentage of pDCs between DRESS/DIHS and MPE from the acute through the resolution phases, except after discontinuation of systemic steroids in DRESS/DIHS. Notably, glucocorticoids have been shown to significantly reduce IFN-α production and decrease the number of circulating pDCs.15, 16 These effects are reversible and typically return to baseline within days after steroid cessation.15, 16 During inflammatory periods, the reduction in circulating pDCs likely serves to limit inflammation and promote clinical immunosuppression. This dynamic interplay underscores the complexity of the immunological mechanisms involved in DRESS/DIHS and highlights the role of pDCs in modulating the immune response.
Notably, our study did not identify significant differences in the percentages of Treg cells and pDCs between DRESS/DIHS and MPE from the acute to the resolution phase, which contrasts with findings from previous studies.5, 8 This discrepancy may be attributable to the small sample size of our study or to the lack of assessment of HHV-6 reactivation in patients with DRESS/DIHS. Further investigations incorporating larger cohorts and systematic evaluation of HHV-6 reactivation are warranted to achieve a more comprehensive understanding of the immunological differences between DRESS/DIHS and MPE.
Limitations
This study had some limitations. First, the number of participants in the study was relatively small, as this was a pilot study, and sample size calculation was not performed. Second, the functions and subsets of circulating Treg cells and pDCs were not examined. Third, skin biopsies to evaluate the numbers and functions of Treg cells and pDCs were not conducted. Lastly, reactivation of HHV-6, cytomegalovirus, and EBV was not evaluated in this study. However, this study successfully monitored dynamic changes in the numbers of Treg cells and pDCs throughout the course of DRESS/DIHS and MPE. Further studies assessing HHV reactivation and incorporating genetic testing may enhance the understanding of disease pathogenesis.
Conclusions
This study demonstrated the dynamic interplay between Treg cells and pDCs in the pathogenesis of DRESS/DIHS and MPE. The acute stage of both conditions exhibited a significant decrease in Treg cells and pDCs, suggesting their potential involvement in immune dysregulation during disease onset. However, Treg cells showed a significant increase in the resolution phase of both DRESS/DIHS and MPE, while pDCs continued to decrease until the resolution phase in both conditions. This suggests that Treg cells are likely to play a crucial role in preventing further inflammation in both DRESS/DIHS and MPE.
Supplementary data
The supplementary materials are available at https://doi.org/10.5281/zenodo.15682125. The package contains the following files:
Supplementary Fig. 1. Residuals of Treg cells from the GEE model across the 3 groups at each visit.
Supplementary Fig. 2. Residuals of Treg cells from the GEE model at each visit, comparing patients with and without immune abnormalities across MPE and DRESS/DISH groups.
Supplementary Fig. 3. Residuals of pDCs from the GEE model across the 3 groups at each visit.
Supplementary Fig. 4. Residuals of pDCs from the GEE model at each visit, comparing patients with and without immune abnormalities across MPE and DRESS/DISH groups.
Data Availability Statement
The datasets supporting the findings of the current study are openly available in Zenodo at https://doi.org/10.5281/zenodo.14210150.
Consent for publication
Not applicable.
Use of AI and AI-assisted technologies
Not applicable.