Abstract
Background. Gastric cancer (GC) remains highly lethal, with limited available biomarkers. The Pathway Mutation Accumulation Perturbation Score (PMAPscore), which leverages pathway-level mutations, provides a novel approach to predicting immunotherapy response and survival outcomes.
Objectives. To evaluate the prognostic and predictive value of the PMAPscore in patients with advanced GC undergoing immunotherapy.
Materials and methods. Three cohorts of patients with GC treated with immunotherapy were analyzed: PUCH (Peking University Cancer Hospital; n = 39, training cohort), MSK (Memorial Sloan Kettering; n = 19, validation cohort) and SMC (Samsung Medical Center; n = 43, validation cohort). A PMAPscore-based risk model was developed and validated for survival outcomes. Immune mechanisms in high- and low-risk groups were explored using The Cancer Genome Atlas (TCGA) GC data (n = 431).
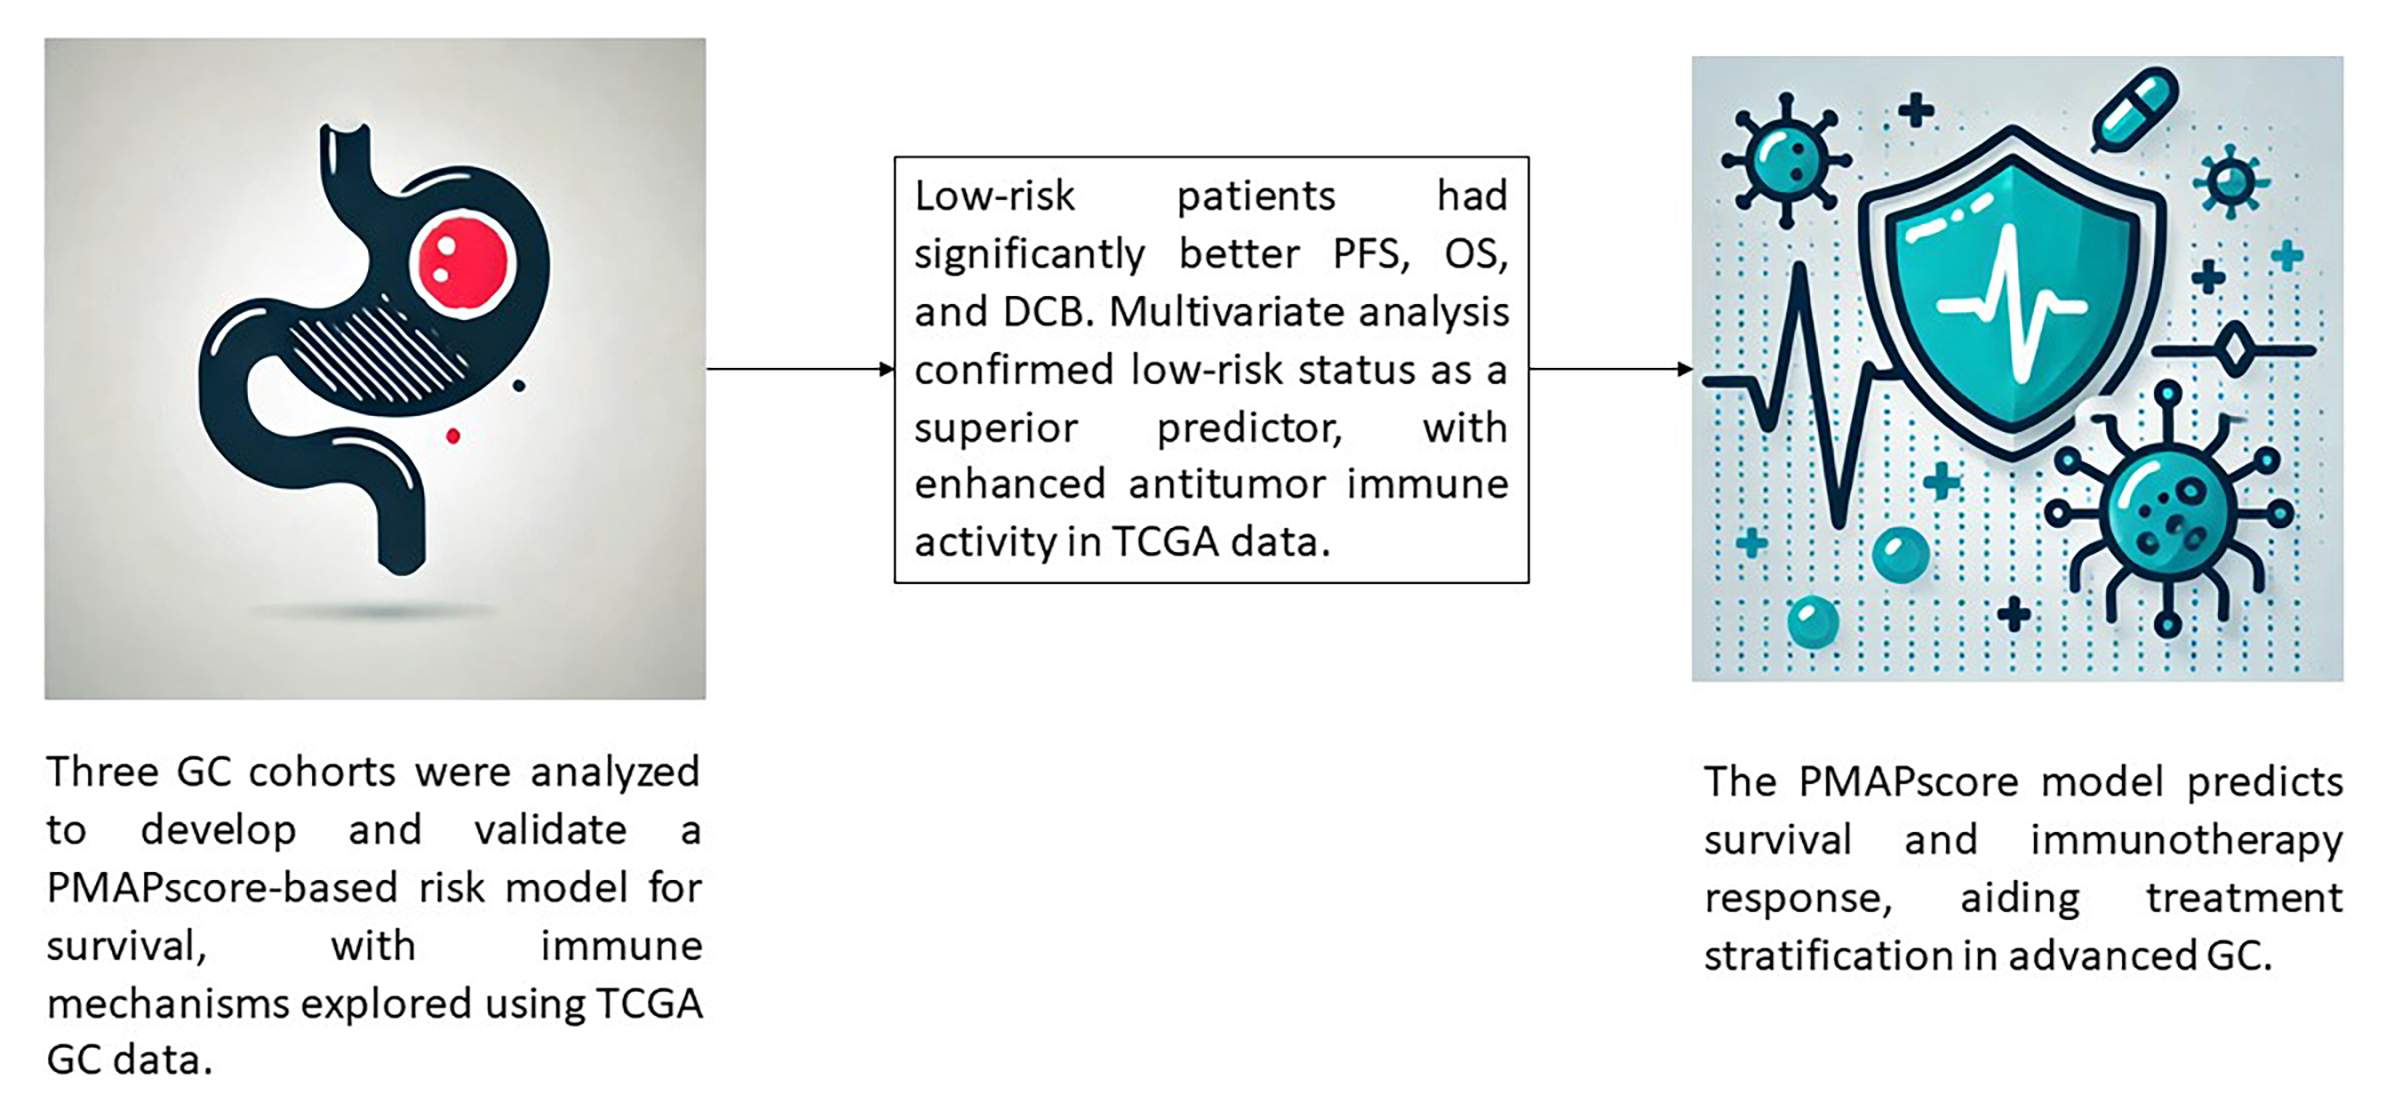
Results. Low-risk patients identified by the PMAPscore model exhibited significantly better progression-free survival (PFS), overall survival (OS) and durable clinical benefit (DCB). In the PUCH cohort, low-risk patients had higher DCB rates (85.7% vs 44.0%, p = 0.02), longer PFS (p < 0.001), and longer OS (p < 0.001). Similar trends were observed in the MSK and SMC cohorts. Multivariate analysis confirmed low-risk status as an independent predictor of improved PFS and OS, outperforming tumor mutation burden (TMB), programmed death-ligand 1 (PD-L1) expression, microsatellite instability (MSI) status, and the gastrointestinal immune prognostic signature (GIPS). The TCGA data indicated enhanced antitumor immune activity in low-risk tumors, with increased human leukocyte antigen (HLA)-related gene expression and greater B-cell and natural killer (NK) cell infiltration.
Conclusions. The PMAPscore-based risk model is a robust tool for predicting survival and immunotherapy responses in patients with advanced GC, supporting its clinical application for treatment stratification.
Key words: gastric cancer (GC), prognostic biomarker, immunotherapy response, Pathway Mutation Accumulate Perturbation score (PMAPscore)
Background
In China, gastric cancer (GC) is the 3rd most common cause of cancer-related fatalities. It is also one of the most aggressive cancers worldwide. This high mortality rate is mainly associated with rapid progression to advanced stages and a high metastatic potential.1, 2 Historically, the treatment approach for advanced GC has relied on chemotherapy consisting of platinum compounds and fluoropyrimidines, with the addition of radiation therapy or targeted agents. These recommendations are aligned with the National Comprehensive Cancer Network (NCCN) guidelines.3 However, in recent years, immunotherapy has become an effective treatment approach. Immune checkpoint inhibitors (ICIs) targeting programmed cell death protein 1 (PD-1) and programmed death-ligand 1 (PD-L1) have shown promising outcomes. This represents a major paradigm shift in GC management.4, 5, 6, 7 However, response rates to ICIs vary, highlighting a crucial need for reproducible biomarkers to predict which patients will benefit from immunotherapy.8, 9
There have been several attempts to identify predictive biomarkers for GC immunotherapy. For example, first-line treatment with nivolumab and chemotherapy may be beneficial for HER2-negative patients with advanced or metastatic GC who exhibit PD-L1 positivity (combined positive score (CPS) ≥ 5).10 Furthermore, pembrolizumab monotherapy has demonstrated positive results as a second-line or subsequent treatment in patients with high tumor mutation burden (TMB-H, ≥10 mutations per megabase) or high microsatellite instability (MSI-H).11, 12, 13, 14 Nevertheless, inconsistent or contradictory results have been obtained from clinical trials that included these biomarkers.15, 16, 17 Biomarkers such as the gastrointestinal immune prognostic signature (GIPS), which consists of 6 prognosis-related genes, have shown potential to guide treatment decisions for gastrointestinal cancers. In addition, previous studies have indicated that mutations in patched homolog 1 (PTCH1) may serve as predictive biomarkers for immune checkpoint inhibitors in gastrointestinal cancers.18 Yet, their applicability is limited due to their narrow genetic scope.19 Similarly, transcriptomic biomarkers, including the T-cell-inflamed gene expression profile (GEP) and chromatin assembly factor 1 subunit A (CHAF1A) expression, have been linked to ICI responses but fail to reliably predict survival outcomes in GC, largely due to the lack of high-quality mRNA data.20, 21 This lack of a universally effective biomarker highlights the complexity of the immune response in GC.
According to recent research, biological pathways affected by cumulative genetic mutations may offer valuable insights into predicting the efficacy of immunotherapy.22, 23, 24, 25, 26 Building on this, the Pathway Mutation Accumulation Perturbation Score (PMAPscore) was developed to evaluate pathway mutation perturbation levels by integrating the cumulative impact of mutated genes and their positions within biological pathways.27 Although the PMAPscore has demonstrated predictive and prognostic utility in several cancers, including melanoma and non-small cell lung cancer, its role in advanced GC remains unexplored.
Objectives
In this study, we utilized data from 3 advanced GC immunotherapy cohorts, along with The Cancer Genome Atlas (TCGA) GC cohort (https://www.cancer.gov/ccg/research/genome-sequencing/tcga), to investigate the prognostic and predictive value of a multiple pathway-based risk model constructed using the PMAPscore. In addition, we investigated the biological mechanisms underlying this risk model. Our aim is to facilitate the development of a reliable biomarker for GC patient stratification and prediction of immunotherapy response.
Materials and methods
Data sources and processing
This multicohort study followed a 3-step framework encompassing biomarker discovery, validation and mechanistic exploration. Supplementary Fig. 1 describes the patient selection process in detail. Genomic and clinical data from 3 cohorts of patients receiving immunotherapy for GC were examined.
The multiple pathway-based risk model was developed and validated using the following cohorts:
Training cohort: PUCH (Peking University Cancer Hospital,19 n = 39); used to identify genetic characteristics with prognostic potential and to construct the pathway-based risk model.
Validation cohorts:
1) MSK (Memorial Sloan Kettering,28, 29 n = 19): used to validate the predictive performance of the model;
2) SMC (Samsung Medical Center,30 n = 43): used for additional external validation.
Additionally, the molecular processes underlying the correlation between the pathway-based risk model and the clinical outcomes of immunotherapy were examined using the TCGA GC cohort, which included 431 patients. In Supplementary Table 1, the clinicopathological features of the 3 groups are summarized.
Outcome assessment standards
Tumor responses were assessed using the Response Evaluation Criteria in Solid Tumors (RECIST) v. 1.1.31 Achieving complete response (CR), partial response (PR) or stable disease (SD) lasting longer than 24 weeks was defined as durable clinical benefit (DCB), whereas progressive disease (PD) or SD lasting less than 24 weeks was defined as non-durable benefit (NDB).28 Patients with CR or PR were classified as responders (R), whereas those with SD or PD were classified as non-responders (NR). Overall survival (OS) and progression-free survival (PFS) were the primary survival endpoints. Progression-free survival was defined as the time from initiation of immunotherapy to disease progression or death, whereas OS was defined as the time from initiation of treatment to death or the date of the most recent follow-up.
PMAPscore calculation and risk model construction
In accordance with prior work, the PMAPscore, which represents the cumulative effects and locations of genetic mutations within pathways, was computed.27 The PMAPscores were obtained by analyzing 123 Kyoto Encyclopedia of Genes and Genomes (KEGG; http://www.kegg.jp) pathways using a modified R-based tool (https://CRAN.R-project.org/package=PMAPscore). To further narrow the scope of candidate pathways and prevent overfitting, univariable Cox proportional hazards regression analyses were performed first, and pathways with p < 0.2 were selected. Subsequently, the least absolute shrinkage and selection operator (LASSO) regression was applied to the Cox model by penalizing its likelihood function using a 10-fold cross-validation approach, and a prognostic risk model was constructed by integrating the PMAPscores of prognostic pathways. The risk score formula was expressed as follows: risk score = ∑ (PMAPscore × regression coefficient). Patients were stratified into high- and low-risk groups based on their scores. In conjunction with clinical factors, the independent prognostic significance of the risk score was assessed using multivariate Cox regression analysis.
Bulk RNA-sequencing analyses
Associations between the PMAPscore-based risk model and immune-related characteristics were investigated using the TCGA GC cohort, which included both DNA and RNA sequencing data. Differential gene expression analyses were conducted using DESeq2 v1.30 (https://bioconductor.org/packages/release/bioc/html/DESeq2.html), with a fold-change threshold of ≥2 and a p-value cutoff of <0.05. The ClusterProfiler software (v. 4.4.4) (https://bioconductor.org/packages/release/bioc/html/clusterProfiler.html) was used to conduct enrichment analysis of the identified genes. Gene set variation analysis (GSVA, v. 1.46) (https://bioconductor.org/packages/release/bioc/html/GSVA.html) was employed to calculate enrichment scores for 50 hallmark gene sets, followed by comparisons between high- and low-risk groups. The CIBERSORT algorithm and the Immuno-Oncology Biological Research (IOBR) R package (https://github.com/IOBR/IOBR) were applied to determine the proportions of 22 immune cell types and immuno-oncology-related signatures in both groups. To further elucidate the relationship between immune microenvironment subtypes and therapeutic outcomes, dynamic changes in the tumor immune microenvironment (TIME) were examined using 2 established approaches.32, 33 Metrics related to the immune repertoire were also compared.
Statistical analyses
R software v. 4.2.2 (R Foundation for Statistical Computing, Vienna, Austria) was used for all analyses. Overall survival and PFS were assessed using Kaplan–Meier survival curves, with significance determined with the log-rank test. Fisher’s exact test was used to assess categorical data, and the two-sided Mann–Whitney U test was used to compare groups. We assessed the normality of continuous variables using the Kolmogorov–Smirnov or Shapiro–Wilk tests. For samples of size ≤50, the Shapiro–Wilk test was applied; otherwise, the Kolmogorov–Smirnov test was used. A p > 0.05 indicated a normal distribution. When analyzing differences between 2 sets of variables, an F-test was used to assess the homogeneity of variance. Equal variance was assumed if p > 0.05. The results of the assumption assessment are listed in Supplementary Tables 6–9. For normally distributed data with equal variance, Student’s t-test was used to compare differences between groups. If either assumption was violated, the Mann–Whitney U test was used. For categorical variables, the χ2 test or Fisher’s exact test was used to compare group differences. The χ2 test was applied when the total sample size exceeded 40 and the minimum expected frequency was greater than 5. If the total sample size exceeded 40 but the minimum expected frequency was between 1 and 5, the corrected χ2 test was applied. Fisher’s exact test was used when the total sample size was below 40 or the minimum expected frequency was less than 1. Group difference results are presented in tables and visualized using box-and-whisker plots, showing the estimated maximum, upper quartile, median, lower quartile, and estimated minimum. Outliers were defined as values above QU + 1.5 × QR or below QL − 1.5 × QR (QR = QU − QL). The significance level for statistical analyses was set at α = 0.05, with p < 0.05 considered statistically significant.
Results
Clinicopathological features of the patients
This study established a predictive model using the PUCH cohort, comprising 39 GC patients receiving ICIs, with a median follow-up of 6 months. Validation was performed using data from the MSK and SMC cohorts, which included 19 and 43 GC patients, respectively. Among these patients, DCB or response (R) to PD-1 inhibitors was observed in 14 patients (35.9%) in the PUCH cohort, 6 patients (31.6%) in the MSK cohort and 13 patients (30.2%) in the SMC cohort. Supplementary Table 1 summarizes the clinical and pathological features of all 3 cohorts, and the study design is illustrated in Supplementary Fig. 1.
Construction of the pathway-based risk model in the PUCH cohort based on PMAPscore profiles
The PMAPscore was calculated for 123 pathways retrieved from the KEGG database for each patient, yielding a comprehensive PMAPscore profile. Pathways with PMAPscores of 0 in more than 70% of patients were excluded from further analysis, resulting in 86 pathways retained for univariable Cox proportional hazards regression analyses. Based on the results of the univariate Cox analysis, a filtering criterion of p < 0.2 was applied, and 11 candidate pathways were subsequently entered into the LASSO regression model to mitigate overfitting (Supplementary Fig. 2). A prognostic risk model was then developed using the PMAPscores of 10 pathways weighted by their LASSO regression coefficients. Risk scores for individual patients were calculated using the formula:
The risk score was calculated as the weighted sum of PMAPscores for 10 pathways (Supplementary Table 2).
Negative contributions (associated with lower risk):
−0.0617 × mTOR signaling pathway
−0.2052 × Gap junction
−0.4438 × Thermogenesis
−0.0446 × Insulin signaling pathway
−0.0867 × Type II diabetes mellitus
Positive contributions (associated with higher risk):
+0.1249 × Longevity regulating pathway
+0.0410 × Platelet activation
+0.2726 × Long-term potentiation
+0.2186 × Regulation of actin cytoskeleton
+0.7536 × Cortisol synthesis and secretion
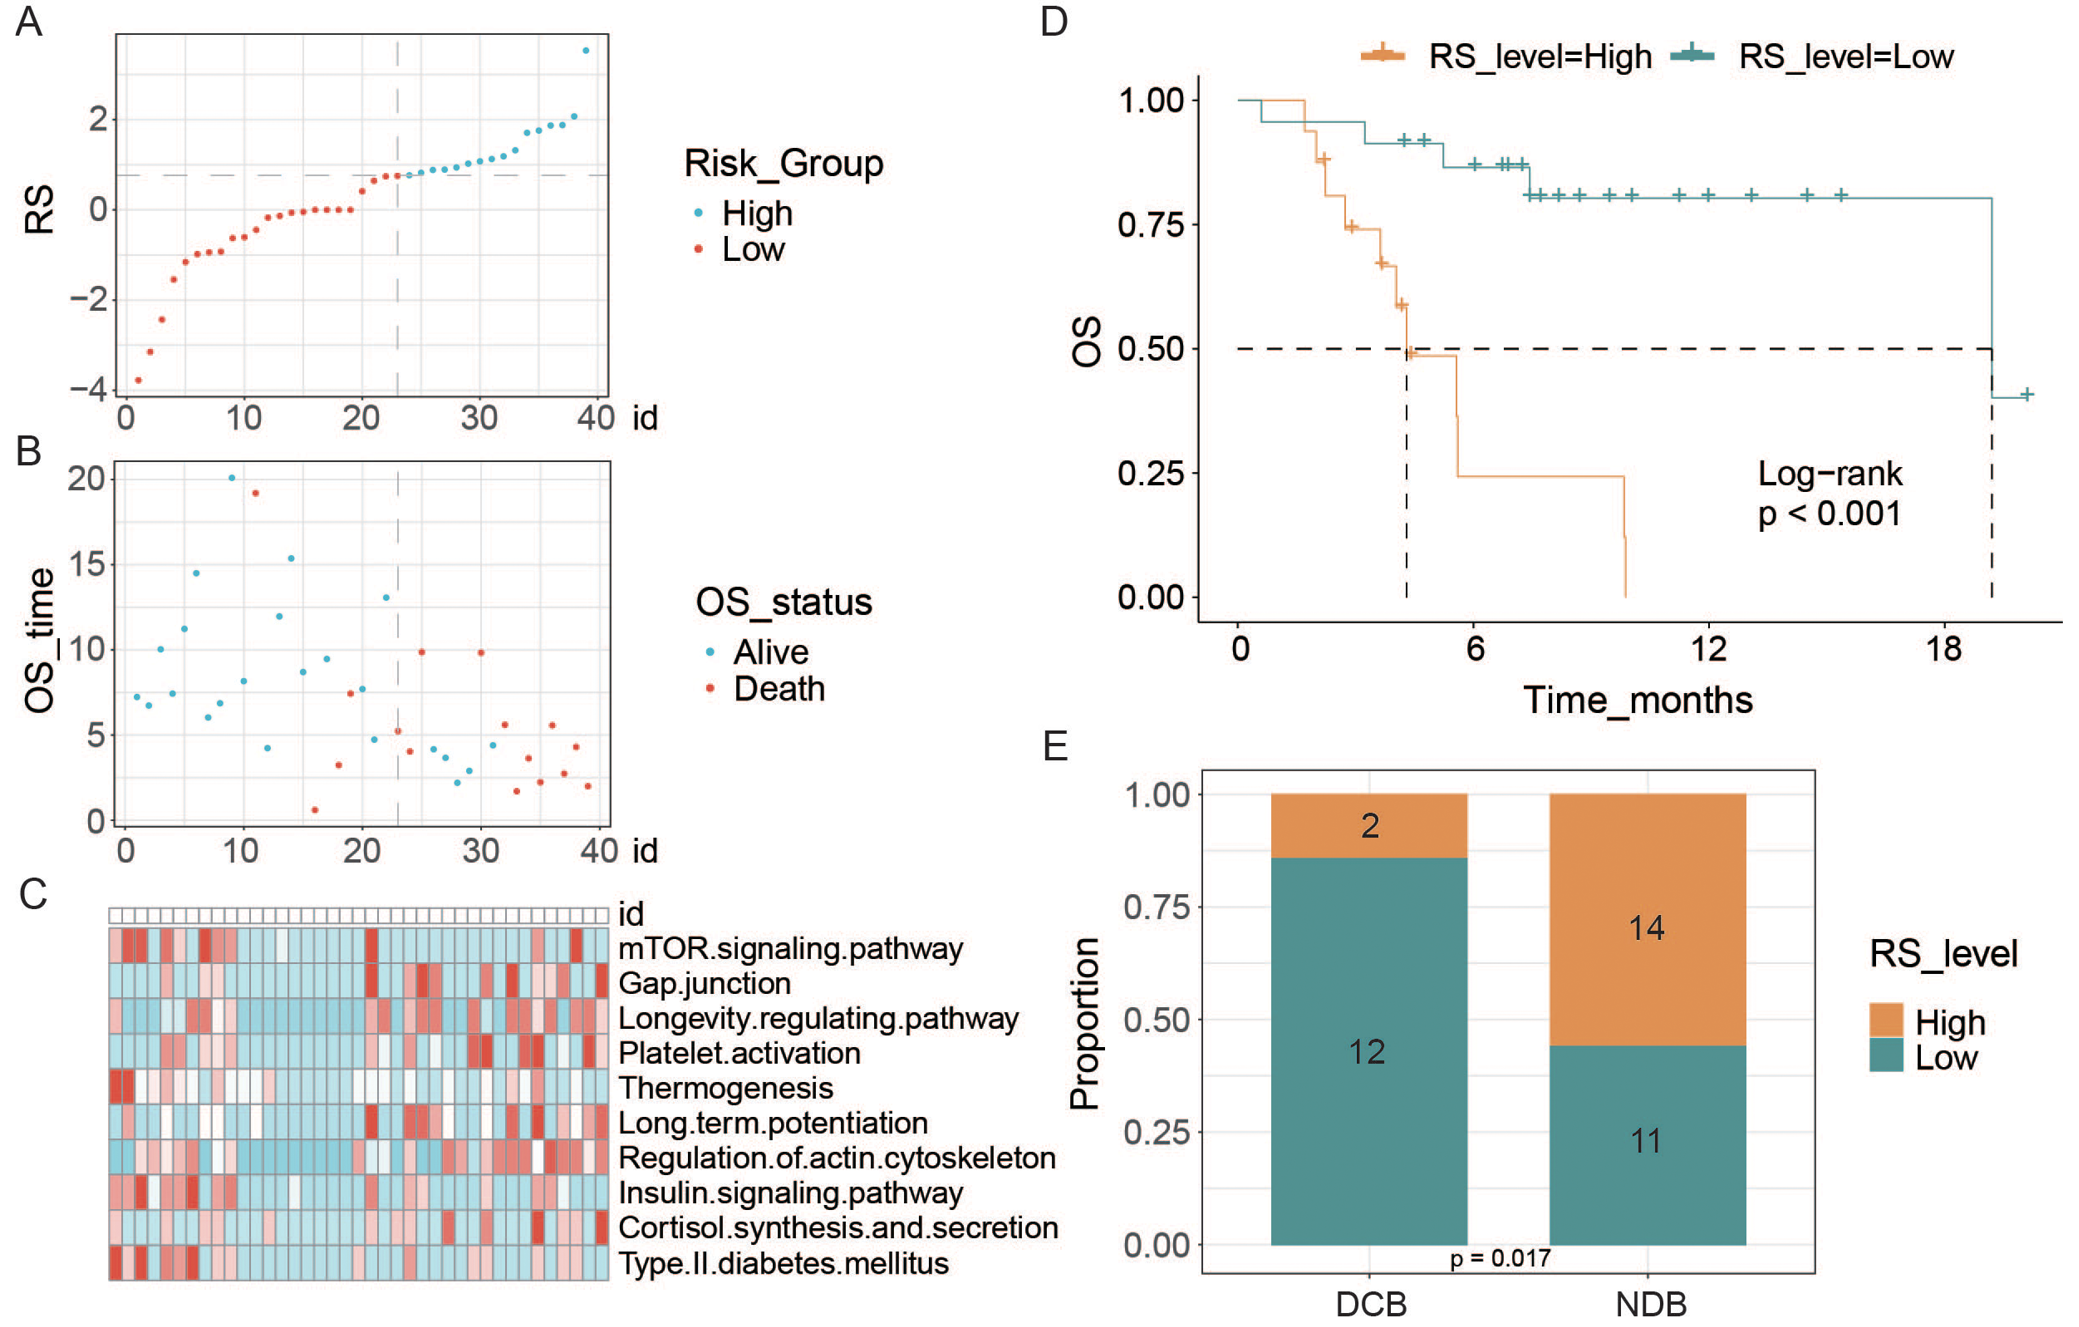
Similar to the validation cohorts, participants in the PUCH cohort were divided into high- and low-risk groups based on the 60th percentile threshold of the risk score. Risk score distributions, survival outcomes and PMAPscores of the pathways are shown in Figure 1A–C. Notably, low-risk patients exhibited significantly improved OS in the PUCH cohort (p < 0.001, Figure 1D). The c-index for OS was 0.835 (Supplementary Table 3). Additionally, the DCB group had a higher proportion of patients classified as low-risk (85.7% vs 44.0%, p = 0.017, Figure 1E).
Correlation of the pathway-based risk model with clinical and immunological features
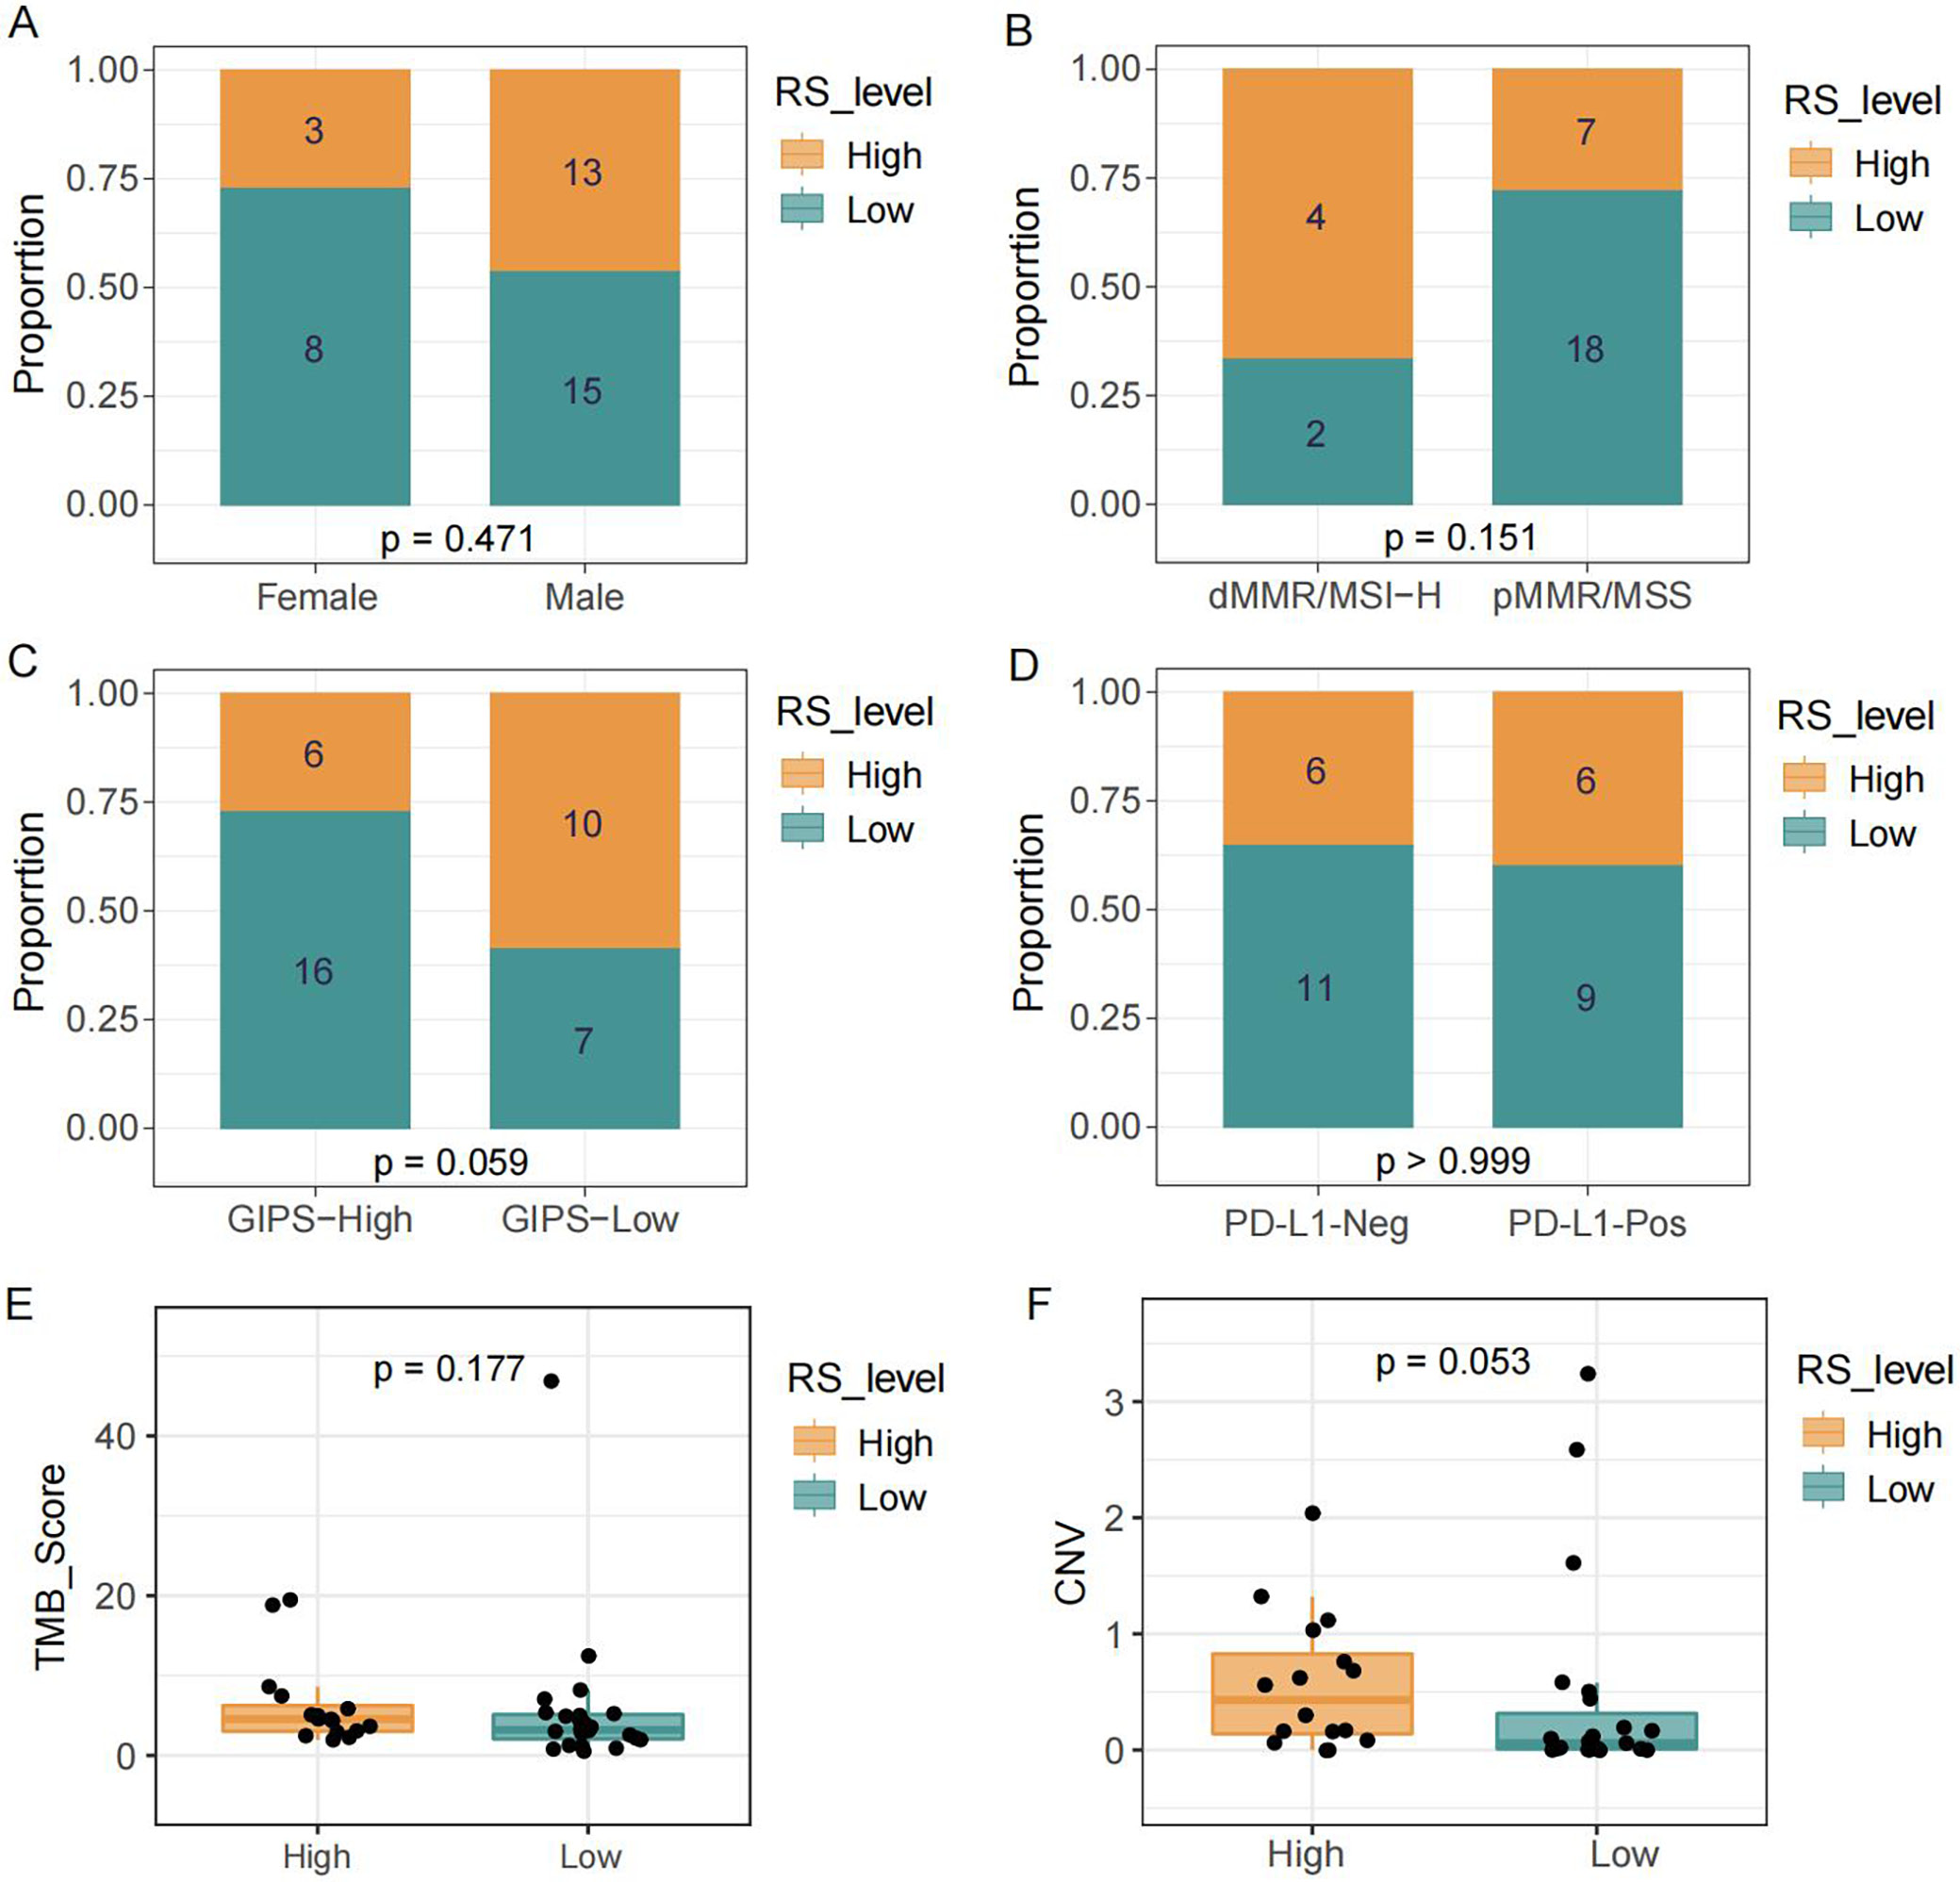
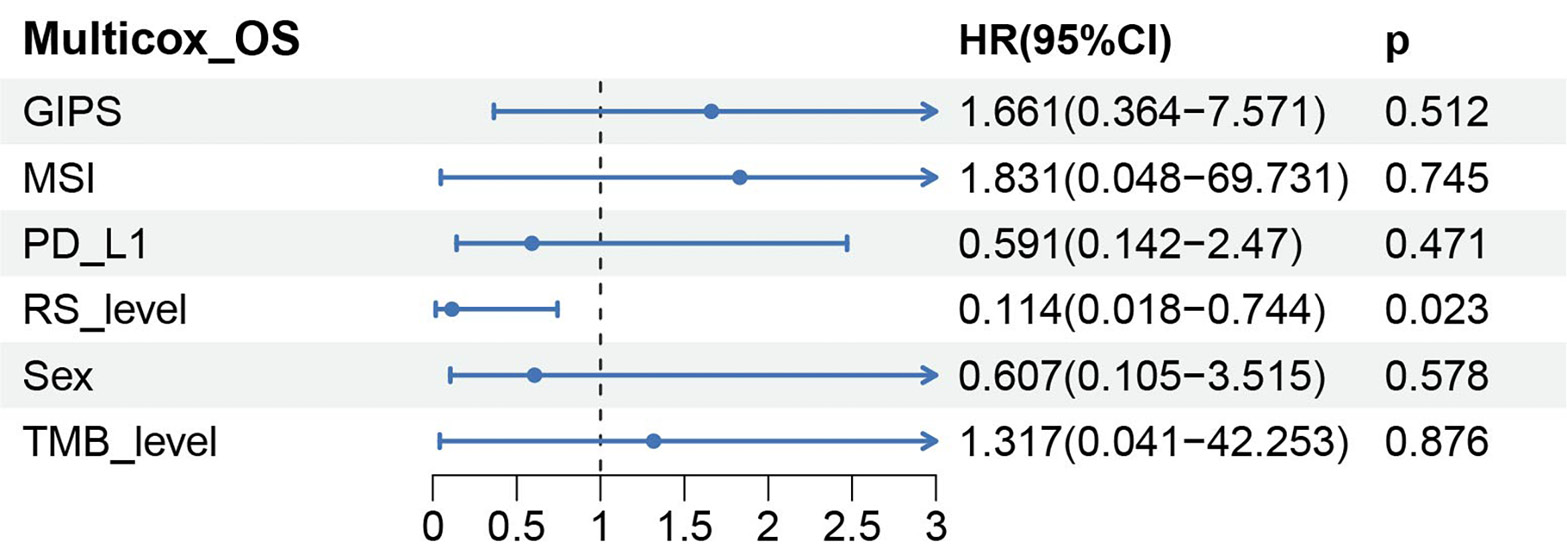
The pathway-based risk score showed no significant association with clinical or immunological features, including sex, MSI, GIPS, PD-L1 expression, and TMB score, except for copy number variation (CNV) (Figure 2A–E, p > 0.05). The CNV showed a trend toward a positive correlation with risk score level (Figure 2F, p = 0.053). The pathway-based signature was confirmed as an independent prognostic factor for progression-free survival by Cox regression analyses (multivariate: p = 0.023, hazard ratio (HR) = 0.114 (low vs high), 95% confidence interval (95% CI): 0.018–0.744) (Figure 3).
Validation of prognostic and predictive significance in independent cohorts
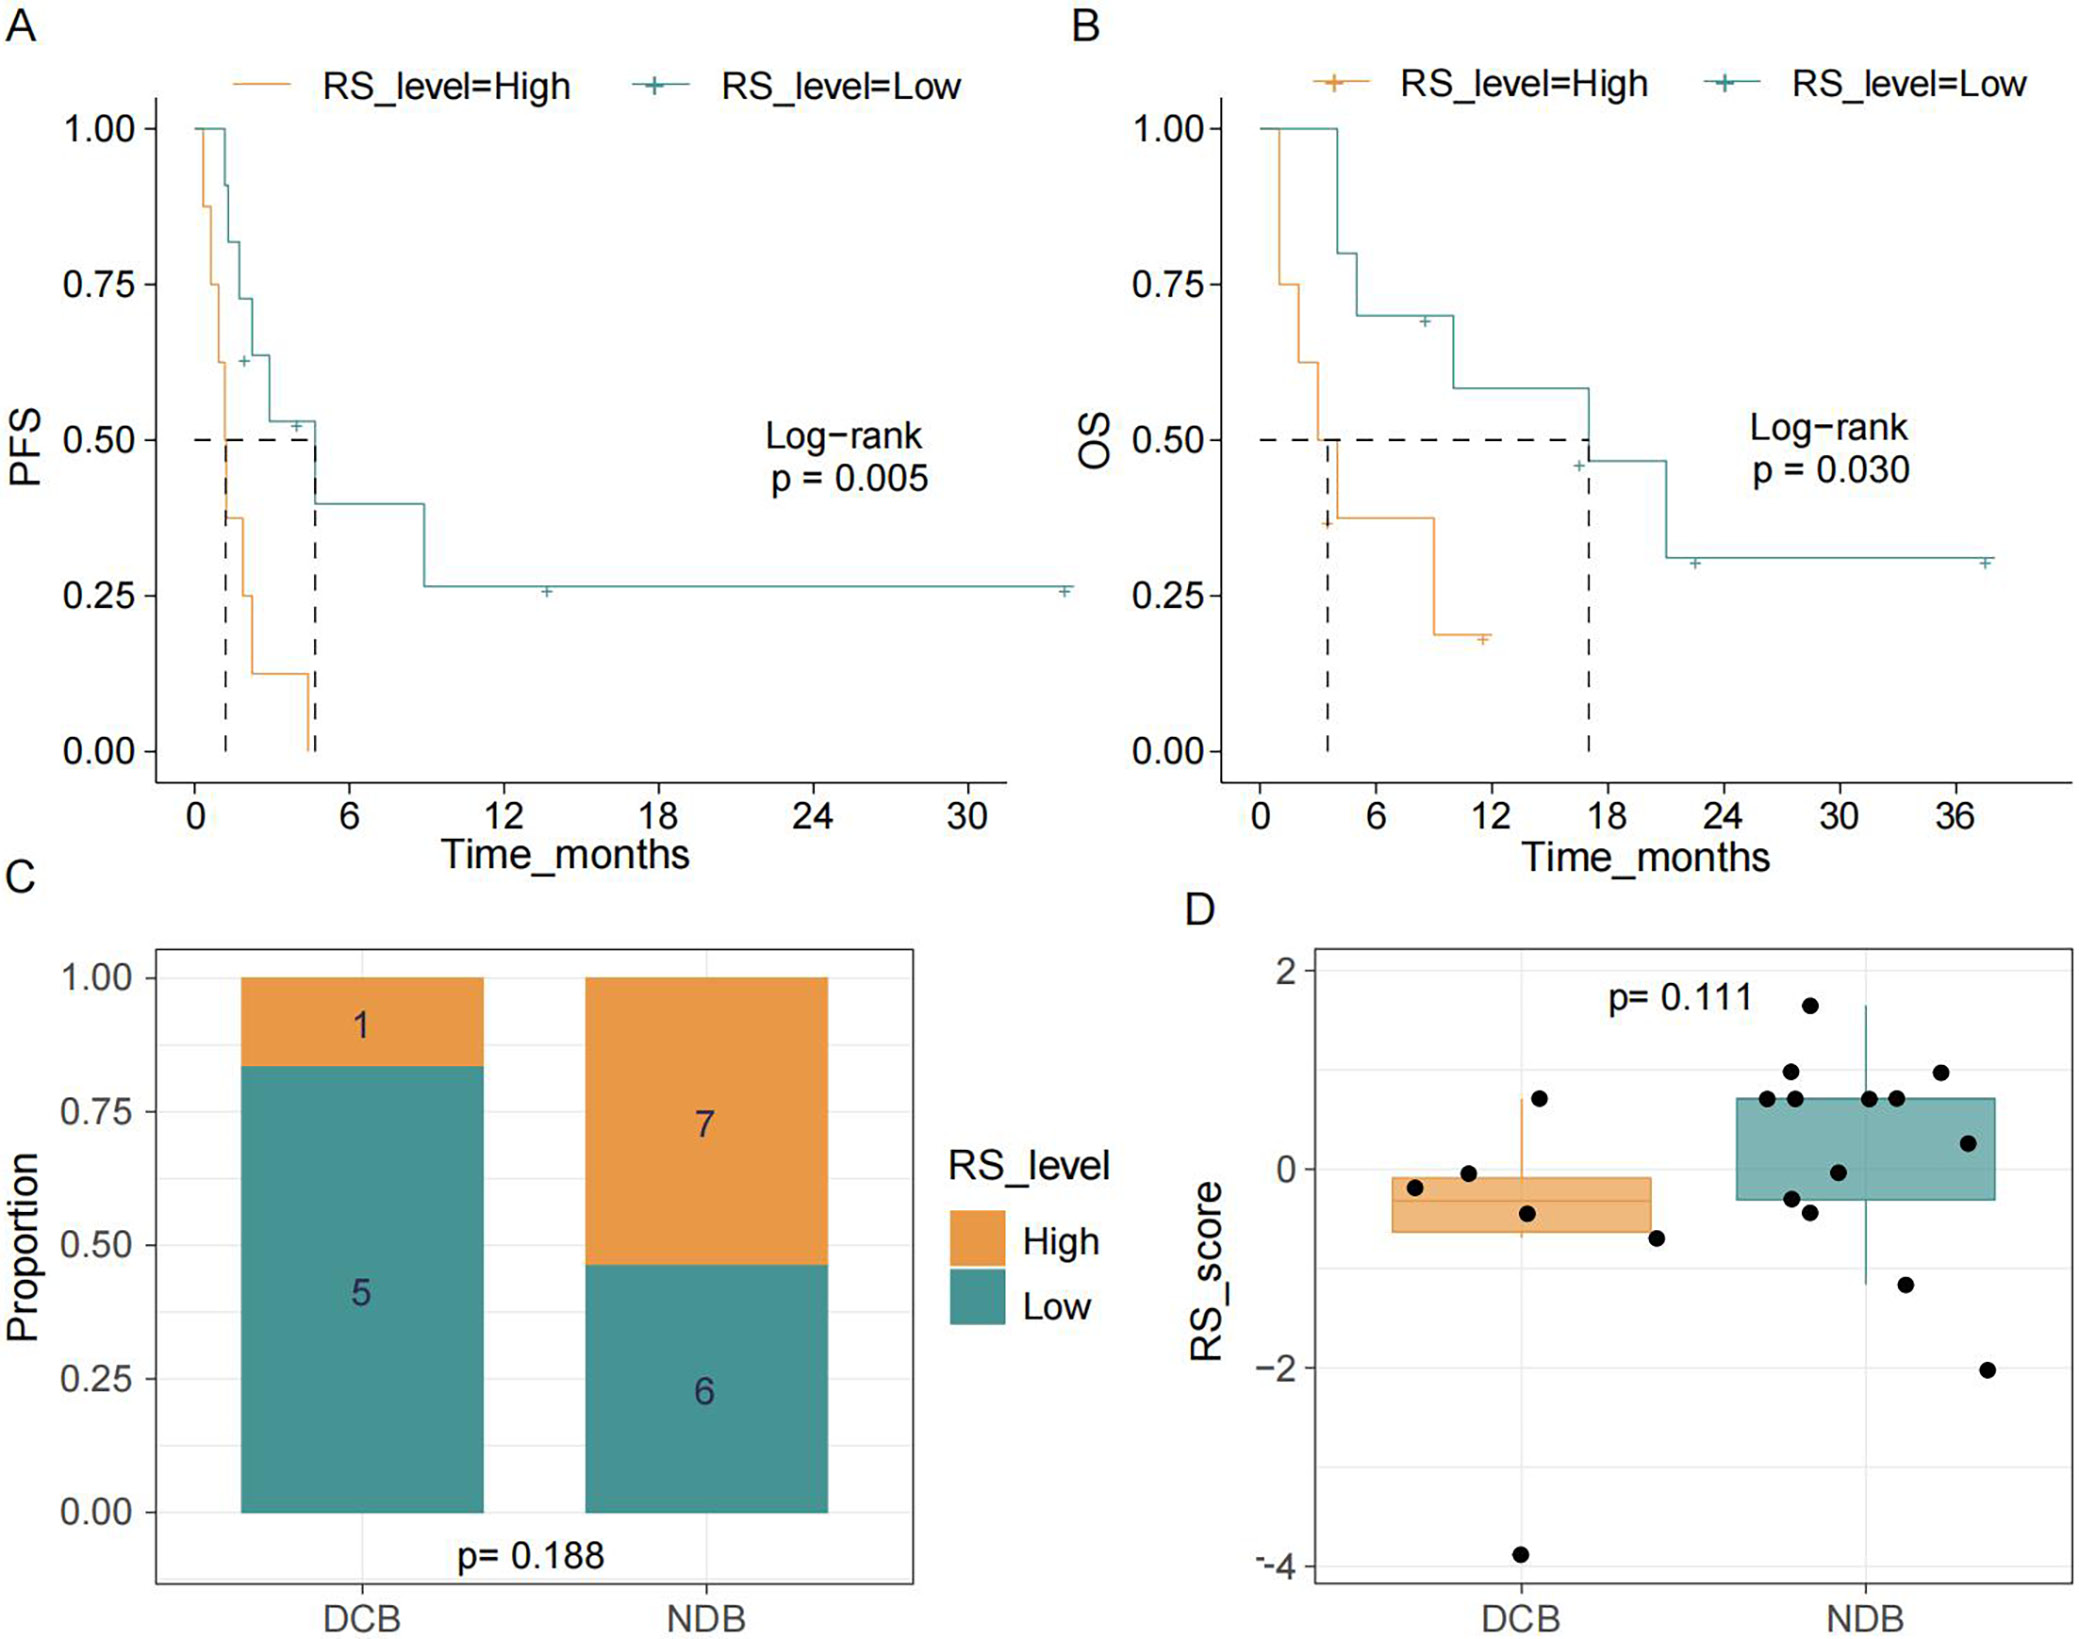
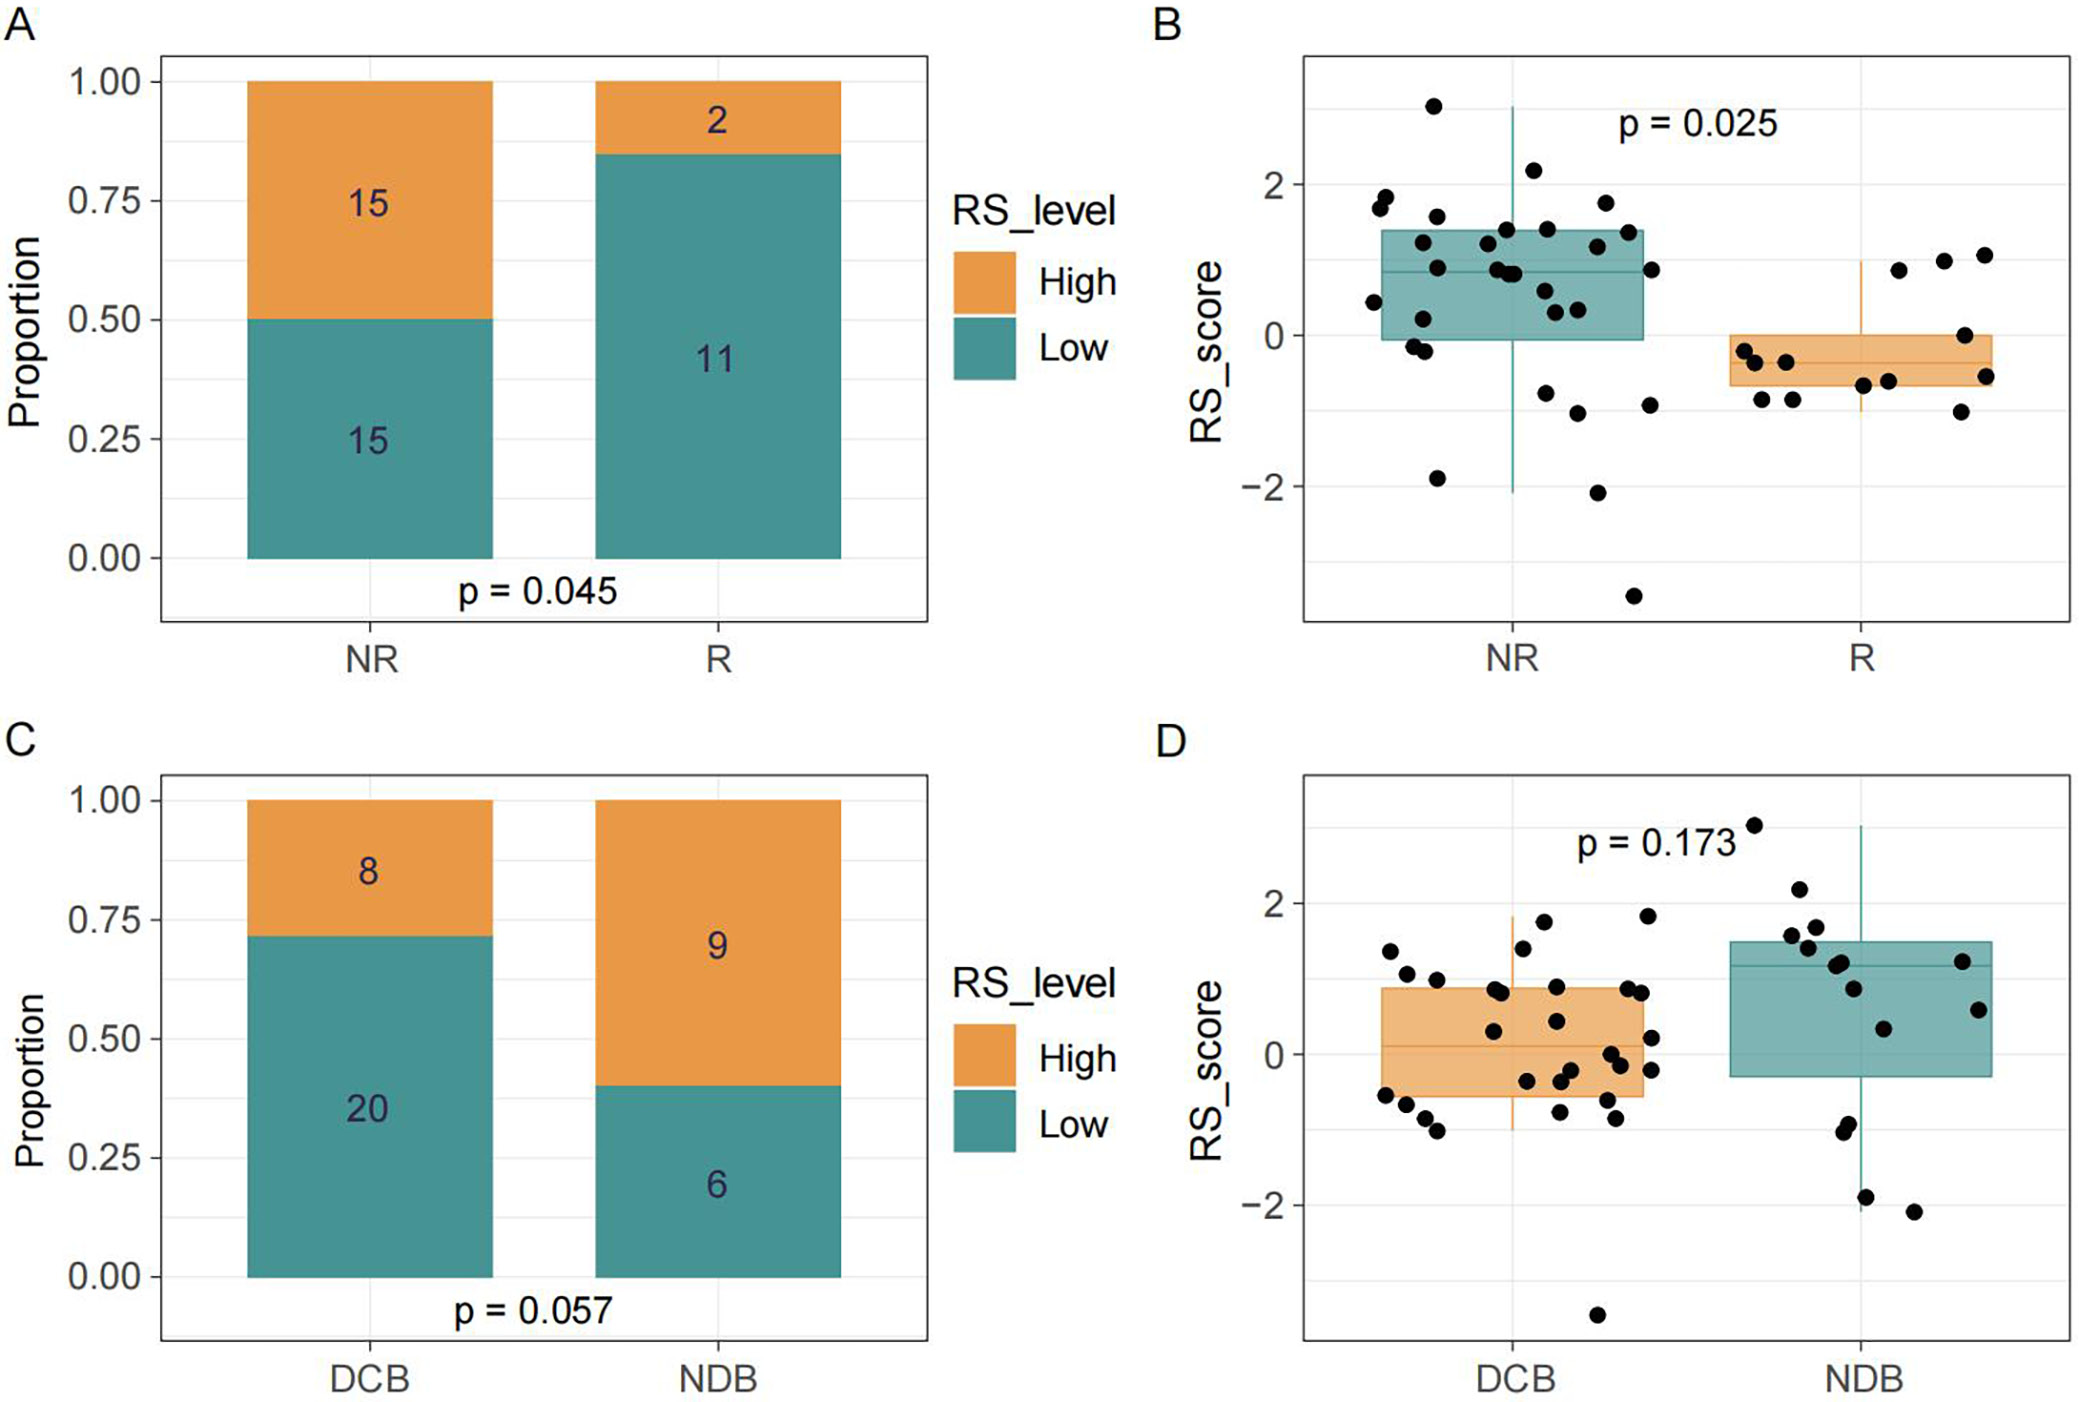
To verify the prognostic and predictive value of the model, analyses were conducted in the MSK and SMC cohorts (Supplementary Table 4). In the MSK cohort, patients in the low-risk group demonstrated a higher proportion of DBC, as well as better PFS and OS, compared with the high-risk group (Figure 4A–D). The c-index for OS was 0.707 (Supplementary Table 3). Consistent with these findings, in the SMC cohort, patients in the responder group experienced greater clinical benefit than those in the non-responder group (Figure 5A,B). A similar pattern was observed when comparing the DBC and NDB groups; however, the differences were not statistically significant (Figure 5C,D).
Differential gene expression and enrichment analyses
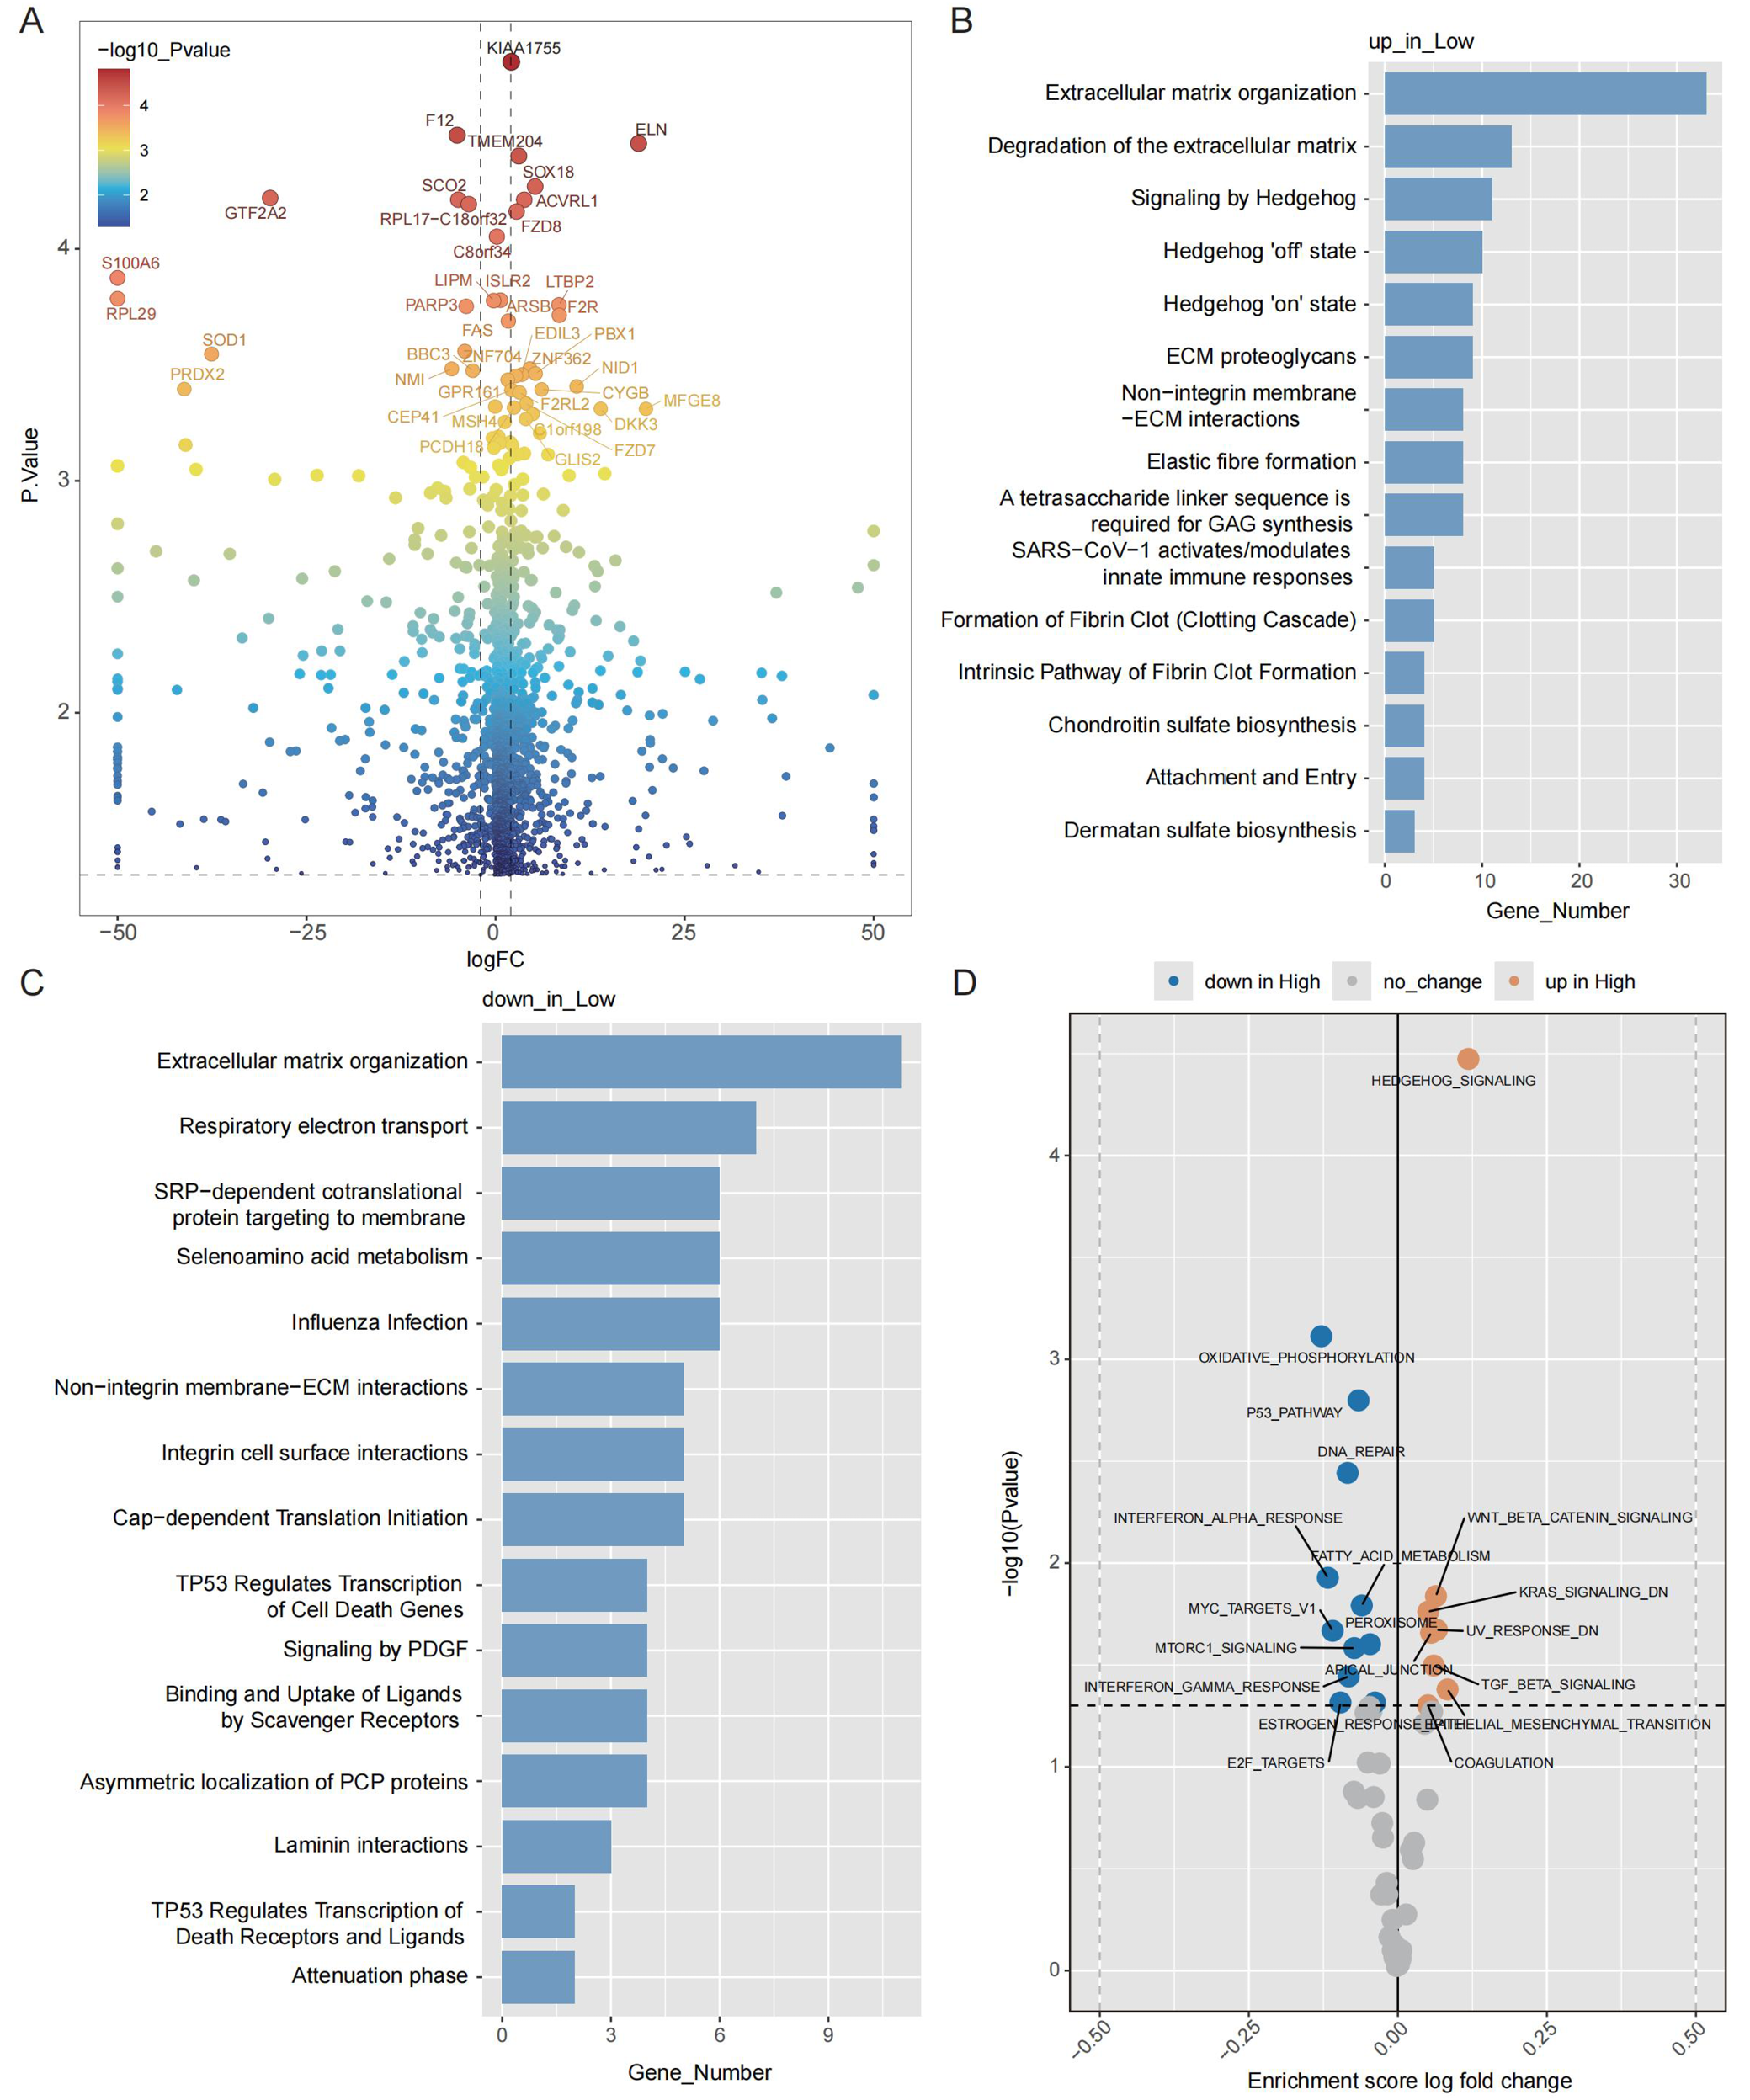
Transcriptomic data analysis identified 1,094 differentially expressed genes (DEGs) between the high- and low-risk groups (Figure 6A, Supplementary Table 5). Enrichment analysis indicated significant involvement of pathways related to extracellular matrix (ECM) organization among both upregulated and downregulated DEGs in the low-risk group (Figure 6B,C). Gene set variation analysis (GSVA) revealed that pathways such as DNA repair, interferon alpha response, oxidative phosphorylation and the p53 pathway had decreased activity in the low-risk group (Figure 6D).
Associations of the pathway-based signature with TIME
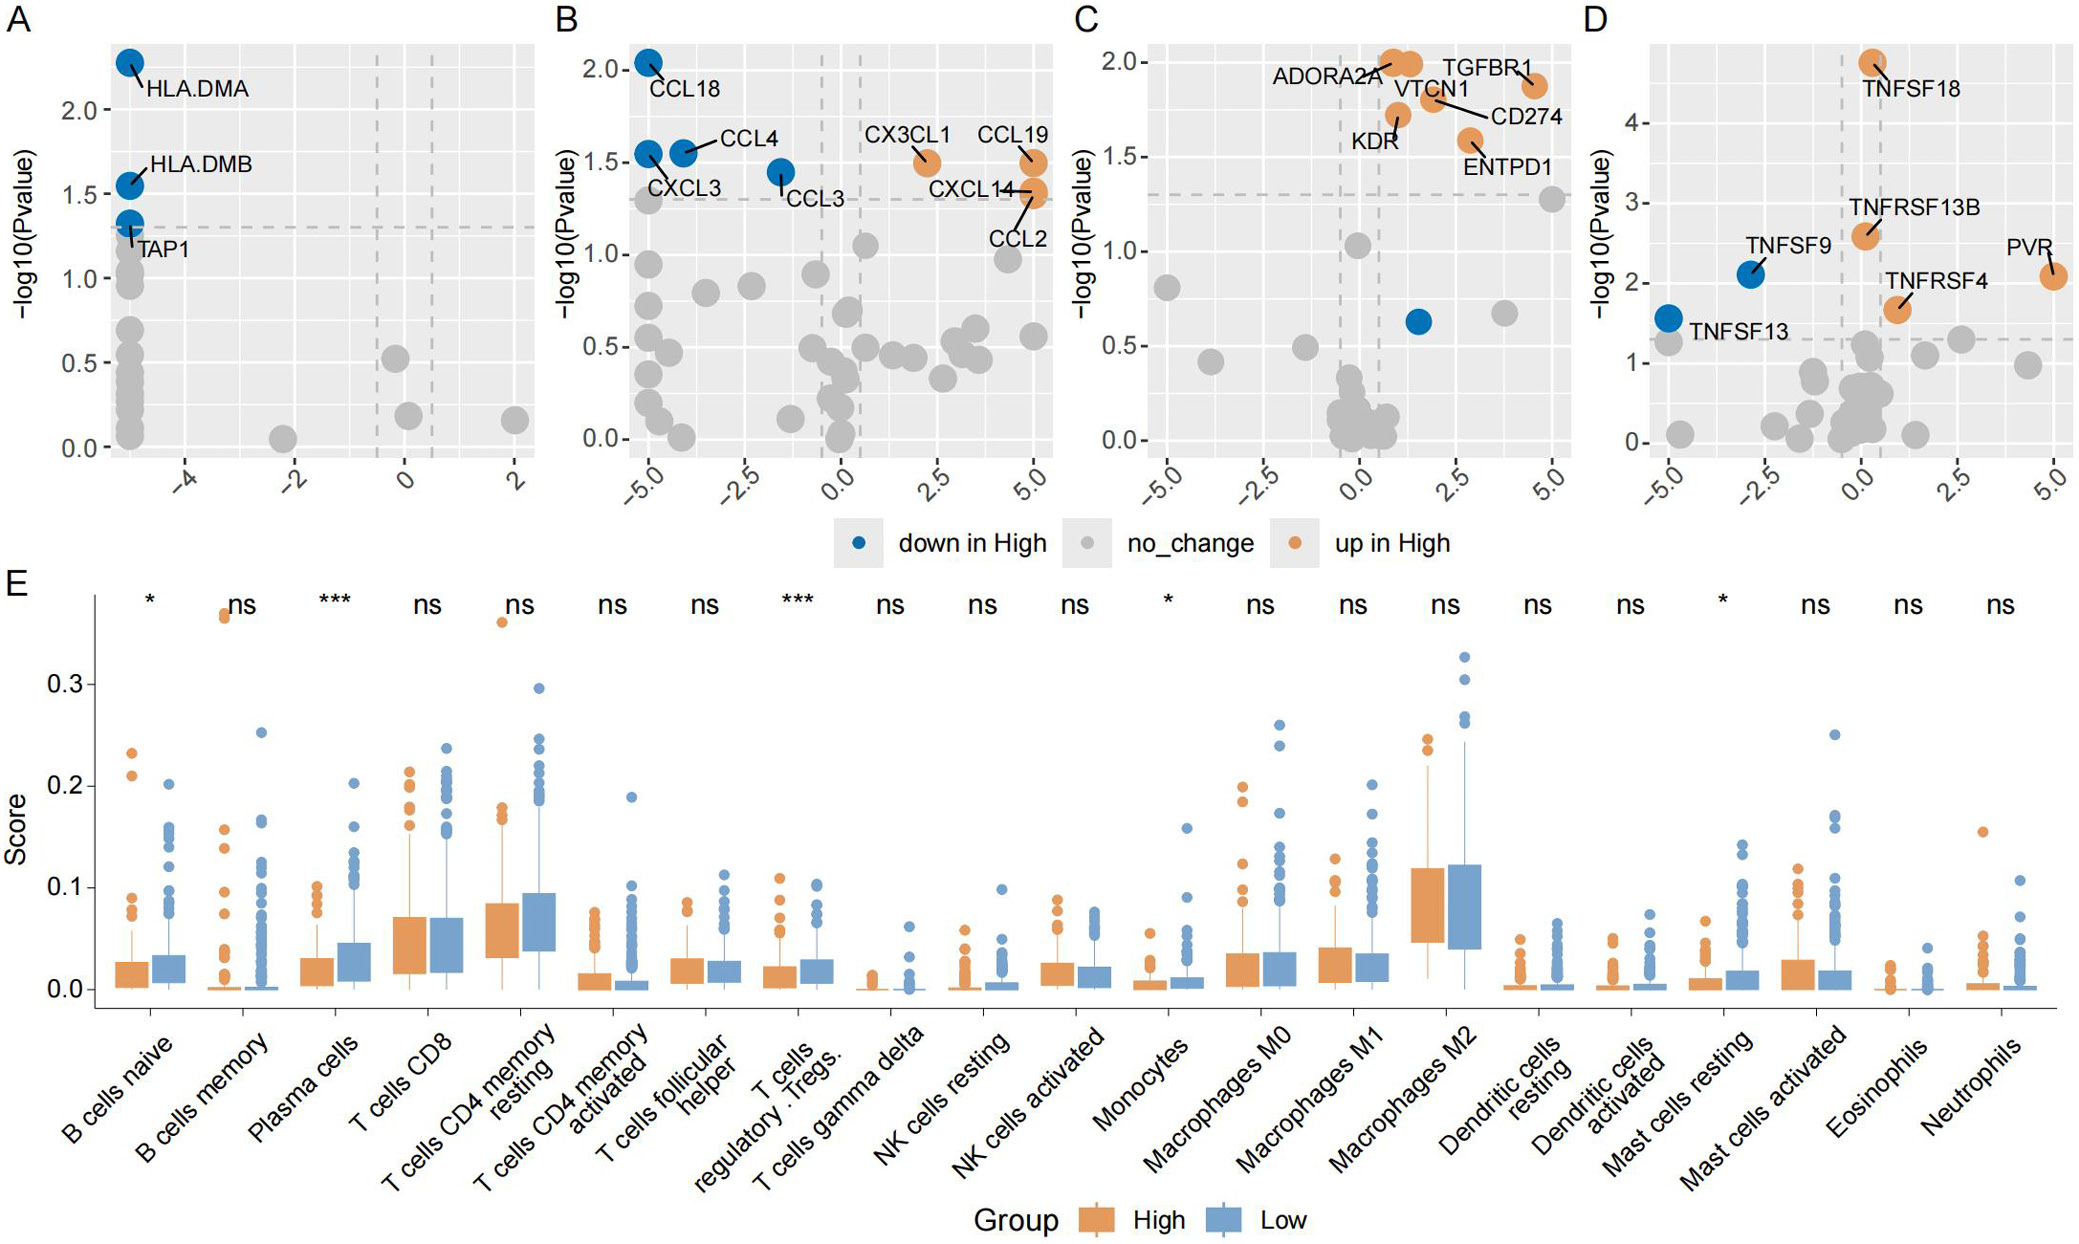
The role of the TIME in tumor growth and immunotherapy response was examined. The expression levels of class II HLA-related genes were significantly higher in the low-risk group (Figure 7A). Chemokines including CCL18, CXCL3, CCL3, and CCL4 exhibited higher expression in the low-risk group (Figure 7B). In contrast, the expression of immune checkpoint inhibitors, such as CD274, ENTPD1, VTCN1, and transforming growth factor beta receptor 1 (TGFBR1), was markedly lower in the low-risk group (Figure 7C). Additionally, the low-risk group showed increased expression of TNFRSF13 and TNFRSF9, which are co-stimulators of T cells (Figure 7D). Immune cell infiltration was then assessed, and as shown in Figure 7E, the low-risk group exhibited higher infiltration of naïve B cells and plasma cells. Furthermore, immuno-oncology signature analysis derived from the IOBR package revealed a significant increase in the infiltration abundance of B cells and natural killer (NK) cells in the low-risk group, along with a significant decrease in oxidative phosphorylation (Supplementary Fig. 3).
Discussion
Gastric cancer exhibits significant tumor heterogeneity due to diverse genetic alterations, making it essential to identify patients who are likely to benefit from immune checkpoint inhibitors and to tailor treatment plans for those who may not respond. In this study, we developed and validated a pathway-based risk score model derived from the PMAPscore to improve the precision of predicting immunotherapy outcomes in patients with GC. This approach effectively stratifies patients into high- and low-risk categories, identifying those with a higher likelihood of responding to immune checkpoint inhibitor therapy. Additionally, it serves as a robust prognostic indicator for patients with GC undergoing immunotherapy. Notably, the median OS was prolonged to nearly 14 months in patients with low-risk status. Importantly, our findings reveal that patients with GC with different PMAPscores display distinct TIME characteristics, with enhanced antitumor immune activity observed in the low-risk group.
Biomarker-guided immunotherapy holds great promise for the development of novel antitumor therapies by enriching responder populations through biomarker-based patient selection. Extensive research has been conducted to identify predictive markers of immune checkpoint inhibitor efficacy; however, existing biomarkers, including PD-L1 expression, TMB and MSI, have notable limitations. These limitations include inconsistent results, limited generalizability and low prevalence in certain cancers. For instance, PD-L1 expression has demonstrated limited predictive value in colorectal, esophageal, and gastric cancers.34, 35, 36, 37 Variability in exon sequencing platforms and a lack of consensus on cutoff points contribute to mixed findings regarding the prognostic value of tumor mutation burden.8, 38, 39 Additionally, high status of MSI is rare, occurring in only 0–5% of metastatic gastrointestinal cancers.40, 41 Recently, several genetic mutations and expression markers have emerged as potential biomarkers for GC immunotherapy, such as PTCH1 mutation and CHAF1A expression. Nevertheless, the limited scope of genetic alterations and the scarcity of high-quality mRNA data may restrict their true clinical utility.18, 21 Although the GIPS, a potential predictor of immune checkpoint inhibitor efficacy in gastrointestinal malignancies, is a genetic mutation signature involving 6 genes,19 our multivariate analysis demonstrated that the PMAPscore-based risk model outperformed these markers as an independent predictor of OS. Therefore, cancer-specific models are necessary for clinical application.
Biological pathways provide valuable insights into disease mechanisms, drug responses, tumor markers, and altered cellular processes.42, 43, 44, 45, 46 Risk models constructed using multiple pathways have demonstrated superior predictive capabilities. By integrating comprehensive networks for prognostic and efficacy prediction, these models enhance the reliability and stability of their outcomes. Higher PMAPscores suggest increased neoantigen generation, which may enhance T-cell recognition and improve immunotherapy efficacy. Previous studies have shown that pathway-based risk models effectively stratify patients with melanoma and non-small cell lung cancer into distinct groups with significantly different prognoses and responses to immunotherapy.27 However, these findings highlight the necessity of cancer-specific models for clinical application, as melanoma-specific models did not perform well in patients with non-small cell lung cancer. Consistent with our results, pathway-based models have demonstrated better predictive value for immunotherapy efficacy compared with tumor mutation burden. Additionally, multivariable Cox analyses in this study confirmed that the PMAPscore-based risk model is an independent predictor of both OS and PFS in patients with GC.
Limitations of the study
Despite the encouraging findings, several limitations must be acknowledged. First, the relatively small sample size across the included cohorts limits the statistical power and generalizability of the results; some observations may reflect trends rather than reaching statistical significance. Second, drug-related biases may have been introduced due to the heterogeneity of anti-PD-1 and PD-L1 antibodies used across the training and validation cohorts, which were sourced from different pharmaceutical manufacturers. Third, the construction of the PMAPscore-based risk model was constrained by the high dimensionality of variables relative to the sample size. As a result, not all candidate variables could be incorporated into the regularized Cox regression model. Instead, univariate Cox regression was applied to preselect variables, which may have led to the exclusion of features that exert effects only through interactions with other variables. Finally, although the PMAPscore demonstrated robust predictive performance across multiple cohorts, its clinical utility and predictive validity require further confirmation through large-scale prospective studies involving patients treated with a uniform immune checkpoint inhibitor regimen.
Conclusions
In summary, the PMAPscore-based risk model represents a promising biomarker for forecasting and predicting the therapeutic benefits of immune checkpoint inhibitors in patients with GC. This model provides a useful tool for optimizing treatment strategies by enabling the identification of potential immunotherapy responders, which we plan to evaluate in future prospective studies.
This study highlights the PMAPscore as a novel biomarker for GC patients receiving immunotherapy. The PMAPscore-based risk model efficiently stratifies patients into high- and low-risk groups by integrating multiple pathway alterations, providing reliable predictions of OS, PFS and DBC. Importantly, this approach identified low-risk patients with favorable clinical outcomes, characterized by distinct TIME features, including enhanced antitumor immune activity.
The PMAPscore demonstrates superior predictive power and is less influenced by confounding variables than conventional biomarkers, including PD-L1 expression, MSI and TMB. Beyond advancing our understanding of GC tumor biology, the PMAPscore paves the way for more individualized and effective immunotherapy strategies. This approach may support clinical decision-making and ultimately improve outcomes for patients with advanced GC. Moreover, it may improve cost-effectiveness by enabling a smaller and more personalized panel of genes involved in relevant pathways, based on the PMAPscore-based risk model. Such a panel could be readily translated into a practical, easy-to-use clinical assay to better identify patients with GC who are most likely to benefit from immunotherapy. Although these results highlight the PMAPscore’s potential as both a prognostic and predictive tool, further randomized clinical trials are required to validate its clinical utility.
Supplementary files
The supplementary materials are available at https://doi.org/10.5281/zenodo.15864040. The package contains the following files:
Supplementary Fig. 1. Flow chart of participant selection depiction.
Supplementary Fig. 2. Construction of the pathway-based risk model. 10-fold cross-validation for selection of tuning parameters in the LASSO regression (A) and LASSO coefficient profiles of the 11 candidate pathways.
Supplementary Fig. 3. Relationship between risk score and TIME in the TCGA GC cohort. Violin plot of B cell infiltration abundance (A), NK cell infiltration abundance (B), and oxidative phosphorylation signature score (C) derived from the IOBR package in high and low risk groups (Mann–Whitney U test for A, Student’s t-test for B and C).
Supplementary Table 1. Demographic distribution of the PUCH cohort (n = 39), MSK cohort (n = 19) and SMC cohort (n = 43).
Supplementary Table 2. Detailed regression coefficients for the LASSO model.
Supplementary Table 3. Detailed information on the c-index metric for risk score modeling in the PUCH and MSK cohorts based on OS.
Supplementary Table 4. Detailed information on PMAPscore distribution and risk score level for all cohorts.
Supplementary Table 5. Detailed information on DEGs between high- and low-risk groups.
Supplementary Table 6. Detailed information on the normality test and the homogeneity of variance test for DEGs in the TCGA cohort.
Supplementary Table 7. Detailed information on the proportional hazards assumption for Cox regression analysis.
Supplementary Table 8. Detailed information on the normality test and the homogeneity of variance test for the TMB score, CNV in the PUCH cohort, and the RS score in the MSK and SMC cohorts.
Supplementary Table 9. Detailed information on normality test and homogeneity of variance test for immune-related genes, signatures and gene sets in TCGA cohorts.
Data Availability Statement
The raw datasets supporting the findings of the current study are openly available in Zenodo at https://doi.org/10.5281/zenodo.15864029.
Consent for publication
Not applicable.
Use of AI and AI-assisted technologies
Not applicable.